Article

Impact of Heterogeneous Soil Conditions on the Life Cycle Assessment of a Multi-Storey Reinforced Concrete Structure

by
Robert Studziński
1,*,
Jacek Ścigałło
2,
Maria Ratajczak
1 and
Katarzyna Ciesielczyk
1
1
Faculty of Civil and Transport Engineering, Poznan University of Technology, 60-965 Poznań, Poland
2
Faculty of Architecture, Poznan University of Technology, 60-965 Poznań, Poland
*
Author to whom correspondence should be addressed.
Sustainability 2024, 16(16), 6771; https://doi.org/10.3390/su16166771
Submission received: 1 July 2024 / Revised: 1 August 2024 / Accepted: 6 August 2024 / Published: 7 August 2024
(This article belongs to the Section Sustainable Engineering and Science)

Abstract

:
This article discusses the design of reinforced concrete structures taking into account non-uniform soil conditions, as well as aspects of sustainable engineering. To achieve this, the soil-structure interaction was explicitly introduced into the numerical model of the investigated structure which meets serviceability and the ultimate limit state conditions defined in the relevant Eurocode standards. In the numerical experiment, non-uniform soil conditions, type of foundation (isolated footing, foundation plate), material parameters and size of the cross section of the elements (columns and beams) were analysed. The introduced heterogeneous soil profiles, determined by defining a parametrised, in terms of mechanical properties, spatial model of the layered soil, resulted in nonuniform settlement of the investigated structure. A global analysis of the three-dimensional reinforced concrete structure was carried out taking into account geometric nonlinearity with imperfections and material nonlinearity with creep. The displacement maps of the structure and the risk of collapse due to nonuniform settlement were established. Furthermore, an environmental so called life cycle assessment was performed for each variant analysed of the investigated structure. The innovative nature of the research is based on a joint approach to the problem of soil-structure interaction and the assessment of the carbon footprint of reinforced concrete buildings. This made it possible to determine how the varying soil conditions and different types of foundation affect the amount of material consumed and the carbon footprint associated with the production of reinforced concrete structures.

1. Introduction

Sustainable building engineering is a range of different measures aimed at reducing the negative impact of construction on the environment, for which the construction industry is increasingly criticized every year [1]. It applies to the whole building life cycle: from design through the entire construction process, operation to waste minimalism and recycling [2,3]. All investment stages are closely interrelated and interdependent. Focusing too much on only one stage may consequently lead to smaller effects for the other stages. Therefore, in the final assessment of the sustainability effects achieved, the sum total of all stages of the investment process is important [4]. Sustainable building practices are becoming increasingly important in addressing environmental challenges and promoting the longevity and efficiency of built environments. In this study, the authors focused on impact of soil conditions on the life cycle cost of a reinforced concrete construction.
One of the main components of concrete is cement, the global production of which is growing every year, which is highly energy-consumed and covers over 5% of CO2 emission worldwide, whereas the concrete industry accounts for nearly 10% of global energy related CO2 emissions [5,6,7]. Decarbonisation of concrete structures should become a priority due to the widespread availability and use of this material [8]. Most research studies focus on reducing the carbon footprint through alternative material solutions [9,10,11], and only few of them take into consideration the optimization of the structural design [12]. On the other hand, the environmental impact of the maintenance and repair of structural concrete is widely discussed [13]. Nowadays the holistic approach, considering all the stages of the building life cycle, is necessary to reduce the environmental burdens [14]. Since steel-reinforced concrete has been one of the most popular structural materials, LCA analyses for different structural systems have been performed to shed light on the influence of the design process and the adopted foundation structural solutions on the carbon footprint of building structures. In the literature various case study for different steel-concrete structures have been analysed. To optimize the design process by considering all relevant aspects, including structural calculations, environmental impact, and cost efficiency, various mathematical models and algorithms were tested [15,16,17,18,19,20,21,22]. This approach aimed to identify key factors and offer valuable guidelines for designers. However, it is still challenging to unify criteria and derive specific design recommendations [23,24]. Therefore, in the author’s opinion, any additional knowledge might lead a significant contribution in this research field.
The use of reinforced concrete beam-column multistorey frames in sustainable building design combines the strengths of traditional construction materials with innovative and eco-friendly practices [25,26]. By focusing on material efficiency, energy conservation, and waste reduction, these structures can significantly reduce their environmental impact while providing safe, durable, and adaptable spaces for a variety of uses. As the construction industry continues to evolve, integrating sustainability into every aspect of building design and construction will be crucial in achieving long-term ecological balance and resilience [27].
In the subject literature, much attention has been devoted to the soil-structure interaction (SSI). As the article is concerned with reinforced concrete structures, current research directions related to the interaction of reinforced concrete structures with the soil will be presented below.
The article [28] analyzed the impact of soil-structure interaction in a 12-story reinforced concrete building. The study analyzed two models that define the mechanical response of the soil, namely the Winkler and Vlasov models. The results of the Winkler and Vlasov models were compared to a rigid support model. The studies conducted demonstrated a significant impact of the properties of the soil on the amount of reinforcement. An article [29] evaluated the impact of SSI on two existing reinforced concrete buildings that are founded on shallow foundations. The presented analyses compare the results of the global structural analysis for scenarios in which classical nodal supports were assumed and scenarios in which ground settlement was taken into account. The impact of modelling the interaction with the ground was shown to be significant, varying at different stages of building construction. An interesting comparison of different concepts of modelling the soil-structure interaction is discussed in [30]. The authors analyzed low-, mid- and high-rise steel and reinforced concrete structures designed according to Eurocode standards. The interaction with the soil was modelled in three different ways: classic nodal supports (the cooperation with the soil is neglected), Winkler spring supports (the stiffness of the springs was determined based on soil parameters), and pile-deep foundation (in this case, both the piles and the ground were modelled using appropriate finite elements). In the study, based on the analysis of a total of 18 buildings (9 steel and 9 reinforced concrete), the authors concluded that for high-rise structures, accurate modelling of the interaction between the soil and the structure is necessary.
An important part of the research concerns exceptional situations such as an earthquake. The article [31] presents the correlation between SSI and the damage index (DI). The analyzed structure was subjected to three independent earthquake spectra loadings. The analyses revealed that the classical modelling of structures on rigid supports overestimates the dynamic response of the building, and thus underestimates the damage index (DI). In [32], the authors conducted an extensive literature review on SSI in the context of seismic loading of buildings. Due to the reference to the guidelines from seismic design standards, this work can be regarded as a practical guide to these standards. On the other hand, ref. [33] presents the results of 3D modelling aided by machine learning algorithms aimed at evaluating the accuracy in determining the fundamental period of RCC buildings with and without SSI effects.
Modern and, at the same time, responsible design of building structures should, in addition to meeting safety and serviceability [34,35] requirements and environmental influences on the structure, also comply with the principles of sustainability. The availability of increasingly sophisticated computer software makes it possible to carry out a full analysis of the structure, including geometrically non-linear analysis with interaction with the soil (geometric non-linearity) and using non-linear material models (physical non-linearity) [36,37,38]. The consideration of physical non-linearity plays a very important role especially in the analysis of reinforced concrete structures, for which the material model should take into account the effects of cracking and time, understood both as the moment of loading and its duration. The selection of the optimum solution from the entire set of possible and acceptable solutions, which additionally meets the principles of sustainability, causes additional difficulty in the entire design process [39].
In summary, the innovative nature of this research lies in its integrated approach to addressing the problem of soil-structure interaction and assessing the carbon footprint of reinforced concrete buildings.

2. Materials and Methods

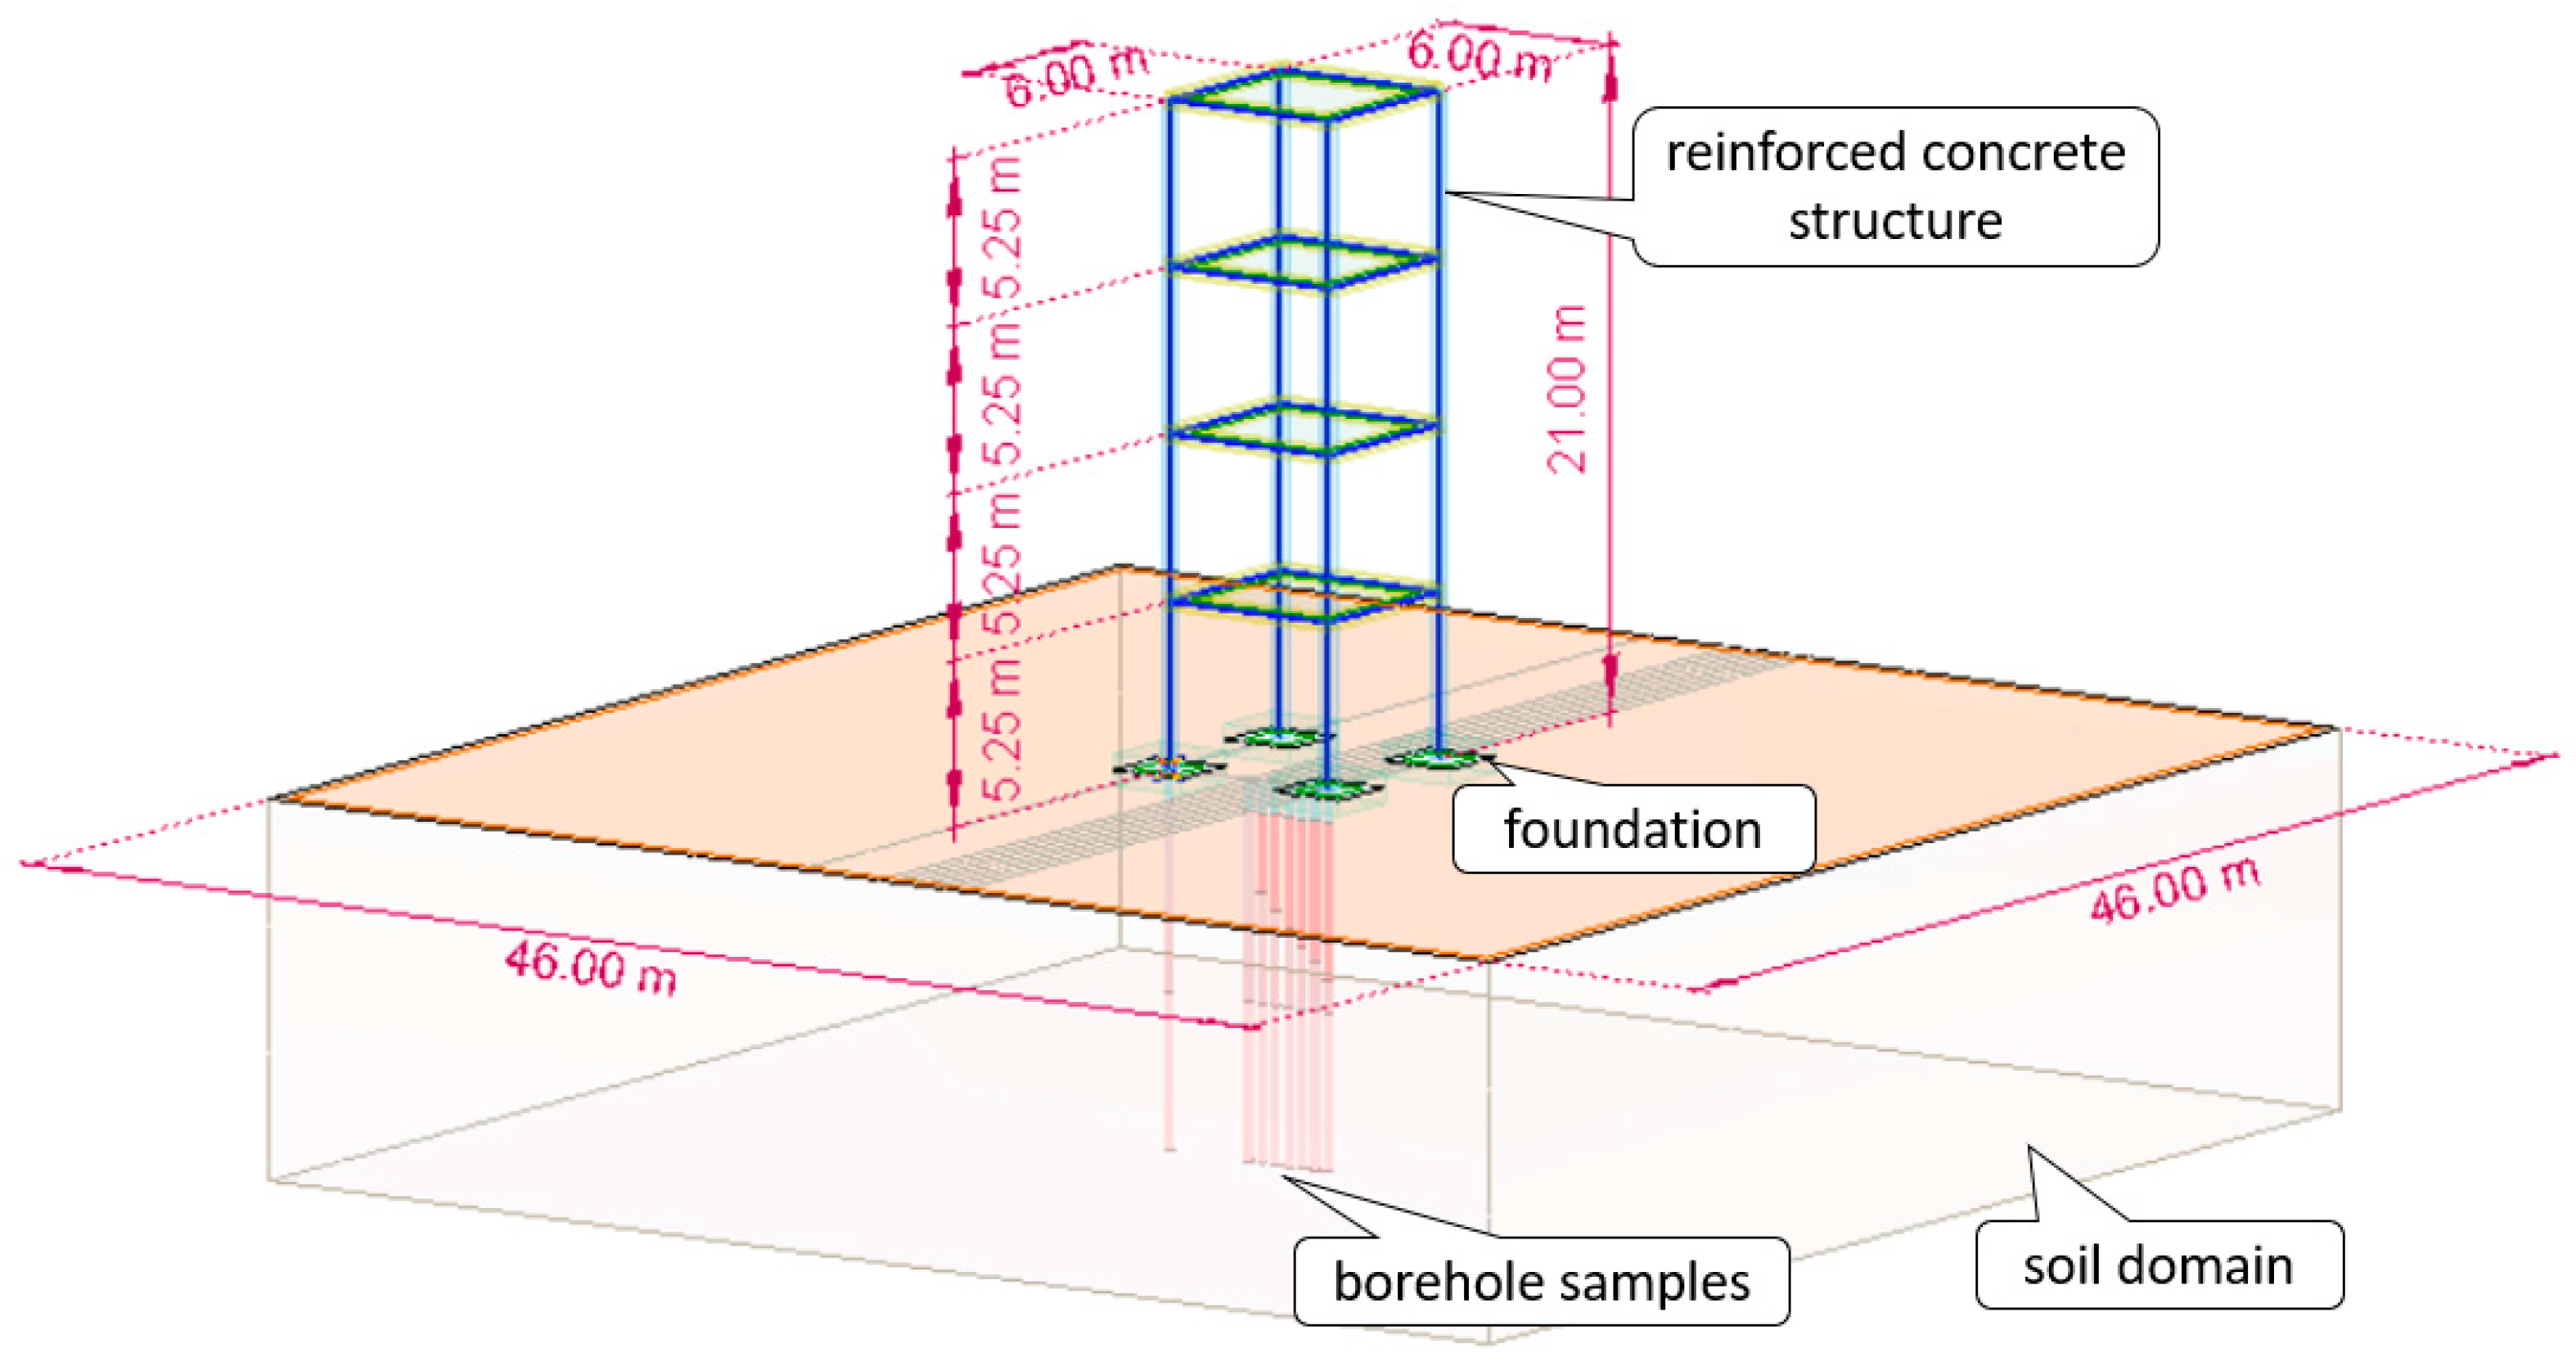
2.1. Task Parametrization

Task parameterization is the process of defining specific variables and parameters that will guide the execution of a task, ensuring that it is performed consistently and efficiently. It is essential as it provides a structured framework to ensure that tasks are completed and facilitates performance tracking and evaluation, as it sets clear benchmarks and metrics, to help access progress and identify areas for improvement.
The subject of the analysis was a four-storey reinforced concrete tower shown in Figure 1. The reinforced concrete tower was designed on a square plan with a side length of a = 6 m. The height of each floor is li = 5.25 m, which gives the total height of building H = 21.0 m. The influence of the following design parameters was considered in the selection of an optimal yet safe solution that meets the principles of sustainable development and safety principles:
  • the varying parameters of the soil interacting with the structure (parameter P1)
  • the class of structural concrete used (parameter P2),
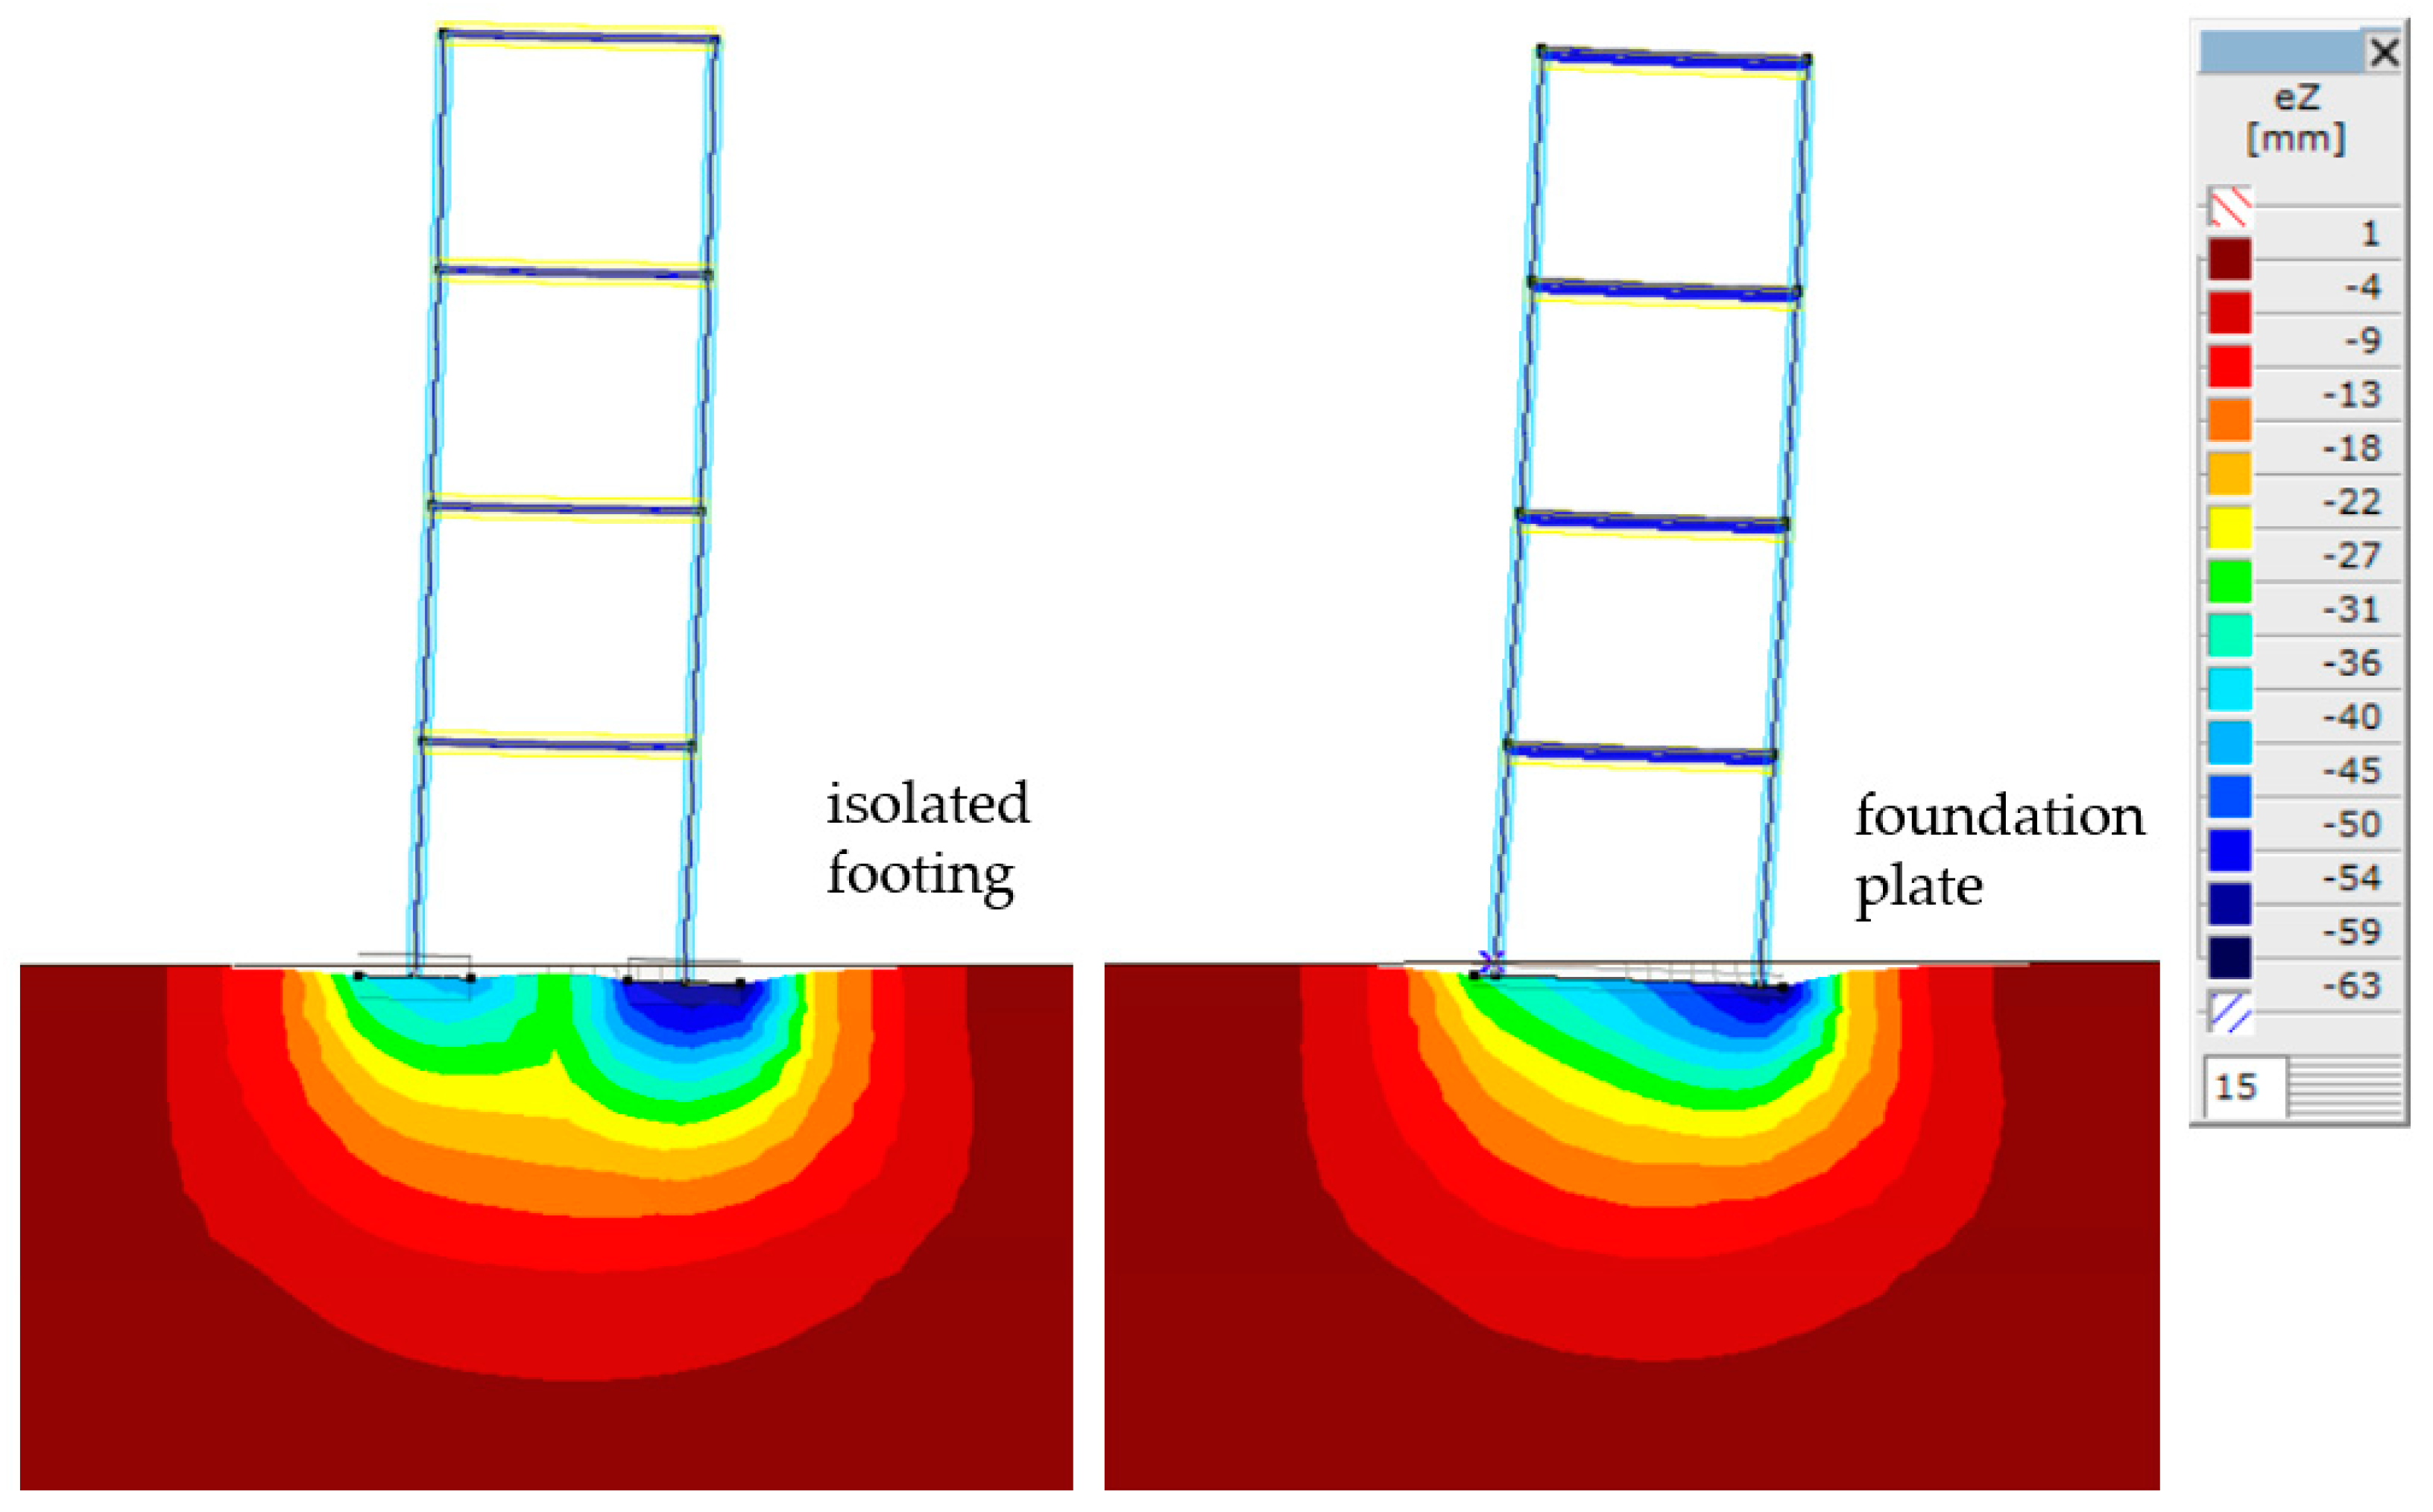
  • the type of the foundations and their size (parameter P3)—set of four isolated footings (P3a) or foundation plate (P3b),
  • the stiffness of the frame members (parameter P4),
These parameters are discussed in detail below.
The basic scope of the analysis was to assess the influence of ground conditions on the ultimate and serviceability limit states of the reinforced concrete tower taking into account limit states of soil layers. The criteria for limit states of reinforced concrete structure were taken from Eurocode 2 [40], while the failure criteria of soil layers were taken from Eurocode 7 [41] where geotechnical aspects of the design of buildings are presented. The analysed structure was subjected to both permanent and variable loads. The permanent load consists of the structure’s self-weight, the surface load of the weight of the floor finishing layers gk,s = 2.0 kN/m2, and line load (along beams) from the external walls gk,l = 2.63 kN/m. The variable load consist of live load (category C—congregation areas, see table A1.1 in Eurocode 0 [42]) qk = 5.0 kN/m2 and two climatic actions such as wind load (acc. Eurocode 1 part 1–4 [43]) and snow load (acc. Eurocode 1 part 1–3 [44]).
In all conducted analyses, the unfavourable effects of possible geometric deviations of the structure from the planned shape and changes in the position of the loads were taken into account by introducing bow and sway imperfections [40,45]. The sway imperfection was introduced explicitly into the model. According to the current standard [40], the introduction of geometric sway imperfection requires the determination of the basic value of the sway θ0, reduction factor for height of the building αh and reduction factor for the number of columns αm, see Equation (1)
θ 0 = 1 200 ;   α h = 2 l   ( 2 / 3 α h 1.0 ) ;   α m = 0.5 1 + 1 m ,
where: l is the length or height depending on whether it relates to the separated element (li = 5.25 m) or to the whole frame system (H = 21.0 m), m is the number of vertical elements influencing the effect under consideration for the isolated element (m = 1) and the frame system (m = 8). The sway imperfections for the entire frame system were taken into account in the global analyses as forced displacements of the frame system nodes resulting from the angle of inclination θi, see Equation (2)
θ i = θ 0 α h α m ,
The sway imperfection was introduced as a “sway of the structure” and its effect will be taken into account in the static results of all the analyses considered. Hence, at the stage of dimensioning the reinforcement and checking the resistance of the separated element, only the bow imperfection was taken into account as an additional eccentricity ei increasing the value of the static eccentricity obtained from the given analysis, see Equation (3)
e i = 0.5 θ i l
In Equation (3) standard [40] requires that instead of the length of the separated element l, its effective length (i.e., buckling length) l0 should be used. Since the sway imperfection was introduced in all global analyses, the length of the separated element l is assumed so as not to duplicate the effects of the system’s sway. The amount of reinforcement required for the rafter and column elements of the analysed frame system was calculated based on the values of internal forces determined from the analysis using the incremental approximation method. The utilisation level of the elements was 1.0 [46,47,48].

2.1.1. Soil Type—Parameter P1

In the task, three variants of the subsoil (S1, S2 and S3) were considered, with their cross-sections depicted in Figure 2. As shown in Figure 1, the foundation depth is 1.0 m, which is less than 3.0 m, indicating that it is a shallow foundation. Please note that the abbreviations of the soil layers are taken directly from the AxisVM database; however, detailed technical information on the soil layers is presented in Table 1. These are complete data that allow for verification of soil capacity according to Eurocode 7. In addition to the abbreviations from AxisVM, abbreviations (acronyms) have been introduced that comply with the Unified Soil Classification System (USCS) used in engineering and geology to describe the texture and grain size of the soil.
The analysed soil profiles S1, S2 and S3 represent different design situations relevant to the interaction between the structure and the subsoil:
  • S1 represents highly deformable, relatively uniform ground conditions under the whole of the analysed structure,
  • S2 represents uneven ground conditions with a split: moderately deformable for the left part and highly deformable for the right part of the frame system,
  • S3 represents uneven, more varied ground conditions with a split: low deformable for the left part of the system and highly deformable for the right side.
The investigated soil layers are presented in detail in Table 1. The following parameters are used to describe the soil layers: μ represents void ratio, ρ represents density, φ represents angle of internal friction, φcv represents critical state angle of shearing resistance, c represents cohesion, Es represents compression modulus, and ν represents Poisson’s ratio.
In order to reduce the number of load combinations, it was assumed that the right side of the system was founded on a more deformable soil having a significantly lower value of the elastic modulus compared to the left side of the system.

2.1.2. Reinforced Concrete Tower Parametrization

Reinforced concrete structure is parametrized by three parameters P2, P3 and P4. Three concrete classes (parameter P2) were investigated namely C25/30, C30/37 and C35/45. The concrete classes differ in their mechanical properties are presented in Table 2. The data presented in Table 2 (stiffness modulus E, Poisson ration ν, characteristic compressive strength fck and tensile strength ftk) are assumed according to EC2 standard [40].
The geometric parameterization of the tower structure included the size of the columns and beams cross-sections, and the dimensions of the isolated footings or, in the case of a reinforced concrete foundation plate, its thickness. The following square cross-sections of columns were investigated: CL1: 0.30 × 0.30 m, CL2: 0.35 × 0.35 m, and CL3: 0.40 × 0.40 m. Note that the above column cross-sections correspond to the following beam cross-sections: B1: 0.30 × 0.50 m, B2: 0.35 × 0.50 m, and B3: 0.40 × 0.50 m. Additionally three sizes of the isolated footings were investigated: F1: 1.5 × 1.5 × 0.6 m, F2: 2.0 × 2.0 × 0.6 m, and F3: 2.5 × 2.5 × 0.6 m and two thicknesses of foundation plate: P1: 0.5 m, and P2: 0.7 m.
Such a large number of variable design parameters resulted in a significant number of solutions to be analysed and the selection of the most optimal design. It is clear that all the design solutions analysed had to meet the ultimate and serviceability limit states of both the structure itself [49,50] and the interacting soil. Only such solutions could form the basis for the selection of the most optimal solution from the point of view of sustainability. All analysed cases are presented in Table 3.
The reference structure is reinforced concrete structure made of C35/45 concrete, columns 0.35 × 0.35 m and beams 0.35 × 0.50 m supported on four isolated footings of a size 2.0 × 2.0 × 0.6 m on soil type S1.

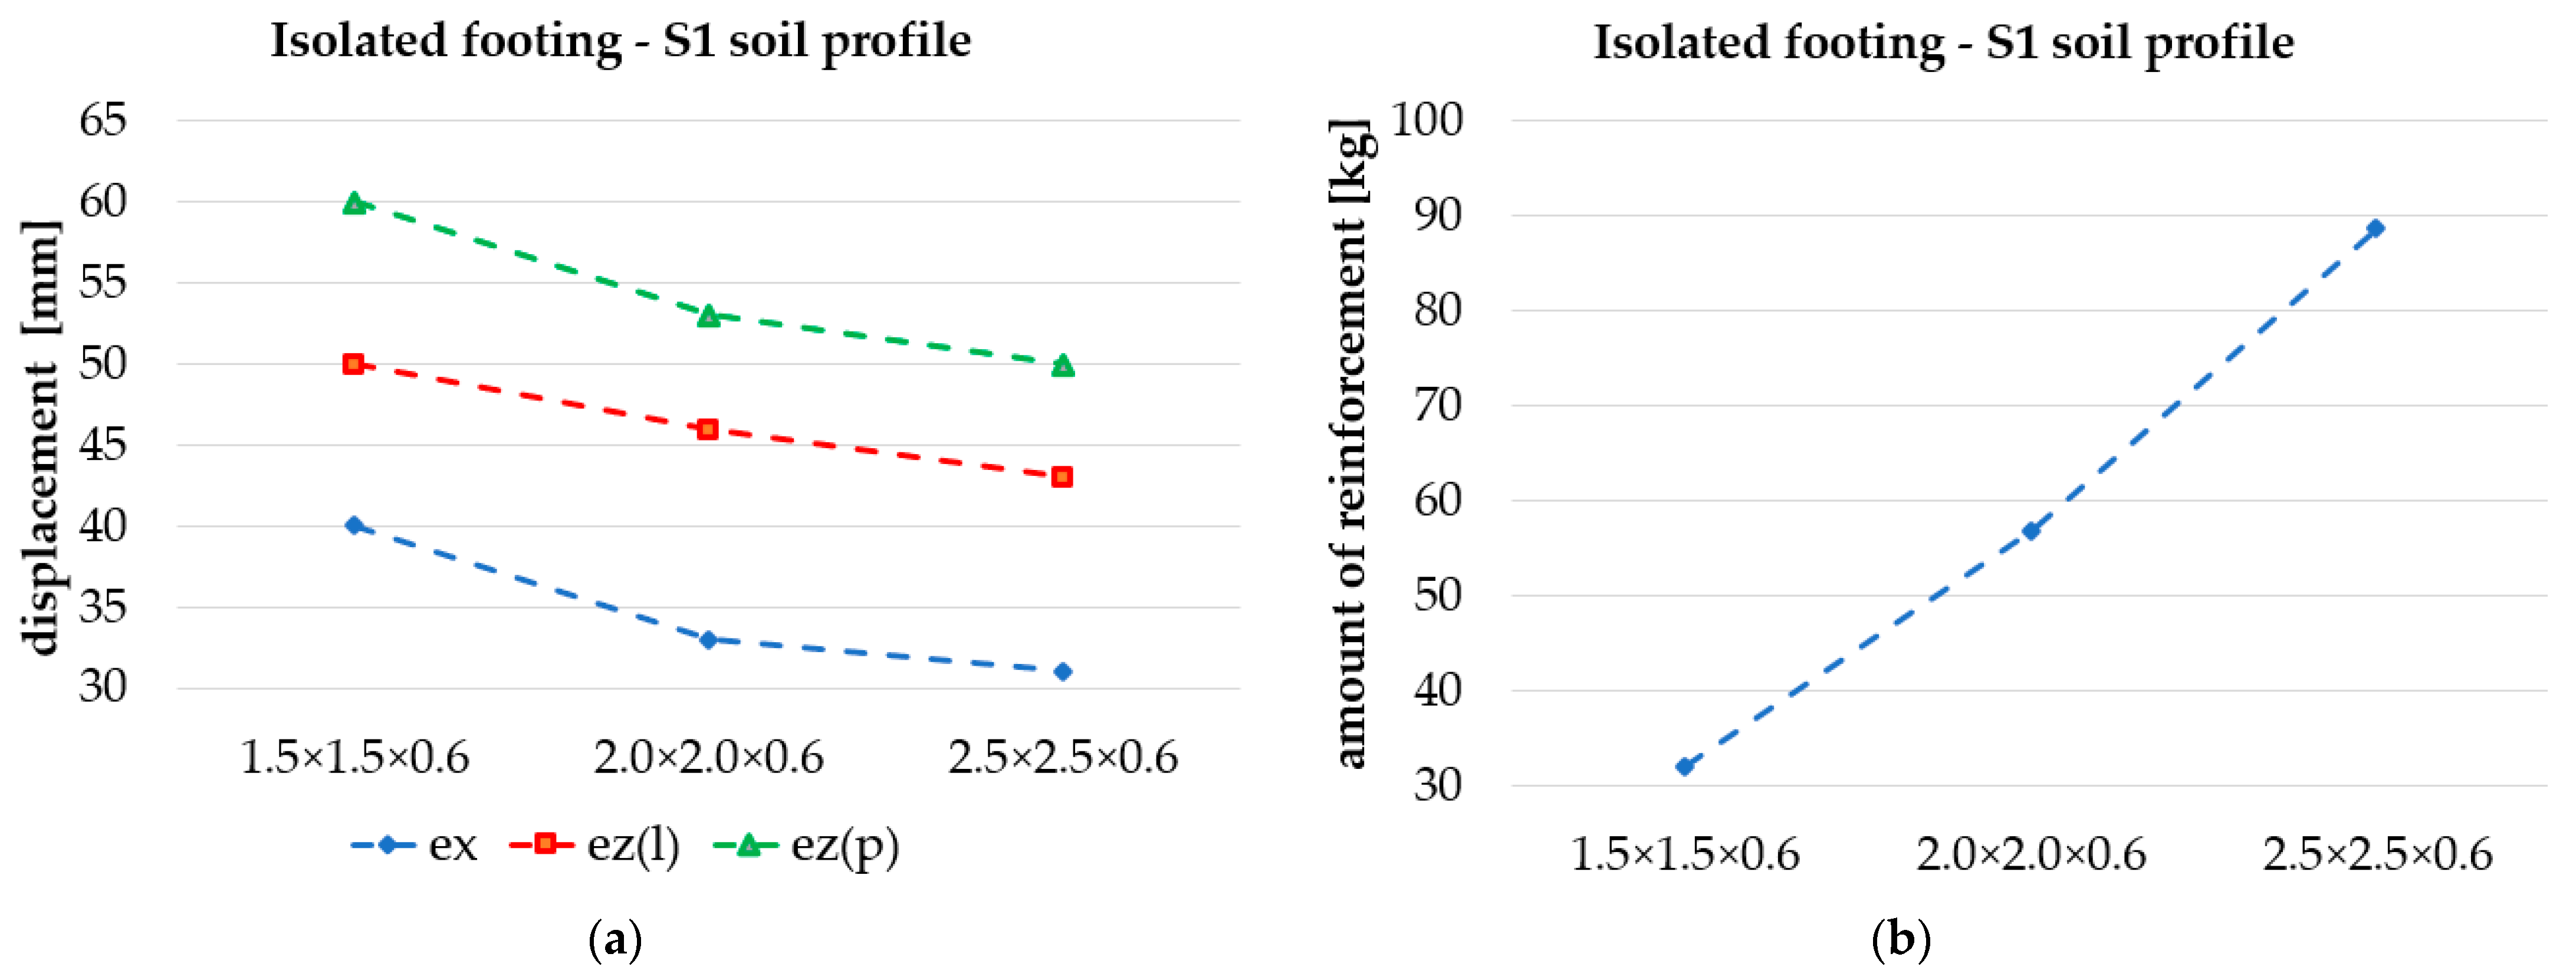
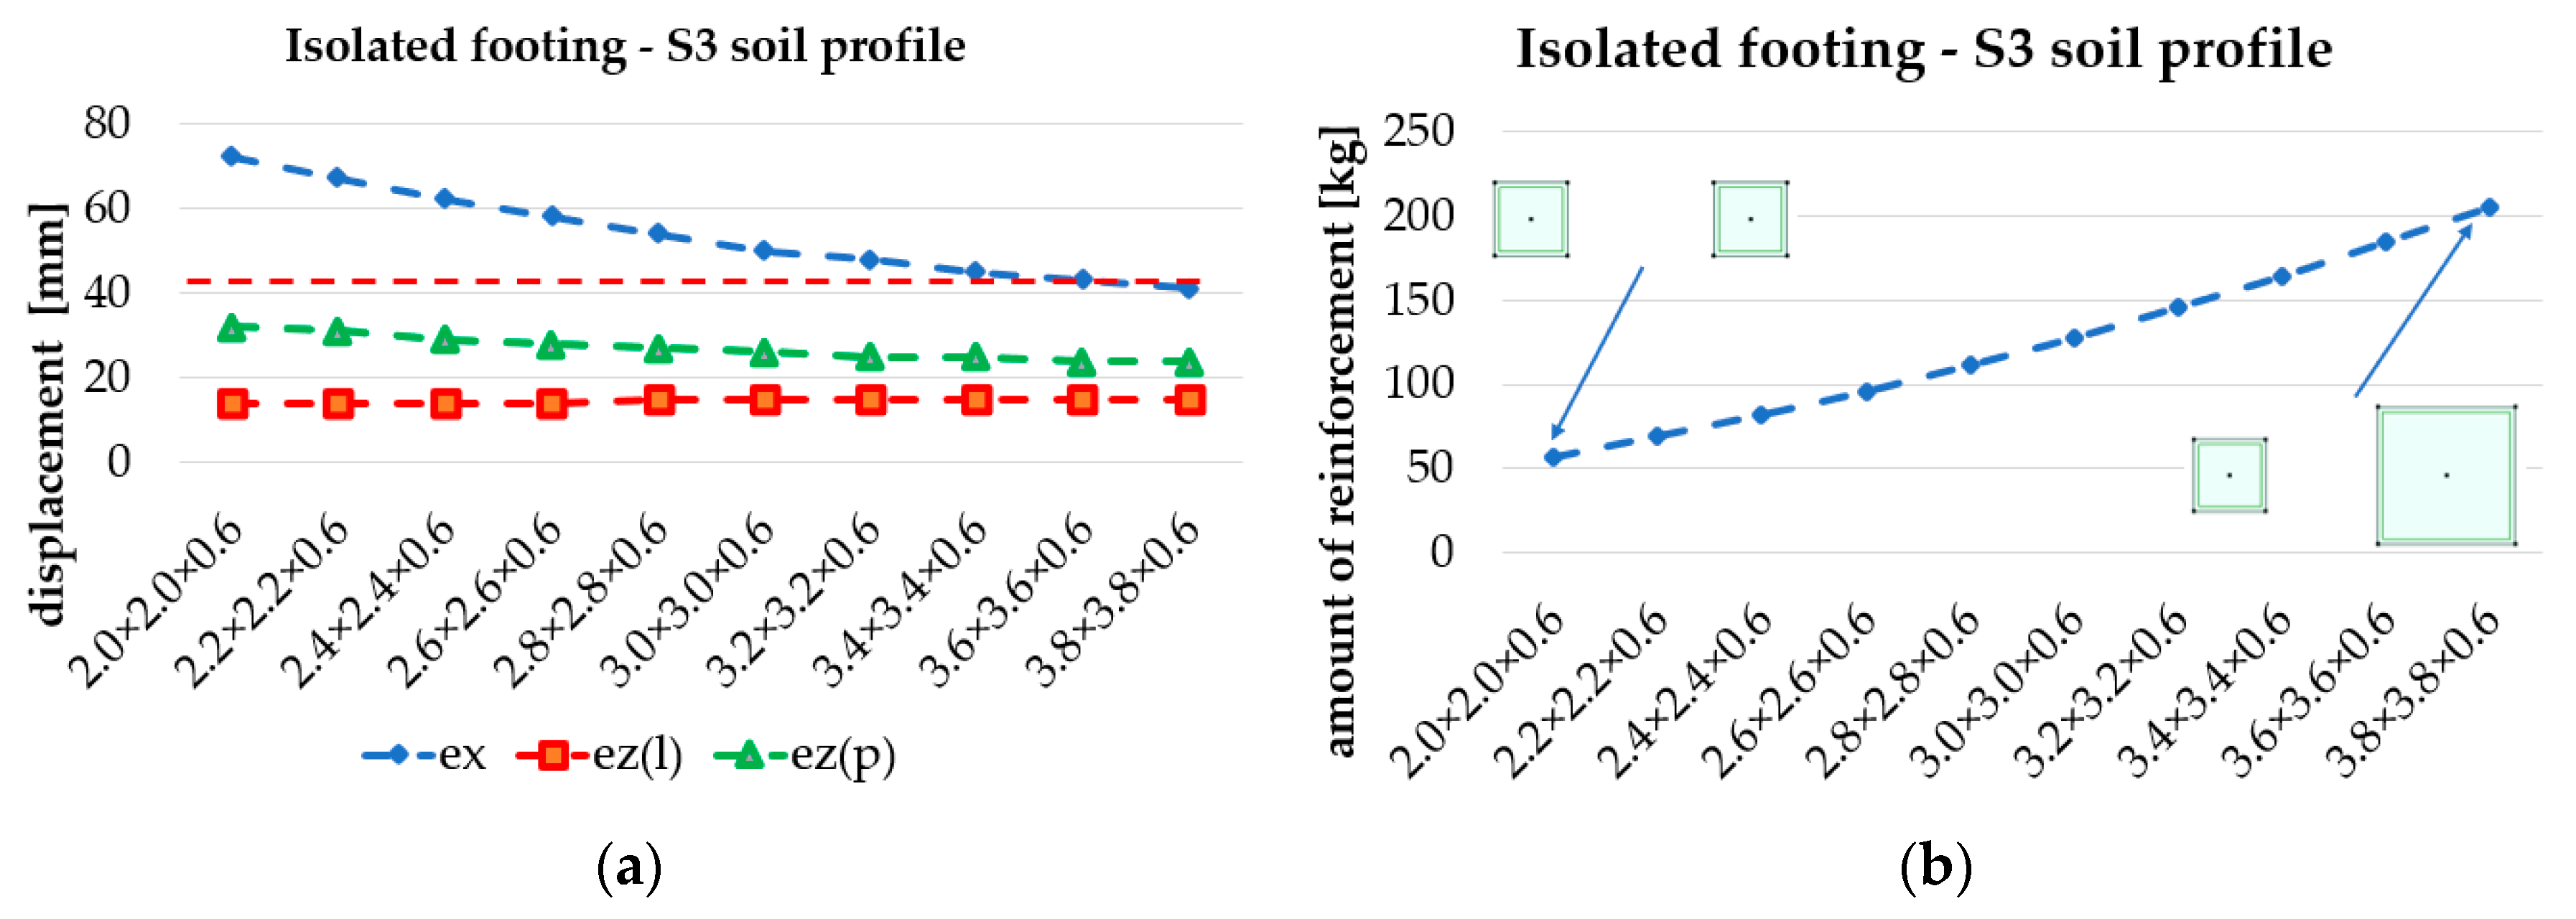
2.2. Numerical Model

Numerical experiments were conducted using the AxisVM engineering calculation programme [20]. The numerical model of the analysed reinforced concrete structure consisted of beam, shell, and solid elements. The columns were defined as two-node bar elements, each node having six degrees of freedom (6DoF elements). These 6DoF elements adhered to the Euler-Bernoulli beam assumptions. The beams were also modelled as 6DoF bar elements, but they conformed to the Timoshenko beam assumptions. A 0.5 m linear grid was applied to the linear elements, namely columns and beams. The floors and foundations were modelled as shell elements with a six-node triangular finite element mesh, each with a mesh size of 0.5 m. The subsoil was explicitly modelled using tetrahedral solid elements, creating a 3D mesh to represent the subsoil layers. The 3D subsoil domain has a depth of 12 m and covers an area of 46 m by 46 m; see Figure 1. Tetrahedral volume elements with a side length and height of 2 m were used.
The subsoil replaces the classically introduced boundary conditions and its properties are determined on the basis of the soil profile obtained through the introduction of geotechnical boreholes in accordance with the adopted variants of soil profiles (S1, S2 or S3). Module SOIL in AxisVM allows for that type of analysis. These models accommodate the diverse mechanical properties of soils, including cohesion, friction angle, and dilatancy, enabling accurate representation of soil behaviour under different loading conditions. It means that the stress distribution and deformation of soil can is followed. The SOIL module in AxisVM is an extension designed for incorporating soil-structure interaction (SSI) into structural analysis. SSI analysis helps in evaluating the effects of soil compliance on structural response, which can influence the design and safety of the structure. It allows to define various soil models and simulate the interaction between soil and structures, crucial for foundation design and even for seismic analysis. This module supports modelling different foundation types, assessing soil behaviour, and ensuring accurate load transfer from structures to the ground. The module supports the analysis of foundation settlement, bearing capacity, and the distribution of stress and strain within the soil. The example of the obtained settlements of the structure are depicted in Figure 3.

3. Results and Discussions

All design analyses have been carried out assuming 100% utilisation of the columns and beams i.e., (MEd/MRd ≅ 1.0) while satisfying the serviceability limit state of the building under consideration and the load-bearing capacity limit state of the soil layers. A limitation on the amount of horizontal displacement of the building equal to H/500 was adopted as the basic condition for the serviceability of the structure, giving an allowable amount of horizontal deflection flim = 42 mm. Geometrically non-linear analyses with imperfections and materially non-linear (cracking) analyses with creep (GMNiA+creep) were carried out.

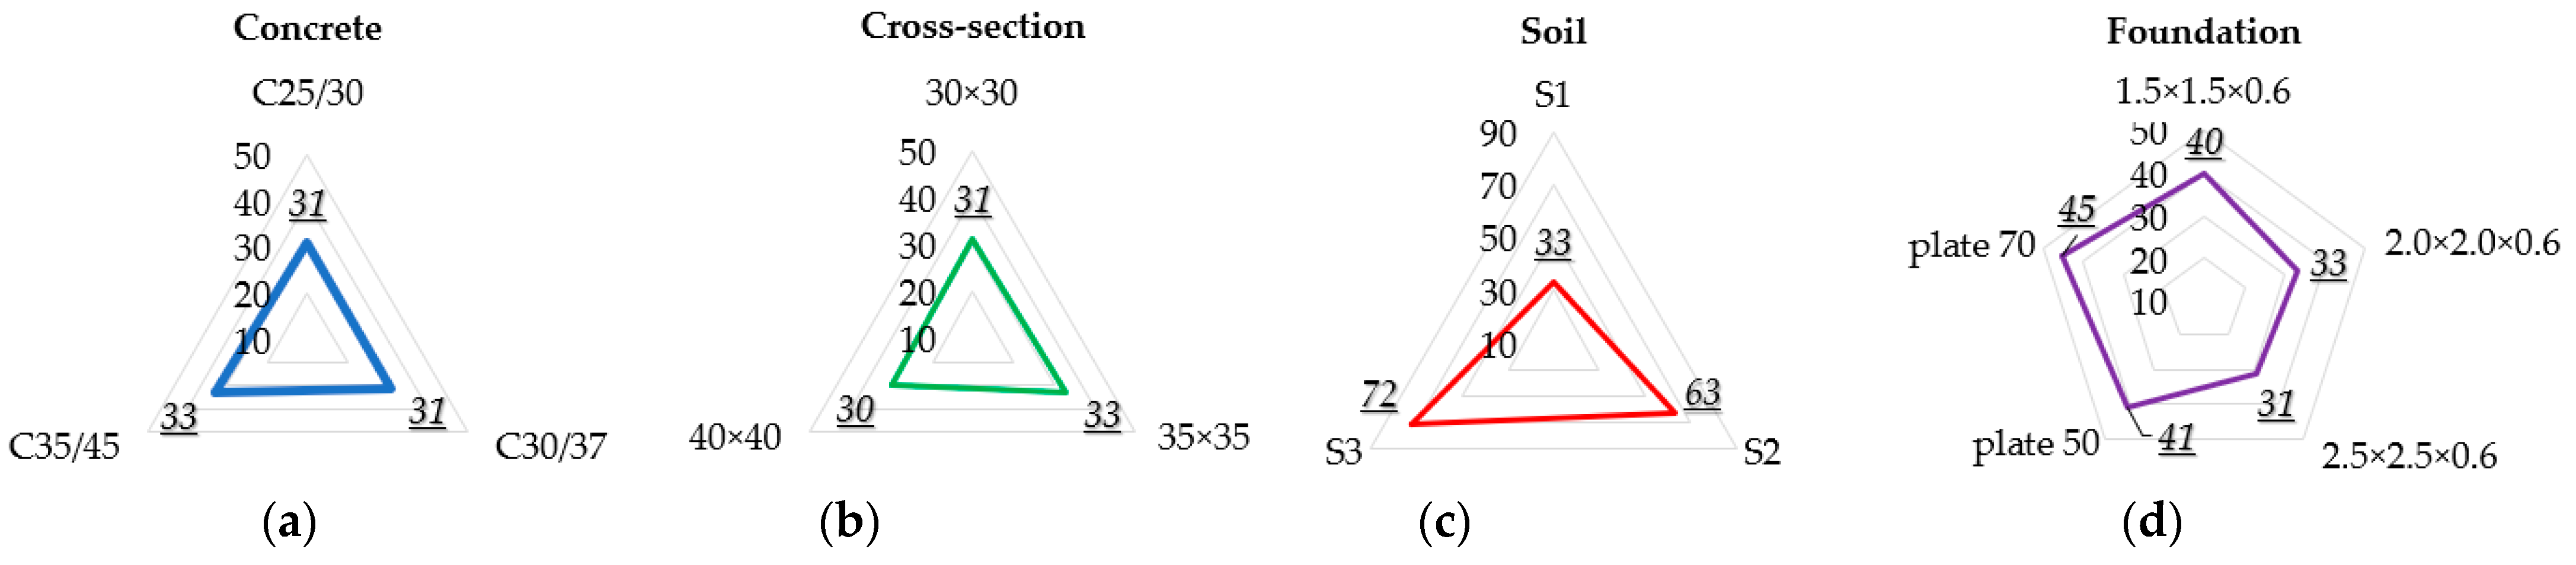
3.1. Structural Response for the Investigated Parameters

Figure 4 illustrates the impact of isolated footing size (parameter P3) on system displacements (Figure 4a) and reinforcement size (Figure 4b). The assessment of soil-structure interaction with respect to parameter P3 was performed with a constant concrete class (C35/45), fixed column cross-sections (0.35 × 0.35), fixed beam cross-sections (0.35 × 0.50), and an S1 soil profile. The sizes of all four footings were kept identical. All analysed scenarios meet the imposed load capacity and serviceability requirements. As expected, increasing the footing size reduces building displacement, which, however, necessitates greater material consumption (this aspect will be evaluated later in the article). It should be noted that the increase in the size of the footing reinforcement is directly proportional to the increase in its area. The dimensions of the tested foundations ranged from 1.5 × 1.5 m to 2.5 × 2.5 m, which gives a 2.7-fold increase in the material consumption of concrete and reinforcing steel. This increase in the dimensions of all foundations resulted in a reduction in horizontal displacement by 22.5% and, respectively, in vertical displacement by 16.5%. The use of variable foundation dimensions of 1.5 × 1.5/2.5 × 2.5 m reduced material consumption by 50% compared to the fixed dimensions of 2.5 × 2.5 m with a reduction in vertical displacements by 18.3% and a significant reduction in horizontal displacements (deflections).
For soil S3, the impact of asymmetric foundation sizing was assessed. On the right-hand side of the structure, where the soil parameters are considerably weaker, a change in footing size was proposed. Consequently, the set of analysed footing sizes in Table 3 has been extended in this study. The footings on the left-hand side measured 2.0 × 2.0 × 0.6, while the size of the footings on the right-hand side was incrementally increased by 0.2 m until the structure met the limit displacement condition (flim = 42 mm—orange dotted line). Quantitatively, this effect is shown in Figure 5a, indicating that only when the footings on the right side reach a size of 3.8 × 3.8 × 0.6 can the displacement criterion be met. It is also noteworthy that the vertical displacement on both the left side (ez(l)) and the right side (ez(p)) does not change significantly as the size of the right side footings increases. Additionally, Figure 5b illustrates the amount of reinforcement used for the foundation. For the initial dimension of the foundation of 2.0 × 2.0 m, which resulted from the condition of meeting the requirements of the ultimate limit state, the value of the horizontal displacement was 72 mm and was exceeded by 41.5% in relation to the adopted limit value. Meeting the serviceability limit state requirement required an increase in the dimensions of the foundations to 3.8 × 3.8 × 0.60 m, resulting in a 3.6-fold increase in material costs in relation to a single foundation and almost 2-fold in relation to all foundation footings.
Figure 6a,b show the changes in horizontal and vertical displacements of a building founded on different soils (parameter P1) with footings and foundation slabs, respectively, (parameter P3). For the adopted soil parameters, the vertical displacements of the foundations are inversely proportional to the horizontal displacements (deflections). This is due to the difference in vertical displacements of foundations resting on layers of different deformability. The maximum vertical displacement occurred for the S1 profile and amounted to 53 mm, for which the horizontal displacement was 33 mm. The S3 profile had the lowest vertical displacement of 33 mm, which corresponded to the largest deflection of 72 mm. Such a relationship results from the difference in vertical displacements of the columns in the direction of the expected deflections. Comparative analyses were carried out for the foundation of two different thicknesses: 50 and 70 cm. For the 50 cm thick slab, the maximum displacements were: vertical 63 mm and horizontal 55 mm. For a 70 cm thick slab, 70 and 45 mm, respectively.
Figure 7 graphically presents the horizontal displacements of the structure accounting for various parameters: P2—concrete (Figure 7a), P4—cross sections of columns and beams (Figure 7b), P1—soil (Figure 7c), and P3—foundation (Figure 7d). It can be observed that the horizontal displacement of the investigated structure is not sensitive to changes in both concrete class and cross-section size. Nevertheless, the soil profile (its stiffness and heterogeneity) and the type and size of the foundation significantly influence the horizontal displacements of the investigated reinforced concrete tower. On the other hand, the amount of required reinforcement of columns and transoms of the system depend quite significantly on both the class of concrete used and the dimensions of the cross-sections of the system elements. The quantitative analysis is presented for the constant parameters P1 (profile S1) and P3 (dimension 2.0 × 2.0 × 0.60 m). For first floor columns, the change of the concrete class from C25/30 to C35/45 resulted in a reduction of reinforcement by 45%, while the change of the column cross-section from 30 × 30 cm to 40 × 40 cm reduced the amount of required reinforcement by 74%. A smaller, but noticeable impact on the amount of required reinforcement was also had by the type of soil profile (parameter P1) and the dimension of the foundation (parameter P3). The analysis was carried out for the constant parameters P2 (concrete C35/45) and P4 (mullions 30 × 30 cm and transoms 30 × 40 cm). The change of the soil profile from S1 to S2 reduced the reinforcement of the columns of the first storey by 26.5%, while the change of the foundation dimension from 1.5 × 1.5 × 0.6 m to 2.5 × 2.5 × 0.6 m allows for a reduction in the amount of reinforcement by 21%.

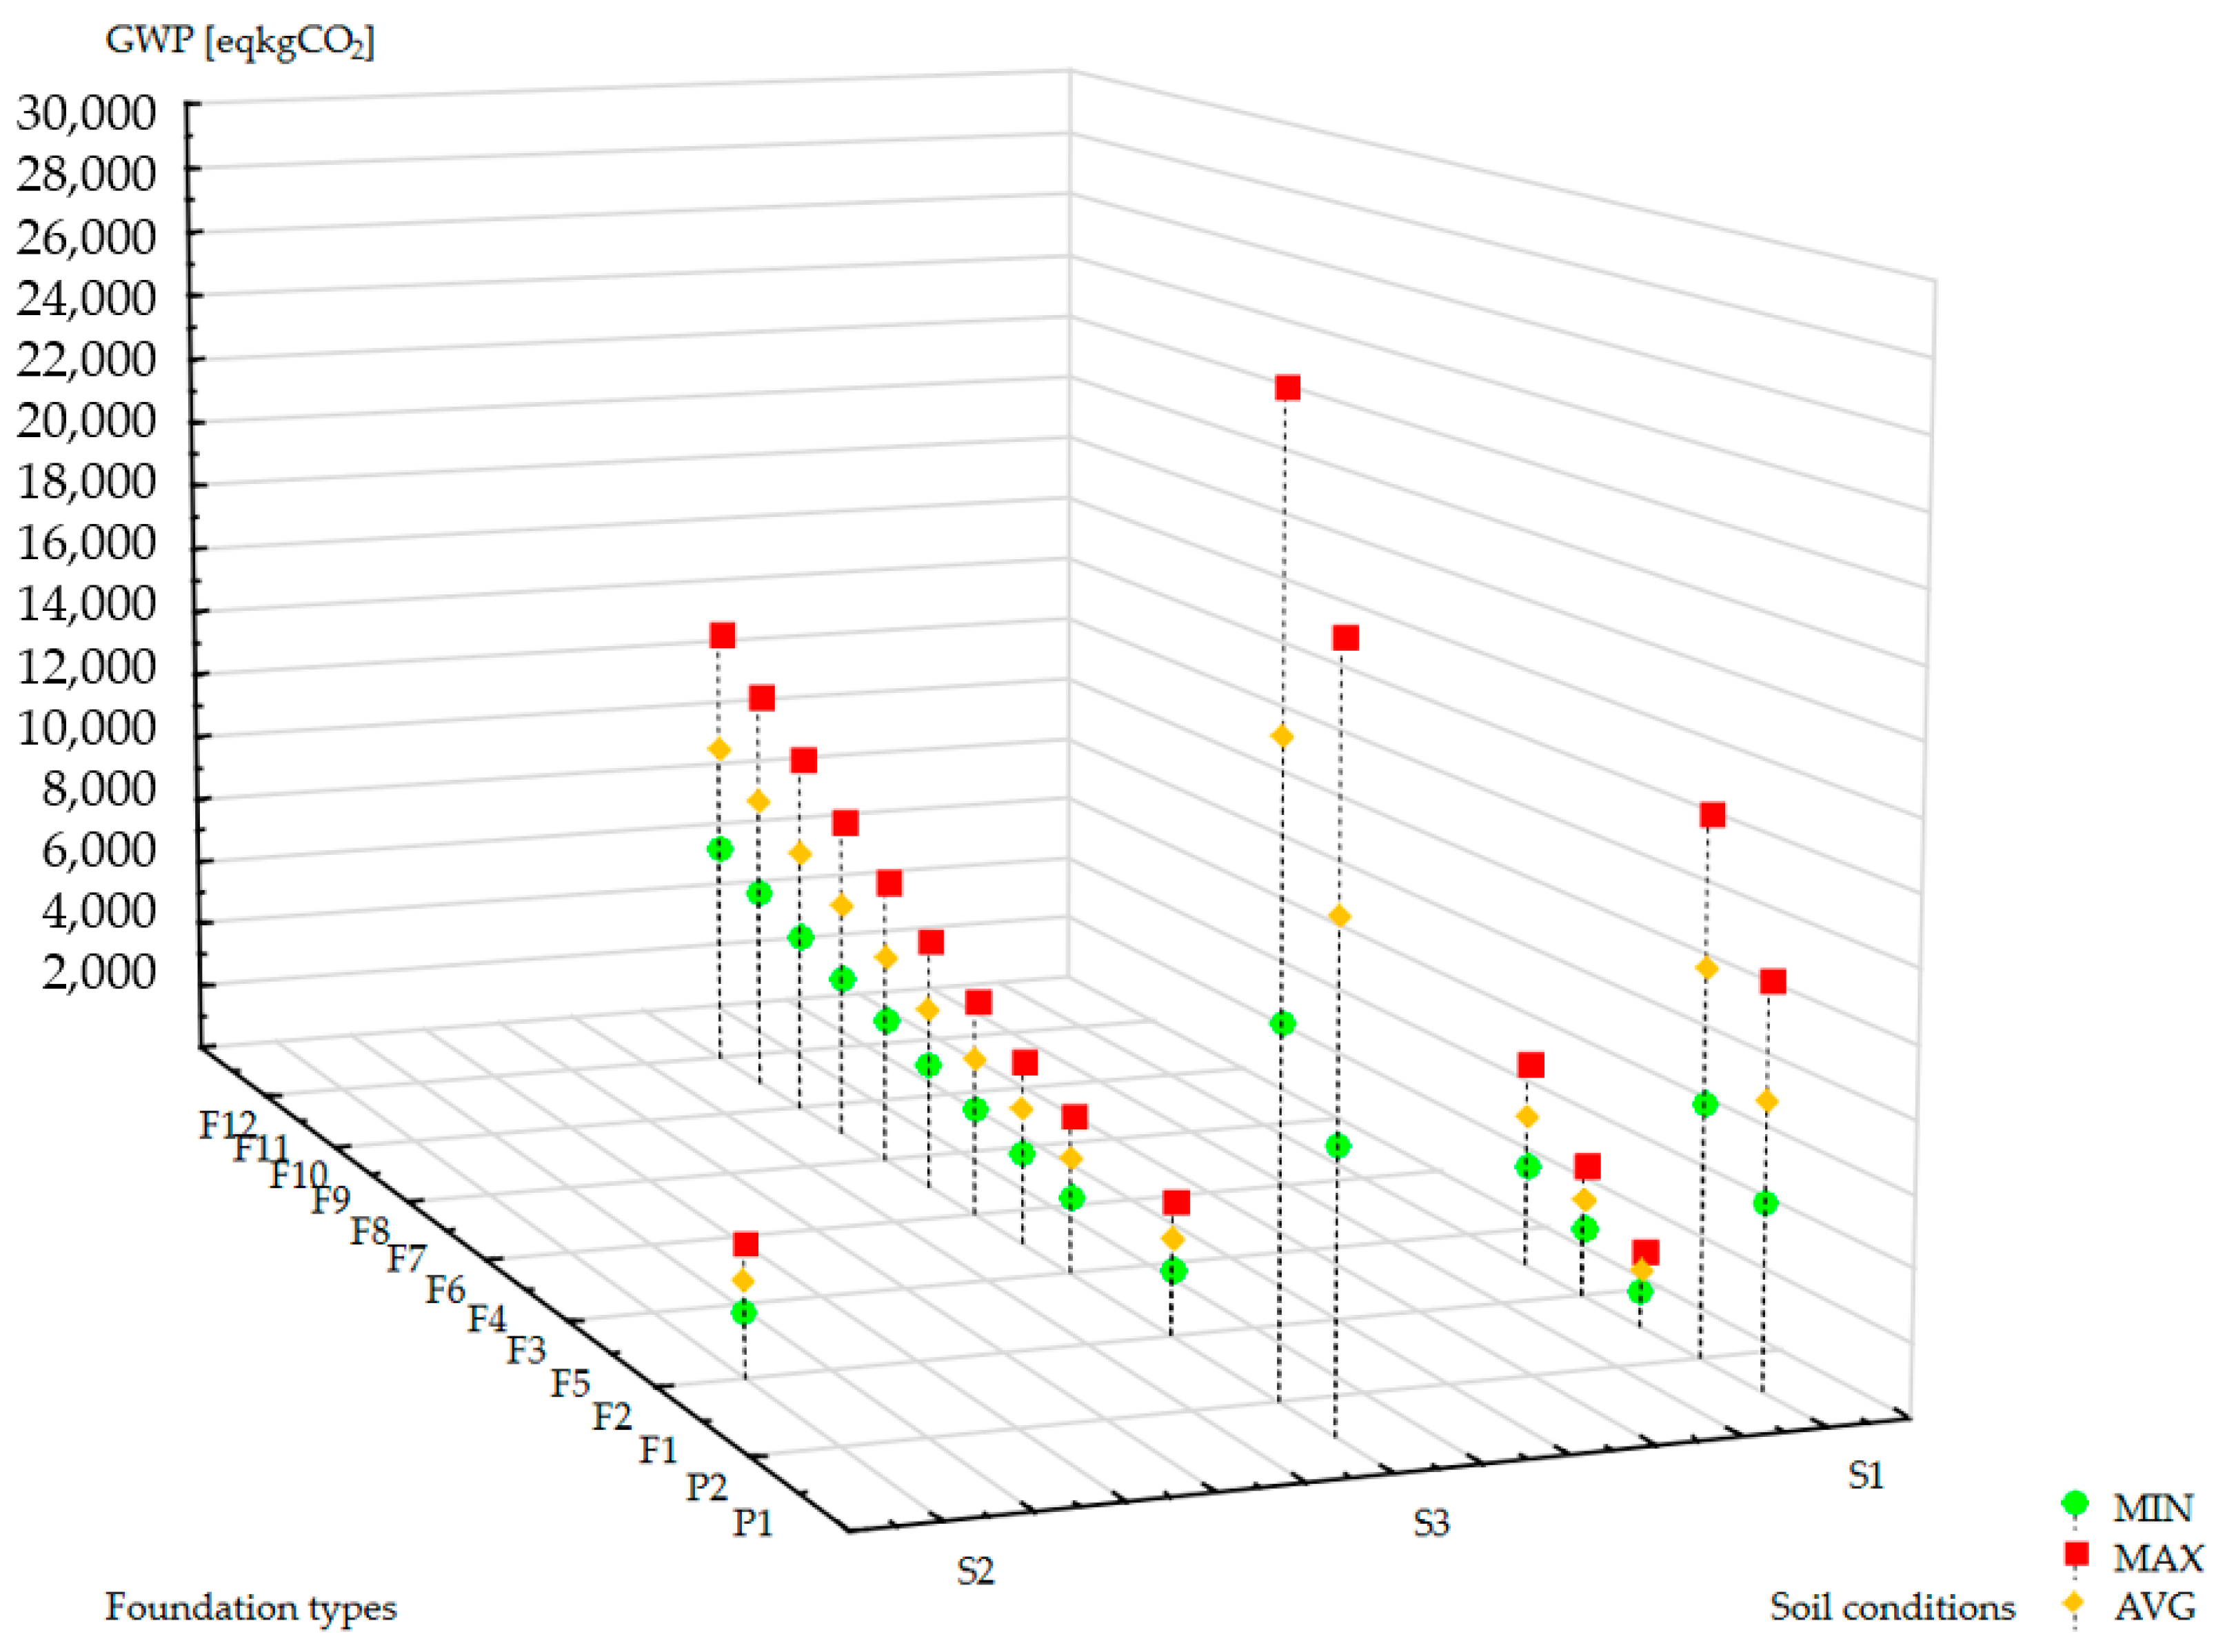
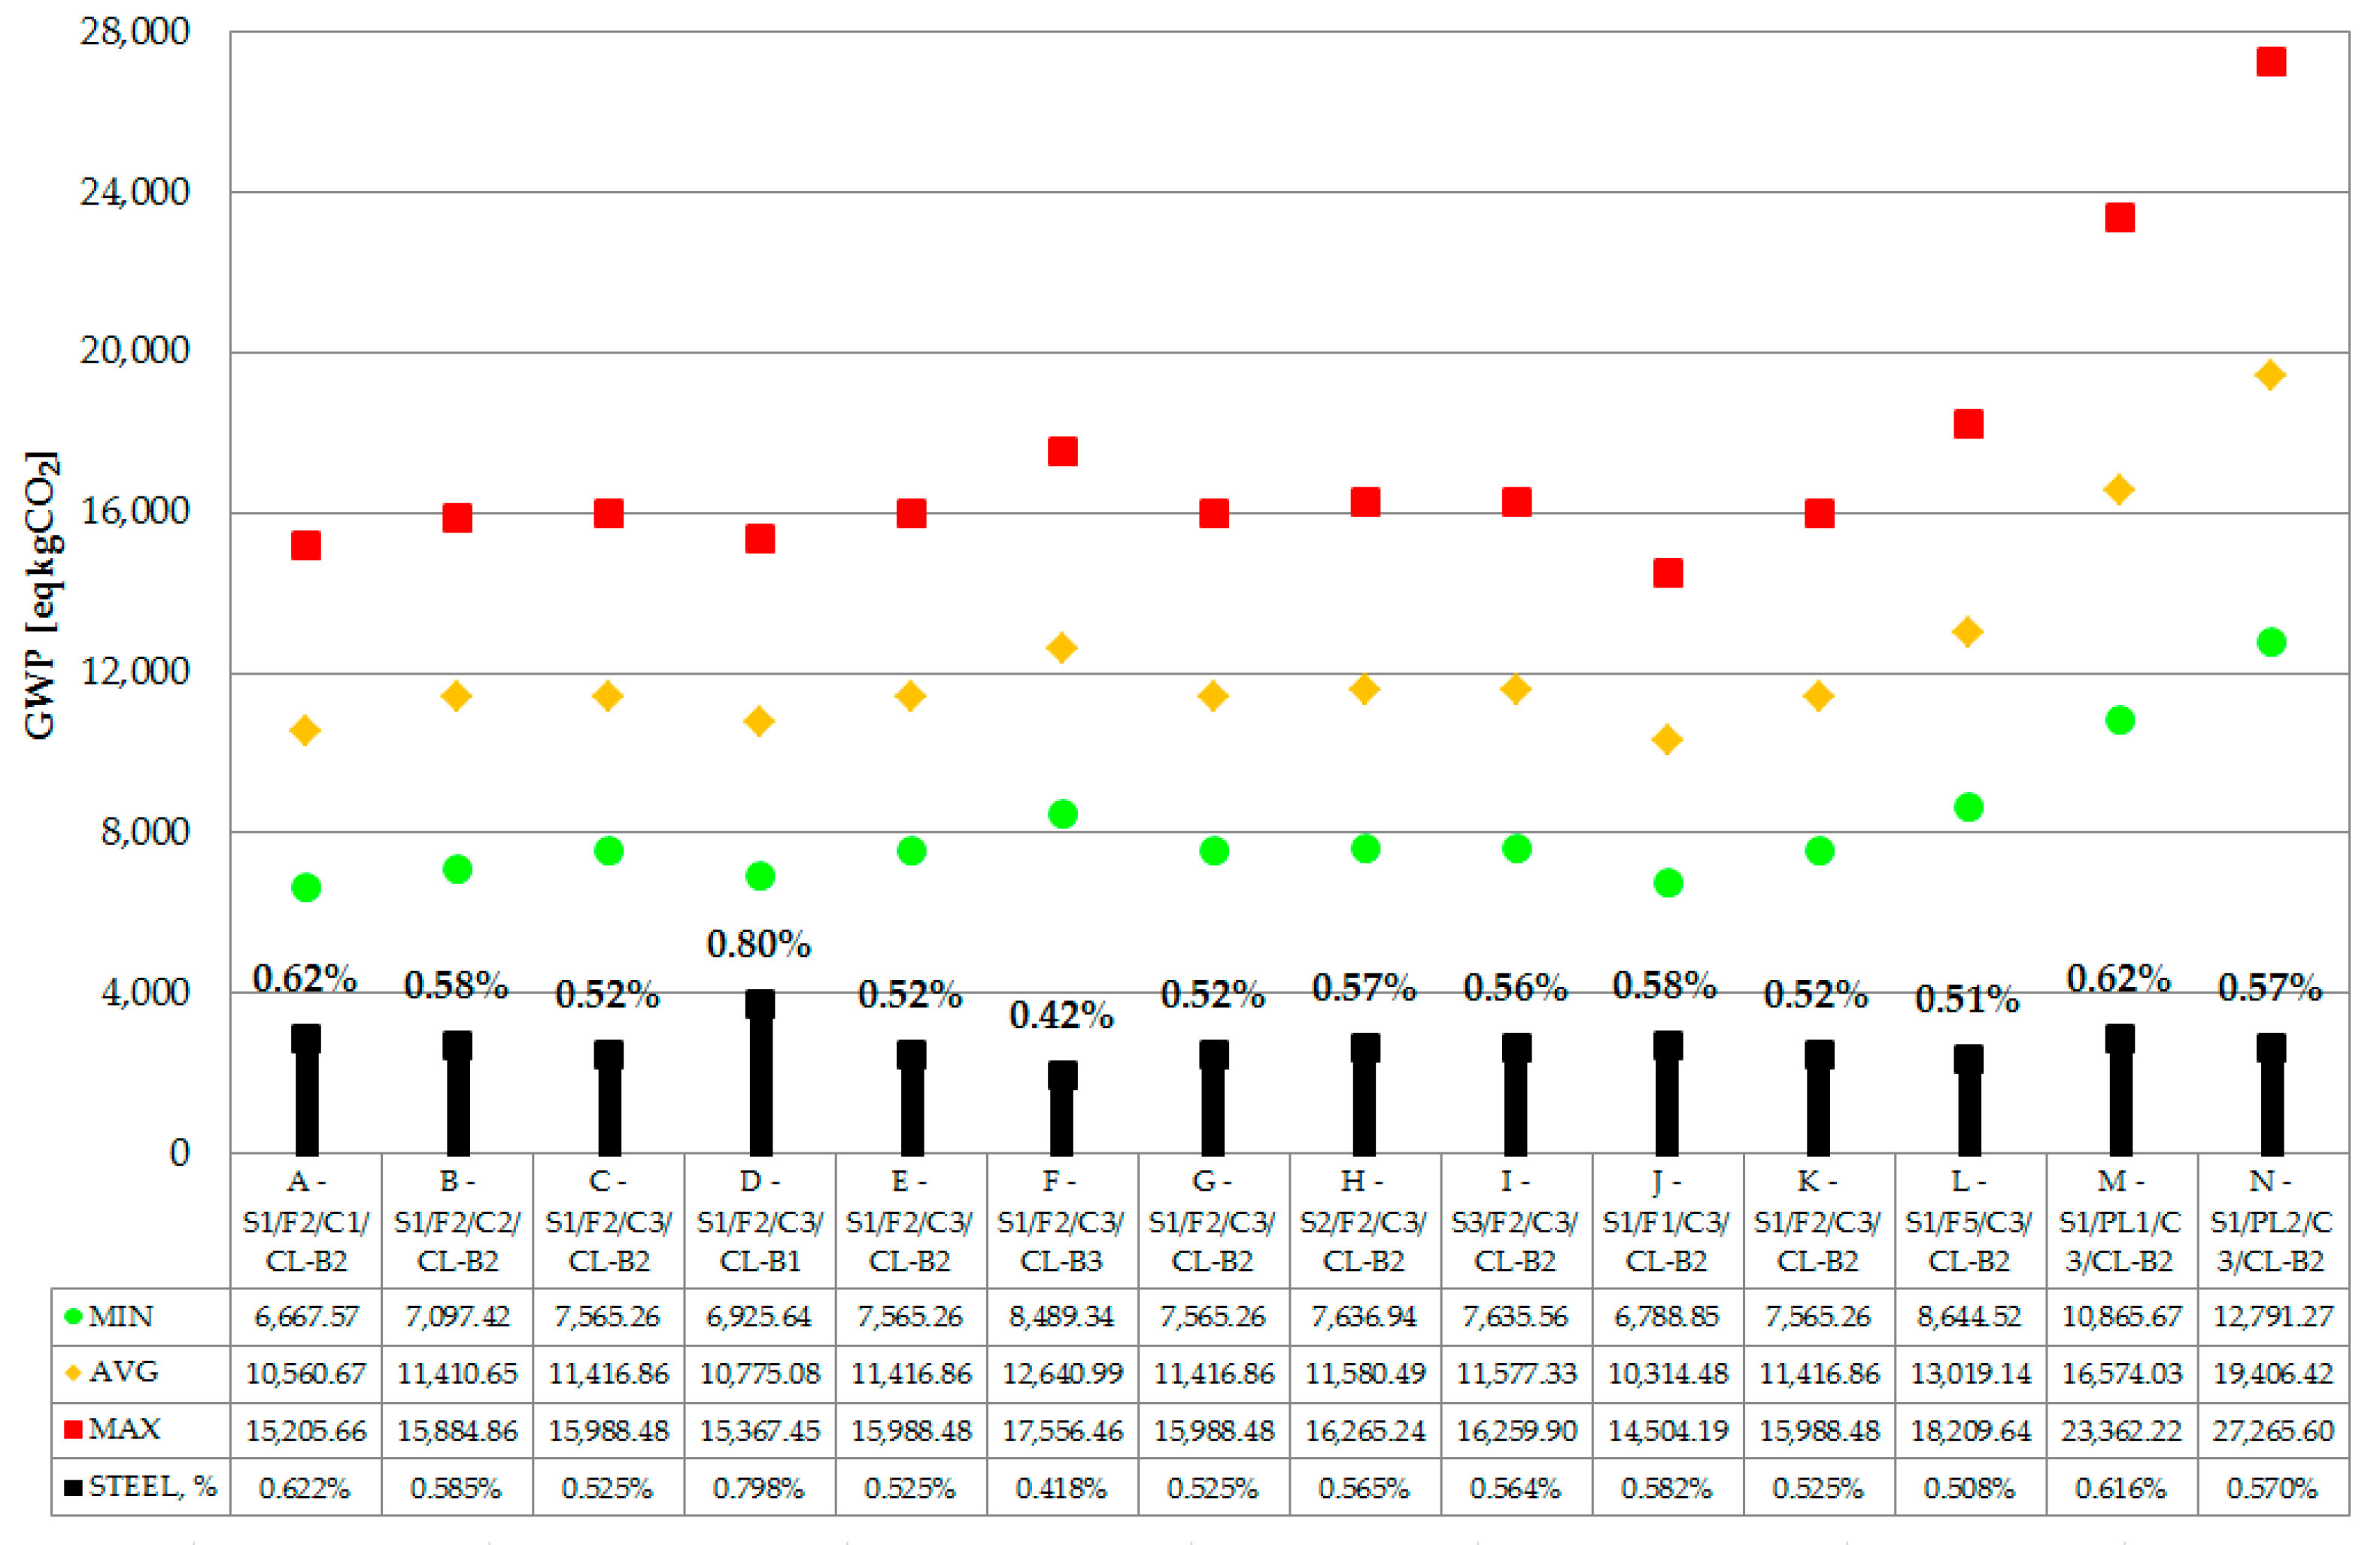
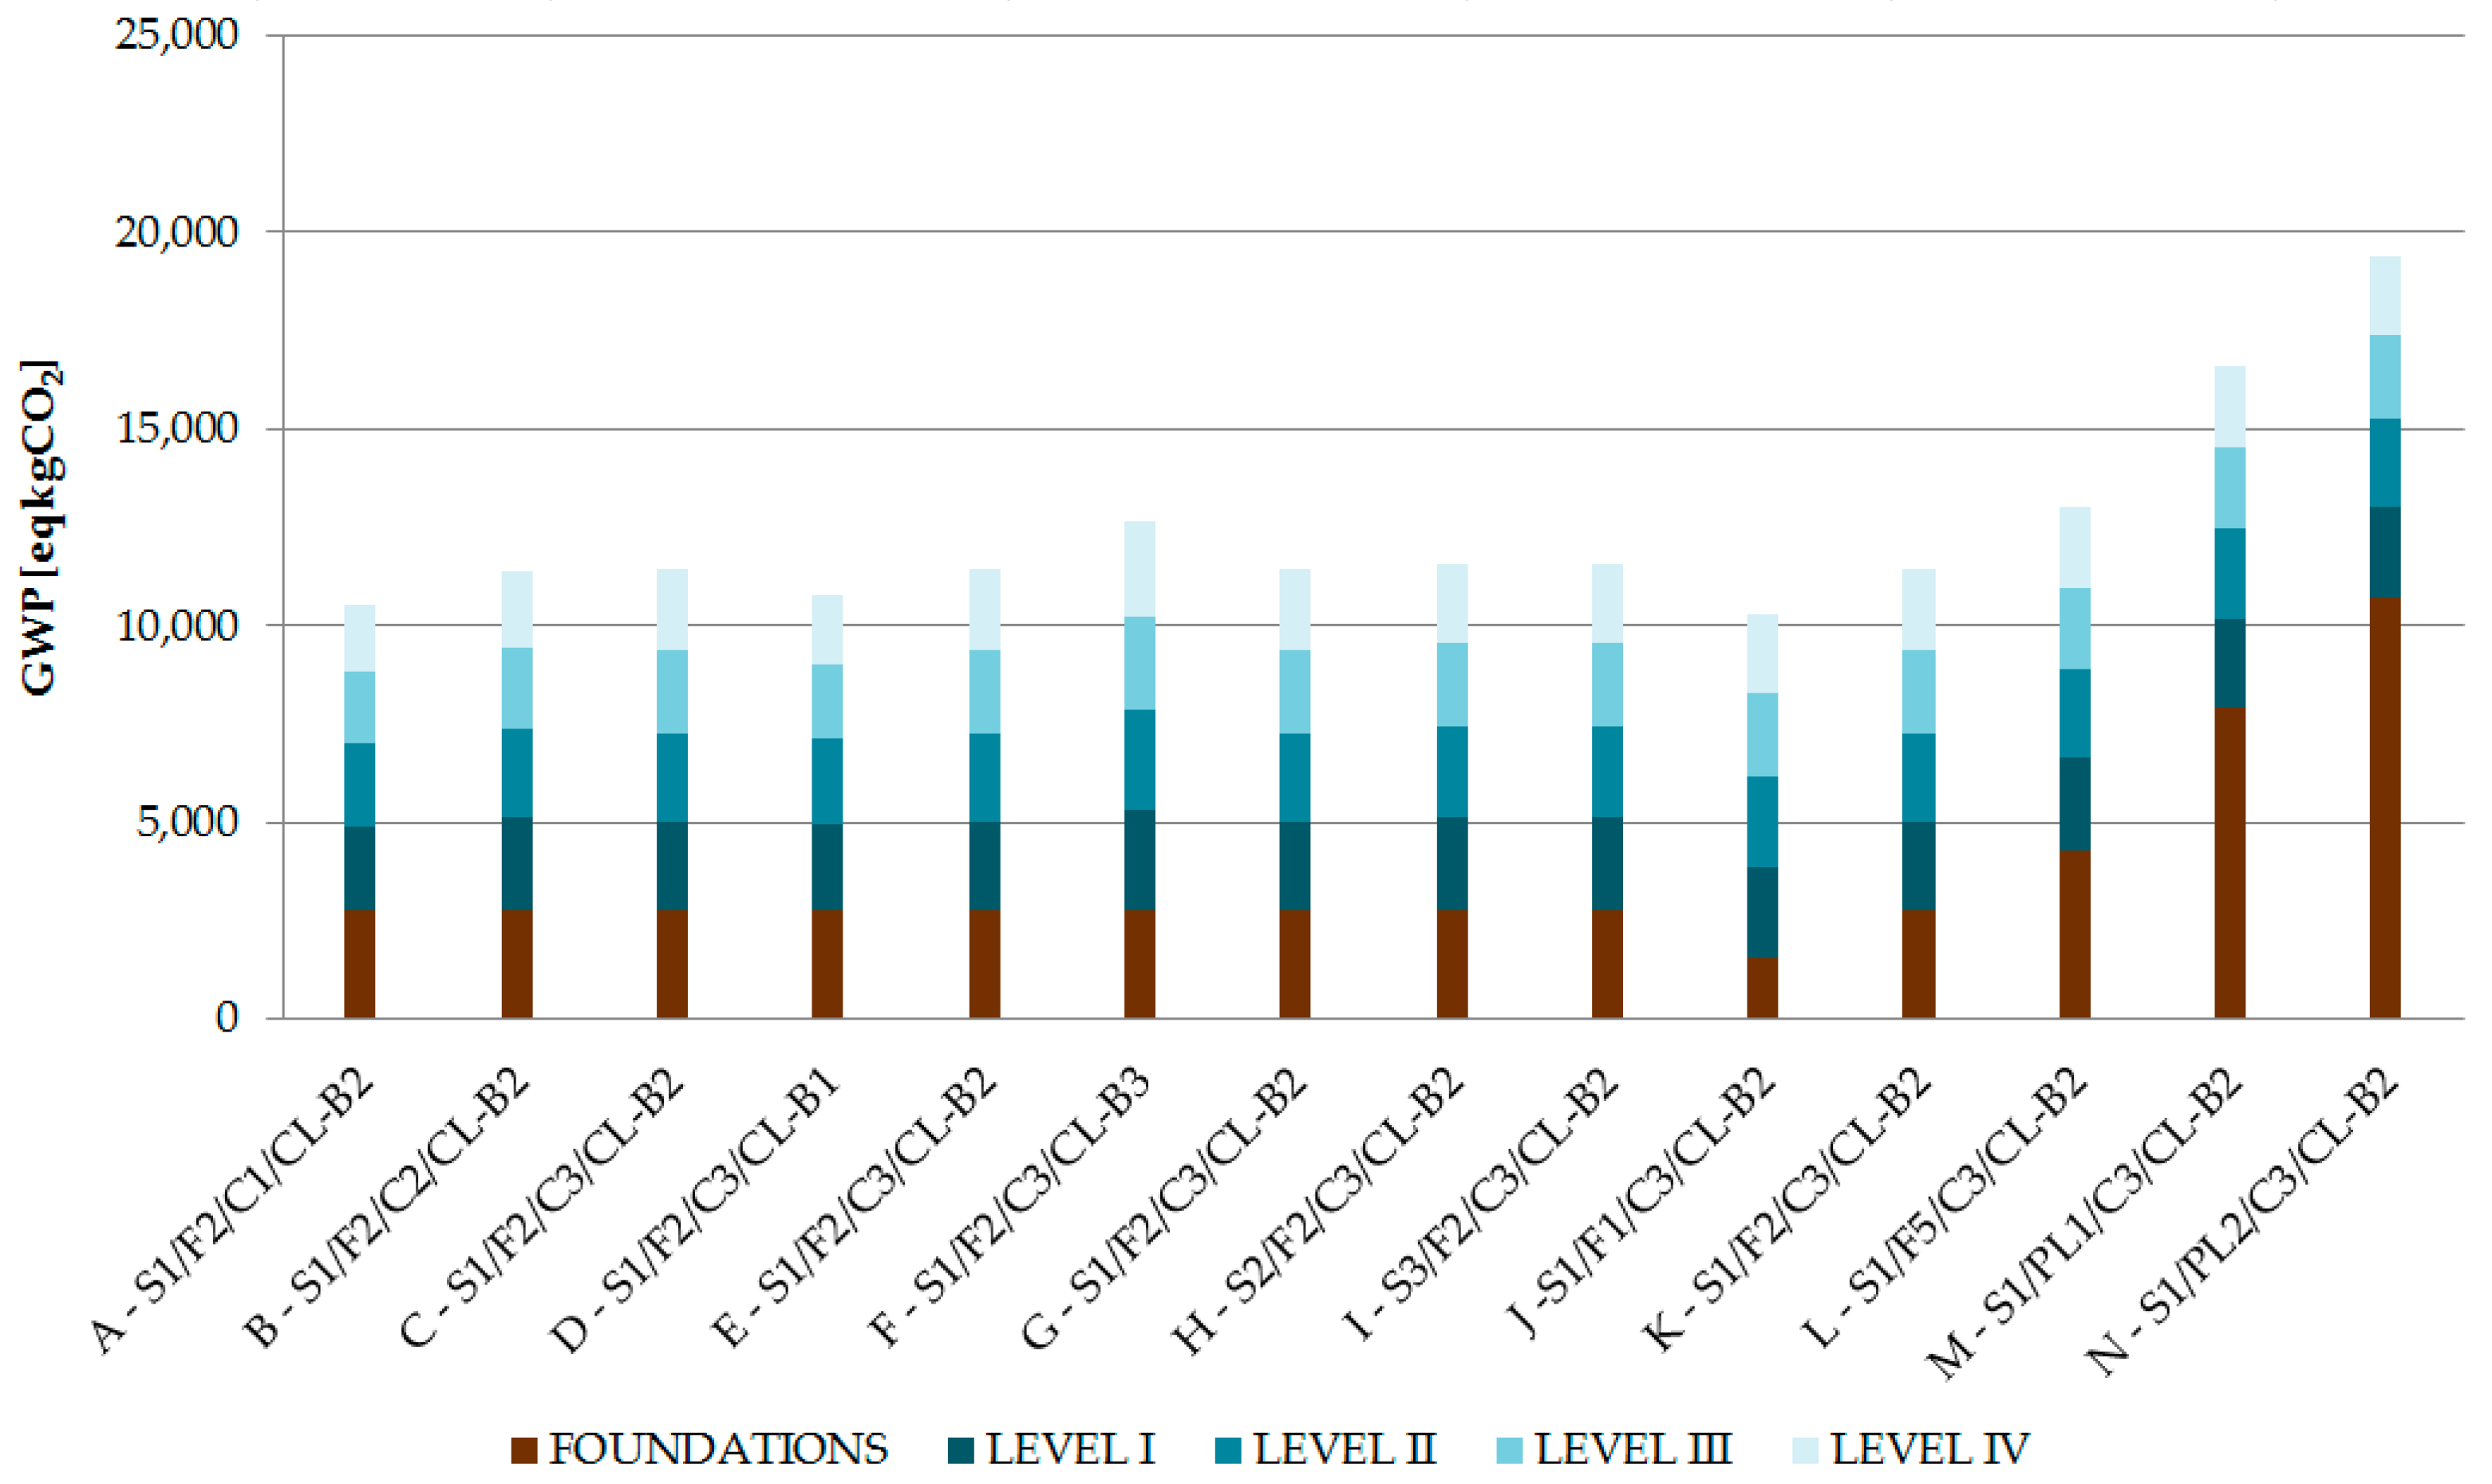
3.2. Life Cycle Assessment of Reinforced Concrete Tower

The Life Cycle Assessments have been carried out using OneClick LCA software (One Click LCA© Version: 0.30.0, Database version: 7.6), following the Level(s) life-cycle assessment (EN 15804 + A2). Thanks to access to some of the leading databases worldwide, such as ASTM, AusLCI, Australasian EPD System, B-EPD, baubook, BauEPD, BPIC, BRE, cemsuisse, CISA, CSA Group, ITB, EPD HUB, ÖKOBAUDAT, Bau-EPD, and the International EPD System, the software allows for in-depth and detailed analyses of all life stages of structures and materials. One of the main goals of this study is to elucidate the impact of different structural systems, particularly in terms of material consumption, on their carbon footprint. For this reason, only A1–A3 stages were taken into consideration in the LCA analysis. However, additional analysis incorporating the effects of construction works (A5 stage) is worth considering and will be subject to further analysis. In the first stage, a database (as of May 2024) with the Global Warming Potential (GWP) values for ready-mix concrete and reinforcement steel was prepared. The material search was limited by region (Poland) and compressive strength of concrete (C25/30, C30/37, and C35/45). The calculations were performed in three ways: for the maximum values of GWP, for the average values of GWP, and for the minimum values of GWP (Table 4). The differences in the GWP values for reinforcement steel are mainly attributed to the content of recycled raw materials. In the case of ready-mix concrete, the carbon footprint is influenced by the number of recycled binders in cement (e.g., fly ash, ground granulated blast-furnace slag (GGBS)). The reinforcement steel with the lowest GWP value contains 100% recycled raw materials, whereas the steel with the highest GWP value is manufactured with 0% recycled raw materials. The ready-mix concretes with the lowest GWP values are produced using CEM III, with GGBS content at 75% for C25/30, 70% for C30/37, and 60% for C35/45, respectively. In contrast, all the ready-mix concretes with the highest GWP values are produced using CEM I with 0% recycled binder content. The average GWP value was calculated from all available data in the database, applying the “Poland” filter.
In the second stage, the Life Cycle Assessment (LCA) was performed for various foundation structural designs. The results were influenced by three factors: soil conditions (S1, S2, S3), structural system (four feet or plate), and their respective dimensions. Concrete strength of C35/45 class was assumed. In Figure 8, the results of the LCA analysis for the foundation structural systems are presented. The analysis shows that the foundation plate has a higher carbon footprint compared to a structural system consisting of four foundation feet, primarily due to increased material consumption. Similar results were obtained for the foundation feet: the larger the dimensions of the feet, the higher the carbon footprint. In the assessment of the impact of the foundations themselves on the carbon footprint, the conclusion is obvious, but for the entire building, the increase in material demand for foundations was not compensated by the reduced carbon footprint of the frame system elements. Only one of the foundation structures (F2) was analysed under different soil conditions; however, the effect on the Global Warming Potential (GWP) value factor is negligible.
In Figure 9, the results of the LCA analysis for the examined structural systems are presented. The lowest GWP value was obtained for option J (S1/F1/C3/CL-B2) for medium-emission and high-emission materials and option A (S1/F2/C1/CL-B2) for the low-emission materials, whereas option N (S1/PL2/C3/CL-B2) has the highest carbon footprint in all analysed cases. Similar to previous outcomes, there is a significant difference in the GWP values between structures with foundation plates and those with foundation feet. It is worth noting that the use of low-emission materials allows for a reduction of the GWP value by more than 50%.
Figure 10 illustrates the influence of structural elements on the total Global Warming Potential (GWP) value of the examined structural systems utilizing medium-emission materials. The lowest GWP value (option J) is correlated with the minimal impact of the foundation structure, while the highest GWP value (option N) corresponds to the greatest contribution of the substructure, which is 15.0% and 55.4%, respectively. Moreover, the GWP contribution of the individual levels within the superstructure is evenly distributed, with levels I and II exhibiting a slightly higher contribution compared to levels III and IV. The results clearly show that soil conditions and appropriate substructure design have a crucial influence on the environmental impact of the entire building. Similar observations have been noted in other papers [15].
In Figure 11, the impact of ready-mix concrete and reinforcement steel on the total GWP value of the examined structural systems for the medium-emission materials is presented. Additionally, the percentage share of steel in the total structure is shown. The reinforcement steel’s share of the total GWP ranges from 26.5% (D—S1/F2/C3/CL-B1) to 15.8% (F—S1/F2/C3/CL-B3). There is a clear correlation between the quantity of steel and its contribution to the overall carbon footprint. These findings are in line with those of other researchers [16,23,52]. However, a lower percentage of steel is associated with higher strength classes of concrete, which typically exhibit a higher carbon footprint.

4. Conclusions

Performing a full analysis of the structure taking into account second-order effects and nonlinear material features in combination with the problem of the structure cooperation with nonlinear soil is a very complex engineering problem requiring the use of advanced computer software. This issue is so complex that even the use of high-performance computer equipment usually requires the introduction of additional simplification assumptions. In order to account for the influence of various parameters on the response of the structure, additionally considering the impossibility of using superposition, the analysis carried out in the paper was based on a relatively simple member structure, introducing an additional limitation of the number of combinations.
The analyses conducted for various design parameters to identify the most optimal solution to meet the sustainability requirements yield several conclusions. Firstly, increasing the grade of concrete used in the reinforced concrete structure reduces steel consumption but overall contributes to a higher carbon footprint. Secondly, increasing the cross-sectional dimensions of columns and beams in the frame system for structures with fixed foundation dimensions significantly reduces the required reinforcement. However, considering the overall amount of concrete and steel used, this ultimately leads to an increased carbon footprint.
Furthermore, for a multi-story tower frame system with fixed geometric and strength parameters and direct foundation, changing soil parameters with a fixed structure and foundation dimensions, as well as changing the structure and foundation dimensions with fixed soil parameters, clearly affects the reinforcement requirements for the columns and beams of the first floor. However, this has little impact on the reinforcement requirements for the columns and beams of the higher floors.
Additionally, for a frame system with fixed geometric and strength parameters directly founded on soil with fixed parameters, increasing the dimensions of the foundation footings and the thickness of the foundation slab increases the reinforcement requirements for the columns of the lower floor while simultaneously reducing the amount of reinforcement needed for the beams. The overall effect is a minimal reduction in the carbon footprint concerning the reinforced concrete structure of the building itself.
Moreover, changing soil parameters for a frame system with fixed geometric and strength parameters of the superstructure and foundations affects the reinforcement requirements for the columns and beams of the first floor, without significantly impacting the reinforcement of the frame system elements on higher floors. To meet the ULS and SLS requirements, there is an overall increase in the carbon footprint, significantly influenced by the need to increase the dimensions of the foundations.
Lastly, meeting the SLS requirements under varying soil conditions necessitates increasing the dimensions of the foundation footings. To reduce the carbon footprint, it is significantly more effective to vary the dimensions of the foundation footings according to the actual soil conditions rather than founding the frame system on a common foundation slab.
Moreover, the LCA analysis we performed allows us to formulate the following conclusions. The material consumption is the crucial factor in terms of GWP of the analysed structural systems. The use of low-emission materials allows for a reduction of the GWP value by more than 50%, while the reinforcement steel’s share of the total GWP in the reinforcement concrete structure is between 15.8% and 26.5%. However, it is important to recognize that contemporary design processes encompass not only structural analysis but also the optimization of environmental and financial impacts.
Depending on the stiffness of both the structure and the subsoil, it is not always reasonable to perform full nonlinear analyses in order to obtain an optimal and safe structural solution that additionally meets the requirements of sustainable engineering. The authors hope that this work can initiate further research towards the determination of simple and effective engineering criteria for the need to perform full nonlinear analyses of the structure cooperating with the subsoil.

Author Contributions

Conceptualization, J.Ś. and R.S.; methodology, J.Ś. and R.S.; software, R.S. and M.R.; validation, J.Ś. and K.C.; formal analysis, J.Ś.; investigation, R.S., J.Ś., M.R. and K.C.; resources, K.C.; data curation, K.C.; writing—original draft preparation, R.S. and J.Ś.; writing—review and editing, J.Ś., M.R. and K.C.; visualization, K.C.; supervision, J.Ś.; project administration, R.S.; funding acquisition, R.S. and J.Ś. All authors have read and agreed to the published version of the manuscript.

Funding

This research was funded by Poznan University of Technology, grant number 0111/SBAD/2412 and 0412/SBAD/0080.

Institutional Review Board Statement

Not applicable.

Informed Consent Statement

Not applicable.

Data Availability Statement

The original contributions presented in the study are included in the article, further inquiries can be directed to the corresponding author.

Conflicts of Interest

The authors declare no conflicts of interest.

References

  1. Lima, L.; Trindade, E.; Alencar, L.; Alencar, M.; Silva, L. Sustainability in the construction industry: A systematic review of the literature. J. Clean. Prod. 2021, 289, 125730. [Google Scholar] [CrossRef]
  2. Zavadskas, E.; Šaparauskas, J.; Antuchevičienė, J. Sustainability in Construction Engineering. Sustainability 2018, 10, 2236. [Google Scholar] [CrossRef]
  3. Adams, K.T.; Osmani, M.; Thorpe, T.; Thornback, J. Circular economy in construction: Current awareness, challenges and enablers. Proc. Inst. Civ. Eng.—Waste Resour. Manag. 2017, 170, 15–24. [Google Scholar] [CrossRef]
  4. Ding, G.K.C. Life cycle assessment (LCA) of sustainable building materials: An overview. In Eco-Efficient Construction and Building Materials; Pacheco-Torgal, F., Cabeza, L.F., Labrincha, J., de Magalhães, A., Eds.; Woodhead Publishing: Sawston, Cambridge, UK, 2014; pp. 38–62. [Google Scholar] [CrossRef]
  5. Schneider, M.; Romer, M.; Tschudin, M.; Bolio, H. Sustainable cement production present and future. Cem. Concr. Res. 2011, 41, 642–650. [Google Scholar] [CrossRef]
  6. Ali, M.B.; Saidura, R.; Hossain, M.S. A review on emission analysis in cement industries. Renew. Sustain. Energy Rev. 2011, 15, 2252–2261. [Google Scholar] [CrossRef]
  7. Benhelal, E.; Shamsaei, E.; Rashid, M.I. Challenges against CO2 abatement strategies in cement industry: A review. J. Environ. Sci. 2021, 104, 84–101. [Google Scholar] [CrossRef]
  8. Griffiths, S.; Sovacool, B.K.; Furszyfer Del Rio, D.D.; Foley, A.M.; Bazilian, M.D.; Kim, J.; Uratani, J.M. Decarbonizing the cement and concrete industry: A systematic review of socio-technical systems, technological innovations, and policy options. Renew. Sustain. Energy Rev. 2023, 180, 113291. [Google Scholar] [CrossRef]
  9. Pavlovič, A.; Donchev, T.; Petkova, D.; Staletovič, N. Sustainability of alternative reinforcement for concrete structures: Life cycle assessment of basalt FRP bars. Constr. Build. Mater. 2022, 334, 127424. [Google Scholar] [CrossRef]
  10. Cadenazzi, T.; Dotelli, G.; Rossini, M.; Nanni, S.N.A. Cost and environmental analyses of reinforcement alternatives for a concrete bridge. Struct. Infrastruct. Eng. 2020, 16, 787–802. [Google Scholar] [CrossRef]
  11. Kromoser, B.; Butler, M.; Hunger, M.; Kimm, M.; Kopf, F.; Mechtcherine, V.; Pressmair, N.; Traverso, M. Article of RILEM TC 292-MCC: Life cycle assessment (LCA) of non-metallic reinforcement for reinforcing concrete: Manufacturing, durability, dismantling, recycling and reuse: A review. Mater. Struct. 2023, 56, 126. [Google Scholar] [CrossRef]
  12. Pešta, P.T.; Vlach, J.; Fortová, T. Environmental Impact of Concrete Slab Made of Recycled Aggregate Concrete Based on Limit States of Load-Bearing Capacity and Serviceability—LCA Case Study. Materials 2023, 16, 616. [Google Scholar] [CrossRef] [PubMed]
  13. Renne, N.; Kara De Maeijer, P.; Craeye, B.; Buyle, M.; Audenaert, A. Sustainable Assessment of Concrete Repairs through Life Cycle Assessment (LCA) and Life Cycle Cost Analysis (LCCA). Infrastructures 2022, 7, 128. [Google Scholar] [CrossRef]
  14. Huang, B.; Gao, X.; Xu, X.; Song, J.; Geng, Y.; Sarkis, J.; Fishman, T.; Kua, H.; Nakatani, J. A Life Cycle Thinking Framework to Mitigate the Environmental Impact of Building Materials. One Earth 2020, 3, 564–573. [Google Scholar] [CrossRef]
  15. Negrin, I.; Kripka, M.; Yepes, V. Metamodel-assisted meta-heuristic design optimization of reinforced concrete frame structures considering soil-structure interaction. Eng. Struct. 2023, 293, 116657. [Google Scholar] [CrossRef]
  16. Xu, X.; You, J.; Wang, Y.; Luo, Y. Analysis and assessment of life-cycle carbon emissions of space frame structures. J. Clean. Prod. 2023, 385, 135521. [Google Scholar] [CrossRef]
  17. Negrin, I.; Kripka, M.; Yepes, V. Multi-criteria optimization for sustainability-based design of reinforced concrete frame buildings. J. Clean. Prod. 2023, 425, 139115. [Google Scholar] [CrossRef]
  18. Peng, J.; Feng, Y.; Zhang, Q.; Liu, X. Multi-objective integrated optimization study of prefabricated building projects introducing sustainable levels. Sci. Rep. 2023, 13, 2821. [Google Scholar] [CrossRef] [PubMed]
  19. Ek, K.; Mathern, A.; Rempling, R.; Brinkho, P.; Karlsson, M.; Norin, M. Life Cycle Sustainability Performance Assessment Method for Comparison of Civil Engineering Works Design Concepts: Case Study of a Bridge. Int. J. Environ. Res. Public Health 2020, 17, 7909. [Google Scholar] [CrossRef] [PubMed]
  20. Mathern, A.; Penadés-Plà, V.; Barros, J.A.; Yepes, V. Practical metamodel-assisted multi-objective design optimization for improved sustainability and buildability of wind turbine foundations. Struct. Multidiscip. Optim. 2022, 65, 46. [Google Scholar] [CrossRef]
  21. Yepes, V.; Martí, J.V.; García-Segura, T. Cost and CO2 emission optimization of precast–prestressed concreto U-beam road bridges by a hybrid glowworm swarm algorithm. Autom. Constr. 2015, 49, 123–134. [Google Scholar] [CrossRef]
  22. Angelin, A.F.; Bento, R.C.; Gavioli, L.M.; Rossignolo, J.A. Life cycle assessment application in the optimum design of reinforced concrete structures. Ambiente Construído Porto Alegre 2023, 23, 187–202. [Google Scholar] [CrossRef]
  23. Negrin, I.A.; Chagoy’en, E.L. Economic and environmental design optimisation of reinforced concrete frame buildings: A comparative study. Structures 2022, 38, 64–75. [Google Scholar] [CrossRef]
  24. Camp, C.V.; Huq, F. CO2 and cost optimization of reinforced concrete frames using a big bang-big crunch algorithm. Eng. Struct. 2013, 48, 363–372. [Google Scholar] [CrossRef]
  25. Ruiz-Vélez, A.; Alcalá, J.; Yepes, V. Optimal Design of Sustainable Reinforced Concrete Precast Hinged Frames. Materials 2023, 16, 204. [Google Scholar] [CrossRef]
  26. Tahwia, A.M.; El-Far, O.; Amin, M. Characteristics of sustainable high strength concrete incorporating eco-friendly materials. Innov. Infrastruct. Solut. 2022, 7, 8. [Google Scholar] [CrossRef]
  27. Albarbary, M.M.; Tahwia, A.M.; Elmasoudi, I. Integration between Sustainability and Value Engineering in the Production of Eco-Friendly Concrete. Sustainability 2023, 15, 3565. [Google Scholar] [CrossRef]
  28. Kilicer, S.; Ozgan, K.; Daloglu, A. Effects of soil structure interaction on behavior of reinforced concrete structures. J. Struct. Eng. Appl. Mech. 2018, 1, 28–33. [Google Scholar] [CrossRef]
  29. Pinheiro dos Santos, Y.R.; Marques da Cunha Vieira Bello, M.I.; Duarte Gusmão, A.; Dantas Patricio, J. Soil-structure interaction analysis in reinforced concrete structures on footing foundation. Soils Rocks 2021, 44, e2021058020. [Google Scholar] [CrossRef]
  30. Mitropoulou, C.C.; Kostopanagiotis, C.; Kopanos, M.; Ioakim, D.; Lagaros, N.D. Influence of soil–structure interaction on fragility assessment of building structures. Structures 2016, 6, 85–98. [Google Scholar] [CrossRef]
  31. Nakhaei, M.; Ghannad, M.A. The effect of soil–structure interaction on damage index of buildings. Eng. Struct. 2008, 30, 1491–1499. [Google Scholar] [CrossRef]
  32. Anand, V.; Kumar, S.R.S. Seismic Soil-structure Interaction: A State-of-the-Art Review. Structures 2018, 16, 317–326. [Google Scholar] [CrossRef]
  33. Gravett, D.Z.; Mourlas, C.; Taljaard, V.-L.; Bakas, N.; Markou, G.; Papadrakakis, M. New fundamental period formulae for soil-reinforced concrete structures interaction using machine learning algorithms and ANNs. Structures 2021, 144, 106656. [Google Scholar] [CrossRef]
  34. Tsimplokoukou, K.; Lamperti, M.; Negro, P. Building Design for Safety and Sustainability; European Commission, Joint Research Centre, Institute for the Protection and Security of the Citizen: Ispra, Italy, 2014. [Google Scholar]
  35. Samsudin, M.K.; Azman, N.Z. The Sustainable Aspect of Safety in Architectural Early Design: An Introduction to Prevention through Design (PtD) Concept. Int. J. Sustain. Constr. Eng. Technol. 2022, 13, 34–50. [Google Scholar] [CrossRef]
  36. User Handbook AxisVM X7. Available online: https://gammacad.pl/app/uploads/acf-uploads/axisvm_x7_podrecznik.pdf (accessed on 21 May 2024).
  37. User Handbook Dlubal RFEM 6/RSTAB 9—Concrete Design. Available online: https://www.dlubal.com/en/downloads-and-information/documents/online-manuals/rfem-6-concrete-design (accessed on 21 May 2024).
  38. User Handbook Scia Engineering. Available online: https://downloads.scia.net/support/sciaengineer/manuals/TUT%20[Eng]%20SCIA21.1%20-%20Tutorial%20Concrete.pdf (accessed on 21 May 2024).
  39. Ding, G.K.C. Sustainable construction—The role of environmental assessment tools. J. Environ. Manag. 2008, 86, 451–464. [Google Scholar] [CrossRef] [PubMed]
  40. EN 1992-1-1; Eurocode 2: Design of Concrete Structures—Part 1-1: General Rules and Rules for Buildings. European Committee for Standardisation: Brussels, Belgium, 2004.
  41. EN 1997-1-1; Eurocode 7: Geotechnical Design—Part 1: General Rules. European Committee for Standardisation: Brussels, Belgium, 2004.
  42. EN-1990; Eurocode—Basis of Structural Design. European Committee for Standardisation: Brussels, Belgium, 2005.
  43. EN 1991-1-4; Eurocode 1: Actions on Structures—Part 1-4: General Actions—Wind Actions. European Committee for Standardisation: Brussels, Belgium, 2010.
  44. EN 1991-1-3; Eurocode 1: Actions on Structures—Part 1-3: General Actions—Snow Loads. European Committee for Standardisation: Brussels, Belgium, 2003.
  45. Ścigałło, J.; Studziński, R. Types of global analysis of bar reinforced concrete structures. Mater. Bud. Sci. 2024, 3, 1–5. [Google Scholar] [CrossRef]
  46. Bresler, B. Design Criteria for Reinforced Columns under Axial Load and Biaxial Bending. ACI J. Proc. 1960, 57, 481–490, discussion 1621–1638. [Google Scholar]
  47. Ramamurthy, L.N. Investigation of the Ultimate Strength of Square and Rectangular Columns under Biaxially Eccentric Loads. In Symposium on Reinforced Concrete Columns; American Concrete Institute: Detroit, MI, USA, 1966; pp. 263–298. [Google Scholar]
  48. Bouchaboub, M.; Samai, M.L. Nonlinear analysis of slender high-strength R/C columns under combined biaxial bending and axial compression. Eng. Struct. 2013, 48, 37–42. [Google Scholar] [CrossRef]
  49. Pannell, F.N. The Design of Biaxially Loaded Columns by Ultimate Load Methods. Mag. Concr. Res. 1960, 12, 99–108. [Google Scholar] [CrossRef]
  50. Araújo, J.M. Comparative study of the simplified methods of Eurocode 2 for second order analysis of slender reinforced concrete columns. J. Build. Eng. 2017, 14, 55–60. [Google Scholar] [CrossRef]
  51. The Sustainability Platform for Construction & Manufacturing. Available online: https://oneclicklca.com (accessed on 15 May 2024).
  52. Yeoa, D.; Gabbaib, R.D. Sustainable design of reinforced concrete structures through embodied Energy optimization. Energy Build. 2011, 43, 2028–2033. [Google Scholar] [CrossRef]
Figure 1. Scheme of the reinforced concrete structure.
Sustainability 16 06771 g001
Figure 2. Soil profile cross-sections: (a) soil S1, (b) soil S2, and (c) soil S3, dimensions in [m].
Sustainability 16 06771 g002
Figure 3. Settlements (vertical displacements eZ) of the reinforced concrete tower founded on isolated footings and foundation plate.
Sustainability 16 06771 g003
Figure 4. Isolated footing and S1 soil profile: (a) influence of footing size on structural displacements (ex—horizontal, ez(l)—vertical of the left side of the building, ez(p)—vertical of the right side of the building; (b) influence of footing size on amount of foundation reinforcement.
Sustainability 16 06771 g004
Figure 5. Isolated footing and S3 soil profile: (a) change of the size of the right side footings (left footing of a constant size 2.0 × 2.0 × 0.6), (b) rate of foundation reinforcement. Squares visualise change in shape of the isolated footings (left constant size, right variable).
Sustainability 16 06771 g005
Figure 6. Change in vertical and horizontal displacements of the structure with respect to various types of foundations: (a) isolated footings, (b) foundation slab.
Sustainability 16 06771 g006
Figure 7. Horizontal displacement of the structure: (a) parameter P2—concrete classes, (b) parameter P4—cross sections of columns and beams, (c) parameter P1—soil, (d) parameter P3—dimensions and types of foundations.
Sustainability 16 06771 g007
Figure 8. Results from the LCA analysis of the foundation structural systems.
Sustainability 16 06771 g008
Figure 9. Results from the LCA analysis of the analysed structural systems, where S—represents soil conditions, F represents isolated footing, PL represents foundation plate, C represents class of concrete, CL-B represents columns and beams.
Sustainability 16 06771 g009
Figure 10. Impact of the structural elements on the total GWP value (medium-emission materials).
Sustainability 16 06771 g010
Figure 11. Impact of ready-mix concrete and reinforcement steel on the total GWP value (medium-emission materials).
Sustainability 16 06771 g011
Table 1. Soil layers parameters.
Soil Layer Name
(Acronym)
Description Standard
USCS
μ
[–]
ρ [kg/m3]φ [°]φcv [°] ν
[–]
Es [N/mm2]c [kN/m2]
Mixed silty sand (DNL) Loose, humid, silty sandSM180026220.270
Very fine sand (FNL)Loose, humid, very fine sandSP170022260.2510
Homogenous coarse
and medium sand (CNL)
Loose, humid sandSW180032320.220
Homogenous coarse
and medium sand (CNT)
Solid, humid sandSW210035320.270
Lean clay (JS7)Firm, lean clayCH0.7200016150.31685
Lean clay (JK7)Stiff, lean clayCL0.7180019170.1710185
Lean clay (JK10)Stiff, lean clayCL1.0160017170.1710185
Fat clay (LS7)Firm, fat clay CH0.721007130.355100
Silt (IP7)Soft siltMH0.7210016160.33475
Silt (IK7)Stiff siltML0.7170023210.1512150
Table 2. Mechanical properties of concrete classes.
Concrete ClassE
[N/mm2]
ν [–]fck [N/mm2] ftk
[N/mm2]
C25/30 31,5000.2252.56
C30/3732,8000.2302.90
C35/4534,1000.2373.21
Table 3. Set of the basic analysed cases of models (dimensions in [m]).
ParameterP1
(Soil)
P2
(Concrete)
P3a
(Isolated Footing)
P3b
(Foundation Plate)
P4
(Column Cross-Sections)
P4
(Beam Cross-Sections)
P1S1
S2C35/452.0 × 2.0 × 0.60.35 × 0.350.35 × 0.50
S3
P2 C20/25
S1C30/372.0 × 2.0 × 0.60.35 × 0.350.35 × 0.50
C35/45
P3a 1.5 × 1.5 × 0.6
S1C35/452.0 × 2.0 × 0.60.35 × 0.350.35 × 0.50
2.5 × 2.5 × 0.6
P3bS1C35/457.0 × 7.0 × 0.50.35 × 0.350.35 × 0.50
7.0 × 7.0 × 0.7
P4 0.30 × 0.300.30 × 0.50
S1C35/452.0 × 2.0 × 0.60.35 × 0.350.35 × 0.50
0.40 × 0.400.40 × 0.50
Table 4. Values (in eqkgCO2/kg) of GWP for the analysed materials [51].
Steel
Reinforcement
Ready-Mix
Concrete C25/30
Ready-Mix
Concrete C30/37
Ready-Mix
Concrete C35/45
Minimum value0.64140.88159.35180.71
Average value1.44206.45243.70252.99
Maximum value2.43283.39318.19337.37
Disclaimer/Publisher’s Note: The statements, opinions and data contained in all publications are solely those of the individual author(s) and contributor(s) and not of MDPI and/or the editor(s). MDPI and/or the editor(s) disclaim responsibility for any injury to people or property resulting from any ideas, methods, instructions or products referred to in the content.

