
A Life Cycle and Economic Assessment of the Peggy Guggenheim Collection in Venice for Environmental and Economic Sustainability


Abstract
1. Introduction
2. Methodological Framework: Environmental and Economic Sustainability
- (1)
- What is the impact on the environment and the use of natural resources generated by the PGC in the performance of institutional goals?
- (2)
- Beyond the value directly generated, i.e., revenues, what are the impacts of the PGC on the local and national economy of the PGC in the performance of institutional goals?
- (3)
- More widely, what are the social costs and benefits (in environmental and economic terms) generated by the PGC in the performance of its institutional goals?
3. Applications of Environmental and Economic Sustainability Analysis to the PGC (SimaPro Version 9.5)
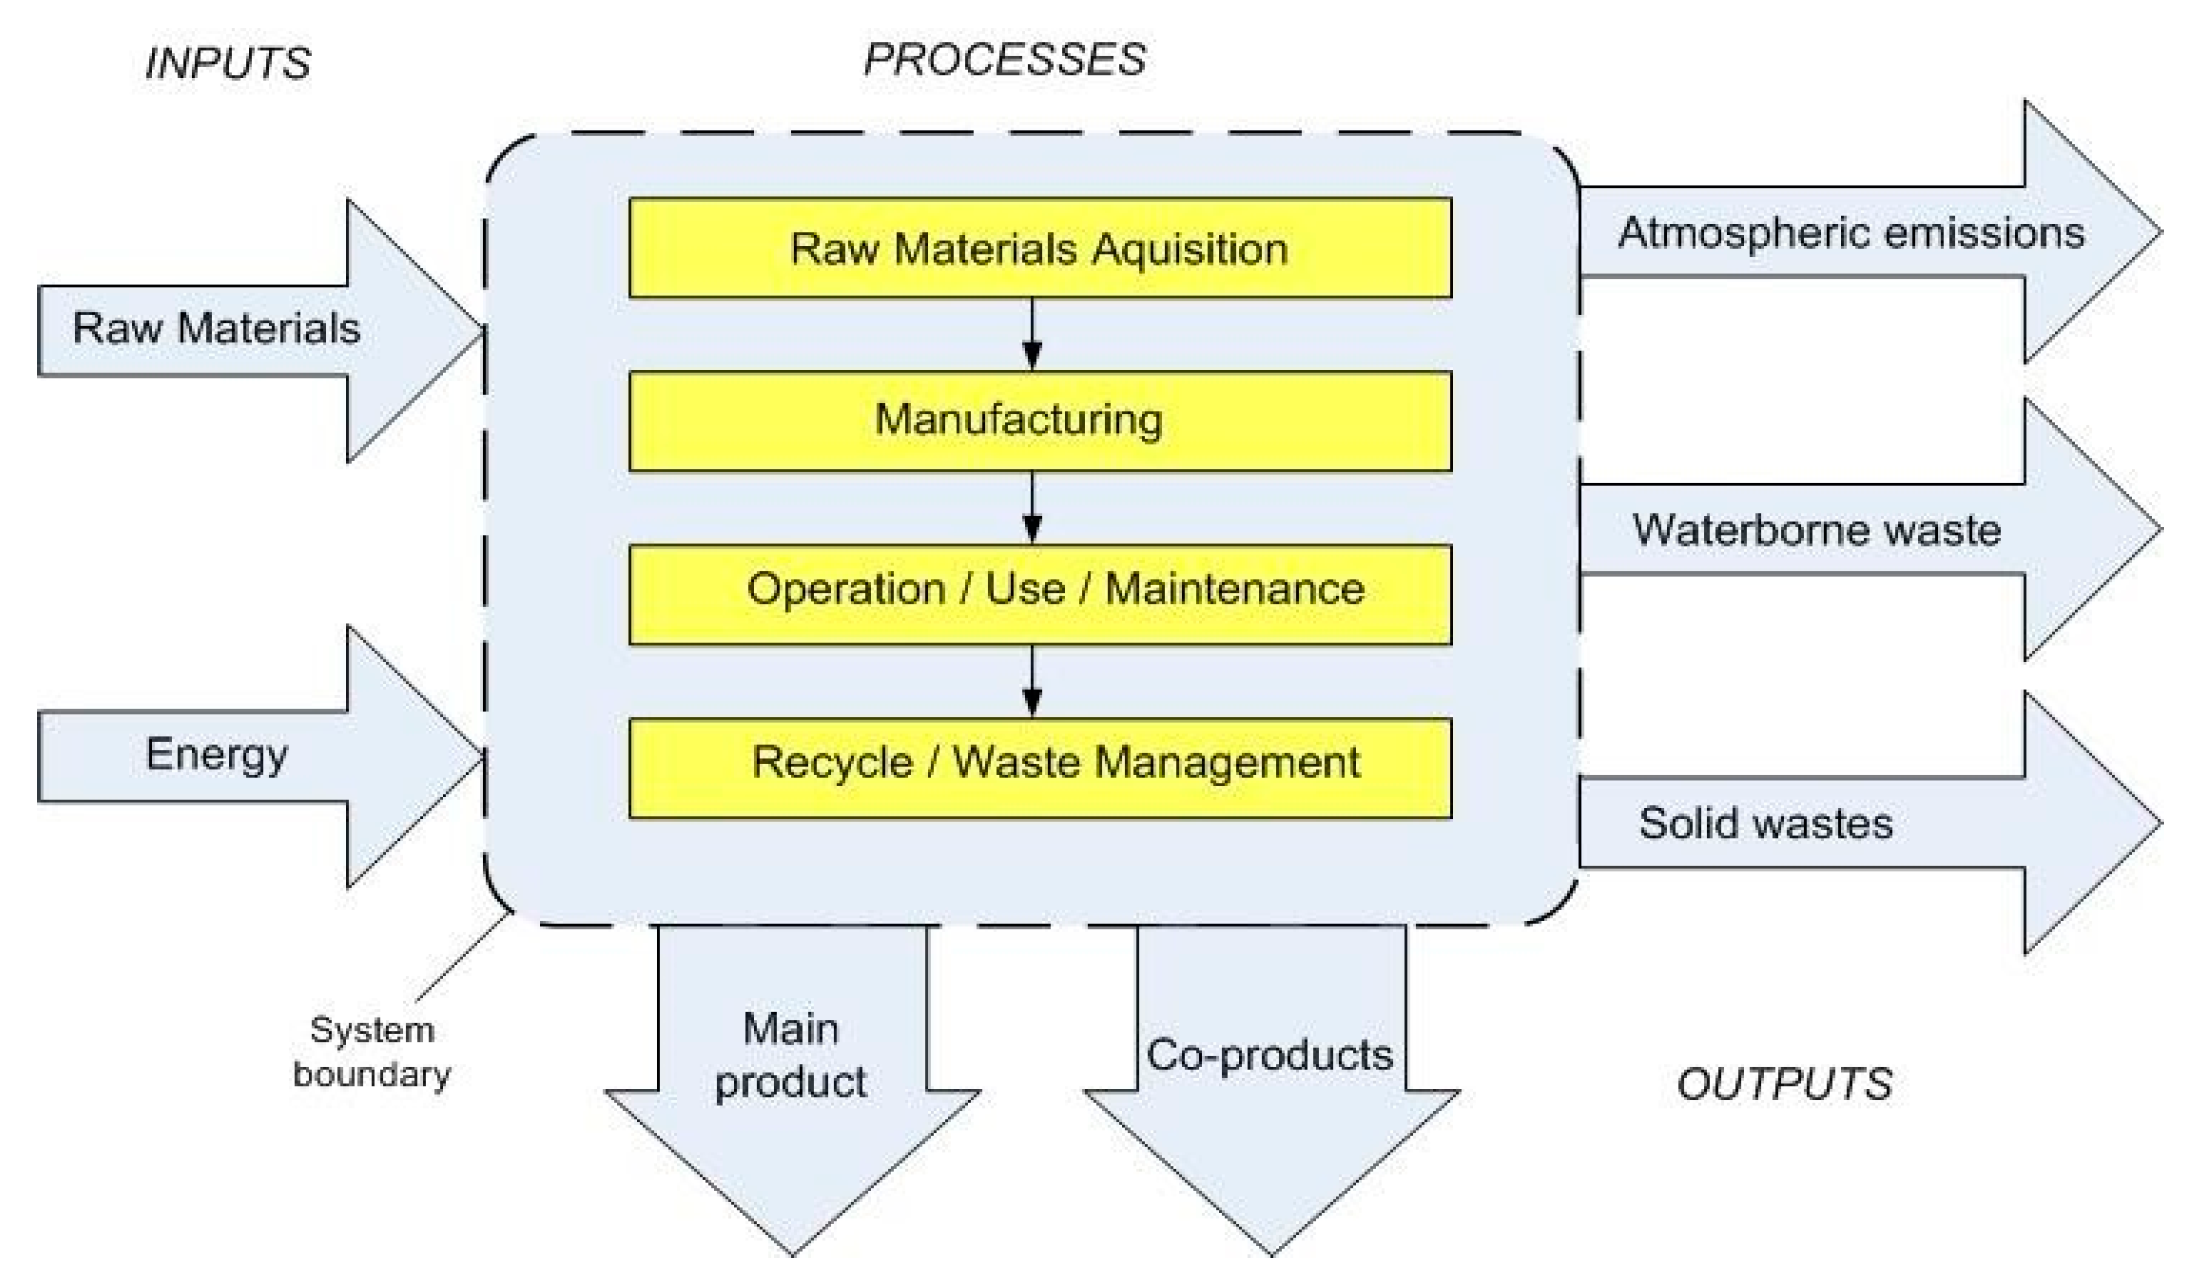
3.1. Environmental Sustainability Analysis and Life Cycle Assessment in Theory
- Goal and scope definition;
- Inventory analysis;
- Impact assessment;
- Interpretation of result [29].
3.2. Environmental Sustainability Analysis and Life Cycle Assessment in Practice: The PGC
3.3. Economic Sustainability Analysis and Econometric Valuation
- (1)
- Whether the choice of visiting Venice was mostly driven by the desire to visit the PGC.
- (2)
- Information regarding tourism and cultural consumption habits (for instance, number of days spent in the city, expected/estimated budget for the stay, and so on).
- (1)
- First, a linear empirical model describing the causal relationship between total visitors’ expenditures and all socio-economic and touristic/cultural variables has been estimated with OLS (In the case of the simple linear model, the general form is total visitors = f(socio-economic and touristic and cultural variables). The model is estimated with OLS).
- (2)
- Second, the estimated coefficient for the variable PGCyes (that is the dummy variable, with the PGC being the main reason to travel to Venice) has been computed. This equals 0.12, and it is 5% statistically significant. This implies that if the main motivation to travel to Venice is visiting the PGC, then the visitors’ total expenditures are 12% higher than if the main motivation to visit is not going to the PGC.
- (3)
- Third, we have gathered data on tourists’ average expenditure per day (EUR 200) and average stay in the city (2.66 days). The 2020 figures (the most recent up to now) are retrieved from a 2022 CISET report. Total expenditures equal EUR 532. The additional, marginal increment incentivized by the PGC is 12% (EUR 63.64). Therefore, the visitors coming to Venice for the PGC spend EUR 595.64.
- (4)
- Fourth, we retrieved the PGC primary data on the number of visitors per year from 2016 to 2022. Thirty-seven percent of the survey respondents have declared traveling to Venice mostly to visit the PGC.
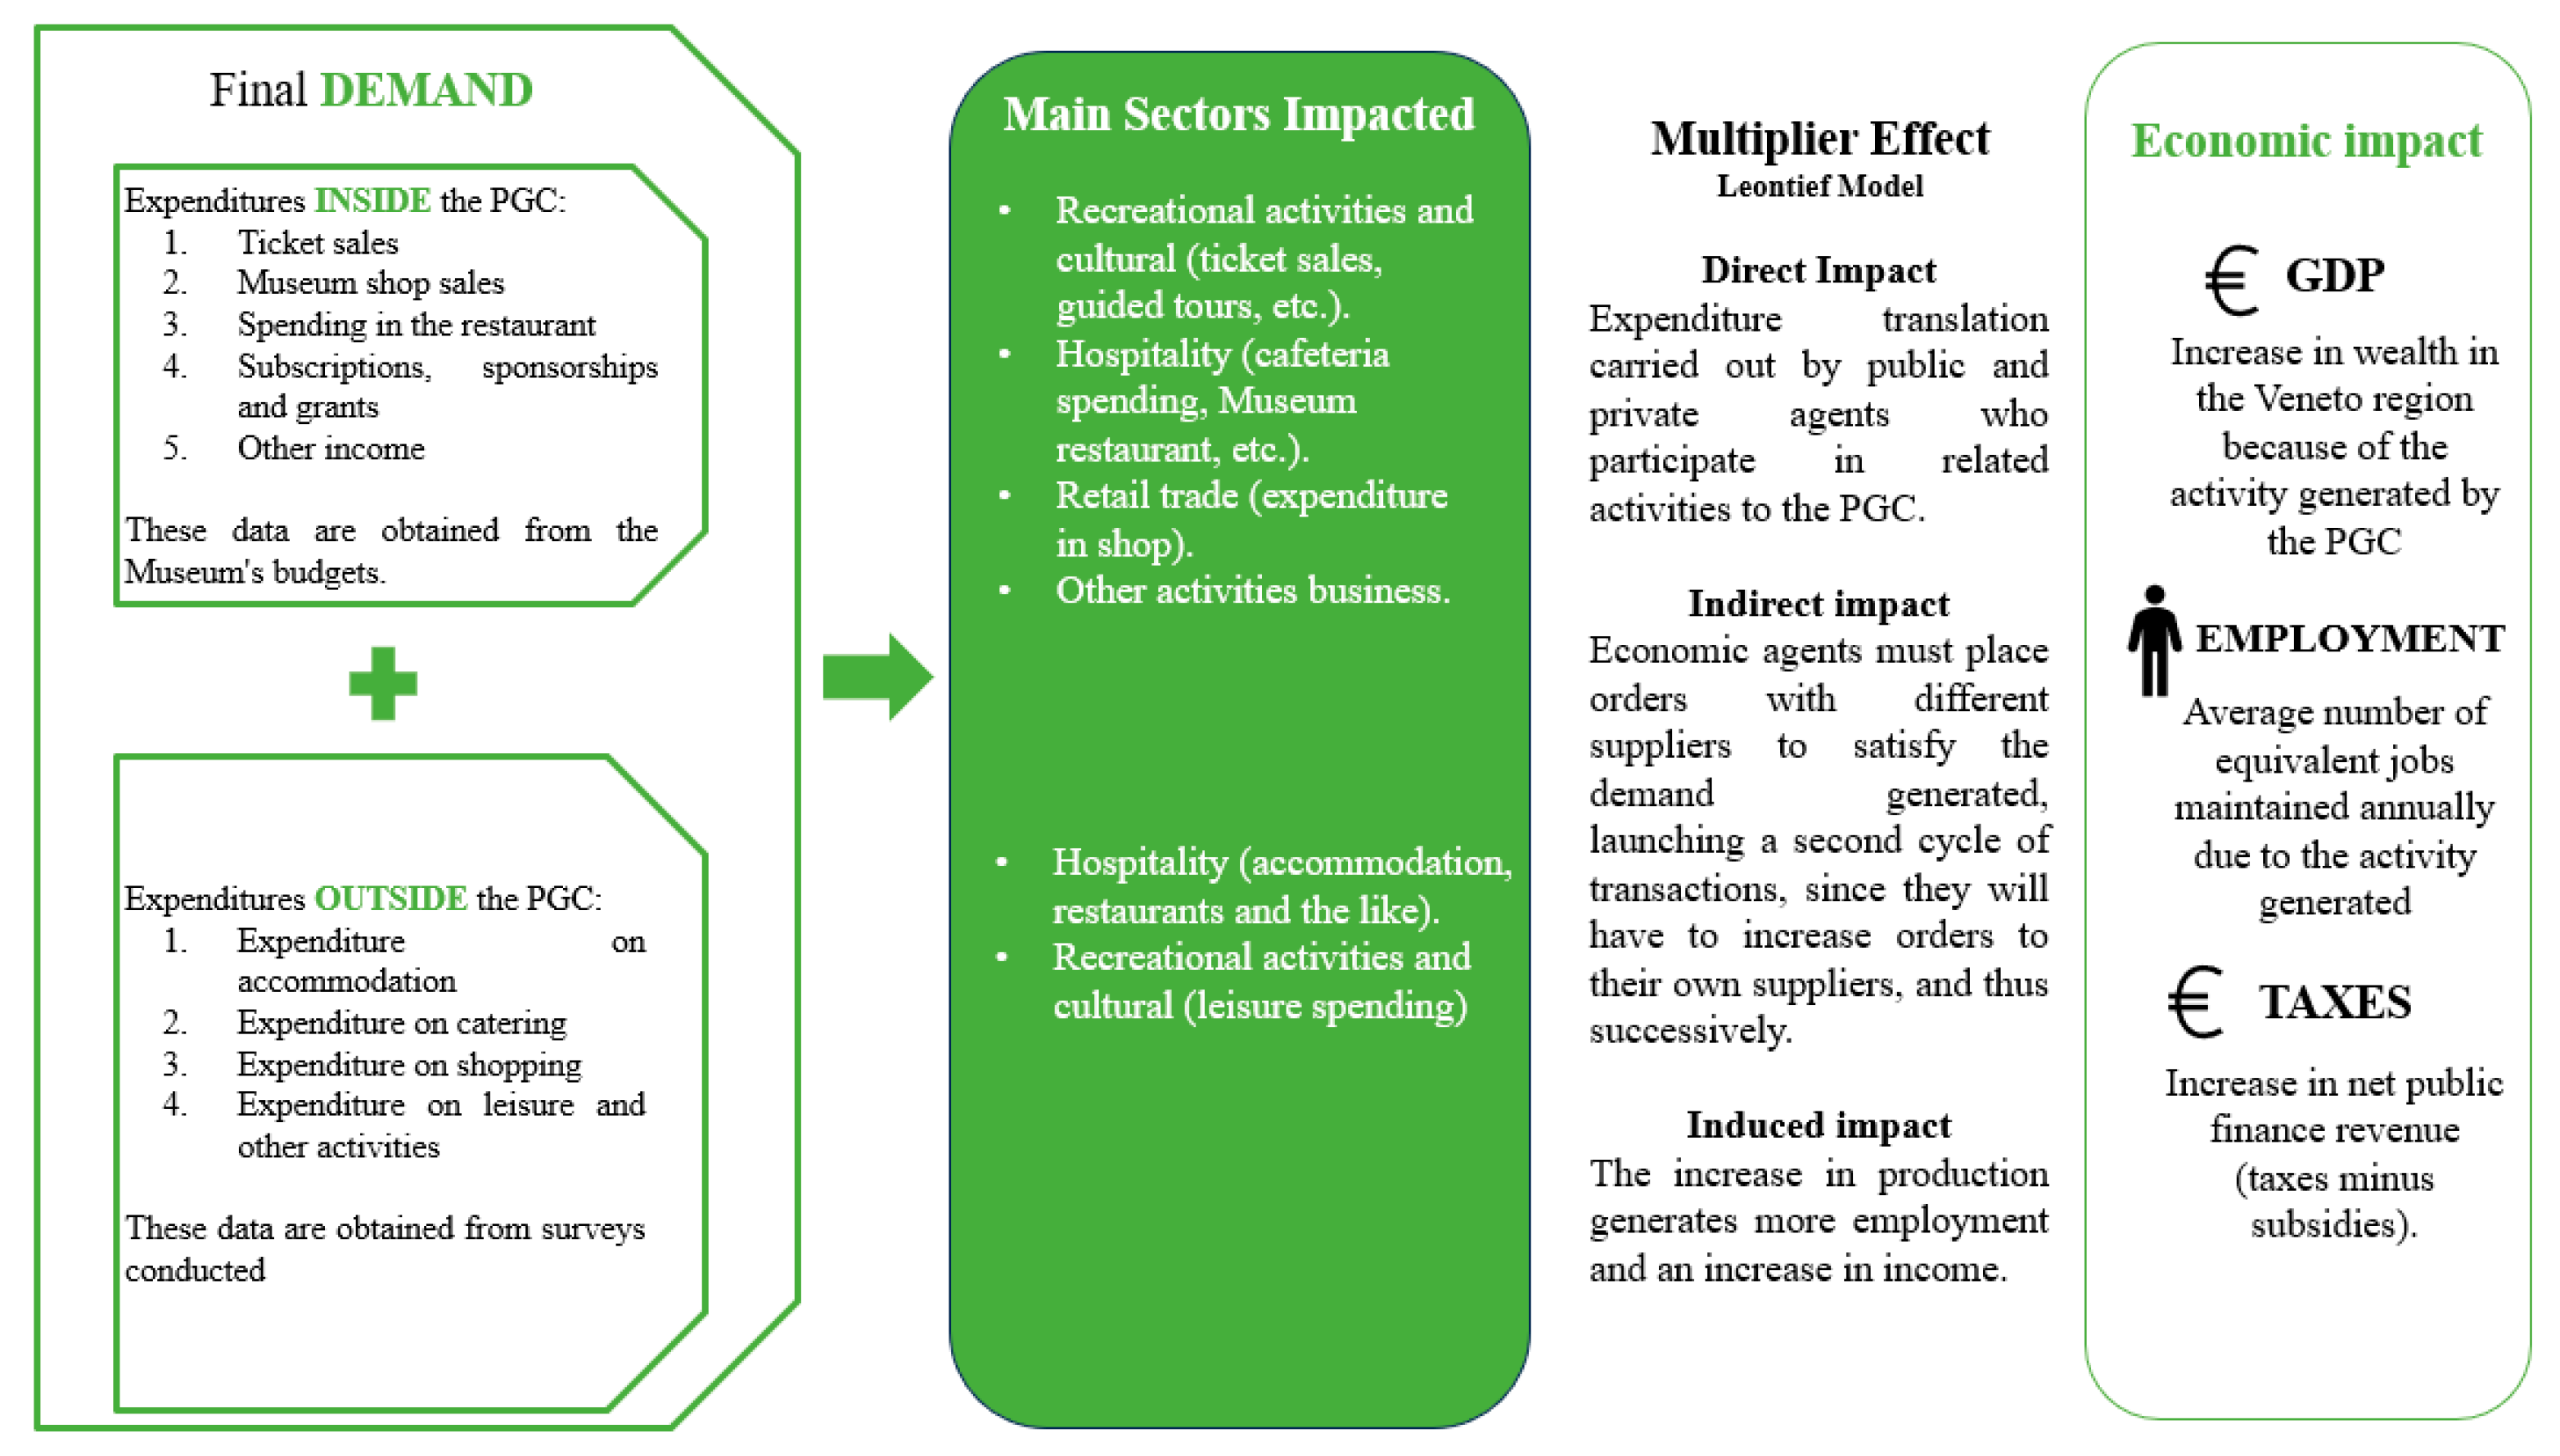
3.4. Economic Sustainability Analysis Input–Output Valuation
- (1)
- Impacts on GDP
- (2)
- Impacts on Employment
- (3)
- Impacts on Public Finances—Taxes Minus Subsidies
4. Discussion: Museums’ Sustainable Performance and SDGs
5. Concluding Remarks
Author Contributions
Funding
Institutional Review Board Statement
Informed Consent Statement
Data Availability Statement
Acknowledgments
Conflicts of Interest
Appendix A. Final Demand (2016–2021)

| 2016 Final Demand (in EUR) | |||||
|---|---|---|---|---|---|
| TOTAL | |||||
| Expenditure Inside the Museum | Ticket sales | 4,838,938 | 8,589,083 | ||
| Museum shop sales | 1,468,778.69 | ||||
| Expenditure in the museum’s restaurant | 328,000 | ||||
| Subscriptions, sponsorships, and grants | 1,474,689 | ||||
| Other revenues (guided tours and audio guide + renting museum spaces for location + exhibition fee) | 478,677.4 | ||||
| Expenditure Outside the Museum | No. Visitors | Average expenditure (EUR) | Total expenditure | ||
| Spending by museum’s visitors on accommodation | 413,498 | 664 | 274,562,672 | 658,702,314 | |
| Expenditure on food | 379 | 156,715,742 | |||
| Expenditure on shopping | 353 | 145,964,794 | |||
| Expenditure on leisure and other activities | 197 | 81,459,106 | |||
| TOTAL DEMAND | 667,291,397 | ||||
| 2017 Final Demand (in EUR) | |||||
|---|---|---|---|---|---|
| TOTAL | |||||
| Expenditure Inside the Museum | Ticket sales | 4,986,504 | 8,703,370 | ||
| Museum shop sales | 1,626,018.97 | ||||
| Expenditure in the museum’s restaurant | 337,000 | ||||
| Subscriptions, sponsorships, and grants | 1,366,642 | ||||
| Other revenues (guided tours and audio guide + renting museum spaces for location + exhibition fee) | 387,205.5 | ||||
| Expenditure Outside the Museum | No. Visitors | Average expenditure (EUR) | Total expenditure | ||
| Spending by museum’s visitors on accommodation | 427,283 | 664 | 283,715,912 | 680,661,819 | |
| Expenditure on food | 379 | 16,1940,257 | |||
| Expenditure on shopping | 353 | 150,830,899 | |||
| Expenditure on leisure and other activities | 197 | 84,174,751 | |||
| TOTAL DEMAND | 689,365,189 | ||||
| 2018 Final Demand (in EUR) | |||||
|---|---|---|---|---|---|
| TOTAL | |||||
| Expenditure Inside the Museum | Ticket sales | 4,414,884 | 7,976,332 | ||
| Museum shop sales | 1,381,639.19 | ||||
| Expenditure in the museum’s restaurant | 335,000 | ||||
| Subscriptions, sponsorships, and grants | 1,543,981 | ||||
| Other revenues (guided tours and audio guide + renting museum spaces for location + exhibition fee) | 300,828.14 | ||||
| Expenditure Outside the Museum | No. Visitors | Average expenditure (EUR) | Total expenditure | ||
| Spending by museum’s visitors on accommodation | 376,217 | 664 | 249,808,088 | 599,313,681 | |
| Expenditure on food | 379 | 142,586,243 | |||
| Expenditure on shopping | 353 | 132,804,601 | |||
| Expenditure on leisure and other activities | 197 | 74,114,749 | |||
| TOTAL DEMAND | 607,290,013 | ||||
| 2019 Final Demand (in EUR) | |||||
|---|---|---|---|---|---|
| TOTAL | |||||
| Expenditure Inside the Museum | Ticket sales | 4,100,416 | 8,013,900 | ||
| Museum shop sales | 1,542,757.2 | ||||
| Expenditure in the museum’s restaurant | 343,000 | ||||
| Subscriptions, sponsorships, and grants | 1,658,031 | ||||
| Other revenues (guided tours and audio guide + renting museum spaces for location + exhibition fee) | 369,695 | ||||
| Expenditure Outside the Museum | No. Visitors | Average expenditure (EUR) | Total expenditure | ||
| Spending by museum’s visitors on accommodation | 350,484 | 664 | 232,721,376 | 558,321,012 | |
| Expenditure on food | 379 | 132,833,436 | |||
| Expenditure on shopping | 353 | 123,720,852 | |||
| Expenditure on leisure and other activities | 197 | 69,045,348 | |||
| TOTAL DEMAND | 566,334,912 | ||||
| 2020 Final Demand (in EUR) | |||||
|---|---|---|---|---|---|
| TOTAL | |||||
| Expenditure Inside the Museum | Ticket sales | 1,984,751 | 5,288,969 | ||
| Museum shop sales | 644,271.33 | ||||
| Expenditure in the museum’s restaurant | 123,000 | ||||
| Subscriptions, sponsorships, and grants | 2,399,382 | ||||
| Other revenues (guided tours and audio guide + renting museum spaces for location + exhibition fee) | 137,564 | ||||
| Expenditure Outside the Museum | No. Visitors | Average expenditure (EUR) | Total expenditure | ||
| Spending by museum’s visitors on accommodation | 150,400 | 664 | 99,865,600 | 239,587,200 | |
| Expenditure on food | 379 | 57,001,600 | |||
| Expenditure on shopping | 353 | 53,091,200 | |||
| Expenditure on leisure and other activities | 197 | 29,628,800 | |||
| TOTAL DEMAND | 244,876,169 | ||||
| 2021 Final Demand (in EUR) | |||||
|---|---|---|---|---|---|
| TOTAL | |||||
| Expenditure Inside the Museum | Ticket sales | 4,897,945 | 9,933,243 | ||
| Museum shop sales | 1,849,321 | ||||
| Expenditure in the museum’s restaurant | 413,000 | ||||
| Subscriptions, sponsorships, and grants | 2,280,564 | ||||
| Other revenues (guided tours and audio guide + renting museum spaces for location + exhibition fee) | 492,413 | ||||
| Expenditure Outside the Museum | No. Visitors | Average expenditure (EUR) | Total expenditure | ||
| Spending by museum’s visitors on accommodation | 381,374 | 664 | 253,232,336 | 607,528,782 | |
| Expenditure on food | 379 | 144,540,746 | |||
| Expenditure on shopping | 353 | 134,625,022 | |||
| Expenditure on leisure and other activities | 197 | 75,130,678 | |||
| TOTAL DEMAND | 617,462,025 | ||||
Appendix B. Sector Aggregation
| ORIGINAL SYMMETRIC MATRIX—NACE 63 | AGGREGATION |
|---|---|
| Crop and animal production, hunting, and related services | Primary sector |
| Forestry and forest land use | |
| Fishing and aquaculture | |
| Mining and quarrying | |
| Food, beverage, and tobacco industries | consumer goods industry, |
| Manufacture of textiles; manufacture of wearing apparel, leather and related products | |
| Manufacture of wood and of products of wood and cork, except furniture; manufacture of articles of straw and plaiting materials | Manufacturing industry |
| Manufacture of paper and paper products | |
| Printing and reproduction of recorded media | |
| Manufacture of coke and refined petroleum products | |
| Manufacture of chemicals and chemical products | |
| Manufacture of basic pharmaceutical products and pharmaceutical preparations | |
| Manufacture of rubber and plastic products | |
| Manufacture of other non-metallic mineral products | |
| Manufacture of basic metals | |
| Manufacture of fabricated metal products, except machinery and equipment | |
| Manufacture of computer, electronic, and optical products | |
| Manufacture of electrical equipment | |
| Manufacture of machinery and equipment n.e.c. | |
| Manufacture of motor vehicles, trailers, and semi-trailers | |
| Manufacture of other transport equipment | |
| Manufacture of furniture; other manufacturing | |
| Repair and installation of machinery and equipment | |
| Electricity, gas, steam, and air conditioning supply | Electricity, gas, steam, and air conditioning supply; water supply and sewerage activities; waste management |
| Water collection, treatment, and supply | |
| Sewerage management; waste collection, treatment, and disposal activities; materials recovery; remediation and other waste management services | |
| Construction | Construction |
| Wholesale and retail trade and repair of motor vehicles and motorbikes | Trade, hotels and restaurants, and accommodation |
| Wholesale trade, except of motor vehicles and motorbikes | |
| Retail trade, excluding motor vehicles and motorbikes | |
| Accommodation service activities; food service activities | |
| Land transport and transport via pipelines | Transport, storage, and communication |
| Sea and water transport | |
| Air transport | |
| Warehousing and support activities for transportation | |
| Postal and courier activities | |
| Publishing activities | Financial institutions, insurance, real estate, and business services |
| Motion picture, video and television program production, music and sound recording activities; programming and broadcasting activities | |
| Telecommunications | |
| Computer programming, consultancy, and related activities; information service activities | |
| Financial service activities (except insurance and pension funding) | |
| Insurance, reinsurance, and pension funding, except compulsory social security | |
| Activities auxiliary to financial services and insurance activities | |
| Real estate activities | |
| Legal and accounting activities; head office activities; management consulting | |
| Architectural and engineering activities; technical testing and analysis | |
| Scientific research and development | |
| Advertising and market research | |
| Other professional, scientific, and technical activities; veterinary services | |
| Rental and leasing activities | |
| Personnel search, selection, supply activities | |
| Travel agency, tour operator, and other reservation service and related activities | |
| Investigation and security activities; building and landscape service activities; office administrative, office support, and other business support activities | |
| Public administration and defense; compulsory social insurance | Public administration, defense, and R&D |
| Education | |
| Health service activities | |
| Social work activities | |
| Creative, arts, and entertainment activities; libraries, archives, museums, and other cultural activities; gambling and betting activities | Art, entertainment, and recreation |
| Sporting, entertainment, and recreational activities | |
| Activities of membership organizations | Community, social, and personal services |
| Repair of computers and personal and household goods | |
| Other personal service activities | |
| Activities of households as employers of domestic personnel; undifferentiated goods- and services-producing activities of households for own use |
Appendix C. Impacts on GDP, Employment, and Net Public Finance Revenues (2016–2020)
| Impacts on GDP (EUR 1 Million, 2016)—by Industries | ||||
|---|---|---|---|---|
| Direct | Indirect | Induced | Total | |
| Trade, hotels and restaurants, and accommodation | 396.09 | 57.47 | 0.40 | 453.96 |
| Financial institutions, insurance, real estate, and business services | 59.28 | 187.45 | 1.24 | 247.96 |
| Consumer goods industry | 89.60 | 91.34 | 0.10 | 181.04 |
| Manufacturing industry | 30.18 | 98.27 | 1.02 | 129.48 |
| Art, entertainment, and recreation | 91.24 | 27.04 | 0.03 | 118.31 |
| Transport, storage, and communication | 0.00 | 43.99 | 0.74 | 44.73 |
| Primary sector and extractive industries | 0.02 | 43.71 | 0.50 | 44.23 |
| Electricity, gas, steam, and air conditioning supply; water supply and sewerage activities; waste management | 0.00 | 35.27 | 3.15 | 38.42 |
| Public administration, defense, and R&D | 0.29 | 15.07 | 0.07 | 15.44 |
| Construction | 0.00 | 12.01 | 0.11 | 12.12 |
| Community, social, and personal services | 0.59 | 2.73 | 0.02 | 3.34 |
| Impacts on Employment (No. of jobs, 2016)—by Industries | |||
|---|---|---|---|
| Direct + Indirect | Induced | Total | |
| Trade, hotels and restaurants, and accommodation | 4273 | 3 | 4277 |
| Financial institutions, insurance, real estate, and business services | 1338 | 7 | 1345 |
| Art, entertainment, and recreation | 719 | 0 | 719 |
| Consumer goods industry | 495 | 0 | 496 |
| Primary sector | 382 | 1 | 383 |
| Manufacturing industry | 373 | 2 | 375 |
| Transport, storage, and communication | 220 | 4 | 224 |
| Public administration, defense, and R&D | 144 | 1 | 145 |
| Construction | 83 | 1 | 83 |
| Electricity, gas, steam, and air conditioning supply; water supply and sewerage activities; waste management | 65 | 3 | 67 |
| Community, social, and personal services | 53 | 0 | 53 |
| Impacts on Net Revenues (EUR 1 Million, 2016)—by Industries | |||
|---|---|---|---|
| Direct + Indirect | Induced | Total | |
| Trade, hotels and restaurants, and accommodation | 54.83 | 0.04 | 54.9 |
| Art, entertainment, and recreation | 36.36 | 0.01 | 36.4 |
| Financial institutions, insurance, real estate, and business services | 24.14 | 0.15 | 24.3 |
| Consumer goods industry | 10.31 | 0.01 | 10.3 |
| Transport, storage, and communication | 6.63 | 0.11 | 6.7 |
| Primary sector | 4.97 | 0.04 | 5.0 |
| Public administration, defense, and R&D | 4.82 | 0.02 | 4.8 |
| Manufacturing industry | 3.45 | 0.02 | 3.5 |
| Construction | 1.28 | 0.01 | 1.3 |
| Community, social, and personal services | 0.69 | 0.01 | 0.7 |
| Electricity, gas, steam, and air conditioning supply; water supply and sewerage activities; waste management | 0.65 | −0.09 | 0.6 |
| Impactson GDP (EUR 1 Million, 2017)—by Industries | ||||
|---|---|---|---|---|
| Direct | Indirect | Induced | Total | |
| Trade, hotels and restaurants, and accommodation | 409.33 | 59.38 | 0.41 | 469.12 |
| Financial institutions, insurance, real estate, and business services | 15.52 | 157.01 | 1.04 | 173.58 |
| Consumer goods industry | 92.59 | 94.38 | 0.10 | 187.08 |
| Manufacturing industry | 31.20 | 101.53 | 1.06 | 133.79 |
| Art, entertainment, and recreation | 94.20 | 27.92 | 0.04 | 122.16 |
| Transport, storage, and communication | 45.68 | 82.08 | 1.01 | 128.77 |
| Primary sector and extractive industries | 0.02 | 45.16 | 0.52 | 45.70 |
| Electricity, gas, steam, and air conditioning supply; water supply and sewerage activities; waste management | 0.00 | 36.44 | 3.26 | 39.69 |
| Public administration, defense, and R&D | 0.27 | 15.56 | 0.07 | 15.91 |
| Construction | 0.00 | 12.41 | 0.11 | 12.52 |
| Community, social, and personal services | 0.55 | 2.82 | 0.03 | 3.39 |
| Impacts on Employment (No. of Jobs, 2017)—by Industries | |||
|---|---|---|---|
| Direct + Indirect | Induced | Total | |
| Trade, hotels and restaurants, and accommodation | 4784 | 4 | 4788 |
| Financial institutions, insurance, real estate, and business services | 1492 | 8 | 1500 |
| Art, entertainment, and recreation | 799 | 0 | 800 |
| Consumer goods industry | 555 | 0 | 555 |
| Primary sector | 428 | 1 | 429 |
| Manufacturing industry | 416 | 3 | 418 |
| Transport, storage, and communication | 220 | 4 | 224 |
| Public administration, defense, and R&D | 159 | 1 | 160 |
| Construction | 92 | 1 | 93 |
| Electricity, gas, steam, and air conditioning supply; water supply and sewerage activities; waste management | 72 | 3 | 75 |
| Community, social, and personal services | 51 | 0 | 52 |
| Impacts on Net Revenues (EUR 1 Million, 2017)—by Industries | |||
|---|---|---|---|
| Direct + Indirect | Induced | Total | |
| Trade, hotels and restaurants, and accommodation | 56.66 | 0.04 | 56.70 |
| Art, entertainment, and recreation | 37.55 | 0.01 | 37.56 |
| Financial institutions, insurance, real estate, and business services | 24.93 | 0.16 | 25.09 |
| Consumer goods industry | 10.66 | 0.01 | 10.66 |
| Transport, storage, and communication | 6.63 | 0.11 | 6.74 |
| Primary sector | 5.14 | 0.04 | 5.18 |
| Public administration, defense, and R&D | 4.97 | 0.02 | 4.99 |
| Manufacturing industry | 3.56 | 0.02 | 3.58 |
| Construction | 1.32 | 0.01 | 1.34 |
| Community, social, and personal services | 0.70 | 0.01 | 0.70 |
| Electricity, gas, steam, and air conditioning supply; water supply and sewerage activities; waste management | 0.67 | −0.10 | 0.57 |
| Impacts on GDP (EUR 1 Million, 2018)—by Industries | ||||
|---|---|---|---|---|
| Direct | Indirect | Induced | Total | |
| Trade, hotels and restaurants, and accommodation | 360.41 | 52.30 | 0.36 | 413.08 |
| Financial institutions, insurance, real estate, and business services | 13.65 | 138.32 | 0.92 | 152.88 |
| Consumer goods industry | 81.54 | 83.11 | 0.09 | 164.74 |
| Manufacturing industry | 27.46 | 89.43 | 0.93 | 117.82 |
| Art, entertainment, and recreation | 83.06 | 24.61 | 0.03 | 107.71 |
| Transport, storage, and communication | 40.22 | 72.30 | 0.89 | 113.41 |
| Primary sector and extractive industries | 0.02 | 39.78 | 0.46 | 40.25 |
| Electricity, gas, steam, and air conditioning supply; water supply and sewerage activities; waste management | 0.00 | 32.10 | 2.87 | 34.97 |
| Public administration, defense, and R&D | 0.31 | 13.72 | 0.07 | 14.09 |
| Construction | 0.00 | 10.93 | 0.10 | 11.03 |
| Community, social, and personal services | 0.62 | 2.48 | 0.02 | 3.12 |
| Impacts on Employment (No. of Jobs, 2018)—by Industries | |||
|---|---|---|---|
| Direct + Indirect | Induced | Total | |
| Trade, hotels and restaurants, and accommodation | 4213 | 3 | 4216 |
| Financial institutions, insurance, real estate, and business services | 1314 | 7 | 1321 |
| Art, entertainment, and recreation | 705 | 0 | 705 |
| Consumer goods industry | 488 | 0 | 489 |
| Primary sector | 377 | 1 | 378 |
| Manufacturing industry | 366 | 2 | 368 |
| Transport, storage, and communication | 220 | 4 | 224 |
| Public administration, defense, and R&D | 140 | 1 | 141 |
| Construction | 81 | 1 | 82 |
| Electricity, gas, steam, and air conditioning supply; water supply and sewerage activities; waste management | 64 | 3 | 66 |
| Community, social, and personal services | 47 | 0 | 48 |
| Impacts on Net Revenues (EUR 1 Million, 2018)—by Industries | |||
|---|---|---|---|
| Direct + Indirect | Induced | Total | |
| Trade, hotels and restaurants, and accommodation | 49.89 | 0.04 | 49.93 |
| Art, entertainment, and recreation | 33.11 | 0.01 | 33.11 |
| Financial institutions, insurance, real estate, and business services | 21.96 | 0.14 | 22.10 |
| Consumer goods industry | 9.39 | 0.01 | 9.39 |
| Transport, storage, and communication | 6.63 | 0.11 | 6.74 |
| Primary sector | 4.52 | 0.04 | 4.56 |
| Public administration, defense, and R&D | 4.40 | 0.02 | 4.42 |
| Manufacturing industry | 3.14 | 0.02 | 3.16 |
| Construction | 1.17 | 0.01 | 1.18 |
| Community, social, and personal services | 0.64 | 0.00 | 0.65 |
| Electricity, gas, steam, and air conditioning supply; water supply and sewerage activities; waste management | 0.59 | −0.09 | 0.50 |
| Impacts on GDP (EUR 1 Million, 2019)—by Industries | ||||
|---|---|---|---|---|
| Direct | Indirect | Induced | Total | |
| Trade, hotels and restaurants, and accommodation | 335.85 | 48.77 | 0.34 | 384.96 |
| Financial institutions, insurance, real estate, and business services | 12.78 | 129.00 | 0.86 | 142.63 |
| Consumer goods industry | 75.99 | 77.45 | 0.08 | 153.52 |
| Manufacturing industry | 25.67 | 83.43 | 0.87 | 109.97 |
| Art, entertainment, and recreation | 77.54 | 22.97 | 0.03 | 100.54 |
| Transport, storage, and communication | 37.49 | 67.42 | 0.83 | 105.74 |
| Primary sector and extractive industries | 0.02 | 37.07 | 0.43 | 37.52 |
| Electricity, gas, steam, and air conditioning supply; water supply and sewerage activities; waste management | 0.00 | 29.94 | 2.68 | 32.62 |
| Public administration, defense, and R&D | 0.33 | 12.80 | 0.06 | 13.19 |
| Construction | 0.00 | 10.19 | 0.09 | 10.28 |
| Community, social, and personal services | 0.66 | 2.32 | 0.02 | 3.00 |
| Impacts on Employment(No. of Jobs, 2019)—by Industries | |||
|---|---|---|---|
| Direct + Indirect | Induced | Total | |
| Trade, hotels and restaurants, and accommodation | 3926 | 3 | 3929 |
| Financial institutions, insurance, real estate, and business services | 1226 | 6 | 1232 |
| Art, entertainment, and recreation | 658 | 0 | 658 |
| Consumer goods industry | 455 | 0 | 455 |
| Primary sector | 351 | 1 | 352 |
| Manufacturing industry | 342 | 2 | 344 |
| Transport, storage, and communication | 220 | 4 | 224 |
| Public administration, defense, and R&D | 131 | 1 | 132 |
| Construction | 76 | 1 | 77 |
| Electricity, gas, steam, and air conditioning supply; water supply and sewerage activities; waste management | 60 | 2 | 62 |
| Community, social, and personal services | 46 | 0 | 46 |
| Impacts on Net Revenues (EUR 1 Million, 2019)—by Industries | |||
|---|---|---|---|
| Direct + Indirect | Induced | Total | |
| Trade, hotels and restaurants, and accommodation | 46.49 | 0.03 | 46.53 |
| Art, entertainment, and recreation | 30.90 | 0.01 | 30.91 |
| Financial institutions, insurance, real estate, and business services | 20.48 | 0.13 | 20.62 |
| Consumer goods industry | 8.75 | 0.00 | 8.75 |
| Transport, storage, and communication | 6.63 | 0.11 | 6.74 |
| Primary sector | 4.22 | 0.03 | 4.25 |
| Public administration, defense, and R&D | 4.12 | 0.02 | 4.14 |
| Manufacturing industry | 2.93 | 0.02 | 2.95 |
| Construction | 1.09 | 0.01 | 1.10 |
| Community, social, and personal services | 0.62 | 0.00 | 0.62 |
| Electricity, gas, steam, and air conditioning supply; water supply and sewerage activities; waste management | 0.55 | −0.08 | 0.47 |
| Impacts on GDP (EUR 1 Million, 2020)—by Industries | ||||
|---|---|---|---|---|
| Direct | Indirect | Induced | Total | |
| Trade, hotels and restaurants, and accommodation | 89.03 | 13.09 | 0.09 | 102.21 |
| Financial institutions, insurance, real estate, and business services | 3.38 | 34.84 | 0.23 | 38.45 |
| Consumer goods industry | 20.14 | 20.58 | 0.02 | 40.74 |
| Manufacturing industry | 6.81 | 22.50 | 0.24 | 29.54 |
| Art, entertainment, and recreation | 21.69 | 6.34 | 0.01 | 28.04 |
| Transport, storage, and communication | 9.95 | 18.13 | 0.22 | 28.30 |
| Primary sector and extractive industries | 0.00 | 9.88 | 0.12 | 10.00 |
| Electricity, gas, steam, and air conditioning supply; water supply and sewerage activities; waste management | 0.00 | 8.13 | 0.73 | 8.86 |
| Public administration, defense, and R&D | 0.66 | 3.51 | 0.02 | 4.18 |
| Construction | 0.00 | 2.75 | 0.02 | 2.78 |
| Community, social, and personal services | 1.31 | 0.64 | 0.01 | 1.95 |
| Impacts on Employment (No. of Jobs, 2020)—by Industries | |||
|---|---|---|---|
| Direct + Indirect | Induced | Total | |
| Trade, hotels and restaurants, and accommodation | 1042 | 1 | 1043 |
| Financial institutions, insurance, real estate, and business services | 330 | 2 | 332 |
| Art, entertainment, and recreation | 184 | 4 | 224 |
| Consumer goods industry | 220 | 0 | 184 |
| Primary sector | 121 | 0 | 121 |
| Manufacturing industry | 93 | 0 | 94 |
| Transport, storage, and communication | 92 | 1 | 92 |
| Public administration, defense, and R&D | 40 | 0 | 40 |
| Construction | 20 | 0 | 30 |
| Electricity, gas, steam, and air conditioning supply; water supply and sewerage activities; waste management | 30 | 0 | 21 |
| Community, social, and personal services | 16 | 1 | 17 |
| Impacts on Net Revenues (EUR 1 Million, 2020)—by Industries | |||
|---|---|---|---|
| Direct + Indirect | Induced | Total | |
| Trade, hotels and restaurants, and accommodation | 12.34 | 0.01 | 12.35 |
| Art, entertainment, and recreation | 8.62 | 0.00 | 8.62 |
| Financial institutions, insurance, real estate, and business services | 6.63 | 0.11 | 6.74 |
| Consumer goods industry | 5.52 | 0.04 | 5.55 |
| Transport, storage, and communication | 2.32 | 0.00 | 2.32 |
| Primary sector | 1.31 | 0.00 | 1.32 |
| Public administration, defense, and R&D | 1.12 | 0.01 | 1.13 |
| Manufacturing industry | 0.78 | 0.01 | 0.79 |
| Construction | 0.40 | 0.00 | 0.40 |
| Community, social, and personal services | 0.29 | 0.00 | 0.30 |
| Electricity, gas, steam, and air conditioning supply; water supply and sewerage activities; waste management | 0.15 | −0.02 | 0.13 |
| Impacts on GDP (EUR 1 Million, 2021)—by Industries | ||||
|---|---|---|---|---|
| Direct | Indirect | Induced | Total | |
| Trade, hotels and restaurants, and accommodation | 144.12 | 21.04 | 0.15 | 165.30 |
| Financial institutions, insurance, real estate, and business services | 5.52 | 55.78 | 0.37 | 61.67 |
| Consumer goods industry | 32.60 | 33.27 | 0.04 | 65.90 |
| Manufacturing industry | 11.06 | 36.07 | 0.38 | 47.51 |
| Art, entertainment, and recreation | 34.01 | 10.02 | 0.01 | 44.04 |
| Transport, storage, and communication | 16.13 | 29.11 | 0.36 | 45.60 |
| Primary sector and extractive industries | 0.01 | 15.94 | 0.18 | 16.13 |
| Electricity, gas, steam, and air conditioning supply; water supply and sewerage activities; waste management | 0.00 | 12.97 | 1.16 | 14.13 |
| Public administration, defense, and R&D | 0.48 | 5.57 | 0.03 | 6.07 |
| Construction | 0.00 | 4.41 | 0.04 | 4.45 |
| Community, social, and personal services | 0.96 | 1.01 | 0.01 | 1.98 |
| Impacts on Employment (No. of Jobs, 2021)—by Industries | |||
|---|---|---|---|
| Direct + Indirect | Induced | Total | |
| Trade, hotels and restaurants, and accommodation | 1686 | 1 | 1687 |
| Financial institutions, insurance, real estate, and business services | 530 | 3 | 533 |
| Art, entertainment, and recreation | 288 | 0 | 288 |
| Consumer goods industry | 195 | 4 | 224 |
| Primary sector | 220 | 0 | 195 |
| Manufacturing industry | 151 | 1 | 151 |
| Transport, storage, and communication | 148 | 1 | 148 |
| Public administration, defense, and R&D | 60 | 0 | 60 |
| Construction | 33 | 0 | 33 |
| Electricity, gas, steam, and air conditioning supply; water supply and sewerage activities; waste management | 26 | 0 | 30 |
| Community, social, and personal services | 30 | 1 | 27 |
| Impacts on Net Revenues (EUR 1 Million, 2021)—by Industries | |||
|---|---|---|---|
| Direct + Indirect | Induced | Total | |
| Trade, hotels and restaurants, and accommodation | 19.96 | 0.02 | 19.98 |
| Art, entertainment, and recreation | 13.54 | 0.00 | 13.54 |
| Financial institutions, insurance, real estate, and business services | 8.85 | 0.06 | 8.91 |
| Consumer goods industry | 6.63 | 0.11 | 6.74 |
| Transport, storage, and communication | 3.75 | 0.00 | 3.76 |
| Primary sector | 1.90 | 0.01 | 1.91 |
| Public administration, defense, and R&D | 1.81 | 0.01 | 1.83 |
| Manufacturing industry | 1.26 | 0.01 | 1.27 |
| Construction | 0.47 | 0.00 | 0.48 |
| Community, social, and personal services | 0.41 | 0.00 | 0.41 |
| Electricity, gas, steam, and air conditioning supply; water supply and sewerage activities; waste management | 0.24 | −0.03 | 0.20 |
References
- Bagliani, M.; Villa, E.; Gattolin, M.; Patterson, T.; Tiezzi, E. The ecological footprint analysis for the Province of Venice and the relevance of tourism. Adv. Archit. Ser. 2004, 18, 123–131. [Google Scholar]
- Bertocchi, D.; Visentin, F. “The Overwhelmed City”: Physical and Social Over-Capacities of Global Tourism in Venice. Sustainability 2019, 11, 6937. [Google Scholar] [CrossRef]
- Cerquetti, M.; Montella, M.M. Meeting sustainable development goals (SDGs) in museum evaluation systems. The case of the Italian National Museum System (NMS). Sinergie Ital. J. Manag. 2021, 39, 125–147. [Google Scholar] [CrossRef]
- Adams, E. Towards Sustainability Indicators for Museum in Australia. 2010. Available online: https://core.ac.uk/download/pdf/30683631.pdf (accessed on 15 January 2024).
- Silva, M.D.; Henderson, J. Sustainability in conservation practice. J. Inst. Conserv. 2011, 34, 5–15. [Google Scholar] [CrossRef]
- Di Pietro, L.; Mugion, R.G.; Renzi, M.F.; Toni, M. An Audience-centric approach for Museums Sustainability. Sustainability 2014, 6, 5745–5762. [Google Scholar] [CrossRef]
- Logan, R.; Sutter, G.C. Sustainability and Museum Education: What Future are we educating for? J. Incl. Mus. 2012, 4, 16. [Google Scholar] [CrossRef]
- Merriman, N. Museum collections and sustainability. Cult. Trend 2008, 17, 3–21. [Google Scholar] [CrossRef]
- Recuero, N.; Virto, K.; Lopez, M.F.B.; San-Martin, S. How can European museums reach sustainability? Tour. Rev. 2017, 72, 303–318. [Google Scholar] [CrossRef]
- Remacha-González, L.; Díaz-Campo, J. Sustainability Indicators of Spanish Museums. An Analysis of the Thyssen, MNAC and Guggenheim Reports. Revista ESPACIOS. 2 June 2020. Available online: https://hal.science/hal-03213344/document (accessed on 15 February 2024).
- United Nations General Assembly. The Future We Want: Resolution/Adopted by the General Assembly. 2012. Available online: https://digitallibrary.un.org/record/734344?ln=es (accessed on 15 February 2024).
- Wickham, M.; Lehman, K. Communicating sustainability priorities in the museum sector. J. Sustain. Tour. 2014, 23, 1011–1028. [Google Scholar] [CrossRef]
- D’Adamo, I.; Di Carlo, C.; Gastaldi, M.; Rossi, E.N.; Uricchio, A.F. Economic Performance, Environmental Protection and Social Progress: A Cluster Analysis Comparison towards Sustainable Development. Sustainability 2024, 16, 5049. [Google Scholar] [CrossRef]
- Guggenheim Museum Bilbao. El Museo Guggenheim Bilbao Presenta un Plan de Sostenibilidad Ambiental Pionero en el Sector. Nota de Prensa; Guggenheim Museum Bilbao: Bilbao, Spain, 2022. [Google Scholar]
- OECD/ICOM. Culture and Local Development: Maximising the Impact: A Guide for Local Governments, Communities and Museums; OECD Local Economic and Employment Development (LEED) Papers, No. 2019/07; OECD Publishing: Paris, France, 2019. [Google Scholar] [CrossRef]
- Museum Associations. Sustainability and Museums: Your Change to Make a Difference. 2008. Available online: https://archive-media.museumsassociation.org/sustainability_web_final.pdf (accessed on 15 February 2024).
- McGhie, H.A. Museums and the Sustainable Development Goals: A How-to Guide for Museums, Galleries, the Cultural Sector and Their Partners; Curating Tomorrow: Liverpool, UK, 2019. [Google Scholar]
- Onofri, L. Sustainability in High-Excellence Italian Food and Wine; Routledge: London, UK, 2021. [Google Scholar]
- Pencarelli, T.; Cerquetti, M.; Splendiani, S. The sustainable management of museums: An Italian perspective. Tour. Hosp. 2016, 22, 29–46. [Google Scholar] [CrossRef]
- Pop, I.L.; Borza, A.; Buiga, A.; Ighian, D.; Toader, R. Achieving cultural sustainability in museums: A step toward sustainable development. Sustainability 2019, 11, 970. [Google Scholar] [CrossRef]
- Popovic, T.K. Applicability of Sustainability Indicators to Wastewater Treatment Processes. In Proceedings of the 23rd European Symposium on Computer Aided Process Engineering, Lappeenrata, Finland, 9–12 June 2013; Elsevier: Amsterdam, The Netherlands, 2013; pp. 931–936. [Google Scholar]
- Nassef, M.; Mohammed, N.; Ibrahim, M. Investigating the Socio-Economic Sustainability within the Egyptian Museums over the Last Decade. Sustainability 2023, 15, 16746. [Google Scholar] [CrossRef]
- Guggenheim Museum Bilbao. Impacto de las Actividades del Museo Guggenheim Bilbao en la Economía del País Vasco en el Año 2012; Guggenheim Museum Bilbao: Bilbao, Spain, 2012. [Google Scholar]
- Natural History Museum. A planetary emergency: Our response—Strategy to 2031. 2019. Available online: https://www.nhm.ac.uk/content/dam/nhmwww/about-us/our-vision/strategy-to-2031.pdf (accessed on 15 February 2024).
- Pop, I.L.; Borza, A. Factors Influencing Museum Sustainability and Indicators for Museum Sustainability Measurement. Sustainability 2016, 8, 101. [Google Scholar] [CrossRef]
- Guggenheim Museum Bilbao. Informe de Responsabilidad Social Corporativa. Fundación del Museo Guggenheim Bilbao. 2021; Guggenheim Museum Bilbao: Bilbao, Spain, 2022. [Google Scholar]
- Guggenheim Museum Bilbao. Environmental Sustainability Strategic Framework. 2023. Available online: https://cms.guggenheim-bilbao.eus/uploads/2023/05/Environmental-Sustainability-Strategic-Framework-14_12_2021.pdf (accessed on 15 February 2024).
- Vanni, M. The Economic Sustainability of Museums. New Business Models and Unprecedent Relationships with SMEs. Finestre sull’ Arte. 22 September 2021. Available online: https://www.finestresullarte.info/en/opinions/the-economic-sustainability-of-museums-new-business-models-and-unprecedented-relationships-with-smes (accessed on 20 February 2024).
- De Boni, N. Life Cycle Assessment for a Glass Production in Murano. Master’s Thesis, University of Padova, Padova, Italy, 2020. [Google Scholar]
- ISO 14040; Environmental Management—Life Cycle Assessment—Principles and Framework. Technical Committee ISO/TC 207, Environmental Management, Subcommittee SC 5, Life Cycle Assessment. 2006. Available online: https://www.iso.org/obp/ui/en/#iso:std:iso:14040:ed-2:v1:en (accessed on 20 February 2024).
- ISO 14044; Environmental Management—Life Cycle Assessment—Requirements and Guidelines. Technical Committee: ISO/TC 207, Environmental Management, Subcommittee SC 5, Life cycle assessment. 2006. Available online: https://www.iso.org/obp/ui/en/#iso:std:iso:14044:ed-1:v1:en (accessed on 20 February 2024).
- Simonen, K. Life Cycle Assessment; Routledge: London, UK, 2014. [Google Scholar]
- Department for Environment, Food and Rural Affairs (DEFRA). UK Government Conversion Factors for Greenhouse Gas (GHG) Reporting; DEFRA: Carlisle, UK, 2023. [Google Scholar]
- MITECO. Factores de Emisión 2007–2022; MITECO: Madrid, Spain, 2023. [Google Scholar]
- Nowtricity. Real Time Electricity Production Emissions by Country. Italy Profile. 2023. Available online: https://www.nowtricity.com/country/italy/ (accessed on 15 February 2024).
- EBRD. Methodology for the Economic Assessment of EBRD Projects with High Greenhouse Gas Emissions; EBRD: London, UK, 2019. [Google Scholar]
- Rennert, K.E. Comprehensive evidence implies a higher social cost of CO2. Nature 2022, 610, 687–692. [Google Scholar] [CrossRef] [PubMed]
- CGIA. Rapporto Economico Venezia. Associazione Artigiani e Piccole Imprese; CGIA Mestre: Venice, Italy, 2020. [Google Scholar]
- Guggenheim Museum Bilbao. Impacto de las Actividades del Museo Guggenheim Bilbao en la Economía del País Vasco en el Año 2010; Guggenheim Museum Bilbao: Bilbao, Spain, 2011. [Google Scholar]
- Natural History Museum. Sustainability Report 2019–2020; Natural History Museum: Hertfordshire, UK, 2020. [Google Scholar]
- Aghion, P.; Howitt, P.; Brant-Collett, M.; García-Peñalosa, C. Endogenous Growth Theory; MIT Press: Cambridge, MA, USA, 1998. [Google Scholar]


| Object of the study | Life cycle assessment (LCA) of the regular activities of the Peggy Guggenheim Collection. |
| System boundaries | The analysis considers the direct and indirect impacts resulting from the museum’s regular activities, including those arising from organizing exhibitions within the premises. The processes considered in this LCA are raw materials and product acquisition and the use/consumption stage. Extraordinary building maintenance activities and impacts from the construction and demolition of buildings are excluded. The treatment of waste arising from materials is also excluded from the estimation given that both waste transportation and waste management are outsourced by the museum. Information about the distances covered and waste treatment is not available. |
| Definition of the system | The physical perimeter of the Peggy Guggenheim Collection in Venice. |
| Functional unit | One year of regular museum activities [January 1st–December 31st]. |
| Identification of data | The impact category analyzed is CO2e emissions (a carbon dioxide equivalent or CO2 equivalent, abbreviated as CO2e, is a metric measure used to compare the emissions from various greenhouse gases on the basis of their global-warming potential (GWP), by converting amounts of other gases to the equivalent amount of carbon dioxide with the same global warming potential. Carbon dioxide equivalents are commonly expressed as million metric tonnes of carbon dioxide equivalents, abbreviated as MMTCDE. The carbon dioxide equivalent for a gas is derived by multiplying the tonnes of the gas by the associated GWP: MMTCDE = (million metric tonnes of a gas) × (GWP of the gas). For example, the GWP for methane is 25, and for nitrous oxide, 298. This means that emissions of 1 million metric tonnes of methane and nitrous oxide is equivalent to emissions of 25 and 298 million metric tonnes of carbon dioxide, respectively.). |
| Category | Environmental Issue Covered |
|---|---|
| Average natural gas consumption | Energy Efficiency, Climate Change |
| Average electricity consumption | Energy Efficiency, Climate Change |
| Average water consumption | Water Management |
| Septic sludge waste production | Waste Management |
| Internships (travel) | |
| - Plane | Climate Change, Air Pollution |
| - Train | Climate Change |
| Artwork transport | |
| - Truck | Climate Change, Air Pollution |
| - Plane | Climate Change, Air Pollution |
| Material consumption | |
| - Varnish | Air Pollution, Climate Change |
| - Wood packaging | Climate Change |
| - Neoprene | Climate Change |
| - Wood MDF | Climate Change |
| - Plexiglass | Climate Change |
| Category | Unit | Value |
|---|---|---|
| Average natural gas consumption | Sm3 (Sm3/h (standard cubic meters per hour) is a measure of the gas flow rate at standard temperature and pressure conditions, but with the gas corrected to a standard composition)/year | 36,221 |
| Average electricity consumption | kWh/year | 557,033.9 |
| Average water consumption | m3/year | 7185.7 |
| Septic sludge waste production | m3/year | 46.8 |
| Internships (travels) | ||
| - Plane | Km | 953,217 |
| - Train | Km | 9476 |
| Artwork transport | ||
| - Truck | Km | 3340 |
| - Plane | Km | 48,026 |
| Material consumption | ||
| - Varnish | l/year | 111.1 |
| - Wood packaging | Kg/year | 41,731.2 |
| - Neoprene | Kg/year | 115.2 |
| - Wood MDF | Kg/year | 756 |
| - Plexiglass | Kg/year | 113.3 |
| Category | Description | Data Base | Factor Emission | Annual kgCO2e Emissions |
|---|---|---|---|---|
| Gas consumption | It considers the impacts linked to the distribution of district heat and steam and to gas consumption at the museum’s facilities | [33,34] | 0.009 kgCO2e/kWh (distribution) 0.182 kgCO2e/kWh (consumption) | 83,075.4 |
| Electricity consumption | It considers the impacts linked to the transmission and distribution of electricity and to its consumption at the museum’s facilities | [33,34] | 0.018 kgCO2e/kWh (distribution) 0.389 kgCO2e/kWh (consumption) | 226,668.2 |
| Water consumption | It considers the impact linked to water supply (water delivered through the mains supply network) and water treatment (water returned into the sewage system through mains drains) | [33] | 0.177 KgCO2e/m3 (supply) 0.201 kgCO2e/m3 (treatment) | 2716.2 |
| Septic sludge waste production | It considers the impacts linked to the treatment processes which generally take place at the production site (the museum). The activity starts with the inputs from the treatment processes and ends with the provision of treatment. | SimaPro | 7.59 kgCO2e/m3 | 355.5 |
| Internships | 169,766.5 | |||
| - Plane | It considers the impacts linked to the use of fuel per passenger on aircraft used for transport from their origin city to Venice. A distinction is made between domestic, short-haul (Europe), and international or long-haul flights. Both the number of internships coming from each destination and the total number of km traveled are taken into account. | [33] | 0.273 kgCO2e/passenger/km (domestic) 0.186 kgCO2e/passenger/km (short-haul) 0.176 kgCO2e/passenger/km (international) | 169,430.4 |
| - Train | It considers the impacts linked to the use of trains as a means of transport. This is calculated for national rail. Both the number of internships and the total number of km traveled are taken into account. | [33] | 0.035 kgCO2e/passenger/km | 336.0 |
| Artwork transport | 1,465,240.1 | |||
| - Truck | It considers the impacts linked to the transport of artwork by trucks (to and from the museum). Artworks coming from the same origin are considered to be transported together. The number of km is taken into account. | [35] | 0.594 kgCO2e/km | 1984.0 |
| - Plane | It considers the impacts linked to the transport of artwork by plane (to and from the museum). Artworks coming from the same origin are considered to be transported together and the only cargo on the aircraft. The number of km is taken into account. | [35] (The conversion factor used to calculate the emissions linked to the use of kerosene has been obtained from [35]. However, this factor was expressed in kgCO2e/L, for which it was necessary to know the average number of liters of kerosene used in aircraft. From the official Boeing website, we obtain information on the 747–400 model, with a capacity of 216,840 L of fuel and a maximum range of 13,445 km. If we assume that 30% of the fuel is left as surplus for safety reasons, we would obtain a fuel consumption of 12.4 L/km. This value has been set as representative of the consumption of an aircraft, although it is true that this varies according to the type of aircraft, the load, functionality (commercial, cargo, mixed), etc.) | 2.539 kgCO2e/L | 1,463,256.2 |
| Exhibition’s material | 42,668.3 | |||
| - Varnish | It considers the impact linked to all activities that start at the gate of the process that produces acrylic varnish and ends with the supply of the product to the museum. Transport is included. | SimaPro version 9.5 (The software provided us with the information expressed in kg CO2e for each kg of varnish produced. The museum’s consumption data were in liters of varnish. Therefore, the conversion factor kg/l = 1.3 was used.) | 1.97 kgCO2e/kg | 284.5 |
| - Wood packaging | It considers the impact linked to all activities that start at the gate of the process that produces plywood and ends with the supply of the product to the museum. Transport is included. | SimaPro (The software provided us with the information expressed in kg CO2e for each m3 of plywood produced. The museum’s consumption data were in kg of plywood. Therefore, the conversion factor m3/ton = 2 was used.) | 491 kgCO2e/m3 | 40,980.0 |
| - Neoprene | It considers the impact linked to all activities that start at the gate of the process that produces synthetic rubber and ends with the supply of the product to the museum. Transport is included. | SimaPro version 9.5 | 2.72 kgCO2e/kg | 313.3 |
| - Wood MDF | It considers the impact linked to all activities that start at the gate of the process that produces medium-density fiberboard (MDF) and ends with the supply of the product to the museum. Transport is included. | SimaPro (The software provided us with the information expressed in kg CO2e for each m3 of wood MDF produced. The museum’s consumption data were in kg of wood MDF. Therefore, the conversion factor m3/ton = 2 was used.) | 641 kgCO2e/m3 | 969.2 |
| - Plexiglass | It considers the impact linked to all activities that start at the gate of the process that produces flat glass and ends with the supply of the product to the museum. Transport is included. | SimaPro | 1.07 kgCO2e/kg | 121.2 |
| Total annual emissions | 1,990,490.2 | |||
| Categories | Economic Value of CO2e Emissions (EUR) | |
|---|---|---|
| (1) EUR55.5/t CO2e | (2) EUR162.3/t CO2e | |
| Gas consumption | 4610.7 | 13,481.5 |
| Electricity consumption | 12,580.1 | 36,783.9 |
| Water consumption | 150.8 | 440.8 |
| Septic sludge waste production | 19.7 | 57.7 |
| Internships | 9422.0 | 27,549.8 |
| - Plane | 9403.4 | 27,495.3 |
| - Train | 18.7 | 54.5 |
| Artwork transport | 81,320.8 | 237,780.2 |
| - Plane | 81,210.7 | 322.0 |
| - Truck | 110.1 | 237,458.2 |
| Exhibition’s materials | 2368.1 | 6924.2 |
| - Varnish | 15.8 | 46.2 |
| - Wood packaging | 2274.4 | 6650.3 |
| - Neoprene | 17.4 | 50.9 |
| - Wood MDF | 53.8 | 127.3 |
| - Plexiglass | 6.7 | 19.7 |
| Total economic value | 110,472.2 | 323,018.2 |
| Variable | Mean | Standard Deviation | Min | Max |
|---|---|---|---|---|
| Number of visits to Venice in the respondent’s life | 3.31 | 3.24 | 1 | 20 |
| Number of days in Venice during the current visit | 4.05 | 2.86 | 1 | 26 |
| Total expenditures for each stay in EUR | 1617 | 1554.1 | 100 | 10,000 |
| Total expenditures for accommodation in EUR | 728 | 784.71 | 0 | 3000 |
| Total expenditures for food in EUR | 363.5 | 357.25 | 0 | 2000 |
| Total expenditures for shopping in EUR | 339.5 | 566.95 | 0 | 4500 |
| Total expenditures for culture in EUR | 141.25 | 113.00 | 25 | 500 |
| Other expenditures in EUR | 39.75 | 102.25 | 0 | 600 |
| Age | 46.23 | 17.96 | 17 | 83 |
| PGC decisive for visiting Venice this time | YES = 38% NO = 62% | |||
| Education | High School Degree = 16%; Bachelor Degree = 53%; Master Degree = 21%; Ph.D. = 10%. | |||
| Nationality | British (10%); Chinese (5%); U.S. (11%); Australian (2%); Austrian (6%); Belgian (5%); Bulgarian (1%); Canadian (3%); Dutch (4%); French (11%); German (22%); Irish (2%); Italian (5%); Korean (1%); Maltese (1%); Mexican (1%); New Zealander (2%); Norwegian (1%); Polish (1%); Russian (2%); Spanish (2%); Turkish (2%). | |||
| Job | Book editor (1%); CEO (2%); company owner (1%); H.R. manager (2%); legal clerk (1%); architect (7%); archivist (1%); art collector (1%); art dealer (1%); bank manager (2%); city planner (1%); consultant (2%); e-commerce business person (1%); engineer (2%); event manager (2%); fashion designer (1%); film producer (1%); fiscal accountant (1%); graphic designer (1%); hair dresser (1%); housewife (4%); interior designer (1%); investor (1%); journalist (1%); lawyer (2%); marketing manager (2%); medical doctor (2%); model (1%); musician (2%); project manager (1%); psychologist (2%); researcher (2%); retired (9%); sales manager (1%); scientist (1%); clerk (1%); start-up developer (1%); student (15%); teacher (12%); university assistant (1%); university professor (5%); writer (1%). | |||
| Variable | Estimated Coefficient | Marginal Effect (dy/dx) |
|---|---|---|
| Number of days in Venice | 0.17 *** | 0.05 *** |
| Number of visits to Venice | 0.07 | 0.02 |
| Total expenditures for accommodation in EUR | −0.001 *** | −0.004 *** |
| Total expenditures for food in EUR | 0.001 | −0.004 |
| Total expenditures for culture in EUR | 0.003 *** | 0.001 *** |
| Master’s degree | −2.93 *** | −1.00 *** |
| British | 0.44 | 0.15 |
| French | 0.60 | 0.20 |
| H.R. Manager | −1.46 * | −0.49 * |
| Psychologist | 2.85 ** | 0.96 ** |
| Retired | −1.03 * | −0.35 * |
| Student | 0.42 * | 0.14 * |
| University Professor | 0.86 * | 0.29 * |
| Age | 0.17 * | 0.005 * |
| Constant | −2.01 *** | - |
| Diagnostics | LR chi2(14) = 35.03 Prob > chi2 = 0.0015 Log likelihood = −48.88 Pseudo-R2 = 0.26 | |
| 2016 | 2017 | 2018 | 2019 | 2020 | 2021 | 2022 |
|---|---|---|---|---|---|---|
| 93,592,315 | 96,712,280 | 85,153,885 | 79,329,122 | 3,376,952 | 34,042,017 | 86,321,340 |
| 2022 Demand (in EUR) | |||||
|---|---|---|---|---|---|
| Total | |||||
| Expenditure Inside the Museum | Ticket sales | 4,897,945 | 9,933,243 | ||
| Museum shop sales | 1,849,321 | ||||
| Expenditure in the museum’s restaurant | 413,000 | ||||
| Subscriptions, sponsorships, and grants | 2,280,564 | ||||
| Other revenues (guided tours and audio guide + renting museum spaces for location + exhibition fee) | 492,413 | ||||
| Expenditure Outside the Museum | No. Visitors | Average expenditure (EUR) | Total expenditure | ||
| Spending by museum’s visitors on accommodation | 381,374 | 664 | 253,232,336 | 607,528,782 | |
| Expenditure on food | 379 | 144,540,746 | |||
| Expenditure on shopping | 353 | 134,625,022 | |||
| Expenditure on leisure and other activities | 197 | 75,130,678 | |||
| TOTAL DEMAND | 617,462,025 | ||||
| Final Demand Generated by the PGC’s Activities from 2016 until 2022 (EUR) | |
|---|---|
| 2016 | 667,291,397 |
| 2017 | 689,365,189 |
| 2018 | 607,290,013 |
| 2019 | 566,334,912 |
| 2020 | 152,958,059 |
| 2021 | 244,876,169 |
| 2022 | 617,462,025 |
| Impacts on GDP (EUR 1 million) | |||||
|---|---|---|---|---|---|
| Direct | Indirect | Induced | TOTAL | Multiplier | |
| 2016 | 667.29 | 614.34 | 7.4 | 1289.03 | 1.93 |
| 2017 | 689.37 | 634.69 | 7.64 | 1331.70 | |
| 2018 | 607.29 | 559.08 | 6.73 | 1173,10 | |
| 2019 | 566.33 | 521.35 | 6.28 | 1093.97 | |
| 2020 | 152.96 | 140.40 | 1.71 | 295.06 | |
| 2021 | 244.88 | 225.19 | 2.72 | 472.79 | |
| 2022 | 394.23 | 633.97 | 7.64 | 1192.68 | |
| Impacts on GDP (EUR 1 Million, 2022)—by Industries | ||||
|---|---|---|---|---|
| Direct | Indirect | Induced | Total | |
| Trade, hotels and restaurants, and accommodation | 101.41 | 85.94 | 0.95 | 419.07 |
| Consumer goods industry | 82.71 | 84.31 | 0.09 | 167.11 |
| Financial institutions, insurance, real estate, and business services | 54.95 | 173.48 | 1.15 | 155.64 |
| Manufacturing industry | 28.11 | 91.03 | 0.95 | 120.09 |
| Transport, storage, and communication | 40.90 | 73.51 | 0.90 | 115.31 |
| Art, entertainment, and recreation | 84.76 | 25.08 | 0.03 | 109.87 |
| Primary sector and extractive industries | 0.02 | 40.37 | 0.46 | 40.86 |
| Electricity, gas, steam, and air conditioning supply; water supply and sewerage activities; waste management | 0.00 | 32.64 | 2.92 | 35.56 |
| Public administration, defense, and R&D | 0.46 | 13.97 | 0.07 | 14.49 |
| Construction | 0.00 | 11.12 | 0.10 | 11.21 |
| Community, social, and personal services | 0.91 | 2.53 | 0.02 | 3.47 |
| Impacts on Employment (No. of Jobs) | |||
|---|---|---|---|
| Direct + Indirect | Induced | Total | |
| 2016 | 8785 | 24 | 8810 |
| 2017 | 9069 | 25 | 9094 |
| 2018 | 8016 | 23 | 8038 |
| 2019 | 8145 | 23 | 8168 |
| 2020 | 2188 | 9 | 2197 |
| 2021 | 3366 | 11 | 3377 |
| 2022 | 8146 | 23 | 8169 |
| Impacts on Employment (No. of Jobs, 2022)—by Industries | |||
|---|---|---|---|
| Direct + Indirect | Induced | Total | |
| Trade, hotels and restaurants, and accommodation | 4273 | 3 | 4277 |
| Financial institutions, insurance, real estate, and business services | 1338 | 7 | 1345 |
| Art, entertainment, and recreation | 719 | 0 | 719 |
| Consumer goods industry | 495 | 0 | 496 |
| Primary sector | 382 | 1 | 383 |
| Manufacturing industry | 373 | 2 | 375 |
| Transport, storage, and communication | 220 | 4 | 224 |
| Public administration, defense, and R&D | 144 | 1 | 145 |
| Construction | 83 | 1 | 83 |
| Electricity, gas, steam, and air conditioning supply; water supply and sewerage activities; waste management | 65 | 3 | 67 |
| Community, social, and personal services | 53 | 0 | 53 |
| Impacts on public finances (EUR 1 Million) | |||
|---|---|---|---|
| Direct + Indirect | Induced | Total | |
| 2016 | 148.13 | 0.33 | 148.45 |
| 2017 | 152.78 | 0.34 | 153.11 |
| 2018 | 135.43 | 0.31 | 135.74 |
| 2019 | 126.77 | 0.30 | 127.06 |
| 2020 | 39.49 | 0.16 | 39.66 |
| 2021 | 58.83 | 0.19 | 59.02 |
| 2022 | 148.13 | 0.33 | 148.45 |
| Impacts on Net Revenues (EUR 1 Million, 2022)—by Industries | |||
|---|---|---|---|
| Direct + Indirect | Induced | Total | |
| Trade, hotels and restaurants, and accommodation | 54.83 | 0.04 | 54.87 |
| Art, entertainment, and recreation | 36.36 | 0.01 | 36.37 |
| Financial institutions, insurance, real estate, and business services | 24.14 | 0.15 | 24.29 |
| Consumer goods industry | 10.31 | 0.01 | 10.32 |
| Transport, storage, and communication | 6.63 | 0.11 | 6.74 |
| Primary sector | 4.97 | 0.04 | 5.01 |
| Public administration, defense, and R&D | 4.82 | 0.02 | 4.84 |
| Manufacturing industry | 3.45 | 0.02 | 3.47 |
| Construction | 1.28 | 0.01 | 1.29 |
| Community, social, and personal services | 0.69 | 0.01 | 0.69 |
| Electricity, gas, steam, and air conditioning supply; water supply and sewerage activities; waste management | 0.65 | −0.09 | 0.55 |
| Guggenheim Museum Bilbao |
|
| Thyssen Museum (Madrid) and Museum Nacional d’Art de Catalunya—MNAC (Barcelona) | Both institutions publish sustainability reports based on GRI indicators. The difference is in the number of these indicators that are covered. Relating to the environmental ones, the MNAC reports 87.5% of the corresponding indicators, while Thyssen Museum only includes 25%. |
| Natural History Museum (London) |
|
| UK Museums Association | This association runs consultation services, discussion workshops, and discussion papers about sustainability and museums. |
| Australian Museums | Museums Australia has released a set of sustainability guidelines. The guidelines outline how museum practices in the areas of education and advocacy, decision-making, activities, policies, operations, and functions can contribute to community sustainability. The guidelines also contain practical applications for creating a sustainable museum in the areas of the economy, collection management, education, waste, water and energy management, etc. |
| The Netherland Museums Association | This association looks for sustainability in museums, encouraging initiatives such as a platform for sharing and reusing material for exhibitions. |
Disclaimer/Publisher’s Note: The statements, opinions and data contained in all publications are solely those of the individual author(s) and contributor(s) and not of MDPI and/or the editor(s). MDPI and/or the editor(s) disclaim responsibility for any injury to people or property resulting from any ideas, methods, instructions or products referred to in the content. |
© 2024 by the authors. Licensee MDPI, Basel, Switzerland. This article is an open access article distributed under the terms and conditions of the Creative Commons Attribution (CC BY) license (https://creativecommons.org/licenses/by/4.0/).
Share and Cite
Onofri, L.; Ojeda, C.; Ruiz-Gauna, I.; Greno, F.; Markandya, A. A Life Cycle and Economic Assessment of the Peggy Guggenheim Collection in Venice for Environmental and Economic Sustainability. Sustainability 2024, 16, 6735. https://doi.org/10.3390/su16166735
Onofri L, Ojeda C, Ruiz-Gauna I, Greno F, Markandya A. A Life Cycle and Economic Assessment of the Peggy Guggenheim Collection in Venice for Environmental and Economic Sustainability. Sustainability. 2024; 16(16):6735. https://doi.org/10.3390/su16166735
Chicago/Turabian StyleOnofri, Laura, Cristina Ojeda, Itziar Ruiz-Gauna, Francisco Greno, and Anil Markandya. 2024. "A Life Cycle and Economic Assessment of the Peggy Guggenheim Collection in Venice for Environmental and Economic Sustainability" Sustainability 16, no. 16: 6735. https://doi.org/10.3390/su16166735
APA StyleOnofri, L., Ojeda, C., Ruiz-Gauna, I., Greno, F., & Markandya, A. (2024). A Life Cycle and Economic Assessment of the Peggy Guggenheim Collection in Venice for Environmental and Economic Sustainability. Sustainability, 16(16), 6735. https://doi.org/10.3390/su16166735