Article

Institutional Performance and Carbon Reduction Effect of High-Quality Development of New Energy: China’s Experience and Policy Implication

1
School of Law, Chongqing University, Chongqing 400045, China
2
School of Public Policy and Administration, Chongqing University, Chongqing 400044, China
3
School of Economics and Business Administration, Chongqing University, Chongqing 400044, China
4
Law School, Fuzhou University, Fuzhou 350108, China
*
Author to whom correspondence should be addressed.
These authors contributed equally to this work.
Sustainability 2024, 16(16), 6734; https://doi.org/10.3390/su16166734
Submission received: 29 June 2024 / Revised: 25 July 2024 / Accepted: 5 August 2024 / Published: 6 August 2024
(This article belongs to the Special Issue Sustainable Perspective on Power Systems and Renewable Energy)

Abstract

:
Based on the policy text from 1999 to 2022, this paper quantitatively analyzes photovoltaic power, wind power and new energy policies in mainland China by keyword capture and policy strength and establishes a spatial Durbin model to study the carbon reduction effects. The results show the following: (1) The development of new energy is primarily project-based and concentrated in rural areas. (2) Financial support is a double-edged sword. (3) After the implementation of the Renewable Energy Law in 2015, the change trend in policy quantity, total policy intensity, and average policy intensity is generally consistent. (4) The increase in the strength of new energy policies has effectively reduced the intensity of provincial carbon dioxide emissions. (5) New energy policies introduced in a single region are less effective in reducing carbon emissions than joint regional regulation. Therefore, it is necessary to improve the quality and coordination of new energy policies through the effective convergence of policies and regular evaluations to enhance the positive guidance of the policies. Policy measures for new energy are refined in three areas: improving the amount and quality of new energy policies, strengthening new energy policies and establishing cooperation mechanisms for the cross-regional consumption of new energy.

1. Introduction

To implement the national strategic of carbon peaking and carbon neutrality goals, China confirmed that “the total installed capacity of wind power and solar power will achieve more than 1.2 billion kilowatts by 2030” [1]. It was in 1997 that new energy officially appeared in Interim Provisions on the Management of New Energy Capital Construction Projects, which defined new energy as “electricity or clean fuel converted or processed from renewable resources such as wind, solar, geothermal, ocean, and biomass energy”. Carbon reduction as an essential goal for new energy development originated from the commitment at the United Nations climate change summit in 2009 to “reduce the intensity of carbon dioxide emissions per unit of GDP in 2020 by 40 to 45 percent compared with the level of 2005”. This has become the beginning of developing a green and low-carbon economy in China. Subsequently, the targets of carbon reduction and energy transformation are incorporated into the relevant plans and are gradually being implemented. After completing the proposal to “significantly reduce CO2 intensity by 2020” [2], President Xi pledged that China would adopt more vigorous policies and measures, trying to achieve a carbon emission peak before 2030 and carbon neutrality before 2060. The institutional guarantee of the high-quality development of new energy will significantly contribute to achieving China’s dual carbon strategic goals.
According to the white paper “Energy in China’s New Era” in 2020”, since 2010, China has invested about USD 818 billion in new energy power generation, accounting for 30 percent of the total global investment. As of the end of 2019, the total installed capacity of wind power reached 210 million kW and photovoltaic power reached 204 million kW. A complete industrial chain has been formed to manufacture wind and photovoltaic power generation equipment. With the help of incentive policies, such as financial subsidies [3], and local government performance and fiscal revenue [4], China’s new energy development has been remarkable in recent years. However, while the policy promotes the rapid growth of new energy, it also causes problems such as upstream overcapacity and downstream institutional bottleneck caused by the irrational investment of resources [5,6]. In other words, although the total installed capacity and the generation share of new energy power generation are steadily increasing, there are still constraints impeding the new energy practice, such as the inadequate adaptability of the power systems to large-scale and high-proportion new energy connection and consumption and obvious land resources constraints. Therefore, this paper selects wind and photovoltaic power generation as the representatives of new energy to sort out systematically the relevant regulations and institutional quality that support the development of wind and photovoltaic power generation and analyze the impact of new energy institutional systems on carbon reduction. We further explore ways to improve the institutional quality of new energy development and help adopt more effective regulations to achieve high-quality development and the dual carbon strategies. The following is the paper’s research framework (Figure 1).

2. Literature Review

“New energy” is often referred to as “renewable energy” [7,8]. Comparing the aforementioned reference to the official definition of new energy in 1997 with the Renewable Energy Law in 2005, which defines renewable energy as non-fossil energy sources such as wind, solar, hydro, biomass, geothermal and ocean energy, it can be seen that new energy sources cover less than renewable energy sources, which are also classified as renewable energy sources. In this paper, we screen the literature on wind and solar energy and include them in the analysis of new energy policies. In the following, we will focus on the research from institutional quality and carbon reduction effectiveness.

2.1. Research on the Institutional Quality of New Energy Policies

Research on new energy policy mainly involves legislative study [8,9,10], the institutional choice [11,12], and the implementation effect [13,14,15,16]. But such research has misunderstandings and problems in terms of content and methods. First, studies either they neglect the classification of new energy [17,18], or they focus on discussing new energy vehicle industry policies [19,20,21,22,23,24]. Secondly, most studies concentrate on a particular site, such as the implementation effect of fiscal policy [25,26,27], the role of financial subsidies and tax breaks in promoting the industry [28,29,30,31], and so there are few comprehensive research studies on new energy policies. Third, some scholars have used content analysis to deconstruct the problems of new energy policies [32,33,34,35,36,37]. However, the analysis indicators rely primarily on manual interpretation, which is easily and greatly influenced by researchers. Fourth, the existing empirical analyses mainly refer to the policy effectiveness measurement criteria of Peng et al. [38], quantitatively analyzing the government’s emphasis on new energy from policy strength, objectives, and measures [20,39,40]. However, the policy texts used in the quantitative analysis data of policy strength include non-normative documents [20], and the value assigned to policy strength is too arbitrary, which does not conform to the criteria of legal hierarchy and the actual situation of policy effectiveness [40].

2.2. Research on the Effects of New Energy Policies

The assessing of new energy regulations and policies based on cross-country analyses [41,42], case studies [43,44,45,46], and econometrics [47,48] is a crucial area of research. Liu [49] examined the short- and long-term impacts of energy laws in 129 countries, concluding that robust legal frameworks enhance the efficacy of energy laws. Moreover, legislative actions have a more significant impact than executive orders, with energy laws having a greater effect on solar and wind energy. Additionally, some researchers have highlighted the positive role of green financial regulation in promoting the utilization of renewable energy [50]. Lund pointed out that both subsidy-type and catalytic policies effectively promote energy development, with subsidy-type policies having a more substantial impact on energy itself and catalytic policies having a greater influence on technology [51]. Ullah pointed that green energy innovation, natural resources, and environmental policy have all facilitated green growth and energy transition in the United States [52]. Jin held that investments in research and development in renewable energy can achieve sustainable development by accelerating energy innovation, energy transition, and climate control [53]. Hille concluded that policies supporting renewable energy have incentivized innovations in solar and wind technologies, with the incentive effects being more pronounced in public RD&D programs, targets, and financial incentives [54]. Some scholars have also focused on the results of specific policies. For example, Carley evaluated the effectiveness of state energy plans using the renewable portfolio standard as a case study, indicating that RPS policies might be more effective when combined with programs aimed at controlling energy demand through efficiency and conservation measures or with emission trading mechanisms [55]. Some researchers have proposed that the New Energy Demonstration City policy reduces environmental pollution through technological, innovative, structural, and industrial effects [56,57]. Furthermore, the emission reduction potential in the electricity industry is enormous [58]. Studies on the low-carbon city pilot policy have shown that it promotes electricity consumption through energy-saving and green innovation effects, enhancing firms’ energy-saving attitudes and energy efficiency [59]. Overall, existing research generally supports the effectiveness of new energy regulations and policies.

2.3. Research on the Carbon Reduction Effect of New Energy Policies

Evaluating new energy policies’ carbon reduction effects is imperative [42,60,61]. Zhu et al. [62] found that the energy structure transformation has a significant U-shaped relationship with economic growth, while CO2 emissions have a significant inverted U-shaped relationship with economic growth [62]. Some authors found that CO2 emission reduction relied mainly on the impetus of technological progress [63], while the impact of energy structure adjustment, efficiency improvement, and industrial restructuring was insignificant [64]. Conversely, other people hold that renewable energy development and optimizing the energy structure are closely related to the decrease in carbon intensity [65,66,67].
To further discuss whether a new energy policy has achieved the carbon reduction, some scholars have measured the policy’s carbon reduction effect [68,69,70,71,72]. Some studies examine the impact of environmental regulation and fiscal support policies on regional carbon emission reduction [73,74,75]. Yin and Xie [76] examined the effects of environmental expenditure, taxation and subsidies on carbon emissions in China. Ren et al. [77] studied the effect of carbon trading policy on industrial carbon productivity. However, such studies directly corroborate the carbon reduction effect of policies through panel data without examining policy documents. In contrast, some studies discuss the carbon reduction effects of renewable and new energy sources based on the amount of policies. Fuinhas et al. [78] took the total number of renewable energy policies as an independent variable and found that renewable energy policies can effectively reduce CO2 emissions. Zeng et al. [79] took the number of policies as an independent variable to analyze the impact of new energy policies on major air pollutants. However, the measurement of the quality or strength of a policy text cannot be based simply on the number of policies but also needs to be combined with the policy objectives, measures and other factors.
Moreover, scholars have often attempted to quantitatively analyze new energy policies using content analysis and policy strength and have focused on the carbon reduction effects of new energy policies [80,81,82]. However, in policy research, studies mostly rely on manual interpretation, resulting in a lack of objectivity. In terms of policy strength, the lack of criteria and basis for assigning points is not in line with the provisions of legislative law on legal ranking and the actual implementation of Chinese policies. In the study of the carbon reduction effect of new energy policies, the number of new energy policies is usually used as the independent variable to analyze the carbon reduction effect, ignoring policy contents. Therefore, we focus on wind and photovoltaic power generation and use keyword extraction and quantitative analysis of policy strength to deconstruct new energy policies comprehensively. We further use policy strength as the core variable to assess the carbon reduction effect of photovoltaic, wind power, and new energy policies.

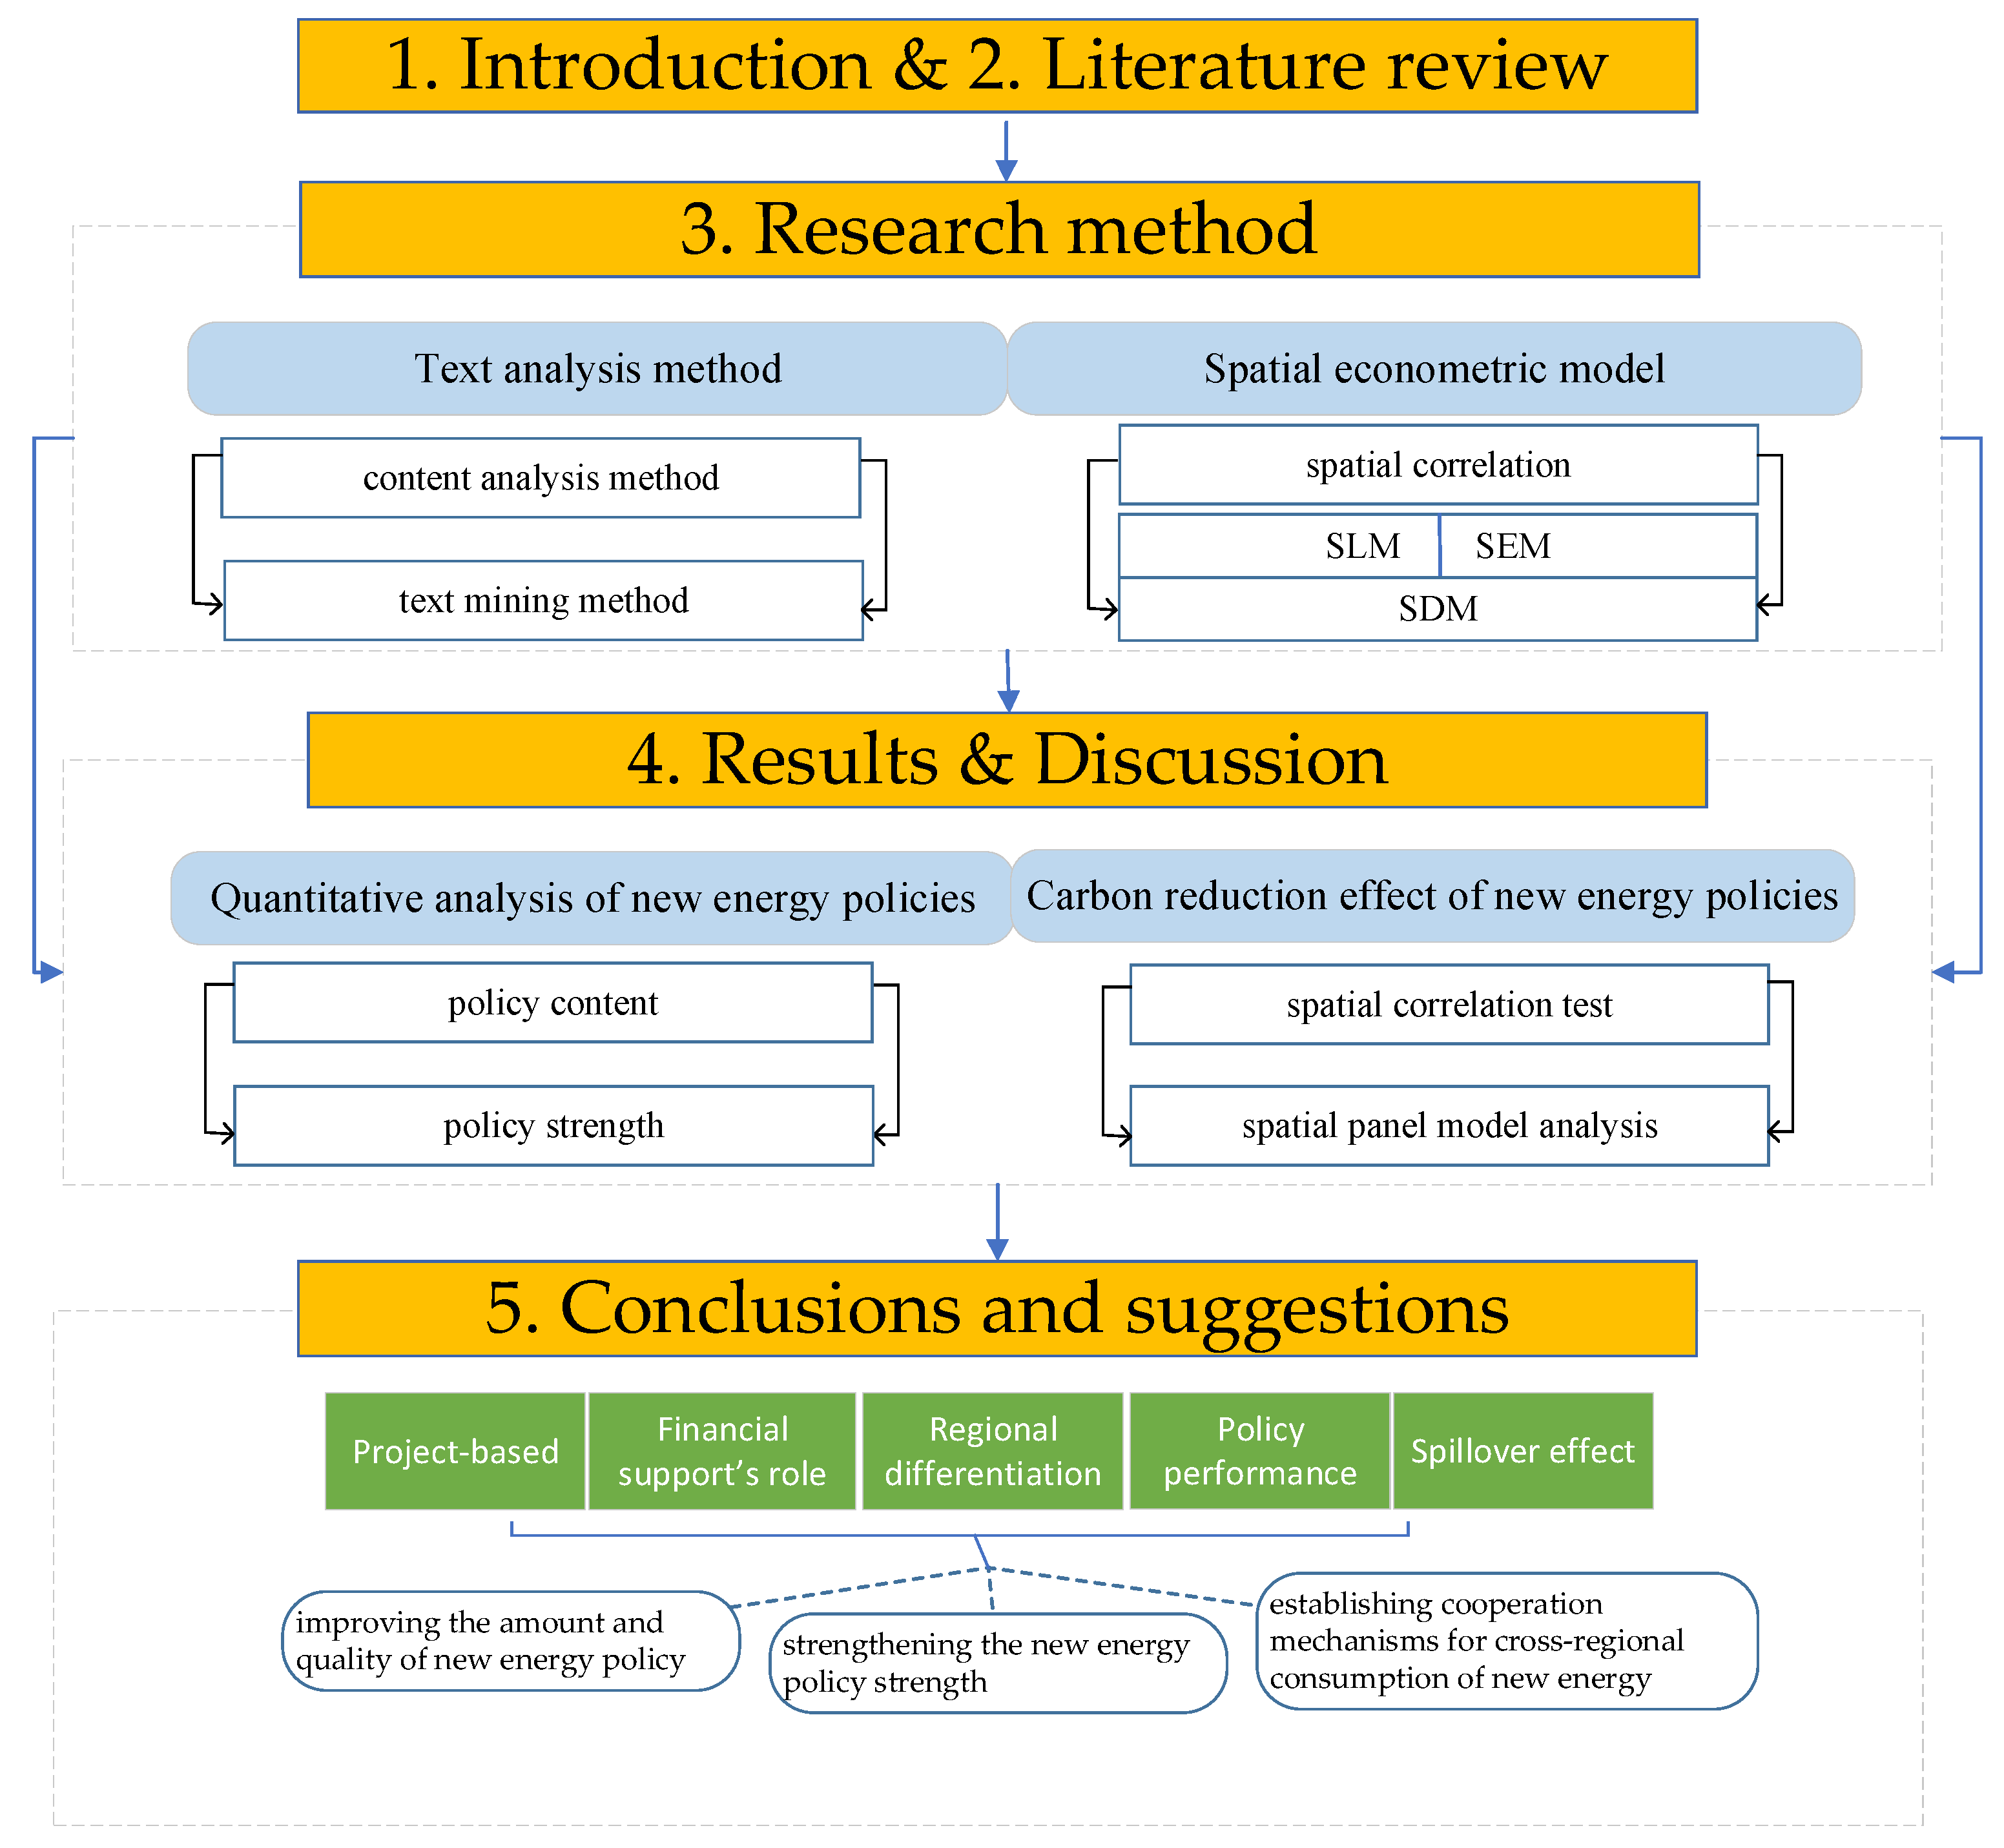
3. Research Methodology and Data Sources

3.1. Research Methodology

3.1.1. Documents Analysis Method

This paper combines content analysis and text mining to describe the overview of new energy policies. The content analysis method mainly sorts out the policy documents on new energy, compares the keywords of policy documents in different periods, and sums up and refines the characteristics of a new energy policy through the analysis of objectives and measures. The text mining method extracts words or phrases from specific policy documents that reflect the theme of new energy policies through keyword extraction. The TF-IDF (term frequency–inverse document frequency) algorithm is a standard method for policy text keyword extraction, which involves two concepts: term frequency (tf) and the inverse document frequency index (IDF) [83]. TF indicates how often a specific term appears in a document. If a term appears more often, the more effective the term is for that document. To analyze all TFs in the same dimension, the TFs are usually normalized using Equation (1).
T F = N u m b e r   o f   t i m e s   a   t e r m   a p p e a r s   i n   t h e   d o c u m e n t T o t a l   n u m b e r   o f   t e r m s   i n   t h e   d o c u m e n t
When a term appears in multiple sample documents, the term has substantial prevalence and decreasing importance for the documents. IDF measures the prevalence of terms, and the formula is shown in (2).
I D F = log Total   number   of   documents number   of   documents   containing   the   term + 1
TF-IDF is the product of TF and IDF, as shown in Formula (3).
TF - IDF = T F × I D F
TF-IDF tends to filter common words and retain significant words. The high frequency of a word within a particular document, and the low frequency of that word in the entire collection of documents, results in a highly weighted TF-IDF. The TF-IDF value of each term in the document is arranged in descending order, and the term with a high TF-IDF weight is the document keyword.
For content analysis on policy documents, this paper uses the TF-IDF algorithm provided by the Jieba (stutter) library of the Python language. Jieba is a statistical-based segmentation method that uses statistical machine learning models to learn the laws of word segmentation for a large number of segmented documents so that the process of slicing unknown documents and recombining consecutive word sequences into phrase sequences according to specific laws can be achieved.

3.1.2. Spatial Econometric Model

The construction of spatial econometric models requires testing for spatial correlation. We judge whether the target variables are spatially related by measuring Moran’s I index, which is an important spatial statistical measure used to determine the presence or absence of spatial autocorrelation [84]. Moran’s I > 0 indicates positive spatial autocorrelation; the larger the value, the more pronounced the spatial correlation. Moran’s I < 0 indicates negative spatial autocorrelation; the smaller the value, the greater the spatial heterogeneity. Moran’s I = 0 indicates spatial randomness. Second, when constructing the econometric model, the residual terms are tested for spatial correlation to set the specific form of the spatial econometric model. Spatial panel models include spatial lag models (SLMs) and spatial error models (SEMs).
The SLM assumes that the explanatory variables are spatially dependent. The explained variables of spatial unit i are not only correlated with the explanatory variables but also with the explanatory variables of other spatial units. The basic model is defined as follows:
y i t = ρ j = 1 N w i ˙ j φ j t + β x i t + μ i + ε i t
Here, y i t represents the observed values of the dependent variable; x i t denotes the k dimensional observed values of the explanatory variables; β signifies the k dimensional regression coefficients; ρ is the spatial autocorrelation coefficient; w i ˙ j represents elements in the spatial weight matrix, W ; μ i stands for the spatial unit individual effects; ε i t represents the error terms which are independently and identically distributed following N ( 0 , σ 2 I N ) ; N denotes the N different spatial units; and t = 1 ,   2 ,   , T indicates time.
The SEM assumes that the individual’s characteristics determine the values of the explained variables and that there is spatial autocorrelation between the error terms.
y i t = β X i t + μ i + φ i t
φ i t = ρ j = 1 N w i ˙ j φ j t + ε i t
In the formula, φ i t represents the spatial autocorrelation error term.
Based on the research needs, LeSage and Pace [85] added the lagged term of the explanatory variables to the SLM to reflect the influence of the explanatory variables of neighboring regional units on the explained variables of that regional unit and constructed the spatial Durbin model (SDM), as shown in Formula (7).
y i t = ρ j = 1 N w i j y j t + β X i t 1 + γ j = 1 N w i j X j t 1 + μ i + ε i t
In the formula, γ and β are both regression coefficients. When γ = 0 , the spatial Durbin panel model simplifies to the spatial lag panel model. When γ + ρ β = 0 , the spatial Durbin model can be simplified to the SEM model.

3.2. Data Sources

The collection of new energy policy documents in this paper mainly relies on the database of Pkulaw, supplemented by the official websites of central and local governments, which publish the complete texts of the latest government policies in compliance with China’s government transparency requirements. “Pkulaw” is a comprehensive legal information retrieval system in China. It encompasses various search modules, including those for “Laws and Regulations” and “Judicial Cases”. The Laws and Regulations search system includes legislation from 1949 to the present, covering both central and local regulations. We made a retrospective search for “new energy”, “wind energy”, “solar energy”, and other words in the Pkulaw database and the government’s official website and obtained a total of 795 relevant policy documents and eliminated 45 duplicate documents and 308 non-normative documents, mainly involving planning documents, letters, approvals, negotiation documents, and other working documents. Finally, 442 new energy policy documents were identified, with data including policy name, issuance year, generation type, policy type, issuing subject level, document number, geographical distribution, and time effectiveness.
The provincial CO2 emission intensity data are from the Carbon Emission Accounting and Datasets (CEADs). The primary data of provincial GDP per capita, the GDP share of secondary industry, population density, urban population ratio, and energy consumption per capita in the control variables originated from the China Statistical Yearbook, CEADs, and the China Energy Statistical Yearbook, as well as provincial statistical yearbooks and the National Bureau of Statistics. For missing individual variables in this paper, interpolation is used to fill in the gaps.

3.3. Composition of the Policy Sample

As for the time effectiveness of the policies, the 442 new energy policy documents span the period from 1999 to 2022. As for the power generation types, we also made separate policy text statistics of wind and photovoltaic power as two critical areas of new energy to compare and analyze them and the whole new energy policy. Since 24 policy documents provide for both wind and photovoltaic power, they are classified into the wind power policy document library and the photovoltaic policy document library, and a total of 31 wind power policy documents and 261 photovoltaic policy documents are obtained. Wind and photovoltaic power policy documents are indeed grouped as new energy policy documents.
As for the types of policies, according to the vertical rank of each normative legal text in the legal system, the new energy, wind power, and photovoltaic power generation policy documents are divided into laws, local regulations, departmental rules, local rules, and other normative documents, and the specific number statistics are in Table 1 below.
Among the 442 new energy policy documents, 89 are at the central level, 166 at the provincial level, 163 at the municipal level, and 24 at the district and county levels. Moreover, 31 wind power policy documents include 6 central-level, 16 provincial-level, and 9 municipal-level policy documents. Among the 261 photovoltaic policy texts, these numbers are 43, 103, 95 and 20, respectively. In terms of geographical distribution, in addition to the central-level documents pervading the whole country, the geographical distribution of new energy, wind power, and photovoltaic policy documents by province is presented in Table 2 and Figure 2.
Figure 2 shows that 30 provincial regions have issued local new energy policies. Moreover, 29 provincial regions have introduced local policies on photovoltaic power generation, except for Tibet and Jilin, and 15 have local wind power policies. The province with the most policies is Anhui, with more also in Hebei, Henan, Guangdong, and Jiangsu. And the provinces with more policy documents are concentrated in the central and eastern regions. In addition, due to the lack of data in Hongkong, Macau, and Taiwan Province, the policy documents in these areas are not sorted out.

4. Quantitative Analysis of New Energy Policies

Wind and photovoltaic power generation are the typical representatives of new energy in China [86], so the following quantitative analysis of these two new energy policies is based on policy content and policy strength, and we study the impact of policies on wind, photovoltaic power, and new energy development through comparative analysis. The policy strength is quantitatively scored according to the level of issuing subject, policy type, policy quantity, and other indicators.

4.1. Analysis of Policy Content

There are many photovoltaic power generation and new energy policy documents, so the TF-IDF algorithm provided by the Jieba library in Python language is used to extract the top 10 keywords of each year’s photovoltaic power generation and new energy policy documents, respectively. While the number of wind power generation policy documents is only 31, only the top 10 keywords of all wind power generation policy documents are extracted by the TF-IDF algorithm. As can be seen in Table 3, wind power has been developed mainly through the project system. A project system is a specific form of government operation, which refers to the top–down allocation of resources in accordance with the central government’s intention, outside of the regular allocation channels and scale of the fiscal system [87,88].
Specifically, in the field of wind power, power stations, wind energy, electricity, scheduling, and other vital words appear frequently, with the exception of project. China’s wind power development is mainly concentrated in areas with sufficient wind resources north of the Chinese territory, from Xinjiang, Gansu, Inner Mongolia, and northern Hebei to the northeast [89]. The lack of energy storage, difficulties in peak regulation, and imbalance in grid load have gradually become significant factors limiting the high-quality development of wind power in China [90]. This is because wind power is intermittent and volatile, and it is difficult to avoid the problem that there is no wind when electricity is needed but much wind when electricity is not required. However, wind resources are inversely proportional to electricity consumption. Windy times are usually at night, while electricity consumption is at its lowest at night, causing some difficulties with shifting peaks [91]. In addition, the rapid development of wind power generation in a region will make the power grid unable to cope. Take Zhangjiakou as an example: the installed wind power has exceeded the total installed capacity of the local power grid, making it impossible for the local grid to consume all of it. Also, wind power scheduling is needed because electricity cannot be stored and the load needs balanced in real time.
Table 4 shows the keyword comparison of new energy and photovoltaic power generation policies. Figure 3 and Figure 4 are the word cloud graphs of keywords for new energy and photovoltaic power, which shows the weight and distribution of policy keywords over the decades. The reason for comparing the policy documents of new energy and photovoltaic power generation is that the number of photovoltaic power generation policy documents accounts for half of the new energy policy documents, so it is of great significance to compare the similarities and differences between them. Overall, “rural” and “project” appear throughout the photovoltaic power and new energy policy, indicating that China’s photovoltaic and new energy development mainly focuses on rural areas. “Enterprise” appears in every annual photovoltaic and new energy policy, except for 2019 and 2020, indicating that enterprises play a pivotal role in developing new energy in China.
As can be seen from Table 4 and Figure 3, from 2008 to 2010, the critical word “funding” frequently appears in the new energy policy; from 2011, it is “subsidies”, and from 2016, it is “special funds”. China’s new energy development is inseparable from the government’s financial support. This is influenced by the enactment of the Renewable Energy Law, which provides legal economic incentives and a regulation system, including categorized tariffs, development funds, and fiscal policies. Since then, the country began implementing a subsidy policy for new energy generation based on fixed tariffs. According to the Ministry of Finance statistics, the accumulated subsidy funds arranged from 2012 to 2018 exceeded CNY 450 billion, providing strong support for the rapid development of new energy [92]. However, the new energy industry has entered an explosive development stage since 2016. Although the additional electricity price standard has been improved, it is difficult to catch up with this new speed of development, resulting in funds being unable to meet the actual demand for subsidies. Starting in 2017, the problem of subsidy arrears gradually began to appear. According to preliminary industry estimates, the total subsidy funds needed for new energy is about CNY 150 billion. In comparison, the actual amount of subsidy funds received by the Ministry of Finance is about CNY 90 billion each year, so there is a subsidy funding gap of about CNY 60 billion each year [93].
As can be seen from Table 4 and Figure 4, from 2013 to 2020, the keywords of the photovoltaic power generation policy are the same as those of the new energy policy. It can be said that photovoltaic power generation was the focus or the only direction of new energy development during this period. Especially after 2014, more emphasis has been placed on the distributed construction of new energy sources, mainly to maximize energy utilization and to avoid the phenomenon of the curtailment of wind and PV power generation, which refer to electricity generated and left unused due to demand load. By the end of 2021, distributed photovoltaics reached 107.5 million kilowatts, taking up about one-third of all photovoltaic power generation grid-connected capacity, becoming a new growth point for the photovoltaic industry. Meanwhile, problems such as delivering and consuming wind power and photovoltaic power generation have been alleviated. By 2016, the national average curtailment rate was 17%, and the curtailment rate of PV power generation was 10%. From January to September in 2019, the national average curtailment rate dropped to 4.2%, and the curtailment rate of PV power generation dropped to 1.9% as the supply of electricity and solar energy exceeded the demand [92]. From 2015 to 2020, to achieve total poverty alleviation, photovoltaic agriculture was used as a poverty alleviation method to subsidize poor households by selling electricity at high prices through the Internet. Therefore, “poor households” and “poor villages” became high-frequency words in the new energy policy documents during this period. With the increasing number of photovoltaic power generation in rural areas, especially the large-scale promotion of distributed photovoltaic power generation projects, new energy policies focused on the revenue distribution from new energy generation at the village level from 2018 to 2020.

4.2. Analysis of Policy Strength

This paper takes the legal rank as the classification standard, which divides the policy documents into laws, administrative regulations, local regulations, departmental rules, local rules, and other normative documents. Other normative documents are divided into other normative documents of the central government and local governments. Wu Jinglian argues that the government is accustomed to managing society through official documents, policies, and internal regulations, using these as the basis for enforcement. This practice has contributed to the phenomenon of power prevailing over the law. In a broad sense, law encompasses both formal legislation and internal government documents, policies, regulations, and rules. The former can be referred to as “major laws”, while the latter can be termed “minor laws”. The legal effectiveness of the nation’s “major laws” is often outweighed by the State Council’s regulations, which, in turn, are often less influential than the various measures formulated by local governments [94]. Therefore, referring to the scoring methods of Zhang [83], Lv et al. [95], Lan [39] and Li et al. [17], we score the policy issuing subject and policy type, as shown in Table 5.
Based on the scoring rules in Table 5, the policy strength score can be calculated by Formula (8).
E P = i = 1 n ( E I i + E T i )
E P is the policy strength score; E I i is the issuing unit level score of the i t h policy; E T i is the policy type score of the i t h policy; and n is the number of policies. According to Equation (8), the policy intensities of wind power, photovoltaic power, and new energy from 2007 to 2022 are calculated, respectively. Figure 5, Figure 6 and Figure 7 show the aggregated policy quantity, total policy intensity, and average policy intensity trends for wind power, photovoltaic power, and new energy.
Figure 5, Figure 6 and Figure 7 show that the change trend in policy quantity, the total policy intensity, and the average policy intensity for wind power, photovoltaic power generation, and new energy are consistent between 2007 and August 2022, and the average policy intensity changes less, mainly concentrated in the range of 5.5–6.5. The fluctuation trend in total policy strength and policy quantity is basically in parallel, and the change in policy strength mainly depends on the shift in policy quantity. Under the influence of the Renewable Energy Law, the number of new energy policies began to increase after 2005. The first wind power policy and photovoltaic power generation policy were introduced in 2006 and 2007, and new energy was in an initial state of development at this time. After the Chinese government announced at the UN Climate Change Summit in 2009 that it would “strive to achieve a significant reduction in CO2 emissions per unit of GDP by 2020 compared to 2005”, the goals of carbon reduction and energy transition were incorporated into the 12th and the 13th Five-Year Plan. Therefore, between 2010 and 2020, the number of wind power, photovoltaic power, and new energy policies and the total policy intensity have risen significantly and are in a rapid development stage. Since 2020, the number of policies and total policy strength of wind power, photovoltaic power, and new energy policies have been stable and maintained at a higher level, entering a phase of steady development.

5. Analysis of the Carbon Reduction Effect of New Energy Policies

Based on the analysis of new energy policy text content and policy intensity, we established a spatial econometric regression model to analyze the carbon reduction effect of new energy policies using data from 30 provincial regions from 2005 to 2019, with policy intensity as the explained variable and policy intensity as the core explanatory variable.

5.1. Variable Selection

5.1.1. Explained Variables

The dependent variable is the carbon emission intensity at the provincial level, defined as the amount of carbon dioxide emissions per unit of GDP. This metric serves as an important indicator of a country or region’s energy consumption and carbon emission efficiency. The reduction in carbon emission intensity depends not only on technological advancements and economic growth but also on changes in industrial structure, agricultural industrialization, and the urbanization process. A lower carbon emission intensity does not necessarily indicate higher efficiency; for instance, carbon intensity may be low in poor agricultural countries, but efficiency may not be high. Based on the existing research and data availability, this paper cites the provincial carbon emission list from CEADs and takes its logarithm [96,97,98]. These data contain CO2 emissions from 17 energy sources and cement production processes, and the indicators are relatively comprehensive and objective. Meanwhile, considering the lagging effect of new energy policies on provincial carbon emissions, this paper introduces a lagging period of provincial carbon emission intensity.

5.1.2. Core Explanatory Variables

The core explanatory variable is the strength of a new energy policy, which refers to the credibility and enforceability of the policy, reflecting the authority and influence of the policy to some extent. New energy policies are time-sensitive. During the validity period, the policy continues to be effective; when the policy exceeds the validity period or is repealed, the effect of the policy disappears. Therefore, the policies that impact provincial carbon emission intensity include not only the new energy policies issued by each province in the current year but also the new energy policies that have been issued before and have not exceeded the validity period or have not been repealed. Referring to Wang et al. [99], the new energy policy intensity of each province is calculated by adding the new energy policy intensity of each province in that year to the new energy policy intensity in the previous years and then subtracting the policy intensity that has exceeded its expiration date or been repealed [99]. To avoid heteroskedasticity, logarithms were taken.

5.1.3. Control Variables

Considering that provincial carbon emission intensity is influenced by other factors, this study includes the economic development level, industrial structure, population agglomeration, the urbanization level, and energy consumption as control variables to avoid omitted variable bias in the model. The data are standardized, and logarithmic transformations are applied to some variables.
  • The level of economic development, measured by GDP per capita in each provincial region: The economic development level reflects the overall economic strength of a region and the living standards of its residents. It may influence research into and the promotion and application of new energy technologies [100]. According to the environmental Kuznets curve, there is an “inverted U-shaped” relationship between the economic development level and environmental pollution [101]. Given China’s stage of economic development, economic growth is expected to have a positive impact on provincial carbon emission intensity.
  • Industrial structure, measured by the proportion of GDP accounted for by the secondary industry in each provincial region: The industrial structure determines the composition of economic activities in a region, with different industries having varying levels of energy consumption and carbon emission intensity. Regions with a higher proportion of heavy industry may have larger carbon emissions, while those with a higher proportion of the service industry tend to have relatively lower carbon emissions. Therefore, industrial structure is a significant factor affecting carbon emissions and the effectiveness of carbon reduction [102]. Generally, the primary and tertiary sectors have a relatively smaller impact on the atmospheric environment, whereas a greater proportion of the secondary sector is associated with higher provincial carbon emission intensity [103].
  • Population agglomeration, measured by the population density (Pop) of each provincial region: Regions with a higher population density may have greater energy demand and carbon emissions. Additionally, population agglomeration is related to knowledge spillovers and technological innovation, which can influence the adoption of new energy technologies and carbon reduction efforts [104]. The higher the level of population agglomeration in a province, the more frequent the production activities, leading to increased carbon dioxide emissions. Thus, population agglomeration is expected to have a positive impact on carbon emissions [105].
  • The level of urbanization, measured by the proportion of the urban population (Urban): The urbanization level reflects the degree of urban development in a region. During the urbanization process, a significant number of people migrate from rural to urban areas, leading to increased energy consumption due to the concentration of production and living activities. This can raise the provincial carbon dioxide emission intensity. At the same time, regions with higher urbanization levels may have more developed infrastructure and more efficient energy use, which can influence the utilization of new energy technologies and impact carbon emissions [106,107]. Therefore, the impact of urbanization levels on air pollution needs to be further verified.
  • Energy consumption, as measured by per capita energy consumption (Energy) in each provincial region: Energy consumption is directly related to carbon emissions, with different types of energy consumption having different carbon emission factors. Controlling the amount and structure of energy consumption can help more accurately assess the contribution of new energy to carbon reduction efforts [108]. As a major energy consumer, an increase in per capita energy consumption results in the generation of substantial amounts of carbon dioxide [109].

5.1.4. Spatial Correlation Test

The spatial correlation needs to be checked before building the spatial panel model. This paper uses a geographic neighborhood spatial weight matrix to calculate the global Moran’s I index to test whether there is a spatial correlation in provincial carbon emission intensity. Table 6 shows that Moran’s I index is positive and passes the significance test between 2005 and 2019. This suggests that the CO2 distribution is not entirely random but presents significant autocorrelation characteristics affected by spillover from neighboring provinces. Because of the air fluidity, provinces with high CO2 emission intensity cause an increase in CO2 emissions in neighboring provinces, creating a diffusion effect among neighboring provinces. Similarly, provinces with low CO2 emission intensity have lower emissions than the surrounding provinces. Therefore, when analyzing the data, it is necessary to consider the influence of spatial correlation on the regression model.

5.2. Spatial Panel Model Analysis

The LM, LR, and Wald tests were used to determine and select the appropriate spatial model [110], and the test results are shown in Table 7. It can be seen that LM Lag, Robust LM Lag, and Robust LM Error passed the significance test, and LM Error did not pass the significance test. Therefore, it is advisable to build a spatial lag model or a spatial Durbin model and conduct LR and Wald tests to test whether the model will degenerate. In Table 7, the LR test rejects the original hypothesis that the SDM can degenerate to the SAR or SEM at the 1% level. The Wald test does not significantly reject the same original hypothesis. In large samples, the LR and Wald test results are asymptotically equivalent. The LR test is better asymptotically in small pieces, while the Wald test may sometimes reject the original hypothesis, leading to unreliable test results. Therefore, it is more appropriate to build a spatial panel Durbin model after considering the consequences of the LM, LR, and Wald tests. In addition, the spatial Durbin model is divided into a fixed effects model and a random effects model based on the distinction of individual effects, for which a Hausman test can be performed. However, the Hausman test statistic value is 50.44, which rejects the original hypothesis of the random effect model. Therefore, this paper should establish a fixed-effects spatial Durbin model.
Table 8 is the regression results of the spatial Durbin models of time fixed effects, space fixed effects, and temporal fixed effects. From Table 8, the spatial lagged term coefficient, p, of the explained variables in the three models is significantly positive, reaffirming the spatial spillover effect of CO2 emissions. In addition, the regression coefficients of the temporal fixed effects model basically passed the significance test. They were more in line with the economic perspective compared with the time fixed effects model and the spatial fixed effects model, so the spatial Durbin model with temporal fixed effects fits better. In addition, while this paper prioritizes the empirical results of the spatial panel Durbin model with temporal fixed effect, in order to verify the robustness of the conclusions, the regression results of the spatial panel lag model (SLM) and the spatial panel error model (SEM) are reported in columns 7 and 8 of Table 8, respectively. Consistent with the estimation results of the spatial panel Durbin model with temporal fixed effect, the coefficients of the variables Policy and W × Policy are significantly negative at higher statistical levels in both models, and the spatial lagged term coefficient, p, is significantly positive. This again verifies that the new energy policy effectively reduces the provincial carbon emission intensity, and there is a negative spatial spillover effect of provincial carbon emission reduction.
On this basis, the effects of each explanatory variable on provincial carbon emission intensity in the spatial Durbin model with temporal fixed effects are further decomposed into direct and indirect effects. The direct effect is the effect of a province’s explanatory variables on the provincial carbon emission intensity, while the indirect effect is the effect of a province’s explanatory variables on other provinces’ carbon emission intensities. Table 9 shows that the direct effect coefficient of Policy is significantly negative, indicating that the increase in the new energy policy intensity effectively reduces the provincial CO2 emission intensity. A forceful new energy policy can effectively promote the development of wind and solar power generation and increase the proportion of clean energy, thus reducing provincial CO2 emissions. Meanwhile, the coefficient of the indirect effect of Policy is significantly negative, indicating that new energy policies have a spillover effect and inhibit the CO2 emissions of neighboring provinces. When the province’s new energy policy is more vigorous, it will have a demonstration effect on neighboring regions, thus promoting the development of new energy industries in surrounding areas and reducing CO2 emissions.
The direct effect coefficients of the control variables GDP, Ind, Pop, and Energy are positive. They pass the significance test, indicating that an increase in the level of economic development, the share of secondary industry, population density, and energy consumption will lead to a provincial CO2 emission increase. The effect of Urban on CO2 emissions is negative and passes the significance test. The reason is that the improvement in urbanization level is conducive to changing energy structure to a certain extent. In other words, after residents migrate from rural areas to cities, the growth of the urban economy causes technological advances and changes in production mode, improves energy efficiency, and increases the use of clean energy, coupled with a greater awareness of environmental protection among urban residents, resulting in a reduction in CO2 emissions. Furthermore, the indirect effect coefficients of the control variables Ind, Pop, and Energy are also positive. They passed the significance test, indicating that an increase in the share of secondary industry, population density, and energy consumption will increase CO2 emissions in the province and affect neighboring areas to some extent. Therefore, provincial CO2 emission reduction regulation must consider regional interactions and further develop regional joint prevention and control.

6. Conclusions and Policy Implications

6.1. Research Conclusions

This paper uses keyword extraction and a quantitative analysis of policy intensity to assess the quality of wind, photovoltaic, and new energy policy from policy text and intensity. This paper also uses the strength of new energy policies as the core variable and provincial carbon intensity as the explained variable to investigate the carbon reduction effect of new energy policies. The main findings are as follows.
First, wind energy, photovoltaic power generation and new energy are supported by the central government through a project-based approach and special funds. Rural areas have become the ‘main battleground’ for new energy development due to their spatial advantages and have become an important means for the government to help farmers alleviate poverty and achieve prosperity.
Second, the rapid development of new energy in China has been facilitated by financial support. However, this has also led to issues such as large installed capacities with low power generation and rapid development with low efficiency, resulting in resource wastage. In the future, the current subsidy policy for new energy power generation needs to be more targeted.
Third, due to the geographical limitations of wind resources and the lagging development of the power grid behind wind power growth, wind power output faces significant obstacles, resulting in severe wind curtailment issues in the ‘Three Norths’ regions (Northeast, North China, and Northwest). Consequently, after 2013, the focus of new energy development shifted to distributed photovoltaic power generation projects.
Fourth, since the Renewable Energy Law was promulgated, the number of new energy policy documents has been increasing, and the total policy intensity has shown a year-on-year upward trend. The fluctuations between them are generally consistent, with little change in the average policy intensity, suggesting that changes in the new energy policy intensity mainly rely on changes in the policy quantity.
Fifth, the carbon reduction effect of new energy policies is mainly linked to the policy strength. Specifically, an increase in the intensity of new energy policies effectively reduces provincial CO2 emission intensity. Policies with clear targets and specific measures tend to have greater policy strength and a more substantial carbon reduction effect.
Sixth, new energy policies exhibit spillover effects. When a province implements robust new energy policies, it can enhance the carbon reduction effect in neighboring provinces. However, CO2 control is an issue of comprehensive governance. The carbon reduction effect of implementing new energy policies in a single region is significantly less effective compared to regional joint prevention and control.

6.2. Result Discussion

New energy technologies for power generation are regarded as a cornerstone of global energy sector decarbonization strategies [111]. Since the 1980s, developed countries have been advancing new energy technologies and policies, and since the 2000s, an increasing number of emerging economies have also begun implementing proactive policies. Whether in European countries or developing countries in Latin America, the development of new energy has been driven by government investment and policy initiatives. The Renewable Portfolio Standard and the Feed-in Tariff are the two primary policies for promoting renewable energy development worldwide. However, there are significant differences in the use of policy tools between developed and developing countries, and developed countries exhibit better policy effectiveness. This can be attributed to the longer implementation period of policies in developed countries, their well-established grid systems, and quota systems, which provide a solid foundation and better policy performance. Additionally, factors related to energy market structure, macroeconomic conditions, and political and institutional aspects all affect the implementation effectiveness of policies and their impact on carbon reduction [42]. Due to the significant instability of photovoltaic energy and wind energy in terms of seasonal, temporal, and highly intermittent characteristics, countries seek solutions from both technical and policy perspectives [112]. For example, the European Union plans to address this variability by establishing more grids and balancing wind energy demand between Germany and Spain [113]. Distributed generation is also a common choice among nations, with the effective impact influenced by appropriate technologies, sufficient financing, sustained end-user participation, and supportive national policies [114]. However, in addition to the commonality of top–down policy implementation observed across countries [115], China exhibits some distinct characteristics. For instance, wind power in China is concentrated in rural areas, whereas rural regions in countries like Ethiopia lack financial investment, resulting in the lack of new energy technologies and its applications [116]. Therefore, China should develop relevant policies and technologies based on its geographical environment, economic conditions, and political systems, drawing on the experiences of wind and photovoltaic energy development in other countries, further promoting the achievement of carbon reduction targets.

6.3. Policy Implications

Based on the current research results, this paper proposes the following three institutional recommendations for accelerating the construction of a clean, low-carbon, safe and efficient energy system, exerting the role of new energy policies in maintaining and increasing supply, and realizing the goals of carbon peaking and carbon neutrality.

6.3.1. Improving the Amount and Quality of New Energy Policy

Supportive policies have a significant positive impact on the development of new energy, but they also have the aforementioned negative effects. To avoid these negative impacts, local energy authorities should scientifically evaluate the environmental impact and benefits of new energy projects and enhance the coordination of relevant policies in implementing dual carbon goals, project management, electricity pricing determination, power market transactions, and financial support based on the actual conditions. When formulating new energy development plans and policies, considerations should be given to grid integration and consumption, ensuring that the scale of new energy planning aligns with the grid’s transmission and transformation capacity and the power load’s consumption capacity. Additionally, it is recommended to organize a third-party assessment to regularly evaluate the new energy policies and make timely adjustments to these policies.

6.3.2. Strengthening the New Energy Policy Strength

The enhancement of policy strength is conducive to the implementation of various new energy reform measures. In addition to increasing the quantity of policies, we can enhance the average strength of new energy policies from two aspects: the expansion of policy development and utilization mode and an improvement in financial policies.
  • Innovate new modes of energy development and utilization in an ecologically and environmentally friendly manner: From the perspective of practical needs, local governments can introduce policies to promote the innovative development of new energy’s utilization modes. First, the “Three North” areas can explore wind and solar energy resources in desert and Gobi areas, scientifically evaluate the impact of wind and photovoltaic power generation on the local ecological environment, and build large-scale wind and photovoltaic power bases. Secondly, local governments can promote new energy technologies that are suitable for rural characteristics, such as distributed photovoltaic power generation, small-scale wind power generation, and household biomass gasification stoves, to enhance energy conversion efficiency and reduce usage costs. The third is to guide the participation of multiple stakeholders through policy support and incentive mechanisms. By implementing measures such as subsidy policies, tax incentives, and financial support, both farmers and enterprises are encouraged to invest in renewable energy projects. Additionally, a comprehensive market supervision system should be established to ensure the quality and safety of these projects.
  • Refine the financial support policies for new energy in a timely manner: It is necessary to formulate refined, precise, and differentiated development policies based on the developmental stages of different types of new energy. For example, by implementing grid price policies linked to the rates of wind and solar power curtailment, we can incentivize companies to focus on technological innovation and cost reduction in power generation, rather than engaging in rent-seeking activities under subsidy policies. Moreover, it is recommended to adjust the current high subsidy policies and implement effective measures to control the subsidies for new wind and photovoltaic power installations. By adopting a more flexible and timely fixed feed-in tariff reduction mechanism, the demand for new wind and photovoltaic power projects can be curbed. This will guide the investment return rates of wind and photovoltaic projects back to the market average return rate, thereby fostering the orderly growth of new installations.

6.3.3. Establishing Cooperation Mechanisms for Cross-Regional Consumption of New Energy

Carbon emissions present a challenge for regulation due to their significant spillover effects. Meanwhile, the carbon reduction effects of new energy policies also have specific spillover effects. Therefore, to enhance the effectiveness of carbon reduction, it is imperative to make overall plans to solve the problem of the curtailment of wind and PV power generation and improve the utilization rate of new energy. As far as the new energy consumption is concerned, there is an urgent need to further accelerate the construction of ultra-high voltage trans-regional transmission channels and China’s energy interconnection network so that new energy can be consumed on a larger scale. Then, developing new energy bases and supporting power grid projects should be planned simultaneously whilst building several trans-regional power transmission channels with mature conditions and fulfilling the urgent demand for new energy bases through regional cooperation. Also, the central government should coordinate efforts to dismantle inter-provincial barriers in the electricity market, aiming to establish a unified electricity trading market on a broader scale, expand the scope of electricity balancing, and increase the scale of inter-provincial and inter-regional transactions. Through electricity market reforms, the competitive advantages of wind and photovoltaic power generation can be fully realized. Furthermore, the renewable energy quota system at the provincial level should be improved to facilitate the cross-province trading of wind and photovoltaic power.

6.4. Research Limitations

The shortcomings of this paper are as follows: Firstly, regarding the aspect of quantifying the policy strength, we classify the new energy policy types according to the legal rank and rate the hierarchy of policy issuing units based on the actual effectiveness of policy operation, but the policies issued by different levels of units often belong to the same policy type according to policy issuing procedures. Secondly, this paper quantitatively analyzes the content of a new energy policy regarding policy content and policy strength and discusses the carbon reduction effect of a new energy policy. Although the implementation effect of some policy measures is involved in the process of analyzing policy text, more attention is still paid to the content of the policy text itself. Thirdly, the strength of a new energy policy is an essential concern in this paper’s analysis of the policy documents. But in the long term, the stronger the financial policy support for new energy, the further the industry deviates from the actual market, resulting in the disorderly development of new energy. Beyond a certain point, the scope and effectiveness of many policies can be limited. These shortcomings will be the focus of our later research on new energy policies.

Author Contributions

Conceptualization, D.-k.Y., Z.-a.D. and Z.-x.T.; resources, Z.-x.T. and Z.-a.D.; formal analysis, L.-c.Z. and D.-k.Y.; writing—original draft, L.-c.Z., Z.-a.D. and D.-k.Y.; writing—review and editing, L.-c.Z., Z.-a.D. and D.-k.Y.; software, J.-h.L., D.-k.Y. and Z.-x.T. All authors have read and agreed to the published version of the manuscript.

Funding

This research was funded by Project 23XFX012 supported by the National Social Science Fund of China, Project No. 2024CDJSKPT06 supported by the Fundamental Research Funds for the Central Universities and Project CYB240052 supported by graduate research and innovation foundation of Chongqing, China.

Institutional Review Board Statement

Not applicable.

Informed Consent Statement

Not applicable.

Data Availability Statement

The data presented in this study are available on request from the corresponding author.

Conflicts of Interest

The authors declare no conflicts of interest.

References

  1. CGTN President Xi’s Speech at Climate Ambition Summit 2020. Available online: https://www.chinadaily.com.cn/a/202012/13/WS5fd575a2a31024ad0ba9b7ac.html (accessed on 20 December 2022).
  2. The Ministry of Ecology and Environment The Ministry of Ecology and Environment Held a Briefing on Policies to Actively Respond to Climate Change. Available online: http://www.mee.gov.cn/ywdt/hjywnews/202009/t20200927_800752.shtml (accessed on 28 June 2024).
  3. Luo, G.; Liu, Y.; Zhang, L.; Xu, X.; Guo, Y. Do Governmental Subsidies Improve the Financial Performance of China’s New Energy Power Generation Enterprises? Energy 2021, 227, 120432. [Google Scholar] [CrossRef]
  4. Wu, R. Market-Based and Green Finance to Help Mainland China Achieve Its “carbon Neutrality” Target. Econ. Outlook Bimon. 2021, 9, 74–81. [Google Scholar] [CrossRef]
  5. Chen, W. Japanese New Energy Industry and Sino-Japan Comparison. China Popul. Resour. Environ. 2010, 20, 103–110. [Google Scholar]
  6. Wang, H.; Ye, S.; Chen, H.; Yin, J. The Impact of Carbon Emission Trading Policy on Overcapacity of Companies: Evidence from China. Energy Econ. 2023, 126, 106929. [Google Scholar] [CrossRef]
  7. Cheng, C.; Wang, Z.; Liu, H.; Zhao, G.; Liu, M.; Ren, X. Study on the Optimization of Investment Incentive Policies for Renewable Energy Projects-from a Perspective of Execution Time. Chin. J. Manag. Sci. 2019, 27, 157–167. [Google Scholar]
  8. Gong, X. Legal Construction of the Priority Right of Renewable Power—A Logical Analysis Based on the Recently Abandoned Renewable Power Phenomenon. J. China Univ. Geosci. (Soc. Sci. Ed.) 2017, 17, 29–36. [Google Scholar]
  9. Liu, J. China’s Renewable Energy Law and Policy: A Critical Review. Renew. Sustain. Energy Rev. 2019, 99, 212–219. [Google Scholar] [CrossRef]
  10. Zhang, L. The Impact of “Carbon Neutrality and Peaking” on China’s Renewable Energy Legislation and Its Countermeasures. North. Leg. Sci. 2022, 2, 16–26. [Google Scholar]
  11. Abolhosseini, S.; Heshmati, A. The Main Support Mechanisms to Finance Renewable Energy Development. Renew. Sustain. Energy Rev. 2014, 40, 876–885. [Google Scholar] [CrossRef]
  12. Tian, Q. Institutional Arrangement of Renewable Energy Development Under the Background of Green Energy Revolution. Acad. J. Zhongzhou 2019, 41, 89–94. [Google Scholar]
  13. Liu, D.; Liu, M.; Xu, E.; Pang, B.; Guo, X.; Xiao, B.; Niu, D. Comprehensive Effectiveness Assessment of Renewable Energy Generation Policy: A Partial Equilibrium Analysis in China. Energy Policy 2018, 115, 330–341. [Google Scholar] [CrossRef]
  14. Lo, K. A Critical Review of China’s Rapidly Developing Renewable Energy and Energy Efficiency Policies. Renew. Sustain. Energy Rev. 2014, 29, 508–516. [Google Scholar] [CrossRef]
  15. Polzin, F.; Egli, F.; Steffen, B.; Schmidt, T.S. How Do Policies Mobilize Private Finance for Renewable Energy?—A Systematic Review with an Investor Perspective. Appl. Energy 2019, 236, 1249–1268. [Google Scholar] [CrossRef]
  16. Zhang, Z.; Luo, C.; Zhang, G.; Shu, Y.; Shao, S. New Energy Policy and Green Technology Innovation of New Energy Enterprises: Evidence from China. Energy Econ. 2024, 136, 107743. [Google Scholar] [CrossRef]
  17. Li, Q.; Zhao, Y.; Liu, B. Quantitative Analysis of New Energy Industry Policy and Its Environmental Protection Effect. J. Beijing Inst. Technol. (Soc. Sci. Ed.) 2021, 23, 30–39. [Google Scholar]
  18. Wei, R.; Qin, P. Research on the Security of the Policies and Regulations System of the New Energy Industry Development in Shandong Province. China Popul.,Resour. Environ. 2015, 25, 137–143. [Google Scholar]
  19. Dong, F.; Liu, Y. Policy Evolution and Effect Evaluation of New-Energy Vehicle Industry in China. Resour. Policy 2020, 67, 101655. [Google Scholar] [CrossRef]
  20. Le, W.; He, Y. The Industrial Policy Synergy and Market Penetration of New-Energy Vehicle Industry. J. Manag. 2019, 32, 20–29. [Google Scholar]
  21. Pang, D.; Bu, R.; Liu, Z. Suggestions on the Evolution and Optimization of Institutional Arrangements for China’s New Energy Vehicles Industry. Econ. Rev. J. 2022, 4, 106–115. [Google Scholar]
  22. Su, C.-W.; Yuan, X.; Tao, R.; Umar, M. Can New Energy Vehicles Help to Achieve Carbon Neutrality Targets? J. Environ. Manag. 2021, 297, 113348. [Google Scholar] [CrossRef]
  23. Wang, L.; Zhang, Y. Research on Policy Synergy of New Energy Automobile Industry in China-Based on Three-Dimensional Analysis Framework of Structure, Process and Content. Chin. Public Adm. 2017, 3, 101–107. [Google Scholar]
  24. Yang, T.; Xing, C.; Li, X. Evaluation and Analysis of New-Energy Vehicle Industry Policies in the Context of Technical Innovation in China. J. Clean. Prod. 2021, 281, 125126. [Google Scholar] [CrossRef]
  25. Cui, Y.; Khan, S.U.; Li, Z.; Zhao, M. Environmental Effect, Price Subsidy and Financial Performance: Evidence from Chinese New Energy Enterprises. Energy Policy 2021, 149, 112050. [Google Scholar] [CrossRef]
  26. Wu, S. Fiscal Policy and the Development of New Energy Industry: A Fiscal Sociological Analysis of the Weakened Effect of Policy. J. Minzu Univ. China(Philos. Soc. Sci. Ed.) 2013, 40, 101–108. [Google Scholar]
  27. Zhao, D.; Ji, S.; Wang, H.; Jiang, L. How Do Government Subsidies Promote New Energy Vehicle Diffusion in the Complex Network Context? A Three-Stage Evolutionary Game Model. Energy 2021, 230, 120899. [Google Scholar] [CrossRef]
  28. Qi, X.; Guo, Y.; Guo, P.; Yao, X.; Liu, X. Do Subsidies and R&D Investment Boost Energy Transition Performance? Evidence from Chinese Renewable Energy Firms. Energy Policy 2022, 164, 112909. [Google Scholar] [CrossRef]
  29. Sun, Y.-F.; Zhang, Y.-J.; Su, B. Impact of Government Subsidy on the Optimal R&D and Advertising Investment in the Cooperative Supply Chain of New Energy Vehicles. Energy Policy 2022, 164, 112885. [Google Scholar] [CrossRef]
  30. Zhou, Y.; Pan, Y. Subsidization versus Tax Reduction:The Policy Choice for New Energy Vehicles under the Constraints of Transaction Costs. J. Manag. World 2019, 35, 133–149. [Google Scholar]
  31. Lin, B.; Zhang, A. Government Subsidies, Market Competition and the TFP of New Energy Enterprises. Renew. Energy 2023, 216, 119090. [Google Scholar] [CrossRef]
  32. Feng, Y.; Nie, C. Re-Examining the Effect of China’s New-Energy Demonstration Cities Construction Policy on Environmental Pollution: A Perspective of Pollutant Emission Intensity Control. J. Environ. Plan. Manag. 2022, 65, 2333–2361. [Google Scholar] [CrossRef]
  33. Gao, W.; Hu, X. New Energy Vehicle Policy Effect: Does Scale or Innovation Serve as an Intermediary? Sci. Res. Manag. 2020, 41, 32–44. [Google Scholar]
  34. Huang, C.; Su, J.; Shi, L.; Cheng, X. Textual and Quantitative Research on Chinese Wind Energy Policy System from the Perspective of Policy Tools. Stud. Sci. Sci. 2011, 29, 876–882. [Google Scholar]
  35. Sokołowski, M.M.; Heffron, R.J. Defining and Conceptualising Energy Policy Failure: The When, Where, Why, and How. Energy Policy 2022, 161, 112745. [Google Scholar] [CrossRef]
  36. Sun, R.; Wu, X. A Quantitative Study Based on Content Analysis of Chinese Strategic Emerging Industrial Policies. Sci. Sci. Manag. S.& T 2015, 36, 3–9. [Google Scholar]
  37. Zeng, J.; Hu, J. Textual and Quantitative Research of Solar Industry in China from the Perspective of Policy Tools. Sci. Technol. Manag. Res. 2014, 34, 224–228. [Google Scholar]
  38. Peng, J.; Zhong, W.; Sun, W. The Measurement and the Coordinated Evolution of Politics, and Economic Performance: A Case Study on the Policy for Innovation. J. Manag. World 2008, 9, 25–36. [Google Scholar]
  39. Lan, Z. Evaluation of the Efficacy, Effect and Coordination of Renewable Energy Policies in China: Quantitative Analysis of Policy Documents from 1995 to 2018. J. Dalian Univ. Technol. (Soc. Sci.) 2021, 42, 112–122. [Google Scholar]
  40. Zhang, G.; Gao, X.; Wang, X.; Guo, J.; Wang, S. Measurement, Coordination and Evolution of Energy Conservation and Emission Reduction Policies in China: Based on the Research of the Policy Data from 1978 to 2013. China Popul. Resour. Environ. 2014, 24, 62–73. [Google Scholar]
  41. Verbruggen, A.; Lauber, V. Assessing the Performance of Renewable Electricity Support Instruments. Energy Policy 2012, 45, 635–644. [Google Scholar] [CrossRef]
  42. Bersalli, G.; Menanteau, P.; El-Methni, J. Renewable Energy Policy Effectiveness: A Panel Data Analysis across Europe and Latin America. Renew. Sustain. Energy Rev. 2020, 133, 110351. [Google Scholar] [CrossRef]
  43. Wang, Y. Renewable Electricity in Sweden: An Analysis of Policy and Regulations. Energy Policy 2006, 34, 1209–1220. [Google Scholar] [CrossRef]
  44. De Miera, G.S.; del Río González, P.; Vizcaíno, I. Analysing the Impact of Renewable Electricity Support Schemes on Power Prices: The Case of Wind Electricity in Spain. Energy Policy 2008, 36, 3345–3359. [Google Scholar] [CrossRef]
  45. Zhao, X.; Mahendru, M.; Ma, X.; Rao, A.; Shang, Y. Impacts of Environmental Regulations on Green Economic Growth in China: New Guidelines Regarding Renewable Energy and Energy Efficiency. Renew. Energy 2022, 187, 728–742. [Google Scholar] [CrossRef]
  46. Bertoldi, P.; Mosconi, R. Do Energy Efficiency Policies Save Energy? A New Approach Based on Energy Policy Indicators (in the EU Member States). Energy Policy 2020, 139, 111320. [Google Scholar] [CrossRef]
  47. Liu, W.; Zhang, X.; Feng, S. Does Renewable Energy Policy Work? Evidence from a Panel Data Analysis. Renew. Energy 2019, 135, 635–642. [Google Scholar] [CrossRef]
  48. Zhao, Y.; Tang, K.K.; Wang, L. Do Renewable Electricity Policies Promote Renewable Electricity Generation? Evidence from Panel Data. Energy Policy 2013, 62, 887–897. [Google Scholar] [CrossRef]
  49. Liu, Y.; Feng, C. Promoting Renewable Energy through National Energy Legislation. Energy Econ. 2023, 118, 106504. [Google Scholar] [CrossRef]
  50. Cheng, Z.; Kai, Z.; Zhu, S. Does Green Finance Regulation Improve Renewable Energy Utilization? Evidence from Energy Consumption Efficiency. Renew. Energy 2023, 208, 63–75. [Google Scholar] [CrossRef]
  51. Lund, P.D. Effectiveness of Policy Measures in Transforming the Energy System. Energy Policy 2007, 35, 627–639. [Google Scholar] [CrossRef]
  52. Ullah, S.; Luo, R.; Nadeem, M.; Cifuentes-Faura, J. Advancing Sustainable Growth and Energy Transition in the United States through the Lens of Green Energy Innovations, Natural Resources and Environmental Policy. Resour. Policy 2023, 85, 103848. [Google Scholar] [CrossRef]
  53. Jin, X.; Ahmed, Z.; Pata, U.K.; Kartal, M.T.; Erdogan, S. Do Investments in Green Energy, Energy Efficiency, and Nuclear Energy R&D Improve the Load Capacity Factor? An Augmented ARDL Approach. Geosci. Front. 2024, 15, 101646. [Google Scholar] [CrossRef]
  54. Hille, E.; Althammer, W.; Diederich, H. Environmental Regulation and Innovation in Renewable Energy Technologies: Does the Policy Instrument Matter? Technol. Forecast. Soc. Chang. 2020, 153, 119921. [Google Scholar] [CrossRef]
  55. Carley, S. State Renewable Energy Electricity Policies: An Empirical Evaluation of Effectiveness. Energy Policy 2009, 37, 3071–3081. [Google Scholar] [CrossRef]
  56. Yang, X.; Zhang, J.; Ren, S.; Ran, Q. Can the New Energy Demonstration City Policy Reduce Environmental Pollution? Evidence from a Quasi-Natural Experiment in China. J. Clean. Prod. 2021, 287, 125015. [Google Scholar] [CrossRef]
  57. Cheng, Z.; Yu, X.; Zhang, Y. Is the Construction of New Energy Demonstration Cities Conducive to Improvements in Energy Efficiency? Energy 2023, 263, 125517. [Google Scholar] [CrossRef]
  58. Jia, L.; Cheng, P.; Yu, Y.; Chen, S.; Wang, C.; He, L.; Nie, H.; Wang, J.; Zhang, J.; Fan, B. Regeneration Mechanism of a Novel High-Performance Biochar Mercury Adsorbent Directionally Modified by Multimetal Multilayer Loading. J. Environ. Manag. 2023, 326, 116790. [Google Scholar] [CrossRef]
  59. Yang, S.; Jahanger, A.; Hossain, M.R. Does China’s Low-Carbon City Pilot Intervention Limit Electricity Consumption? An Analysis of Industrial Energy Efficiency Using Time-Varying DID Model. Energy Econ. 2023, 121, 106636. [Google Scholar] [CrossRef]
  60. Iqbal, W.; Tang, Y.M.; Lijun, M.; Chau, K.Y.; Xuan, W.; Fatima, A. Energy Policy Paradox on Environmental Performance: The Moderating Role of Renewable Energy Patents. J. Environ. Manag. 2021, 297, 113230. [Google Scholar] [CrossRef] [PubMed]
  61. Qudrat-Ullah, H. A Review and Analysis of Renewable Energy Policies and CO2 Emissions of Pakistan. Energy 2022, 238, 121849. [Google Scholar] [CrossRef]
  62. Zhu, H.; Zheng, J.; Zhao, Q. Kou Economic Growth, Energy Structure Transformation and Carbon Dioxide Emission—Empirical Analysis Based on Panel Data. Res. Econ. Manag. 2020, 41, 19–34. [Google Scholar]
  63. Chishti, M.Z.; Dogan, E. Analyzing the Determinants of Renewable Energy: The Moderating Role of Technology and Macroeconomic Uncertainty. Energy Environ. 2024, 35, 874–903. [Google Scholar] [CrossRef]
  64. Samant, S.; Thakur-Wernz, P.; Hatfield, D.E. Does the Focus of Renewable Energy Policy Impact the Nature of Innovation? Evidence from Emerging Economies. Energy Policy 2020, 137, 111119. [Google Scholar] [CrossRef]
  65. Li, Y.; Yang, X.; Ran, Q.; Wu, H.; Irfan, M.; Ahmad, M. Energy Structure, Digital Economy, and Carbon Emissions: Evidence from China. Environ. Sci. Pollut. Res. 2021, 28, 64606–64629. [Google Scholar] [CrossRef] [PubMed]
  66. Zeng, S.; Su, B.; Zhang, M.; Gao, Y.; Liu, J.; Luo, S.; Tao, Q. Analysis and Forecast of China’s Energy Consumption Structure. Energy Policy 2021, 159, 112630. [Google Scholar] [CrossRef]
  67. Lee, C.-C.; Zhang, J.; Hou, S. The Impact of Regional Renewable Energy Development on Environmental Sustainability in China. Resour. Policy 2023, 80, 103245. [Google Scholar] [CrossRef]
  68. Adams, S.; Acheampong, A.O. Reducing Carbon Emissions: The Role of Renewable Energy and Democracy. J. Clean. Prod. 2019, 240, 118245. [Google Scholar] [CrossRef]
  69. Azam, A.; Rafiq, M.; Shafique, M.; Zhang, H.; Yuan, J. Analyzing the Effect of Natural Gas, Nuclear Energy and Renewable Energy on GDP and Carbon Emissions: A Multi-Variate Panel Data Analysis. Energy 2021, 219, 119592. [Google Scholar] [CrossRef]
  70. Razmjoo, A.; Kaigutha, L.G.; Rad, M.V.; Marzband, M.; Davarpanah, A.; Denai, M. A Technical Analysis Investigating Energy Sustainability Utilizing Reliable Renewable Energy Sources to Reduce CO2 Emissions in a High Potential Area. Renew. Energy 2021, 164, 46–57. [Google Scholar] [CrossRef]
  71. Yao, S.; Zhang, S.; Zhang, X. Renewable Energy, Carbon Emission and Economic Growth: A Revised Environmental Kuznets Curve Perspective. J. Clean. Prod. 2019, 235, 1338–1352. [Google Scholar] [CrossRef]
  72. Li, S.; Samour, A.; Irfan, M.; Ali, M. Role of Renewable Energy and Fiscal Policy on Trade Adjusted Carbon Emissions: Evaluating the Role of Environmental Policy Stringency. Renew. Energy 2023, 205, 156–165. [Google Scholar] [CrossRef]
  73. Tian, J.; Fu, S.; Liu, X. Can Fiscal Expenditure Policy Achieve Synergistic Effects of Pollution Reduction and Carbon Reduction? Fisc. Sci. 2022, 2, 100–115. [Google Scholar]
  74. Tian, S.; Dong, W.; Xu, W. Environmental Fiscal Expenditure, Environmental Regulation and Policy Effects. Inq. Into Econ. Issues 2016, 7, 14–21. [Google Scholar]
  75. Zhang, L. The Effects of Environmental Policy and Environmental Expenditure on Regional Carbon Emissions—On the Role of Government’s Executive Ability. Price Theory Pract. 2018, 6, 38–41. [Google Scholar]
  76. Yin, Z.; Xie, L. Research on the Differential Mechanism of the Impact of Environmental Fiscal and Tax Policies on Regional Carbon Emissions. Jiangxi Soc. Sci. 2021, 41, 46–57+254–255. [Google Scholar]
  77. Ren, X.; Ma, Q.; Liu, Y.; Zhao, G. The Impact of Carbon Trading Policy on Industrial Carbon Productivity and Its Transmission Mechanism. China Environ. Sci. 2021, 41, 5427–5437. [Google Scholar]
  78. Fuinhas, J.A.; Marques, A.C.; Koengkan, M. Are Renewable Energy Policies Upsetting Carbon Dioxide Emissions? The Case of Latin America Countries. Environ. Sci. Pollut. Res. 2017, 24, 15044–15054. [Google Scholar] [CrossRef]
  79. Zeng, J.; Liu, T.; Feiock, R.; Li, F. The Impacts of China’s Provincial Energy Policies on Major Air Pollutants: A Spatial Econometric Analysis. Energy Policy 2019, 132, 392–403. [Google Scholar] [CrossRef]
  80. Jiang, B.; Raza, M.Y. Research on China’s Renewable Energy Policies under the Dual Carbon Goals: A Political Discourse Analysis. Energy Strategy Rev. 2023, 48, 101118. [Google Scholar] [CrossRef]
  81. Chen, X.H.; Tee, K.; Elnahass, M.; Ahmed, R. Assessing the Environmental Impacts of Renewable Energy Sources: A Case Study on Air Pollution and Carbon Emissions in China. J. Environ. Manag. 2023, 345, 118525. [Google Scholar] [CrossRef]
  82. Liu, W.; Shen, Y.; Razzaq, A. How Renewable Energy Investment, Environmental Regulations, and Financial Development Derive Renewable Energy Transition: Evidence from G7 Countries. Renew. Energy 2023, 206, 1188–1197. [Google Scholar] [CrossRef]
  83. Zhang, J. A Method of Intelligence Key Words Extraction Based on Improved TF-IDF. J. Intell. 2014, 33, 153–155. [Google Scholar]
  84. Chen, Y. Spatial Autocorrelation Equation Based on Moran’s Index. Sci. Rep. 2023, 13, 19296. [Google Scholar] [CrossRef]
  85. LeSage, J.; Pace, R.K. Introduction to Spatial Econometrics; Chapman and Hall/CRC: Boca Raton, FL, USA, 2009; ISBN 0-429-13808-3. [Google Scholar]
  86. Martinot, E. Renewable Power for China: Past, Present, and Future. Front. Energy Power Eng. China 2010, 4, 287–294. [Google Scholar] [CrossRef]
  87. Zhou, F. The Problems of Fiscal Earmarked Funds:On “Governing the State through Programs”. Chin. J. Sociol. 2012, 32, 1–37. [Google Scholar]
  88. Zhou, X. The Project System:A Perspective of the “Controlling Power” Theory. Open Times 2015, 2, 82–102. [Google Scholar]
  89. Han, M.; Sun, R.; Feng, P.; Hua, E. Unveiling Characteristics and Determinants of China’s Wind Power Geographies towards Low-Carbon Transition. J. Environ. Manag. 2023, 331, 117215. [Google Scholar] [CrossRef]
  90. Li, X.; Pan, L.; Zhang, J. Development Status Evaluation and Path Analysis of Regional Clean Energy Power Generation in China. Energy Strategy Rev. 2023, 49, 101139. [Google Scholar] [CrossRef]
  91. Liu, Y.; Peng, M. Research on Peak Load Shifting for Hybrid Energy System with Wind Power and Energy Storage Based on Situation Awareness. J. Energy Storage 2024, 82, 110472. [Google Scholar] [CrossRef]
  92. Ding, Z. Report on Inspection of the Implementation of the Renewable Energy Law of the People’s Republic of China of the Law Enforcement Inspection Team of the Standing Committee of the National People’s Congress; The Standing Committee of the National People’s Congress: Beijing, China, 2019.
  93. Liu, S.; Chen, P.; Cheng, L.; Xu, S.; Gao, J.; Jiao, K. Research on Fiscal, Tax and Financial Support Policies for Renewable Energy Industry Under Carbon Peak and Carbon Emission Neutrality Targets. Chin. J. Environ. Manag. 2022, 14, 40–43. [Google Scholar] [CrossRef]
  94. Wu, J.; Zheng, Y. Henry Alfred Kissinger China in the Shadow—The Coming Social Crisis and Countermeasures; Jiangsu Literature and Art Publishing: Nanjing, China, 2013; ISBN 978-7-5399-6117-0. [Google Scholar]
  95. Lv, M.; Chen, Y.; Cao, L. Influencing Factor of Innovation Performance of New Energy Industry:Based on Perspective of Industrial Policy. J. Technol. Econ. 2016, 35, 43–50. [Google Scholar]
  96. Guan, Y.; Shan, Y.; Huang, Q.; Chen, H.; Wang, D.; Hubacek, K. Assessment to China’s Recent Emission Pattern Shifts. Earth’s Future 2021, 9, e2021EF002241. [Google Scholar] [CrossRef]
  97. Shan, Y.; Huang, Q.; Guan, D.; Hubacek, K. China CO2 Emission Accounts 2016–2017. Sci. Data 2020, 7, 54. [Google Scholar] [CrossRef] [PubMed]
  98. Shan, Y.; Guan, D.; Zheng, H.; Ou, J.; Li, Y.; Meng, J.; Mi, Z.; Liu, Z.; Zhang, Q. China CO2 Emission Accounts 1997–2015. Sci. Data 2018, 5, 170201. [Google Scholar] [CrossRef] [PubMed]
  99. Wang, X.; Jiang, Z.; Zheng, Y. Research on the Effectiveness of Wind Power Industrial Innovation Policy. Stud. Sci. Sci. 2019, 37, 1249–1257. [Google Scholar]
  100. Liao, H.; Cao, H.-S. How Does Carbon Dioxide Emission Change with the Economic Development? Statistical Experiences from 132 Countries. Glob. Environ. Chang. 2013, 23, 1073–1082. [Google Scholar] [CrossRef]
  101. Grossman, G.M.; Krueger, A.B. Economic Growth and the Environment. Q. J. Econ. 1995, 110, 353–377. [Google Scholar] [CrossRef]
  102. Tian, X.; Chang, M.; Shi, F.; Tanikawa, H. How Does Industrial Structure Change Impact Carbon Dioxide Emissions? A Comparative Analysis Focusing on Nine Provincial Regions in China. Environ. Sci. Policy 2014, 37, 243–254. [Google Scholar] [CrossRef]
  103. Liu, J.; Wang, H.; Yang, J. Research into the Influential Factors of Air Pollution in China: An Analysis of Dynamic Spatial Panel Model of Chinese Cities. J. Hohai Univ. (Philos. Soc. Sci.) 2017, 19, 61–67. [Google Scholar]
  104. Han, F.; Xie, R.; Fang, J.; Liu, Y. The Effects of Urban Agglomeration Economies on Carbon Emissions: Evidence from Chinese Cities. J. Clean. Prod. 2018, 172, 1096–1110. [Google Scholar] [CrossRef]
  105. Liu, S.; Zhang, J. Spatial Distance, Spillover Effect and Environmental Pollution. Inq. Into Econ. Issues 2019, 1, 149–158. [Google Scholar]
  106. Hu, X.; Fang, Y. Study on Influencing Factors and Preventive Measures of Atmospheric Pollution in China—Based on STIRPAT Model and Fixed Effect Panel Model. J. Ind. Technol. Econ. 2018, 37, 107–113. [Google Scholar]
  107. Tan, F.; Yang, S.; Niu, Z. The Impact of Urbanization on Carbon Emissions: Both from Heterogeneity and Mechanism Test. Environ. Dev. Sustain. 2023, 25, 4813–4829. [Google Scholar] [CrossRef]
  108. Zhang, X.-P.; Cheng, X.-M. Energy Consumption, Carbon Emissions, and Economic Growth in China. Ecol. Econ. 2009, 68, 2706–2712. [Google Scholar] [CrossRef]
  109. Shao, S.; Li, X.; Cao, J.; Yang, L. China’s Economic Policy Choices for Governing Smog Pollution Based on Spatial Spillover Effects. Econ. Res. J. 2016, 9, 73–88. [Google Scholar]
  110. Mur, J.; Angulo, A. The Spatial Durbin Model and the Common Factor Tests. Spat. Econ. Anal. 2006, 1, 207–226. [Google Scholar] [CrossRef]
  111. Plessmann, G.; Blechinger, P. How to Meet EU GHG Emission Reduction Targets? A Model Based Decarbonization Pathway for Europe’s Electricity Supply System until 2050. Energy Strategy Rev. 2017, 15, 19–32. [Google Scholar] [CrossRef]
  112. Notton, G.; Nivet, M.-L.; Voyant, C.; Paoli, C.; Darras, C.; Motte, F.; Fouilloy, A. Intermittent and Stochastic Character of Renewable Energy Sources: Consequences, Cost of Intermittence and Benefit of Forecasting. Renew. Sustain. Energy Rev. 2018, 87, 96–105. [Google Scholar] [CrossRef]
  113. Graabak, I.; Korpås, M. Variability Characteristics of European Wind and Solar Power Resources—A Review. Energies 2016, 9, 449. [Google Scholar] [CrossRef]
  114. Brass, J.N.; Carley, S.; MacLean, L.M.; Baldwin, E. Power for Development: A Review of Distributed Generation Projects in the Developing World. Annu. Rev. Environ. Resour. 2012, 37, 107–136. [Google Scholar] [CrossRef]
  115. Kitzing, L.; Mitchell, C.; Morthorst, P.E. Renewable Energy Policies in Europe: Converging or Diverging? Energy Policy 2012, 51, 192–201. [Google Scholar] [CrossRef]
  116. Wolde-Ghiorgis, W. Renewable Energy for Rural Development in Ethiopia: The Case for New Energy Policies and Institutional Reform. Energy Policy 2002, 30, 1095–1105. [Google Scholar] [CrossRef]
Figure 1. The framework of this paper.
Sustainability 16 06734 g001
Figure 2. Distribution and number of the three types of policies. Note: due to a lack of data, Hong Kong, Macau, Taiwan, and Xizang were not included in the statistics.
Sustainability 16 06734 g002
Figure 3. Word cloud graph of keywords for new energy.
Sustainability 16 06734 g003
Figure 4. Word cloud graph of keywords for photovoltaic power.
Sustainability 16 06734 g004
Figure 5. Changes in wind power policy quantity, policy intensity, and average policy intensity from 2006 to 2021.
Sustainability 16 06734 g005
Figure 6. Changes in the number, policy intensity, and average policy intensity of photovoltaic power generation policies from 2007 to 2022.
Sustainability 16 06734 g006
Figure 7. Changes in the number, policy intensity, and average policy intensity of new energy policies from 1999 to 2022.
Sustainability 16 06734 g007
Table 1. Quantity statistics of text types of new energy, wind power, and photovoltaic policies.
LawLocal RegulationsDepartment RulesLocal RulesNormative Documents of the State CouncilNormative Documents of the State Council DepartmentNormative Documents of Local Governments and Their DepartmentsTotal (Copies)
new energy21012186340442
wind power0001072331
photovoltaic power0001143216261
Table 2. Quantitative statistics of regional distribution of new energy, wind power, and photovoltaic policy documents.
Provinces (Municipalities)Number/CopiesProvinces (Municipalities)Number/CopiesProvinces (Municipalities)Number/CopiesProvinces (Municipalities)Number/Copies
new energy policyAnhui32Hebei26Liaoning4Sichuan7
Peking5Henan18Inner Mongolia11Tianjin2
Fujian11Heilongjiang5Nixia4Xinjiang4
Gansu5Hubei13Qinghai5Yunnan6
Guangdong17Hunan15Shandong20Zhejiang43
Guangxi16Jilin1Shanxi11Chongqing4
Guizhou3Jiangsu14Shaanxi9Shanghai14
Hainan9Jiangxi19
photovoltaic power policyAnhui22Hebei20Liaoning4Sichuan4
Peking4Henan12Inner Mongolia8Tianjin2
Fujian5Heilongjiang2Ningxia4Xinjiang2
Gansu2Hubei6Qinghai3Yunnan2
Guangdong13Hunan3Shandong9Zhejiang28
Guangxi10Jilin11Shanxi8Chongqing2
Guizhou2Jiangsu13Shaanxi7Shanghai5
Hainan5
wind power policyAnhui1Hebei3Inner Mongolia4Sichuan3
Fujian1Henan2Ningxia1Xinjiang1
Gansu1Heilongjiang1Guizhou1Shanghai1
Guangdong1Hubei1Jiangsu3
Note: Excluding the central-level policy documents, the total number of local new energy policy documents issued is 353. Excluding the central-level policy texts, the total number of local photovoltaic policy texts published is 218. Excluding the central-level policy texts, the total number of local wind power policy documents issued is 25.
Table 3. Keywords and TF-IDF values of wind power policy from 2006 to 2021.
KeywordsProjectsWind PowerWind FarmsPower StationWind EnergyElectricityEnergyEnterpriseNew EnergyQuantity
TF-IDF value0.31000.29000.19110.15580.12480.11450.09570.09230.08320.0803
Note: the TF-IDF value was reserved with four digits after the decimal point.
Table 4. Comparison of key words of new energy and photovoltaic power generation policies.
YearCategoryKeywords
1999new energyprojectelectricity priceloangridlocalizationequipmentbankstageproposalfeasibility study
2005new energyfilingauthorityruralprojectenergydepartmentelectric powerenterpriseprovisionelectricity price
2006new energyprojectmethanewind powerelectricity pricegridruralenterpriseauthorityspecial fundarchitecture
2007photovoltaic powersolar energyindustryenterpriseproducttechnologymunicipalityprojectgovernmenttalentincome tax
new energyprojectenterprisesolar energyruralgridindustrytechnologywind powerengineeringarchitecture
2008photovoltaic powersolar energyindustryprojectenterprisemunicipalityTinghu districtapprovalelectric companyproductgrid
new energysolar energyruralprojectindustryenterprisetechnologygridfundbiomass energyauthority
2009photovoltaic powerindustrysolar energyenterprisenew energyprojecttechnologymunicipalityproductfundtalent
new energyindustrysolar energyarchitectureprojectenterprisetechnologynew energyenergy efficiency in buildingsfundproduct
2010photovoltaic powerprojectcommissionindustryenterprisefocuswith districtssolar energyschedulingproductstandard
new energyprojectarchitectureauthorityruralspecial fundunittechnologysolar energyfundadministration
2011photovoltaic powersolar energyprojectindustryelectricity pricefiscalfilmsubsidysubsidizeenterpriseeconomic
new energyprojectarchitecturesolar energyhousingenergy efficiencyunitspecialGWHPtechnologysystem
2012photovoltaic powerloanelectricity priceopinionsprojectenterprisePrice Bureaustatesubsidyprovinceenergy
new energyprojectarchitectureelectricity priceOmbudsman’s officeunitGWHPenterprisegridelectricityspecial
2013photovoltaic powerdistributionprojectgridenterpriseenergyindustrypower stationauthoritysubsidyelectricity price
new energyprojectarchitecturedistributiongridenterpriseenergyindustryauthoritypower stationsubsidy
2014photovoltaic powerdistributionprojectgridenterprisepower stationindustryenergyfilingsubsidyroof
new energyprojectdistributiongridenterprisepower stationindustryenergyfilingsubsidyarchitecture
2015photovoltaic powerprojectdistributionfilingpower stationwoodlandgridenterpriseimpoverished villageimpoverished householdland use
new energyprojectdistributionfilingpower stationgridunitauthorityarchitectureenterprisespecial fund
2016photovoltaic powerprojectpower stationenterprisedistributionimpoverished householdfilinggridsubsidyroofindustry
new energyprojectpower stationenterprisegridenergydistributionimpoverished householdfilingsubsidyarchitecture
2017photovoltaic powerprojectpower stationroofdistributionenterpriseimpoverished villageimpoverished householdvillagegriddepartment
new energyprojectpower stationwind farmelectricityroofdistributionenterprisegridschedulingenergy
2018photovoltaic powerpower stationprojectvillageincome distributionsubsidystateimpoverished householdenergyenterpriseimpoverished village
new energypower stationprojectvillageincome distributionenterprisesubsidystateenergyimpoverished householdfund
2019photovoltaic powerpower stationprojectvillageincome distributionimpoverished householdincomeimpoverished villagedistributionenergyfund
new energypower stationprojectenergyvillageincome distributionimpoverished householdresponsibilityelectric powerstateincome
2020photovoltaic powerpower stationprojectvillageincome distributionimpoverished villageland usedistributionfundincomesubsidy
new energyprojectpower stationsubsidyvillagefundgridenergyincome distributiondistributionstate
2021photovoltaic powerprojectroofdistributionenergypower stationnew energyauthoritygridland useenterprise
new energyelectricityschedulinggeneratorselectric powerwind farmprojectpower stationgridpeak shavingenergy
2022photovoltaic powerdistributionprojectroofsubsidyarchitectureenterprisefilingunitenergysystem
new energydistributionprojectroofsubsidyarchitectureenergy efficiency in buildingsenergyenterpriseunitfiling
Note: the new energy policy covers the photovoltaic power generation policy, including the new energy policy from 1999 to 2022 and the photovoltaic power generation policy from 2007 to 2022.
Table 5. Grading table of levels and types of policy release units.
The Hierarchy of Policy Issuing UnitsScorePolicy TypeScore
central level1law, provincial regulations1
provincial level2department rules, provincial rules2
municipal level3normative documents of the State Council and its department3
district and county level4normative documents of local governments and their departments4
Note: the highest-level issuing unit shall prevail for the policy documents jointly issued by multiple institutions.
Table 6. Spatial correlation test results.
YearMoran’s IZ Valuep ValueYearMoran’s IZ Valuep Value
20050.1301.4590.07220130.1471.6880.046
20060.1521.6920.04520140.1631.8500.032
20070.1321.5000.06720150.1892.0530.020
20080.1821.9070.02820160.1952.0820.019
20090.1761.8430.03320170.1982.1390.016
20100.1511.5950.05520180.2062.2320.013
20110.1311.4120.07920190.1741.9280.027
20120.1551.6220.052
Table 7. Results of the LM test, LR test, and Wald test.
TestStatistical Valuep ValueTestStatistical Valuep Value
LM Lag44.8930.000LR Spatial Lag35.870.000
Robust LM Lag47.6650.000LR Spatial Lag28.680.000
LM Error1.4620.227Wald Spatial Lag7.230.301
Robust LM Error4.2350.040Wald Spatial Error7.510.276
Table 8. Estimation results of spatial panel Durbin model with fixed effect.
VariableTime Fixed EffectSpatial Fixation EffectTemporal Fixed EffectSLMSEM
Policy−0.092 ***
(−3.27)
−0.002 ***
(−2.73)
−0.013 ***
(−2.93)
−0.019 ***
(−2.98)
−0.021 ***
(−3.18)
GDP0.108 **
(2.50)
0.342 **
(2.10)
0.107 ***
(3.70)
0.239 ***
(3.48)
0.326 ***
(3.99)
Ind2.793 ***
(5.94)
0.332 *
(1.74)
0.220 ***
(2.94)
0.352 ***
(3.14)
0.347 ***
(3.04)
Pop0.199 *
(1.69)
−0.101 *
(1.84)
0.264 *
(1.85)
0.199 **
(2.24)
0.209 **
(2.04)
Urban−0.234
(−0.99)
−0.033
(−0.48)
−0.015 **
(−1.99)
−0.013 *
(−1.79)
−0.012 *
(−1.65)
Energy0.452 ***
(4.76)
0.665 ***
(5.01)
0.663 ***
(4.71)
0.700 ***
(4.83)
0.705 ***
(4.59)
W × Policy−0.014 **
(−2.01)
−0.047
(−1.11)
−0.020 ***
(−3.01)
−0.017 **
(−1.97)
−0.021 **
(−2.24)
W × GDP0.242
(1.19)
0.306 *
(1.85)
0.359
(1.29)
0.132 *
(1.66)
0.126 **
(2.29)
W × Ind0.324 *
(1.71)
0.779
(1.15)
0.462
(1.48)
0.336 *
(1.69)
0.388 *
(1.79)
W × Pop−0.051 **
(−2.50)
0.560 **
(2.08)
0.086 ***
(2.92)
0.096 ***
(2.82)
0.099 ***
(2.99)
W × Urban−0.106 **
(−2.03)
−0.036
(−1.37)
−0.052 **
(−2.02)
−0.058 **
(−2.52)
−0.066 ***
(−2.82)
W × Energy0.147 ***
(2.71)
0.113 **
(2.14)
0.108 ***
(2.98)
0.183 **
(2.54)
0.193 **
(2.55)
p0.381 ***
(7.26)
0.234 ***
(6.86)
0.399 ***
(7.11)
0.309 ***
(5.12)
0.292 ***
(7.33)
Log-Likelihood−362.195274.24242.202208.951212.038
R20.4940.3740.6470.4370.565
Note: * p < 0.1, ** p < 0.05, *** p < 0.01; T statistics are in brackets.
Table 9. Effect decomposition results of spatial panel Durbin model.
VariableDirect EffectIndirect Effect
Policy−0.020 ***
(−5.71)
−0.013 **
(−2.39)
GDP0.359 ***
(3.76)
0.007 *
(1.66)
Ind0.220 **
(4.73)
0.462 *
(1.74)
Pop0.264 **
(2.34)
0.087 **
(2.19)
Urban−0.015 ***
(−3.35)
−0.052 *
(−1.75)
Energy0.663 ***
(7.18)
0.108 ***
(6.48)
Note: * p < 0.1, ** p < 0.05, *** p < 0.01; T statistics are in brackets.
Disclaimer/Publisher’s Note: The statements, opinions and data contained in all publications are solely those of the individual author(s) and contributor(s) and not of MDPI and/or the editor(s). MDPI and/or the editor(s) disclaim responsibility for any injury to people or property resulting from any ideas, methods, instructions or products referred to in the content.

