


Spatiotemporal Evolution and Drivers of Carbon Storage from a Sustainable Development Perspective: A Case Study of the Region along the Middle and Lower Yellow River, China
Abstract
1. Introduction
2. Study Area and Data Sources
2.1. Overview of the Study Area
2.2. Data Sources and Processing
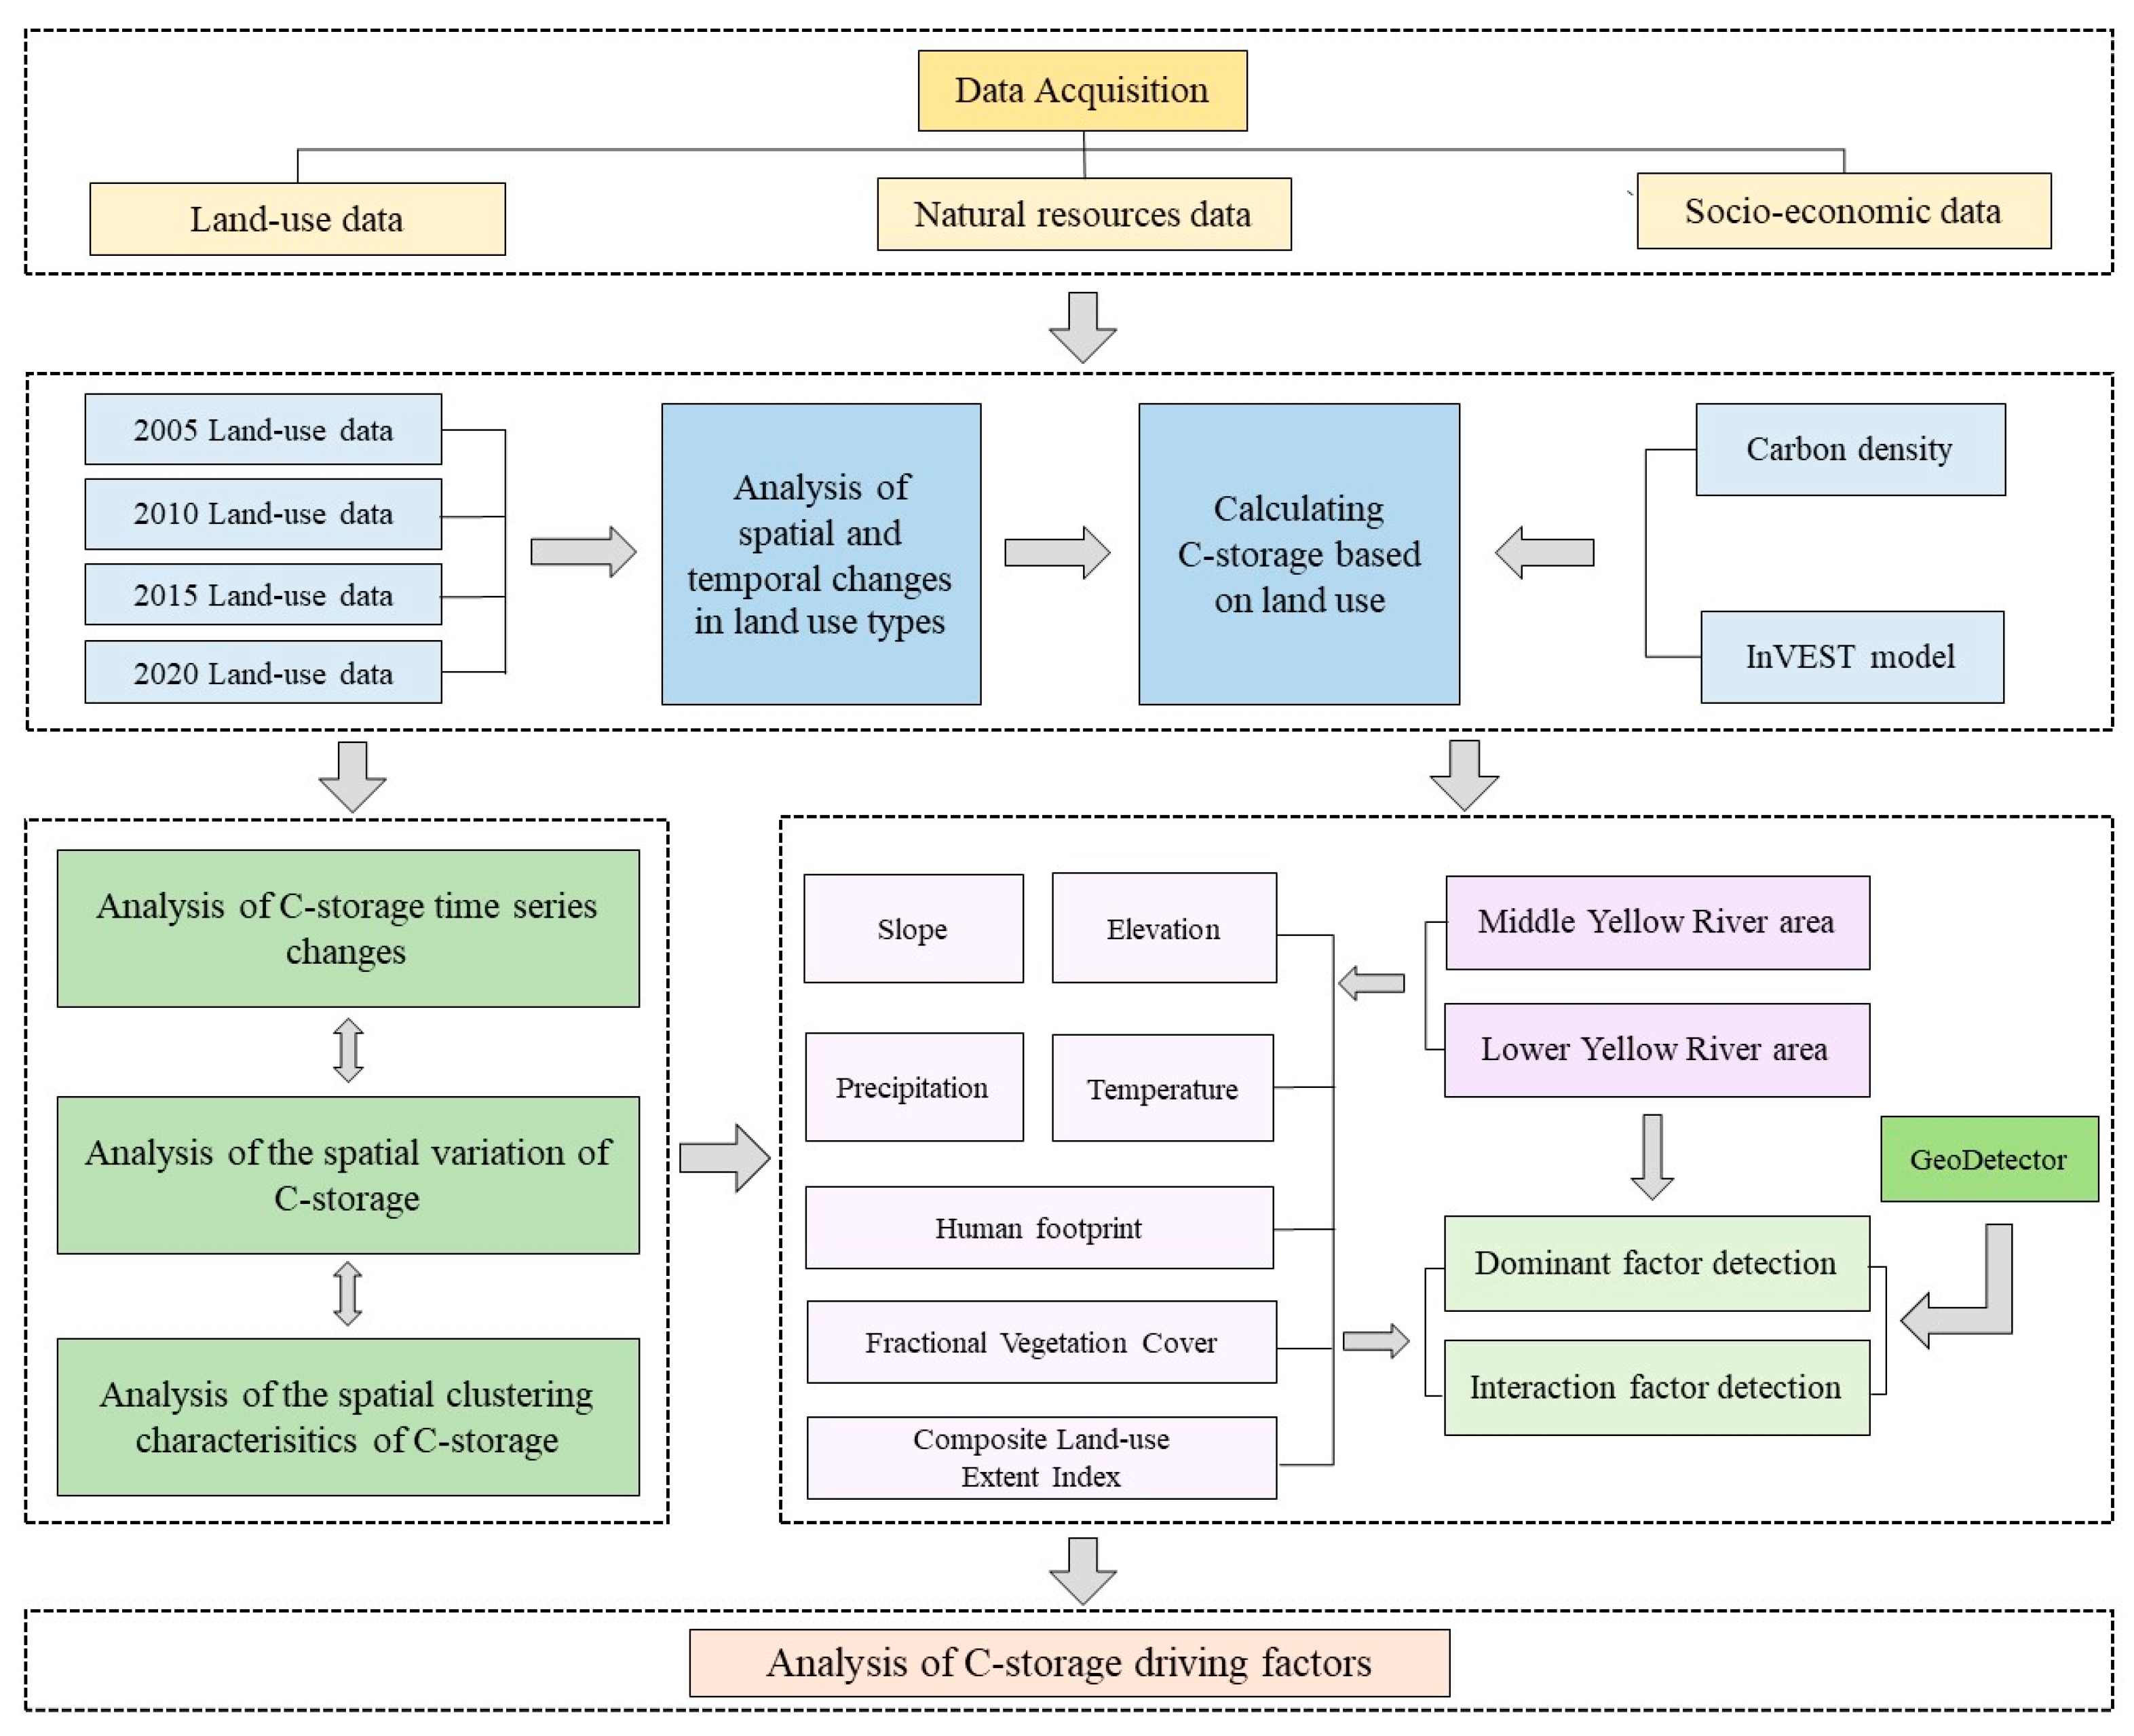
3. Methodology
3.1. InVEST Model
3.2. GeoDetector
3.2.1. Factor Detection
3.2.2. Interaction Detection
4. Results
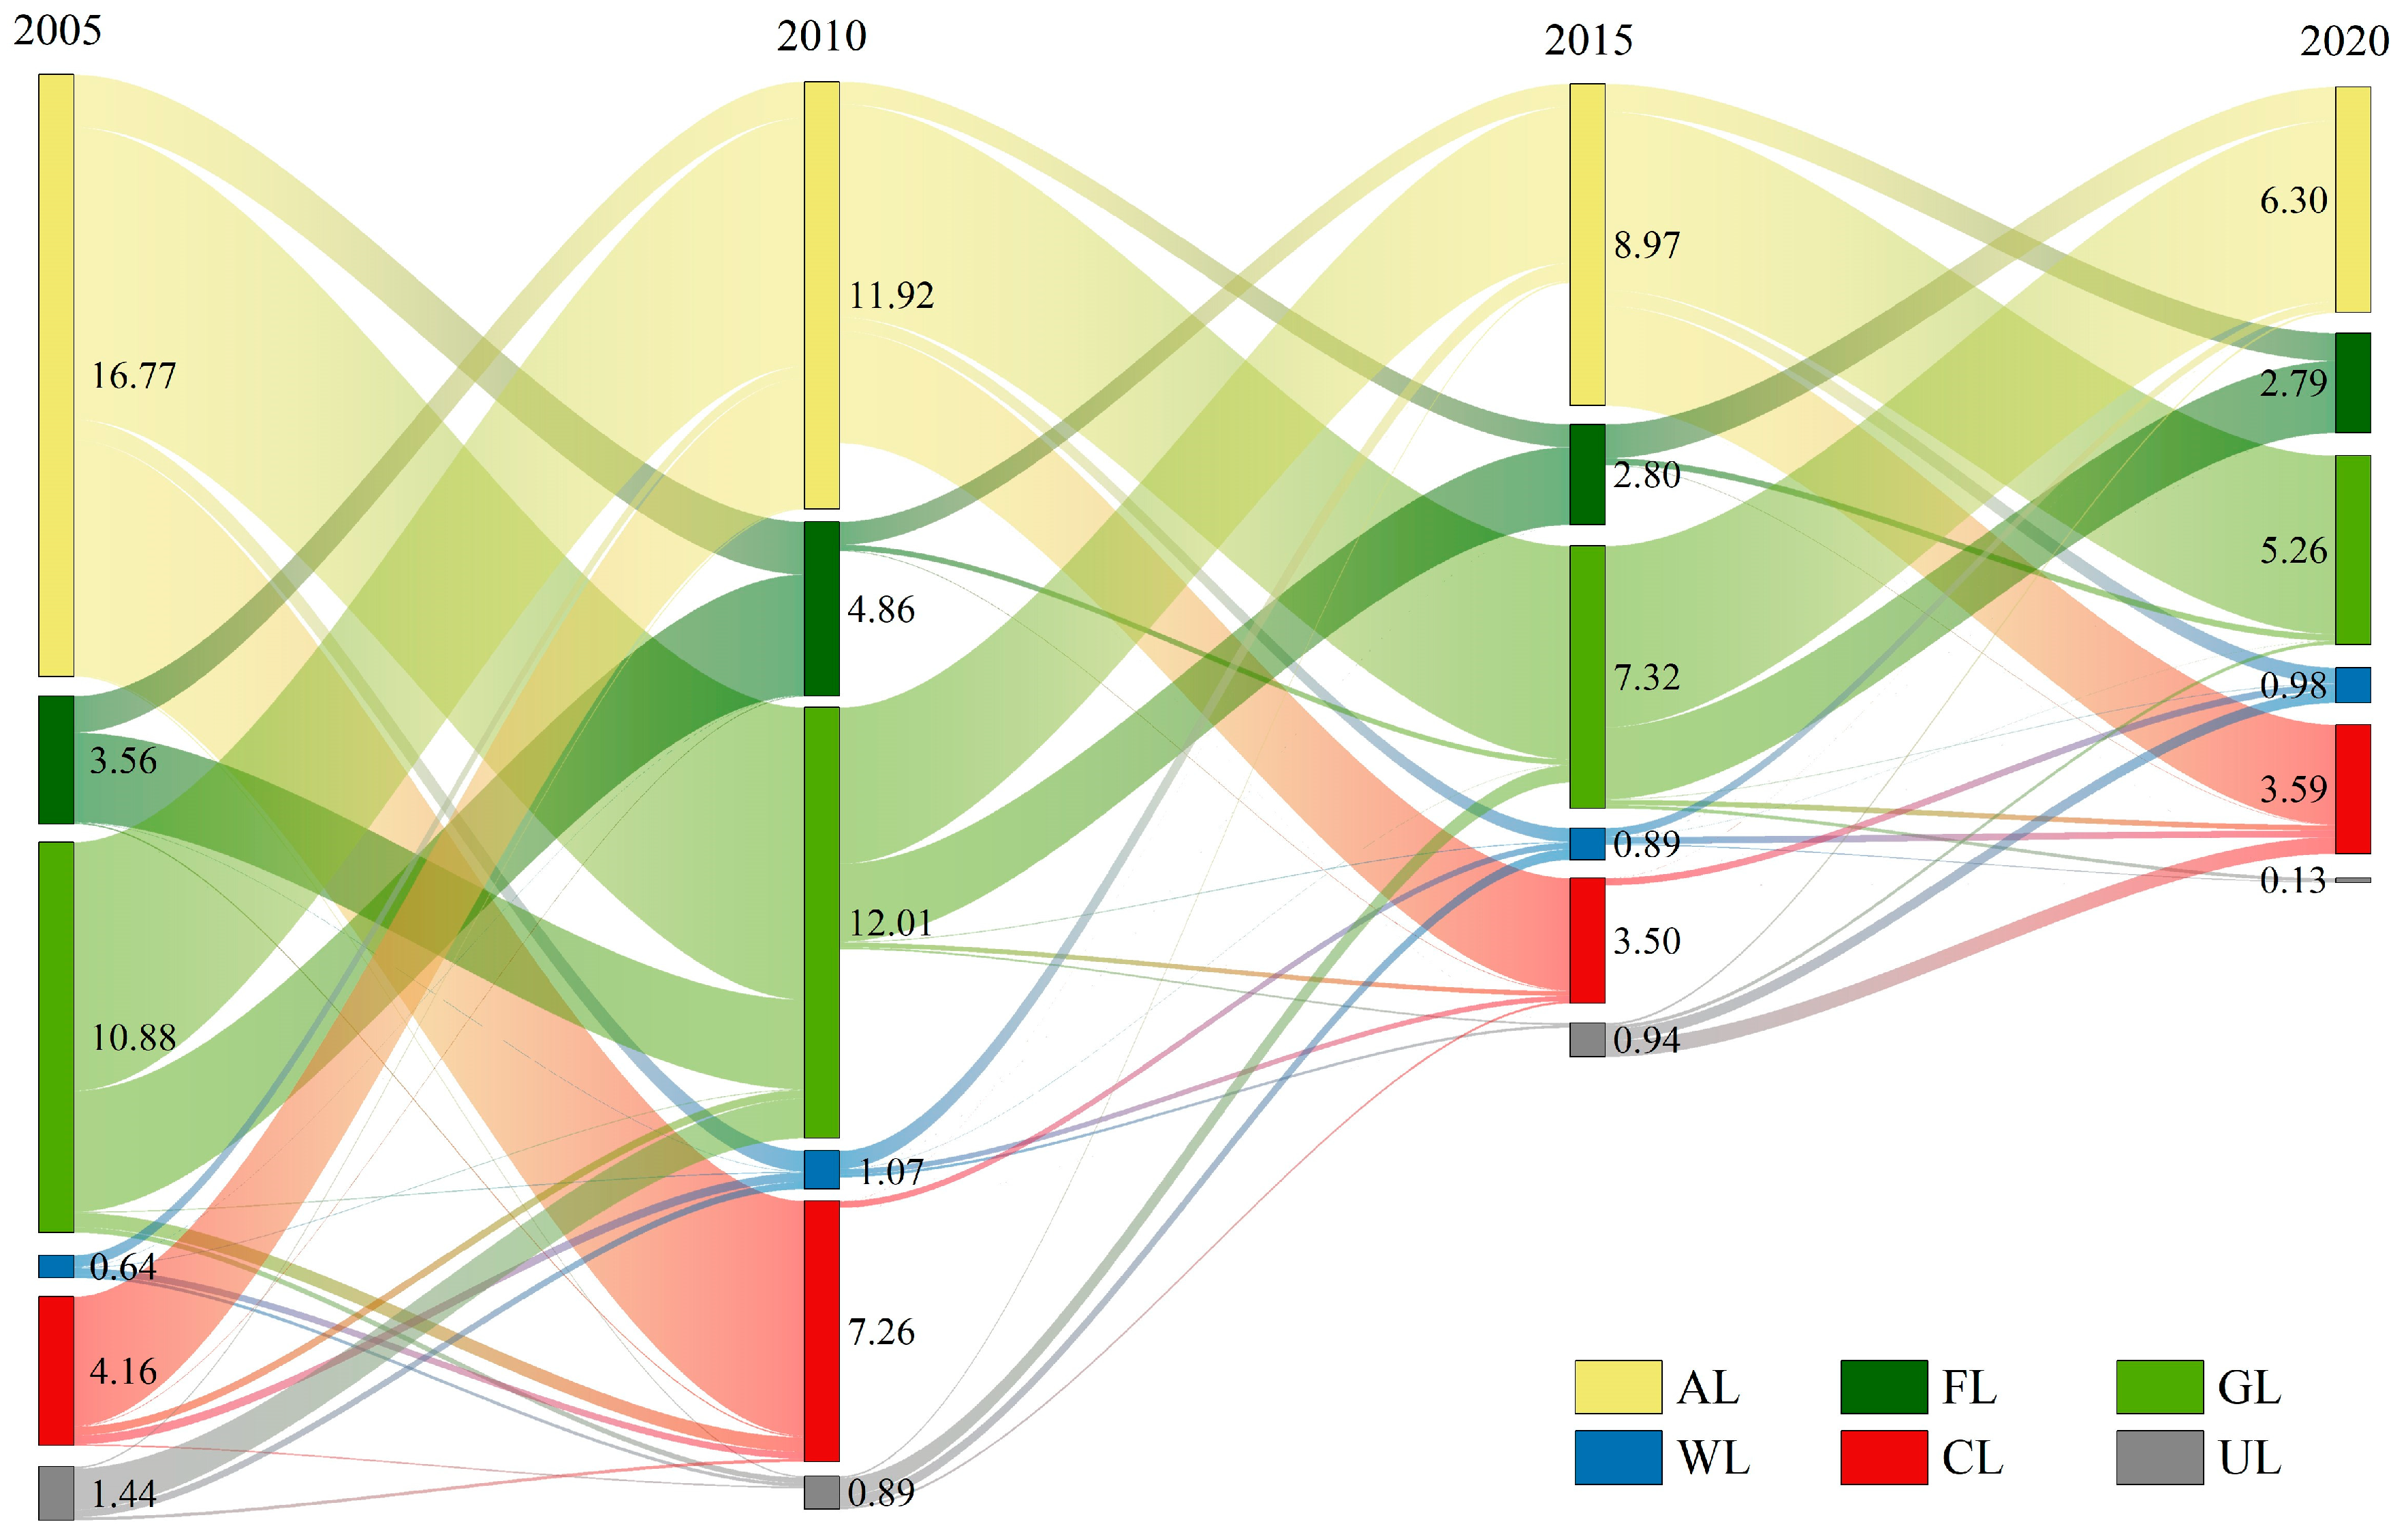
4.1. Temporal and Spatial Evolution of Land Use
4.2. Temporal and Spatial Evolution of C-Storage
4.2.1. Temporal Variation Characteristics of C-Storage
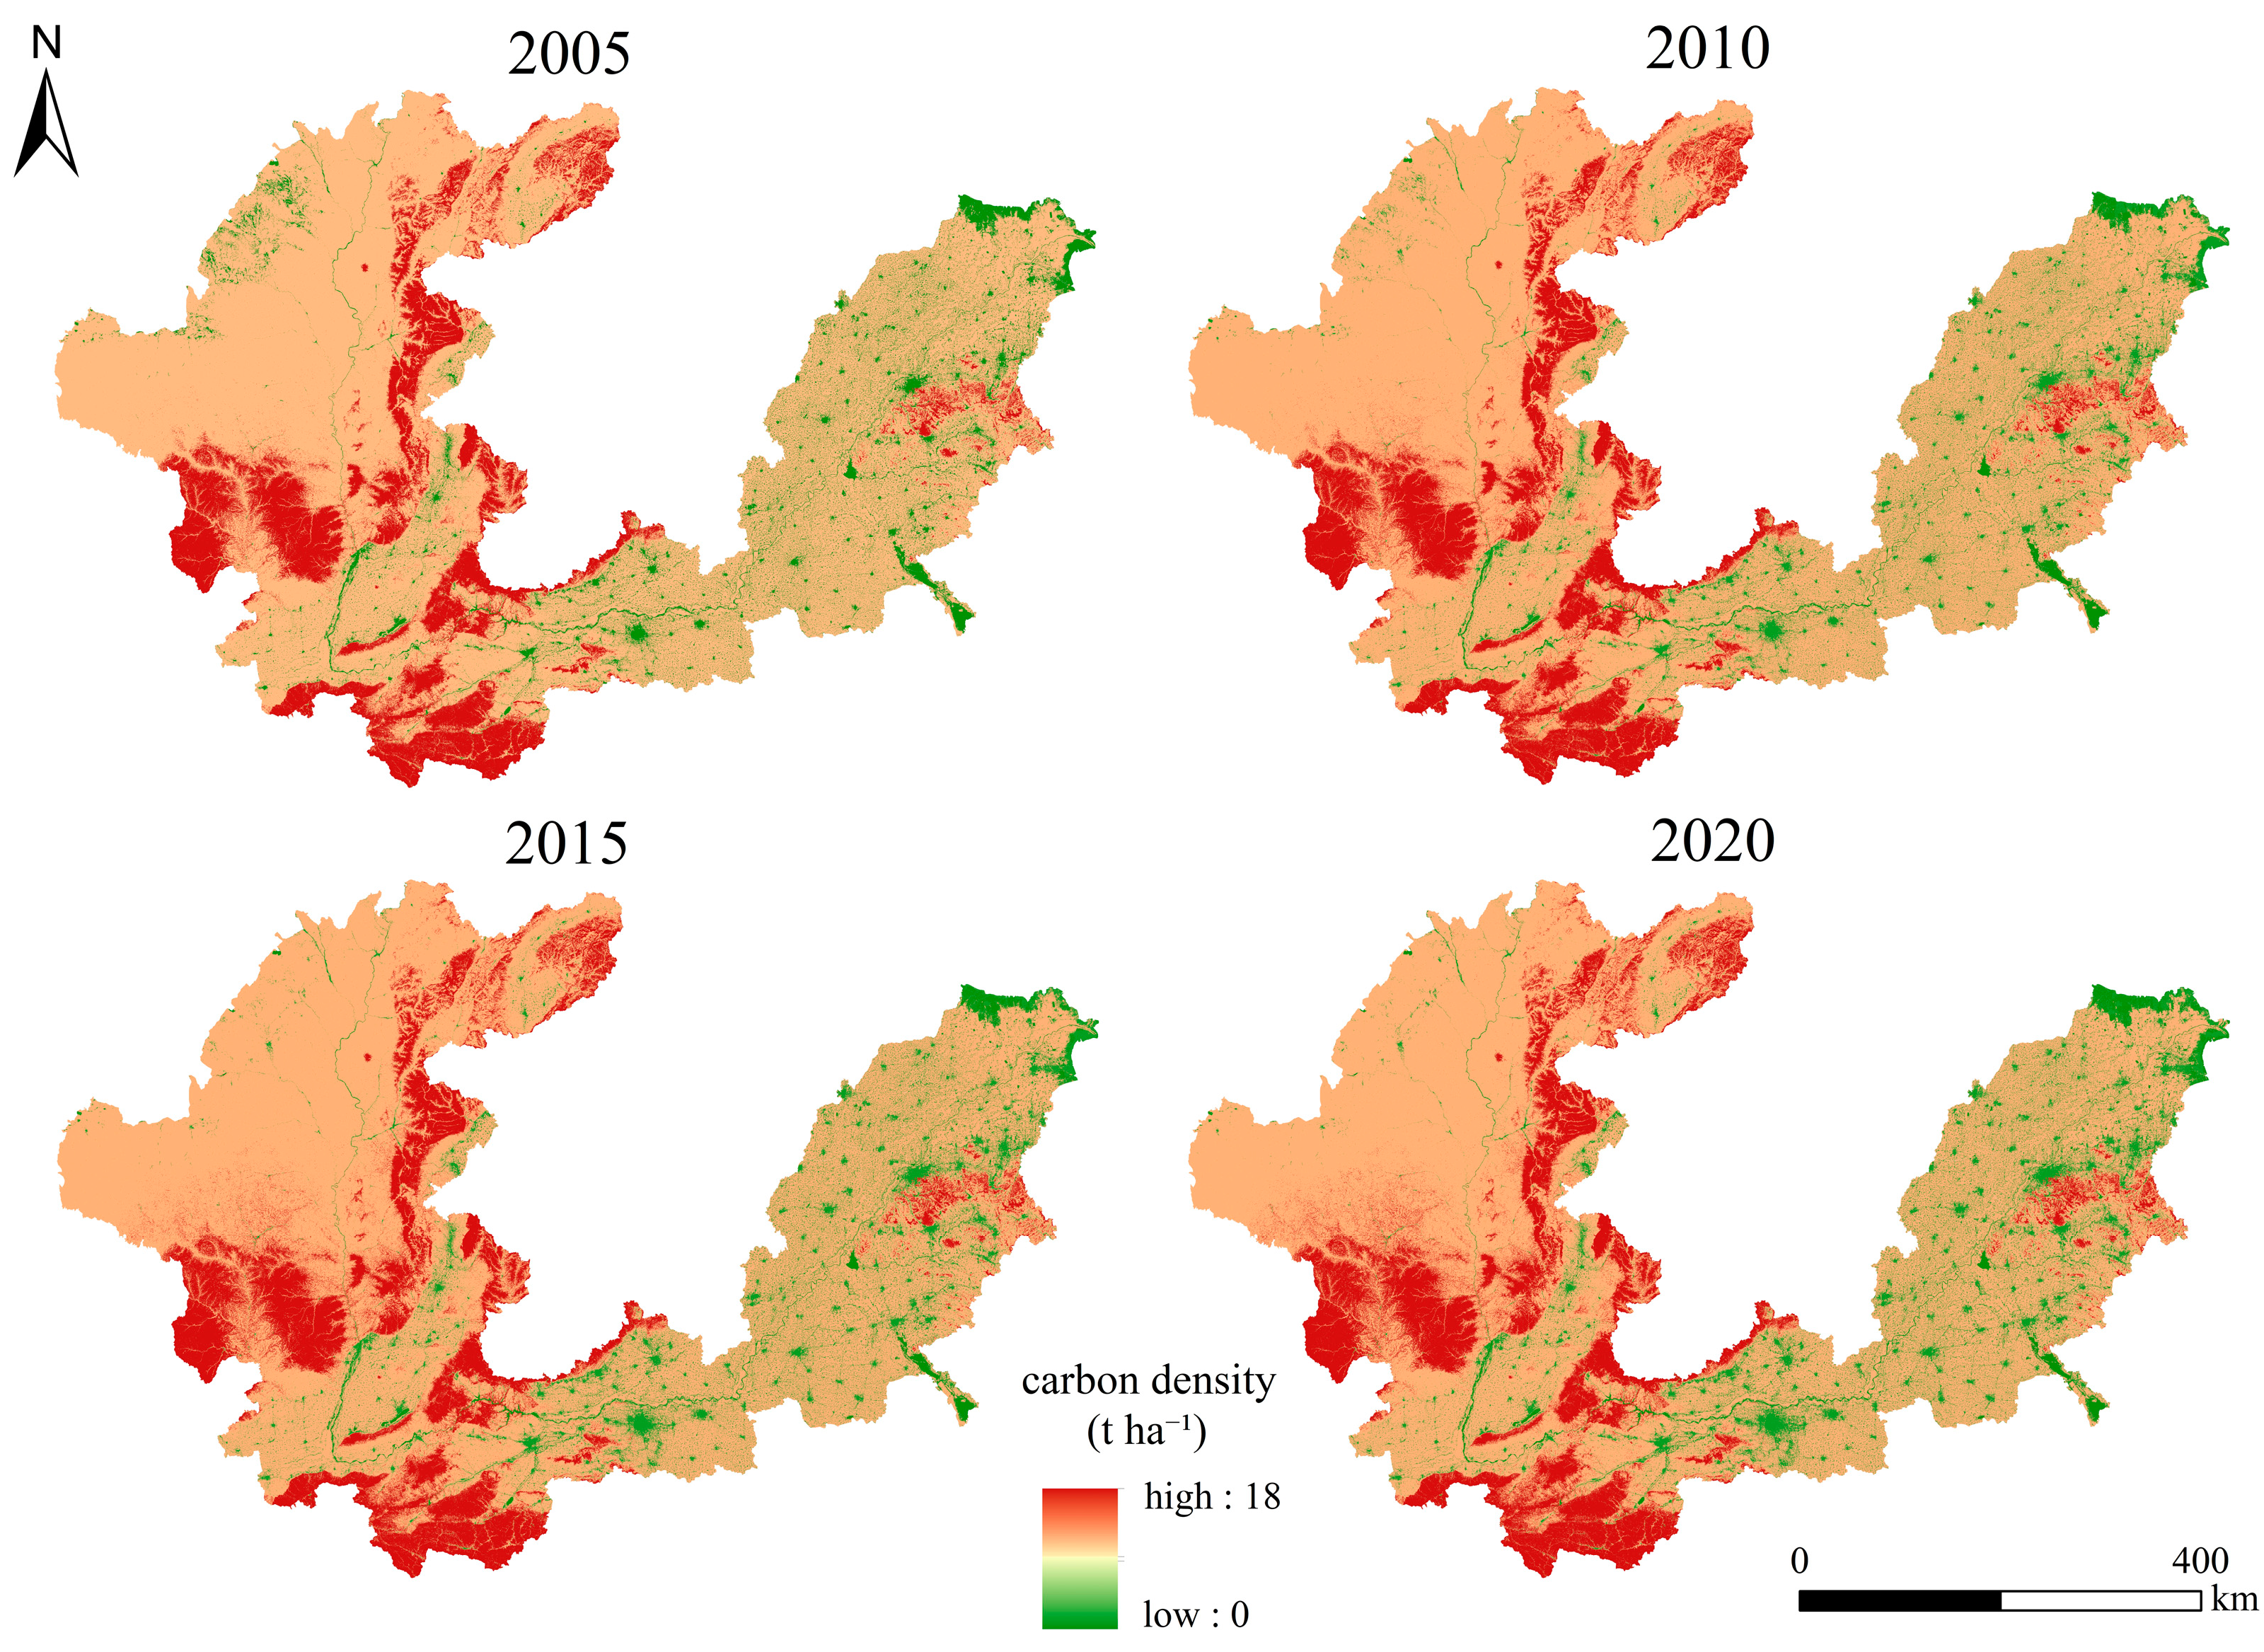
4.2.2. Spatial Variation Characteristics of C-Storage
4.2.3. Spatial Clustering Characteristics of C-Storage
4.3. Analysis of the Drivers of Temporal and Spatial Changes in C-Storage
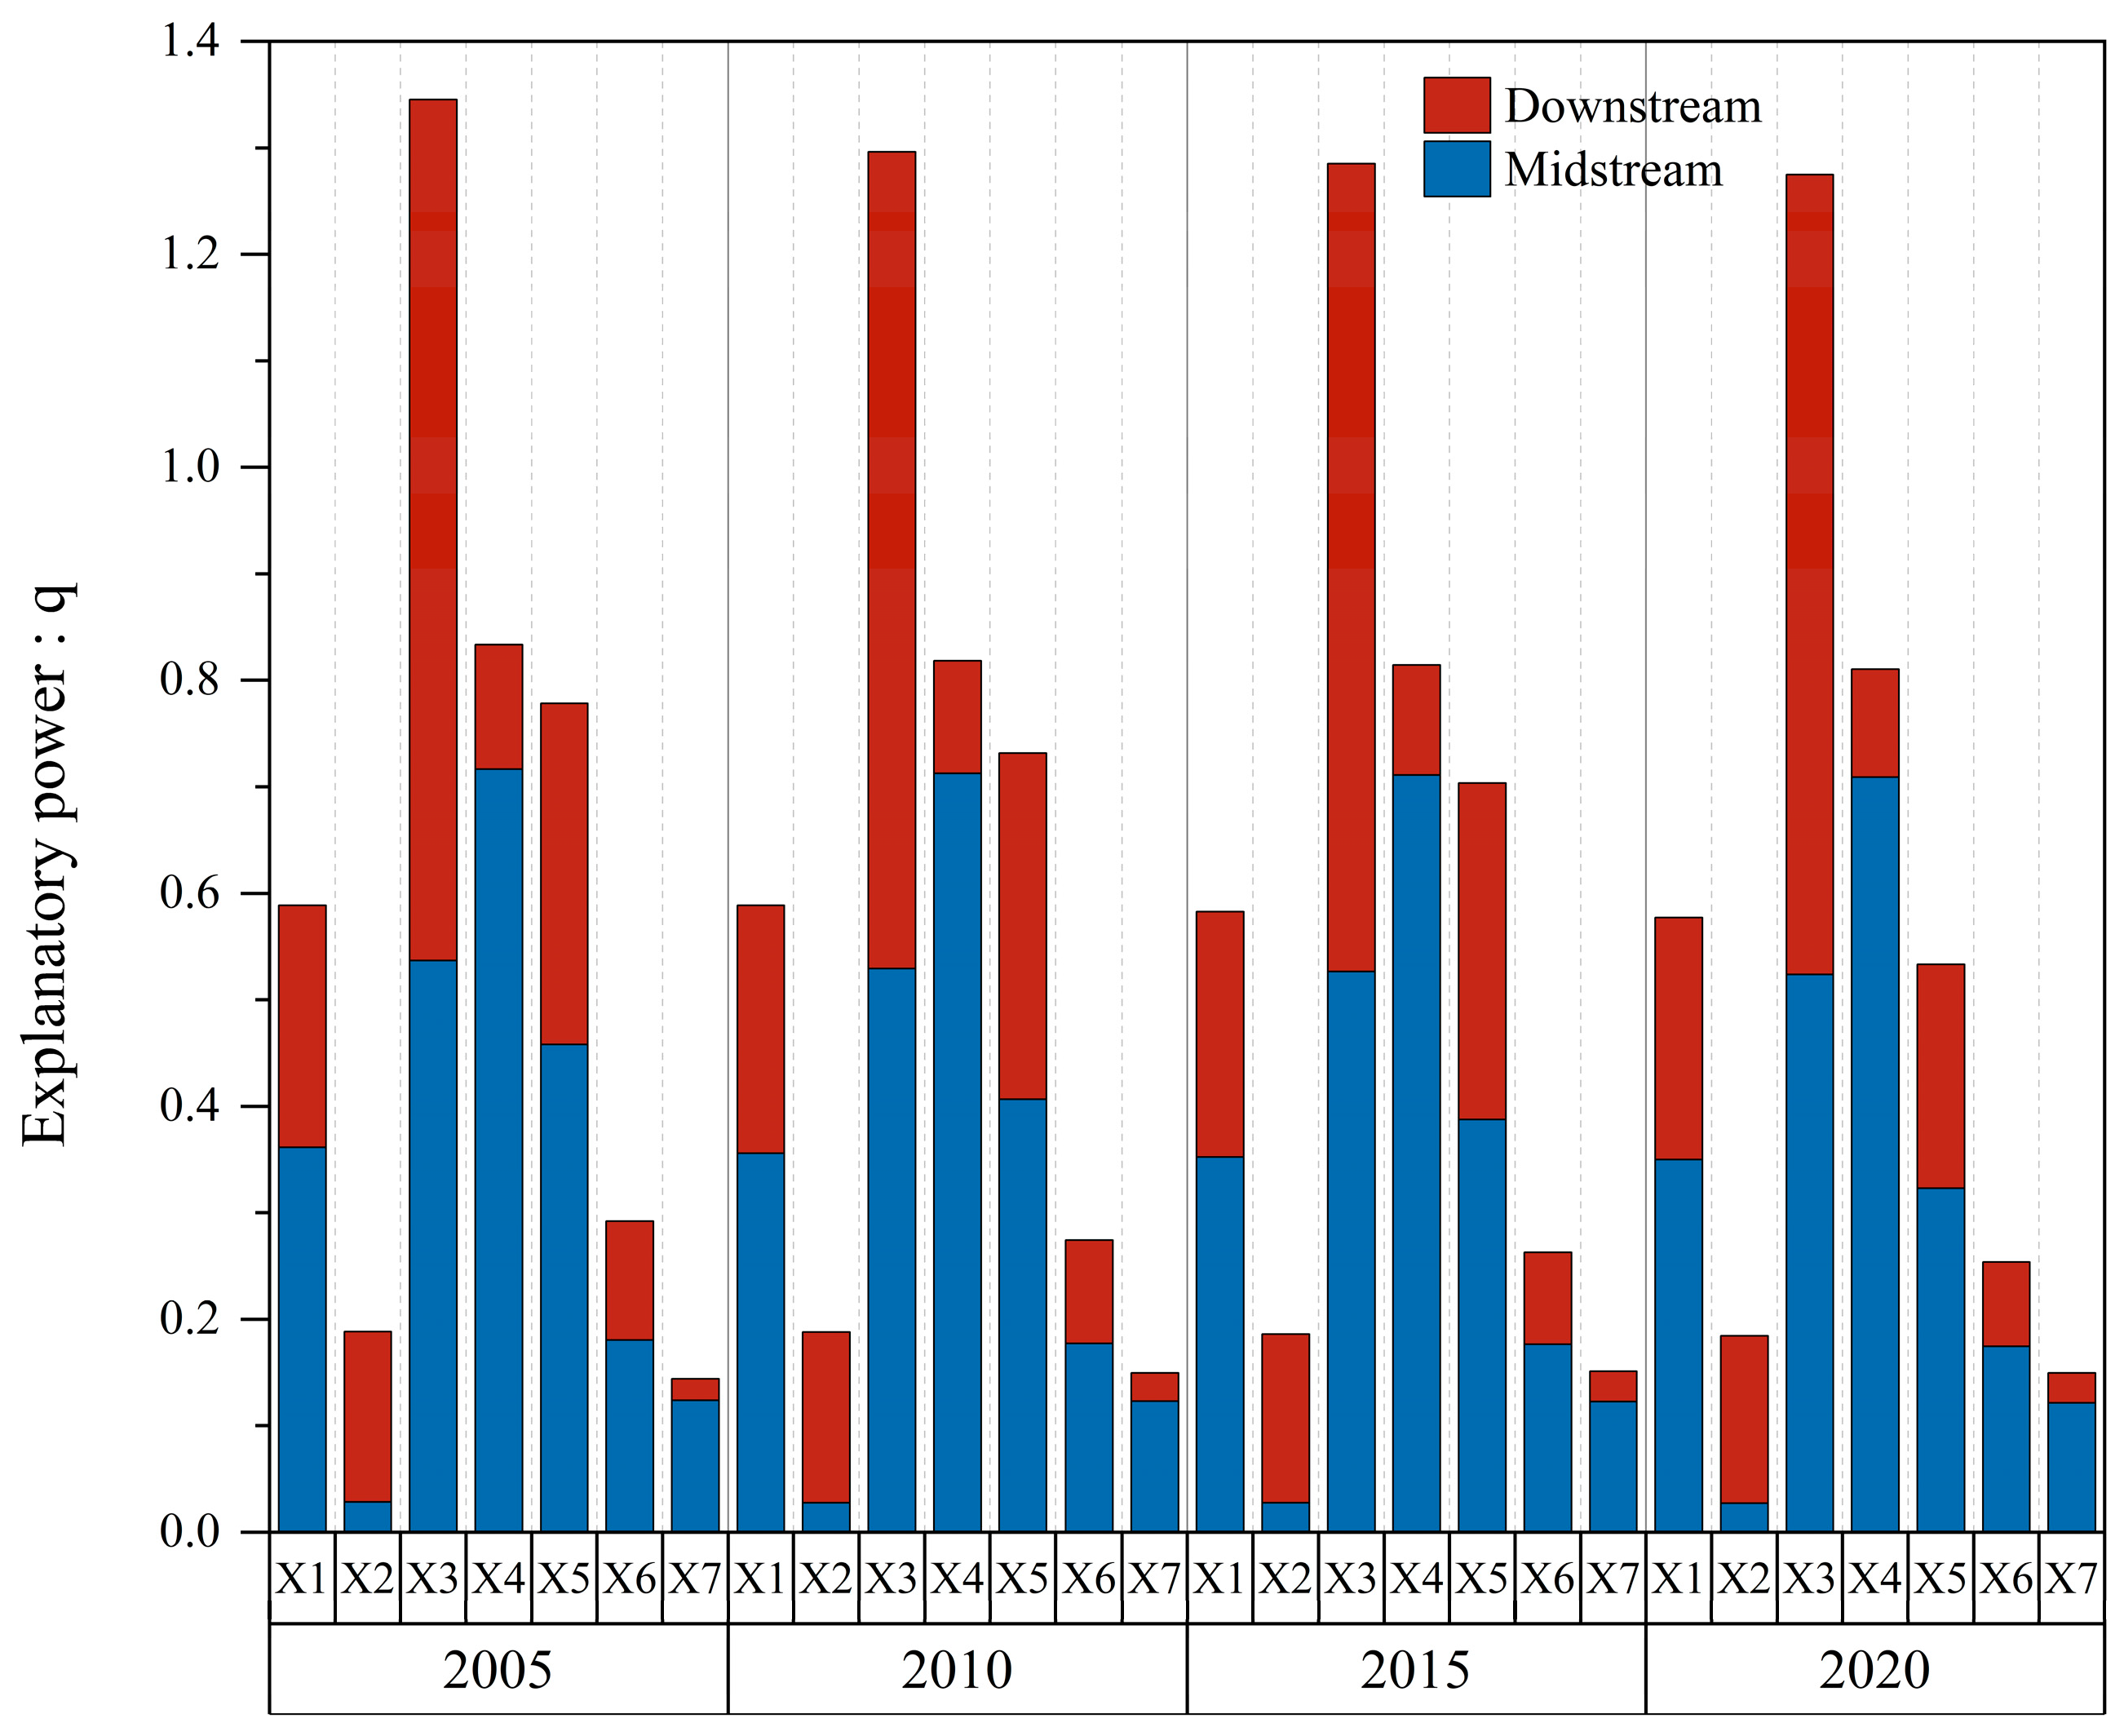
4.3.1. Dominant Factor Detection Analysis
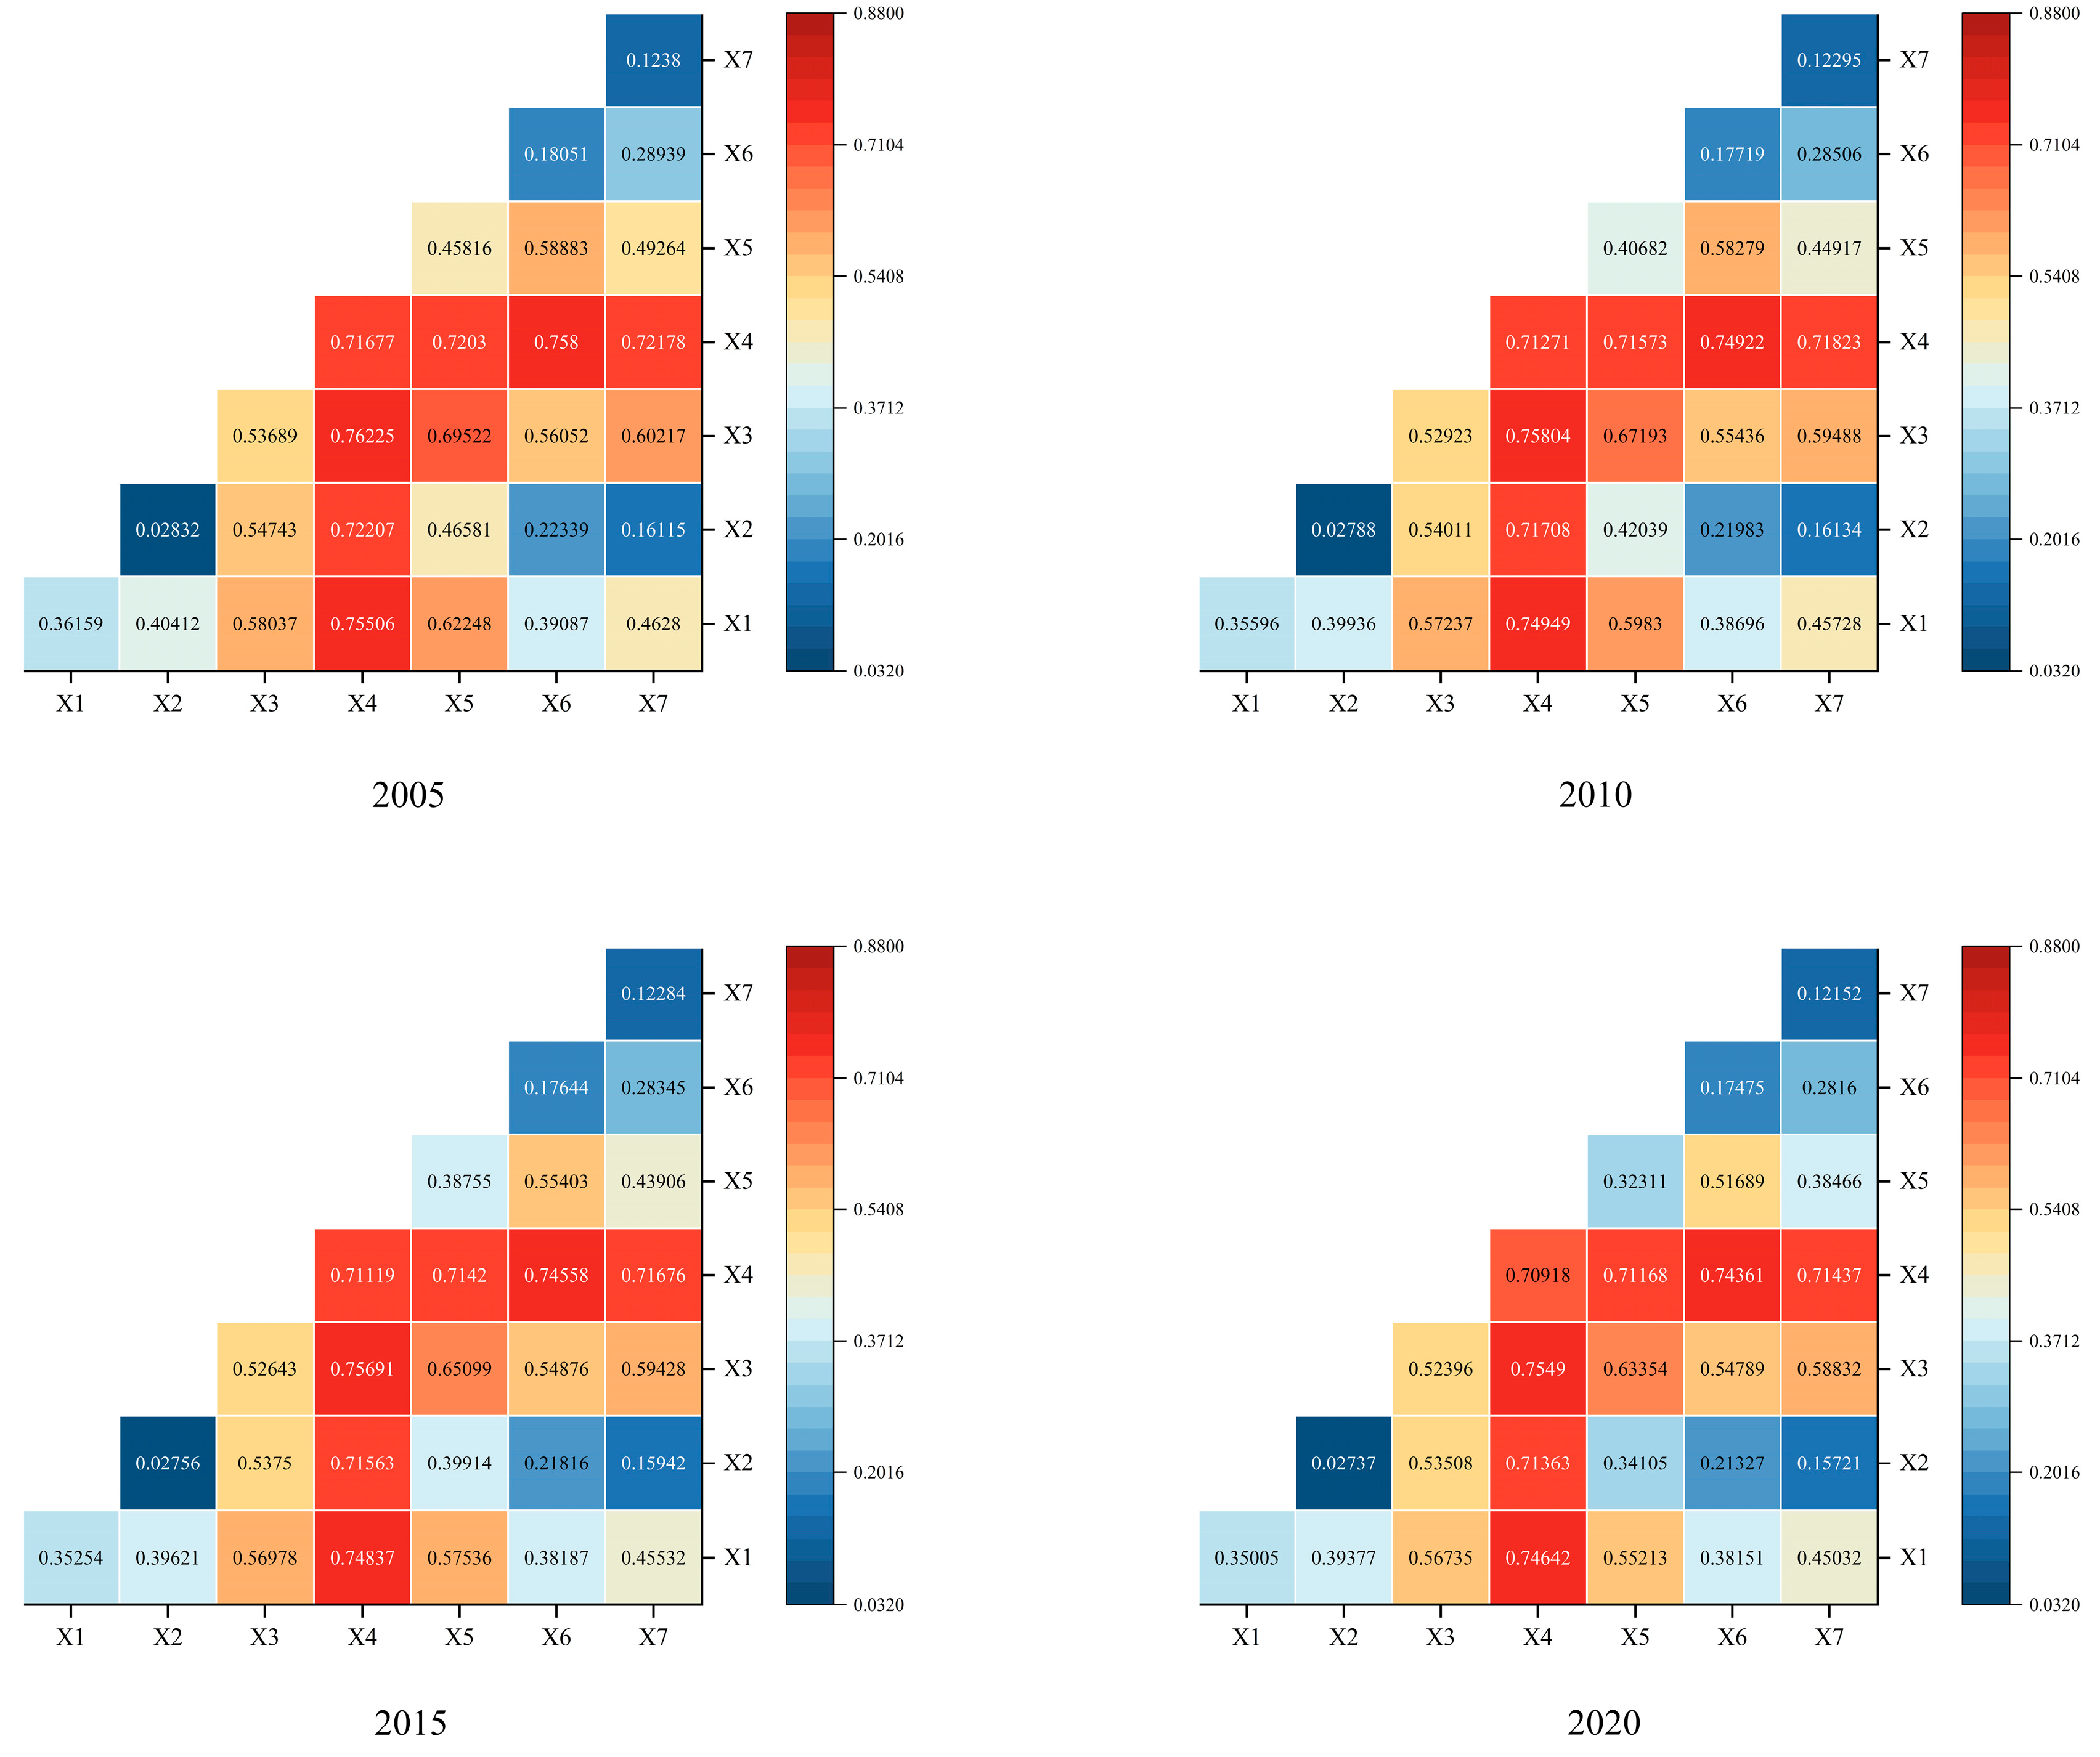
4.3.2. Interaction Factor Detection Analysis
5. Discussion
6. Conclusions
- (1)
- Between 2005 and 2020, there was a consistent reduction in the expanse of AL, with CL, FL, and UL all exhibiting a rising trend and the area of GL and WL being basically stable in the region along the MLYR. The largest increase of CL mainly transferred from AL; The area of AL decreased the most and was mostly attributed to its transformation into GL and CL.
- (2)
- During the period of 2005–2020, the C-storage exhibited a continuous reduction trend. The total C-storage decreased at a rate of 1% in 2015–2020, which was the phase with the largest change in C-storage. The C-storage in the region along the MLYR exhibited a consistent geographical distribution pattern, characterized by high values in the western region and low values in the eastern region. With the development of time, the agglomeration effect of low-value C-storage strengthened and the aggregation effect of high-value C-storage weakened.
- (3)
- From 2005 to 2020, meteorological factors were the dominant factors influencing the spatiotemporal variation of C-storage in the region along the MYR, with elevation and FVC as secondary factors; slope had the least explanatory power. The primary determinant affecting the spatiotemporal variation of C-storage along the LYR was temperature, with FVC as a secondary factor; human footprint had the least explanatory power.
- (4)
- The results of interaction detection among drivers in all four periods showed nonlinear enhancement or double-factor enhancement. We discovered that the correlation between temperature and precipitation exhibited the highest degree, and both factors had the greatest ability to explain the spatiotemporal variation of C-storage within both the MYR and LYR regions.
Author Contributions
Funding
Institutional Review Board Statement
Informed Consent Statement
Data Availability Statement
Conflicts of Interest
References
- Liu, Q.; Zhang, W.; Yao, M.; Yuan, J. Carbon emissions performance regulation for China’s top generation groups by 2020: Too challenging to realize? Resour. Conserv. Recycl. 2017, 122, 326–334. [Google Scholar] [CrossRef]
- Dong, F.; Yu, B.; Hadachin, T.; Dai, Y.; Wang, Y.; Zhang, S.; Long, R. Drivers of carbon emission intensity change in China. Resour. Conserv. Recycl. 2018, 129, 187–201. [Google Scholar] [CrossRef]
- Fernando, Y.; Hor, W.L. Impacts of energy management practices on energy efficiency and carbon emissions reduction: A survey of malaysian manufacturing firms. Resour. Conserv. Recycl. 2017, 126, 62–73. [Google Scholar] [CrossRef]
- Makkonen, M.; Huttunen, S.; Primmer, E.; Repo, A.; Hildén, M. Policy coherence in climate change mitigation: An ecosystem service approach to forests as carbon sinks and bioenergy sources. For. Policy Econ. 2015, 50, 153–162. [Google Scholar] [CrossRef]
- Xi, F.; Lin, G.; Zhao, Y.; Li, X.; Chen, Z.; Cao, C. Land Use Optimization and Carbon Storage Estimation in the Yellow River Basin, China. Sustainability 2023, 15, 11278. [Google Scholar] [CrossRef]
- Wang, X.; Wu, J.; Liu, Y.; Hai, X.; Shanguan, Z.; Deng, L. Driving factors of ecosystem services and their spatiotemporal change assessment based on land use types in the Loess Plateau. J. Environ. Manag. 2022, 311, 114835. [Google Scholar] [CrossRef] [PubMed]
- Barakat, A.; Ouargaf, Z.; Touhami, F. Identification of potential areas hosting aggregate resources using GIS method: A case study of Tadla-Azilal Region, Morocco. Environ. Earth Sci. 2016, 75, 774. [Google Scholar] [CrossRef]
- Zang, S.Y.; Huang, X.; Na, X.D.; Sun, L. An assessment approach of land-use to resource-based cities: A case study on land-use process of Daqing region. Int. J. Environ. Sci. Technol. 2015, 12, 3827–3836. [Google Scholar] [CrossRef]
- Yang, F.; Zeng, G.; Du, C.; Tang, L.; Zhou, J.; Li, Z. Spatial analyzing system for urban land-use management based on GIS and multi-criteria assessment modeling. Prog. Nat. Sci. 2008, 18, 1279–1284. [Google Scholar] [CrossRef]
- Meyer, M.A.; Früh-Müller, A. Patterns and drivers of recent agricultural land-use change in Southern Germany. Land Use Policy 2020, 99, 104959. [Google Scholar] [CrossRef]
- Tang, L.; Ke, X.; Zhou, T.; Zheng, W.; Wang, L. Impacts of cropland expansion on carbon storage: A case study in Hubei, China. J. Environ. Manag. 2020, 265, 110515. [Google Scholar] [CrossRef]
- Liu, Q.; Yang, D.; Cao, L.; Anderson, B. Assessment and Prediction of Carbon Storage Based on Land Use/Land Cover Dynamics in the Tropics: A Case Study of Hainan Island, China. Land 2022, 11, 244. [Google Scholar] [CrossRef]
- Urgilez-Clavijo, A.; Rivas-Tabares, D.; Gobin, A.; de la Riva, J. Comprehensive Framework for Analysing the Intensity of Land Use and Land Cover Change in Continental Ecuadorian Biosphere Reserves. Sustainability 2024, 16, 1566. [Google Scholar] [CrossRef]
- Holdaway, R.J.; McNeill, S.J.; Mason, N.W.; Carswell, F.E. Propagating uncertainty in plot-based estimates of forest carbon stock and carbon stock change. Ecosystems 2014, 17, 627–640. [Google Scholar] [CrossRef]
- Izaurralde, R.C.; Rice, C.W.; Wielopolski, L.; Ebinger, M.H.; Reeves, J.B., III; Thomson, A.M.; Harris, R.; Francis, B.; Mitra, S.; Rappaport, A.G.; et al. Evaluation of Three Field-Based Methods for Quantifying Soil Carbon. PLoS ONE 2013, 8, e55560. [Google Scholar] [CrossRef] [PubMed]
- Zhao, J.; Xie, H.; Ma, J.; Wang, K. Integrated remote sensing and model approach for impact assessment of future climate change on the carbon budget of global forest ecosystems. Glob. Planet. Chang. 2021, 203, 103542. [Google Scholar] [CrossRef]
- Singh, P.; Benbi, D.K. Modeling Soil Organic Carbon with DNDC and RothC Models in Different Wheat-Based Cropping Systems in North-Western India. Commun. Soil Sci. Plant Anal. 2020, 51, 1184–1203. [Google Scholar] [CrossRef]
- Mao, F.; Du, H.; Zhou, G.; Li, X.; Xu, X.; Li, P.; Sun, S. Coupled LAI assimilation and BEPS model for analyzing the spatiotemporal pattern and heterogeneity of carbon fluxes of the bamboo forest in Zhejiang Province, China. Agric. For. Meteorol. 2017, 242, 96–108. [Google Scholar] [CrossRef]
- Liu, K.; Zhang, C.; Zhang, H.; Xu, H.; Xia, W. Spatiotemporal Variation and Dynamic Simulation of Ecosystem Carbon Storage in the Loess Plateau Based on PLUS and InVEST Models. Land 2023, 12, 1065. [Google Scholar] [CrossRef]
- Xie, L.; Bai, Z.; Yang, B.; Fu, S. Simulation Analysis of Land-Use Pattern Evolution and Valuation of Terrestrial Ecosystem Carbon Storage of Changzhi City, China. Land 2022, 11, 1270. [Google Scholar] [CrossRef]
- Li, K.; Cao, J.; Adamowski, J.F.; Biswas, A.; Zhou, J.; Liu, Y.; Zhang, Y.; Liu, C.; Dong, X.; Qin, Y. Assessing the effects of ecological engineering on spatiotemporal dynamics of carbon storage from 2000 to 2016 in the Loess Plateau area using the InVEST model: A case study in Huining County, China. Environ. Dev. 2021, 39, 100641. [Google Scholar] [CrossRef]
- Wu, F.; Wang, Z. Assessing the impact of urban land expansion on ecosystem carbon storage: A case study of the Changzhutan metropolitan area, China. Ecol. Indic. 2023, 154, 110688. [Google Scholar] [CrossRef]
- Ye, S.; Laws, E.A.; Yuknis, N.; Ding, X.; Yuan, H.; Zhao, G.; Wang, J.; Yu, X.; Pei, S.; DeLaune, R.D. Carbon Sequestration and Soil Accretion in Coastal Wetland Communities of the Yellow River Delta and Liaohe Delta, China. Estuaries Coasts 2015, 38, 1885–1897. [Google Scholar] [CrossRef]
- Zhu, L.; Song, R.; Sun, S.; Li, Y.; Hu, K. Land use/land cover change and its impact on ecosystem carbon storage in coastal areas of China from 1980 to 2050. Ecol. Indic. 2022, 142, 109178. [Google Scholar] [CrossRef]
- Liang, Y.; Hashimoto, S.; Liu, L. Integrated assessment of land-use/land-cover dynamics on carbon storage services in the Loess Plateau of China from 1995 to 2050. Ecol. Indic. 2021, 120, 106939. [Google Scholar] [CrossRef]
- Myeong, S.; Nowak, D.J.; Duggin, M.J. A temporal analysis of urban forest carbon storage using remote sensing. Remote Sens. Environ. 2006, 101, 277–282. [Google Scholar] [CrossRef]
- Xu, C.; Zhang, Q.; Yu, Q.; Wang, J.; Wang, F.; Qiu, S.; Ai, M.; Zhao, J. Effects of land use/cover change on carbon storage between 2000 and 2040 in the Yellow River Basin, China. Ecol. Indic. 2023, 151, 110345. [Google Scholar] [CrossRef]
- Ma, T.; Li, X.; Bai, J.; Ding, S.; Zhou, F.; Cui, B. Four decades’ dynamics of coastal blue carbon storage driven by land use/land cover transformation under natural and anthropogenic processes in the Yellow River Delta, China. Sci. Total Environ. 2019, 655, 741–750. [Google Scholar] [CrossRef]
- Yang, J.; Huang, X. The 30 m Annual Land Cover Datasets and Its Dynamics in China from 1985 to 2022. 2023. Available online: https://zenodo.org/records/8176941 (accessed on 1 January 2023).
- Liu, J.; Liu, M.; Tian, H.; Zhuang, D.; Zhang, Z.; Zhang, W.; Tang, X.; Deng, X. Spatial and temporal patterns of China’s cropland during 1990–2000: An analysis based on Landsat TM data. Remote Sens. Environ. 2005, 98, 442–456. [Google Scholar] [CrossRef]
- Zhuang, D.; Liu, J. Study on the model of regional differentiation of land use degree in China. J. Nat. Resour. 1997, 12, 105–111. [Google Scholar] [CrossRef]
- Peng, S. 1-km Monthly Mean Temperature Dataset for China (1901–2022); National Tibetan Plateau Data Center: Beijing, China, 2020. [Google Scholar] [CrossRef]
- Peng, S. 1-km Monthly Precipitation Dataset for China (1901–2022); National Tibetan Plateau Data Center: Beijing, China, 2020. [Google Scholar] [CrossRef]
- Gao, J.; Zhang, H.; Zhang, W.; Chen, X.; Shen, W.; Xiao, T.; Zhang, Y.; Shi, Y. China Regional 250m Fractional Vegetation Cover Data Set (2000–2023); National Tibetan Plateau Data Center: Beijing, China, 2024. [Google Scholar] [CrossRef]
- Mu, H.; Li, X.; Wen, Y.; Huang, J.; Du, P.; Su, W.; Miao, S.; Geng, M. A global record of annual terrestrial Human Footprint dataset from 2000 to 2018. Sci. Data 2022, 9, 176. [Google Scholar] [CrossRef]
- Yang, J.; Xie, B.; Zhang, D. Spatial and temporal variation of carbon stocks in the Yellow River basin based on InVEST and CA-Markov models. Chin. J. Ecol. Agric. 2021, 29, 1018–1029. [Google Scholar] [CrossRef]
- Alam, S.A.; Starr, M.; Clark, B.J.F. Tree biomass and soil organic carbon densities across the Sudanese woodland savannah: A regional carbon sequestration study. J. Arid Environ. 2013, 89, 67–76. [Google Scholar] [CrossRef]
- Giardina, C.P.; Ryan, M.G. Evidence that decomposition rates of organic carbon in mineral soil do not vary with temperature. Nature 2000, 404, 858–861. [Google Scholar] [CrossRef]
- Chen, G.; Yang, Y.; Liu, L.; Li, X.; Zhao, Y.; Yuan, Y. Progress of forest subsurface carbon allocation (TBCA) research. J. Subtrop. Resour. Environ. 2007, 2, 34–42. [Google Scholar] [CrossRef]
- Su, Y.; Li, T.; Cheng, S.; Wang, X. Spatial distribution exploration and driving factor identification for soil salinisation based on geodetector models in coastal area. Ecol. Eng. 2020, 156, 105961. [Google Scholar] [CrossRef]
- Zhao, Y.; Liu, L.; Kang, S.; Ao, Y.; Han, L.; Ma, C. Quantitative Analysis of Factors Influencing Spatial Distribution of Soil Erosion Based on Geo-Detector Model under Diverse Geomorphological Types. Land 2021, 10, 604. [Google Scholar] [CrossRef]
- Wang, J.; Xu, C. Geodetector: Principle and prospective. Acta Geogr. Sin. 2017, 72, 116–134. [Google Scholar] [CrossRef]
- Wang, J.; Li, X.; Christakos, G.; Liao, Y.; Zhang, T.; Gu, X.; Zheng, X. Geographical Detectors-Based Health Risk Assessment and its Application in the Neural Tube Defects Study of the Heshun Region, China. Int. J. Geogr. Inf. Sci. 2010, 24, 107–127. [Google Scholar] [CrossRef]
- He, Y.; Ma, J.; Zhang, C.; Yang, H. Spatio-Temporal Evolution and Prediction of Carbon Storage in Guilin Based on FLUS and InVEST Models. Remote Sens. 2023, 15, 1445. [Google Scholar] [CrossRef]
- Zhao, M.; He, Z.; Du, J.; Chen, L.; Lin, P.; Fang, S. Assessing the effects of ecological engineering on carbon storage by linking the CA-Markov and InVEST models. Ecol. Indic. 2019, 98, 29–38. [Google Scholar] [CrossRef]
- Wang, Z.; Li, X.; Mao, Y.-t.; Li, L.; Wang, X.; Lin, Q. Dynamic simulation of land use change and assessment of carbon storage based on climate change scenarios at the city level: A case study of Bortala, China. Ecol. Indic. 2022, 134, 108499. [Google Scholar] [CrossRef]
- Duan, X.; Han, M.; Kong, X.; Sun, J.; Zhang, H. Spatiotemporal evolution and simulation prediction of ecosystem carbon storage in the Yellow River Basin before and after the Grain for Green Project. Environ. Sci. 2024, 1–18. Available online: https://link.cnki.net/urlid/11.1895.x.20240221.1159.007 (accessed on 1 July 2024).
- Li, M.; Shangguan, Z.; Deng, L. Spatial distribution of carbon storage in the terrestrial ecosystems and its influencing factors on the Loess Plateau. Acta Ecol. Sin. 2021, 41, 6786–6799. [Google Scholar] [CrossRef]
- Deng, Y.; Jiang, W.; Wu, Z.; Peng, K.; Ling, Z.; Li, Z.; Wang, X. Assessing and Characterizing Carbon Storage in Wetlands of the Guangdong–Hong Kong–Macau Greater Bay Area, China, During 1995–2020. IEEE J. Sel. Top. Appl. Earth Obs. Remote Sens. 2022, 15, 6110–6120. [Google Scholar] [CrossRef]
- Zhu, Q.; Li, P.; Li, Z.; Pu, S.; Wu, X.; Bi, N.; Wang, H. Spatiotemporal Changes of Coastline over the Yellow River Delta in the Previous 40 Years with Optical and SAR Remote Sensing. Remote Sens. 2021, 13, 1940. [Google Scholar] [CrossRef]
- Li, C.; Zhu, L.; Dai, Z.; Wu, Z. Study on Spatiotemporal Evolution of the Yellow River Delta Coastline from 1976 to 2020. Remote Sens. 2021, 13, 4789. [Google Scholar] [CrossRef]


| Data Types | Years | Sources | |
|---|---|---|---|
| Vector | Population | 2021 | <<Shandong Statistical Yearbook>>/<<Henan Statistical Yearbook>> /<<Shanxi Statistical Yearbook>>/<<Shaanxi Statistical Yearbook>> |
| Administrative Divisions | 2015 | National Catalogue Service for Geographic Information https://www.webmap.cn/ (accessed on 6 January 2023) | |
| River | |||
| Land Use | LULC (30 m) | 2005/2010 /2015/2020 | <<The 30 m annual land cover datasets and its dynamics in China from 1985 to 2022>> https://doi.org/10.5281/zenodo.8176941 |
| Terrain | DEM (90 m) | - | Resource and Environment Science and Data Center https://www.resdc.cn/ (accessed on 10 January 2023) |
| Slope (90 m) | Calculated from land-use data | ||
| Vegetation | Composite Land-use Extent Index (30 m) | 2005/2010 /2015/2020 | |
| Fractional Vegetation Cover (250 m) | <<China regional 250 m fractional vegetation cover data set (2000–2023)>> https://doi.org/10.11888/Terre.tpdc.300330 | ||
| Meteorology | Temperature (1 km) | 2000–2020 | <<1-km monthly mean temperature dataset for china (1901–2022)>> https://doi.org/10.11888/Meteoro.tpdc.270961 |
| Precipitation (1 km) | <<1-km monthly precipitation dataset for China (1901–2022)>> https://doi.org/10.5281/zenodo.3185722 | ||
| Human Activities | Human Footprint (30 m) | 2005/2010 /2015/2020 | <<A global record of annual terrestrial Human Footprint dataset from 2000 to 2018>> https://doi.org/10.1038/s41597-022-01284-8 |
| Carbon Density | Original carbon density | - | National Ecosystem Science Data Center http://www.cnern.org.cn (accessed on 8 January 2023) <<Spatial and temporal variation of carbon stocks in the Yellow River basin based on InVEST and CA-Markov models>> http://doi.org/10.13930/j.cnki.cjea.200746 <<Effects of land use/cover change on carbon storage between 2000 and 2040 in the Yellow River Basin, China>> https://doi.org/10.1016/j.ecolind.2023.110345 |
| Land-Use Type | Ca | Cb | Cs | Cd |
|---|---|---|---|---|
| Arable land (AL) | 6.6 | 31.4 | 97.2 | 3.8 |
| Forest land (FL) | 16.5 | 45 | 142.4 | 5.5 |
| Grassland (GL) | 13.7 | 33.6 | 89.6 | 2.8 |
| Water (WL) | 0.1 | 0 | 0 | 0 |
| Construction land (CL) | 1 | 10.7 | 0 | 0 |
| Unused land (UL) | 0.5 | 0 | 19.4 | 0 |
| Land-Use Type | 2005 | 2010 | 2015 | 2020 | Area Change (105 ha) | ||||
|---|---|---|---|---|---|---|---|---|---|
| Area (105 ha) | Proportion | Area (105 ha) | Proportion | Area (105 ha) | Proportion | Area (105 ha) | Proportion | ||
| Arable land (AL) | 152.69 | 48.60% | 147.84 | 47.06% | 143.31 | 45.62% | 140.63 | 44.77% | −12.06 |
| Forest land (FL) | 49.19 | 15.66% | 50.50 | 16.08% | 52.48 | 16.71% | 54.13 | 17.23% | 4.94 |
| Grassland (GL) | 81.81 | 26.04% | 82.93 | 26.40% | 82.78 | 26.35% | 80.72 | 25.70% | −1.09 |
| Water (WL) | 3.68 | 1.17% | 4.11 | 1.31% | 4.27 | 1.36% | 4.78 | 1.52% | 1.10 |
| Construction land (CL) | 23.68 | 7.54% | 26.78 | 8.53% | 30.09 | 9.58% | 33.49 | 10.66% | 9.81 |
| Unused land (UL) | 3.10 | 0.99% | 1.97 | 0.63% | 1.21 | 0.38% | 0.39 | 0.12% | 2.71 |
| Year | 2005 | 2010 | 2015 | 2020 | 2005–2010 | 2010–2015 | 2015–2020 | 2005–2020 |
|---|---|---|---|---|---|---|---|---|
| Amount/Rate of Change | Amount/Rate of Change | Amount/Rate of Change | Amount/Rate of Change | |||||
| Total | 4221.13 | 4199.00 | 4178.47 | 4150.06 | −22.22 | −20.53 | −28.41 | −71.17 |
| 0.53% | 0.49% | 1% | 1.69% |
| City | 2005 | 2010 | 2015 | 2020 | City | 2005 | 2010 | 2015 | 2020 |
|---|---|---|---|---|---|---|---|---|---|
| Dongying | 8.591 | 8.297 | 7.893 | 7.200 | Xinxiang | 10.664 | 10.503 | 10.300 | 10.105 |
| Jining | 9.408 | 9.103 | 9.081 | 8.926 | Zibo | 10.838 | 10.550 | 10.427 | 10.333 |
| Binzhou | 9.508 | 9.231 | 8.981 | 8.648 | Yulin | 11.450 | 11.681 | 11.784 | 11.773 |
| Puyang | 9.744 | 9.588 | 9.348 | 9.087 | Yuncheng | 12.184 | 12.037 | 11.938 | 11.841 |
| Dezhou | 9.762 | 9.638 | 9.442 | 9.334 | Weinan | 12.195 | 12.103 | 11.991 | 11.858 |
| Liaocheng | 9.905 | 9.739 | 9.529 | 9.340 | Jiyuan | 12.756 | 12.798 | 12.409 | 12.450 |
| Zhengzhou | 10.101 | 9.848 | 9.392 | 8.923 | Xinzhou | 12.956 | 12.958 | 12.977 | 13.050 |
| Heze | 10.124 | 9.917 | 9.670 | 9.442 | Linfen | 13.197 | 13.199 | 13.249 | 13.278 |
| Taian | 10.245 | 10.069 | 9.959 | 9.793 | Lvliang | 13.264 | 13.226 | 13.239 | 13.229 |
| Kaifeng | 10.279 | 10.126 | 9.913 | 9.662 | Luoyang | 13.771 | 13.670 | 13.563 | 13.593 |
| Jinan | 10.531 | 10.252 | 10.118 | 9.992 | Yanan | 14.005 | 14.054 | 14.199 | 14.277 |
| Jiaozuo | 10.622 | 10.425 | 10.081 | 9.867 | Sanmenxia | 14.562 | 14.485 | 14.478 | 14.553 |
| Cold Hotspot Significance | 2005 | 2020 | ||
|---|---|---|---|---|
| Area (105 ha) | Proportion | Area (105 ha) | Proportion | |
| Cold Spot—99% Confidence | 5.25 | 1.73% | 5.65 | 1.86% |
| Cold Spot—95% Confidence | 3.30 | 1.09% | 5.20 | 1.71% |
| Cold Spot—90% Confidence | 3.55 | 1.17% | 3.90 | 1.28% |
| Not Significant | 262.98 | 86.57% | 262.98 | 86.57% |
| Hotspot—90% Confidence | 9.30 | 3.06% | 14.25 | 4.69% |
| Hotspot—95% Confidence | 19.40 | 6.39% | 11.80 | 3.88% |
| Hotspot—99% Confidence | 0 | 0 | 0 | 0 |
| Elevation (X1) | Slope (X2) | Temperature (X3) | Precipitation (X4) | Fractional Vegetation Cover (X5) | Composite Land-Use Extent Index (X6) | Human Footprint (X7) | |
|---|---|---|---|---|---|---|---|
| 2005 | 0.3616 | 0.0283 | 0.5369 | 0.7168 | 0.4582 | 0.1805 | 0.1238 |
| 2010 | 0.3560 | 0.0279 | 0.5292 | 0.7127 | 0.4068 | 0.1772 | 0.1230 |
| 2015 | 0.3525 | 0.0276 | 0.5264 | 0.7112 | 0.3875 | 0.1764 | 0.1228 |
| 2020 | 0.3501 | 0.0274 | 0.5240 | 0.7092 | 0.3231 | 0.1747 | 0.1215 |
| Total changes | −0.0115 | −0.0010 | −0.0129 | −0.0076 | −0.1350 | −0.0058 | −0.0023 |
| Elevation (X1) | Slope (X2) | Temperature (X3) | Precipitation (X4) | Fractional Vegetation Cover (X5) | Composite Land-Use Extent Index (X6) | Human Footprint (X7) | |
|---|---|---|---|---|---|---|---|
| 2005 | 0.2273 | 0.1603 | 0.8086 | 0.1166 | 0.3204 | 0.1118 | 0.0203 |
| 2010 | 0.2329 | 0.1602 | 0.7670 | 0.1057 | 0.3250 | 0.0973 | 0.0267 |
| 2015 | 0.2301 | 0.1586 | 0.7589 | 0.1033 | 0.3159 | 0.0866 | 0.0284 |
| 2020 | 0.2274 | 0.1570 | 0.7508 | 0.1014 | 0.2102 | 0.0790 | 0.0282 |
| Total changes | 0.0001 | −0.0034 | −0.0578 | −0.0152 | −0.1103 | −0.0328 | 0.0079 |
Disclaimer/Publisher’s Note: The statements, opinions and data contained in all publications are solely those of the individual author(s) and contributor(s) and not of MDPI and/or the editor(s). MDPI and/or the editor(s) disclaim responsibility for any injury to people or property resulting from any ideas, methods, instructions or products referred to in the content. |
© 2024 by the authors. Licensee MDPI, Basel, Switzerland. This article is an open access article distributed under the terms and conditions of the Creative Commons Attribution (CC BY) license (https://creativecommons.org/licenses/by/4.0/).
Share and Cite
An, S.; Duan, Y.; Chen, D.; Wu, X. Spatiotemporal Evolution and Drivers of Carbon Storage from a Sustainable Development Perspective: A Case Study of the Region along the Middle and Lower Yellow River, China. Sustainability 2024, 16, 6409. https://doi.org/10.3390/su16156409
An S, Duan Y, Chen D, Wu X. Spatiotemporal Evolution and Drivers of Carbon Storage from a Sustainable Development Perspective: A Case Study of the Region along the Middle and Lower Yellow River, China. Sustainability. 2024; 16(15):6409. https://doi.org/10.3390/su16156409
Chicago/Turabian StyleAn, Shu, Yifang Duan, Dengshuai Chen, and Xiaoman Wu. 2024. "Spatiotemporal Evolution and Drivers of Carbon Storage from a Sustainable Development Perspective: A Case Study of the Region along the Middle and Lower Yellow River, China" Sustainability 16, no. 15: 6409. https://doi.org/10.3390/su16156409
APA StyleAn, S., Duan, Y., Chen, D., & Wu, X. (2024). Spatiotemporal Evolution and Drivers of Carbon Storage from a Sustainable Development Perspective: A Case Study of the Region along the Middle and Lower Yellow River, China. Sustainability, 16(15), 6409. https://doi.org/10.3390/su16156409