Abstract
(1) Background: The increasing generation of plastic and agricultural wastes is a critical environmental issue that requires urgent attention. Aiming to address this challenge, this study developed a sustainable waste-to-wealth system through the utilization of Zea mays husk as a reinforcing material in the production of green composites. (2) Methods: Delignification, de-hemicellulolysis, and bleaching were employed sequentially to improve the characteristics of the husk. Fourier-transform infrared spectroscopy and scanning electron microscopy confirmed the removal of lignin, hemicellulose, and impurities, and X-ray diffraction analysis determined the degree of crystallinity. Composites were made with treated and untreated husk and recycled low-density polyethylene (LDPE) at various husk-to-LDPE ratios. (3) Results: Mechanical characterization demonstrated that the treated husk composites exhibited superior tensile strength, flexural strength, and hardness compared to the untreated ones and pure LDPE. The treatment did not enhance the thermal stability of the composites, but it did lower their capacity for water absorption and improve their crystallinity. The economic assessment of the husk composite production indicated a total annualized cost of USD 0.9601 per kg, which is significantly lower than the estimated cost for LDPE (USD 1.2 to USD 1.4 per kg). Additionally, it has a much smaller carbon footprint compared to LDPE production. (4) Conclusions: The potential of utilizing treated Z. mays husk as a reinforcing agent in the development of sustainable and cost-effective green composites, improving their overall performance, was established. This approach offers a promising solution for the effective management of plastic and agricultural wastes, contributing to the transition towards a circular economy.
1. Introduction
Plastic and agricultural wastes are two environmental issues that have gained global attention in recent years. The extensive use of plastics and unsustainable agricultural practices has resulted in severe ecological consequences, threatening the health of ecosystems and human well-being. These wastes have reached historic proportions, with billions of tonnes produced globally each year [1].
Since the 1950s, there have been 8.3 billion tonnes of plastic produced, and only 9 percent of all these plastic wastes produced were recycled [2,3]. Over 150 million tonnes of plastic are already in the oceans, with approximately 8 million tonnes of plastic waste deposited in the oceans each year [4]. According to Singh et al. [5], polyethylene terephthalate, polyvinyl chloride, polystyrene, polypropylene, low-density polyethylene, and high-density polyethylene are plastics of environmental concern due to their extensive use, persistence in the environment, and associated ecological consequences. Low-density polyethylene (LDPE) is one of the most used plastics in the world, being the material commonly used in disposable plastic bags; it is not easily biodegradable, and traditional recycling methods are often limited because it has a low melting point and there are technical challenges regarding reprocessing mixed or contaminated LDPE waste [6]. The slow degradation of LDPE leads to its long-term persistence in the environment, contributing to visual pollution and posing risks to ecosystems and wildlife.
Agricultural waste is also of great concern. Agricultural production has increased more than three times in the last 50 years reaching 23.7 million tonnes of food per day, and as this production increases, agricultural waste grows accordingly. India, for instance, being one of the main cereal producers of the world, has agricultural waste as its main solid waste, which comprises approx. 350–990 Mt per year [7,8]
Given the above highlights and the severe environmental and socio-economic consequences of these wastes, there is an urgent need to establish an efficient and sustainable waste-to-wealth system in order to foster a circular economy [9,10]. One of the most promising applications is the utilisation of agricultural waste as reinforcing material in the production of green composites based on recycled plastics because of its low carbon footprint and biodegradability [11,12,13,14,15,16]. The green composites (bio-composites) offer enormous potential as a replacement for traditional plastics, providing a conduit for their recycling and for the use of agricultural waste [17,18]. They can be designed with a variety of properties that are suitable for a wide range of applications, such as packaging, automotive components, construction materials, and consumer products [19].
Several sustainable and eco-friendly fibres from Dracaena sanderiana, Cannabis sativa, Linum usitatissimum, Zea mays, Leopoldinia piassaba, Cocos nucifera, Neoglaziovia variegata, Olea europaea, and Hibiscus cannabinus have received much attention as reinforcing agents for bio-composites in recent years [20,21]. The husk (the outer coating of the Z. mays cob) is one such material with enormous promise [22,23]. The husk has unique properties that make it an ideal reinforcing material for composite production, such as its high cellulose content, low density, availability, and excellent biodegradability [24,25,26].
According to Hakeem et al. [27], who conducted a study to assess the effects of orientation on the mechanical and morphological properties of kenaf fibre-reinforced polyvinyl butyral composites, cellulose-rich husk accounts for more than 1800 million metric tonnes of renewable resources per year. In comparison to the fibres of L. piassaba, N. variegata, O. europaea, and C. nucifera, Z. mays husk showed better tensile properties and high thermal stability [28]. Understanding of these enhanced properties of Z. mays husk was further strengthened by the studies by Bernhardt et al. [29], Chatterjee [22], Mir Md et al. [25], and Omoyeni and Atuanya [30], who used the husk as biopolymers and reinforcement for composites and concluded that it could be further exploited as a potential reinforcement in composite production.
Despite the potential of Z. mays husk, the presence of lignin and hemicellulose, and its high water absorptivity, are the major challenges limiting its application [31,32,33]. Delignification has been shown in studies to improve the characteristics of natural fibres used in composite reinforcement. Koch et al. [34] found that delignified densified wood reinforcements increased stiffness by up to 10.5%, while Ilyas et al. [35] reported that treated sugar palm fibre had higher crystallinity and better thermal stability than untreated fibres. However, data on the influence of combined lignin, hemicellulose, and extraneous material removal on the characteristics of bio-composites are scarce. The aim of the present study is to improve the mechanical and hygroscopic capabilities of Z. mays husk-recycled low-density polyethylene composites via three successive phases of husk treatment.
2. Materials and Methods
2.1. Preparation of Z. mays Husk
The Z. mays husk utilised in this study was acquired from an agricultural site, identified at the Herbarium Section, National Institute for Pharmaceutical Research and Development, and assigned a voucher NIPRD/H/7317. The husk was allowed to dry naturally at approximately 37 °C for a period of eight weeks. Afterwards, it was processed into 50 µm-sized mesh to ensure consistent particle sizes, prevent agglomeration, and enhance the overall husk quality.
2.2. Processing of Waste LDPE
LDPE bags were collected from a selected dump site, washed with water, and dried in open air at 35 °C. The bags were further chopped into smaller sizes using an electric grinder (USHA MG2053N, Baddi, Himachal Pradesh, India) and processed into 50 µm mesh size.
2.3. Husk Pre-Treatment Phases
The air-dried husk of 50 µm mesh size was subjected to three sequential stages of treatments: delignification, de-hemicellulolisation, and bleaching, as detailed below:
2.3.1. First-Phase Treatment: Delignification
The first stage of treatment was conducted according to the method of Tang et al. [36] with slight modification. Exactly 200 g of the processed husk was soaked in 500 mL of 4% w/v NaOH (aq) solution in a 1 L Schott bottle at 120 °C for 12 h, followed by separation from the mother liquor, a black liquor, through vacuum filtration. The husk residue was washed with tap water until the pH of the final wash water was 7 and was centrifuged at 1200 rpm. The obtained husk was dried at 60 °C for 6 h.
2.3.2. Second-Phase Treatment: De-Hemicellulolisation
The second stage of treatment was conducted by agitating about 180 g of the dried delignified husk for 9 h at 80 °C with 175 mL of 1.75% w/v NaOH (aq) solution followed by the introduction of a reducing agent (NaBH4) at a concentration of 3 g/L into the mixture [37]. The insoluble residues were washed with distilled water to a pH 7 and centrifuged at 1200 rpm. Then dried at 70 °C to a constant mass.
2.3.3. Third-Phase Treatment: Bleaching
The third stage of treatment was conducted by treating the dried de-hemicellulolised husk with 3.2% w/v sodium hypochlorite solution for 20 min at 80 °C. The residue obtained was further washed with distilled water to a pH 7, centrifuged at 1200 rpm, and dried at 60 °C for 6 h.
2.4. Formulation of Composites
The Z. mays husk–LDPE composites (referred to as husk composites in this study for simplicity) with husk/polymer fractions were formulated by mixing different mass ratios of sequentially treated husk and LDPE (Table 1). The selected mixing ratios were determined to minimise the influence of the matrix composition on the properties of the composites.

Table 1.
Formulations of husk composites.
The first approach is the formation of a molten LDPE at 115 °C, followed by the progressive introduction of the husk and cross-mixing for 3 min to establish homogeneity. The resulting mixture was then placed in a metal mould of dimensions 120 mm × 100 mm × 3.2 mm for 5 min at 150 °C and 2.5 MPa using a compression moulding machine and cooled for 5 min. After cooling, the untreated, delignified, de-hemicellulolised, and bleached husk composites were removed and labelled as UnPm, LnPm, HnPm, and BnPm, respectively, where n and m represent the mass mixing ratio of the husk and LDPE in the composites. The LDPE was prepared in a similar fashion without injection of the treated husk and used as the control in this study.
2.5. Characterisation of Husks and Composites
The functional group composition of the husks was analysed using FT-IR (PerkinElmer Spectrum 400, Waltham, MA, USA) by scanning between 4000 and 400 cm−1. The topography was examined using an X-ray diffractometer (Bruker D-8 Discover, Biller, MA, USA), while the surface morphology was observed with an emission electron microscope (Jeol JSM-6400, Peabody, MA, USA). The same procedure above was used for the composite with superior mechanical performance. The thermal properties of the composites were determined using a thermal gravimetric analyser (TGA 4000, Shelton, CT, USA). Thermal decomposition of the composites was analysed through a simultaneous thermal analyser equipped with a nitrogen flow device and a data acquisition system. Each composite (≈5 mg), placed in an alumina pan, was thermally treated at a 10 °C/min heating rate under N2 (100 mL/min) from ambient temperature to 900 °C. The mass loss and calorific changes as a function of temperatures were recorded and plotted as the thermal gravimetric (TG) and derivative thermal gravimetric (DTG) curves.
2.6. Mechanical Characterization of the Husk Composites
Analyses of the characteristics and behaviour of the composites when subjected to mechanical forces or loads were conducted in triplicate to determine composite strength, stiffness, and toughness.
2.6.1. Tensile Strength
The tensile strengths of the various husk composites were measured in accordance with ASTM D-638 [38]. The composite with a dogbone geometry and narrower gauge section in the middle was secured using specialised mechanical grips without causing any damage or slippage during testing. The grips with the composite were mounted in a tensile testing machine, which applied a controlled loading force and a crosshead speed of 5 mm/min. Then, the tensile testing machine was started, subjecting the composite to increasing axial load until it either fractured or reached the point of failure. The tensile strength of each husk composite was automatically determined by dividing the maximum load applied to the composite by the original cross-sectional area of the gauge section and was expressed in units of MPa.
2.6.2. Impact Strength
Each husk composite was tested using the Izod impact tester, following the guidelines of ASTM D256-10 [39]. The composites had dimensions of 64 mm × 12.7 mm × 3.2 mm with a 45° notch. A 1500 N hammer was launched at a 150° inclined angle, and the impact strength of each husk composite was measured and recorded in units of J/mm.
2.6.3. Hardness
According to ASTM D2240-05 [40], the hardness of the composite was measured by the Shore hardness test using a durometer. The test was conducted by pressing a durometer with flat head geometry against the surface of the composite in conformity with the standard. Multiple indentations were made on the surface of the composite, and the depth of each indentation was measured to determine the hardness.
2.6.4. Flexural Strength
According to ASTM D790-21 [41], the flexural strength testing was conducted on a composite material measuring 100 mm × 25 mm × 3.3 mm. The composite, which had a rectangular geometry with a width of 25 mm and thickness of 3.3 mm, was placed horizontally on a support span with a gauge length of 80 mm. Furthermore, the test speed was set at 2 mm/min, and a gradual load was applied to the centre of the composite until failure was observed. The maximum load applied to the specimen just before failure occurred was recorded as the flexural strength.
2.7. Hygroscopic Characteristic Husk Composites
As per the ASTM D-570 standard [42], the moisture-absorbing properties of a composite were evaluated under controlled conditions. The assessment involved subjecting the selected husk composites, with excellent mechanical characteristics, to hygroscopic study. The test was carried out in a controlled humidity chamber, maintaining a temperature of 23 ± 2 °C and a relative humidity of 50 ± 5%. Initially, the weights of the husk composites were carefully measured using a high-precision balance. The composites were then immersed in water for a predetermined duration ranging from 2 to 192 h.
Following the hygroscopic study, steps were taken to maintain a consistent weight for the composites. This involved drying the specimens in an oven set at 80 °C for 24 h. They were subsequently stored in a sealed desiccator with anhydrous calcium sulphate as the desiccant, creating a low-humidity environment. Throughout the study, the weights of the composites were regularly recorded to accurately track their levels of water absorption. These recorded weights served as the basis for calculating the water-absorption percentage of the composites, as stated in Equation (1), where W1 and W2 are the sample weights before and after immersion, respectively:
2.8. Economic Assessment
The economic feasibility of the process was analysed using the total annualized cost (TAC) at both the husk-treatment and husk composite-fabrication stages as the performance indicator. The economic feasibility was evaluated by calculating the TAC at an interest rate of 8% over an estimated investment lifetime of 10 years [43]. Parameters tailored to Nigeria, along with market analysis and cost data, were employed to calculate the operational expenses related to raw materials, utilities, and labour, as shown in Table 2. Due to a lack of data on the present market conditions, consumer prices were adjusted and projected to reflect 2021 prices.
Table 2.
Region-specific economic parameters used in determining TAC for the husk composite process.
2.9. Sustainability and Carbon-Footprint Analysis
These assessments consider the temperatures needed for sequential treatment and moulding processes to calculate the energy expenses for heating and the resulting carbon footprint.
3. Results
3.1. Functional Analysis of the Husks
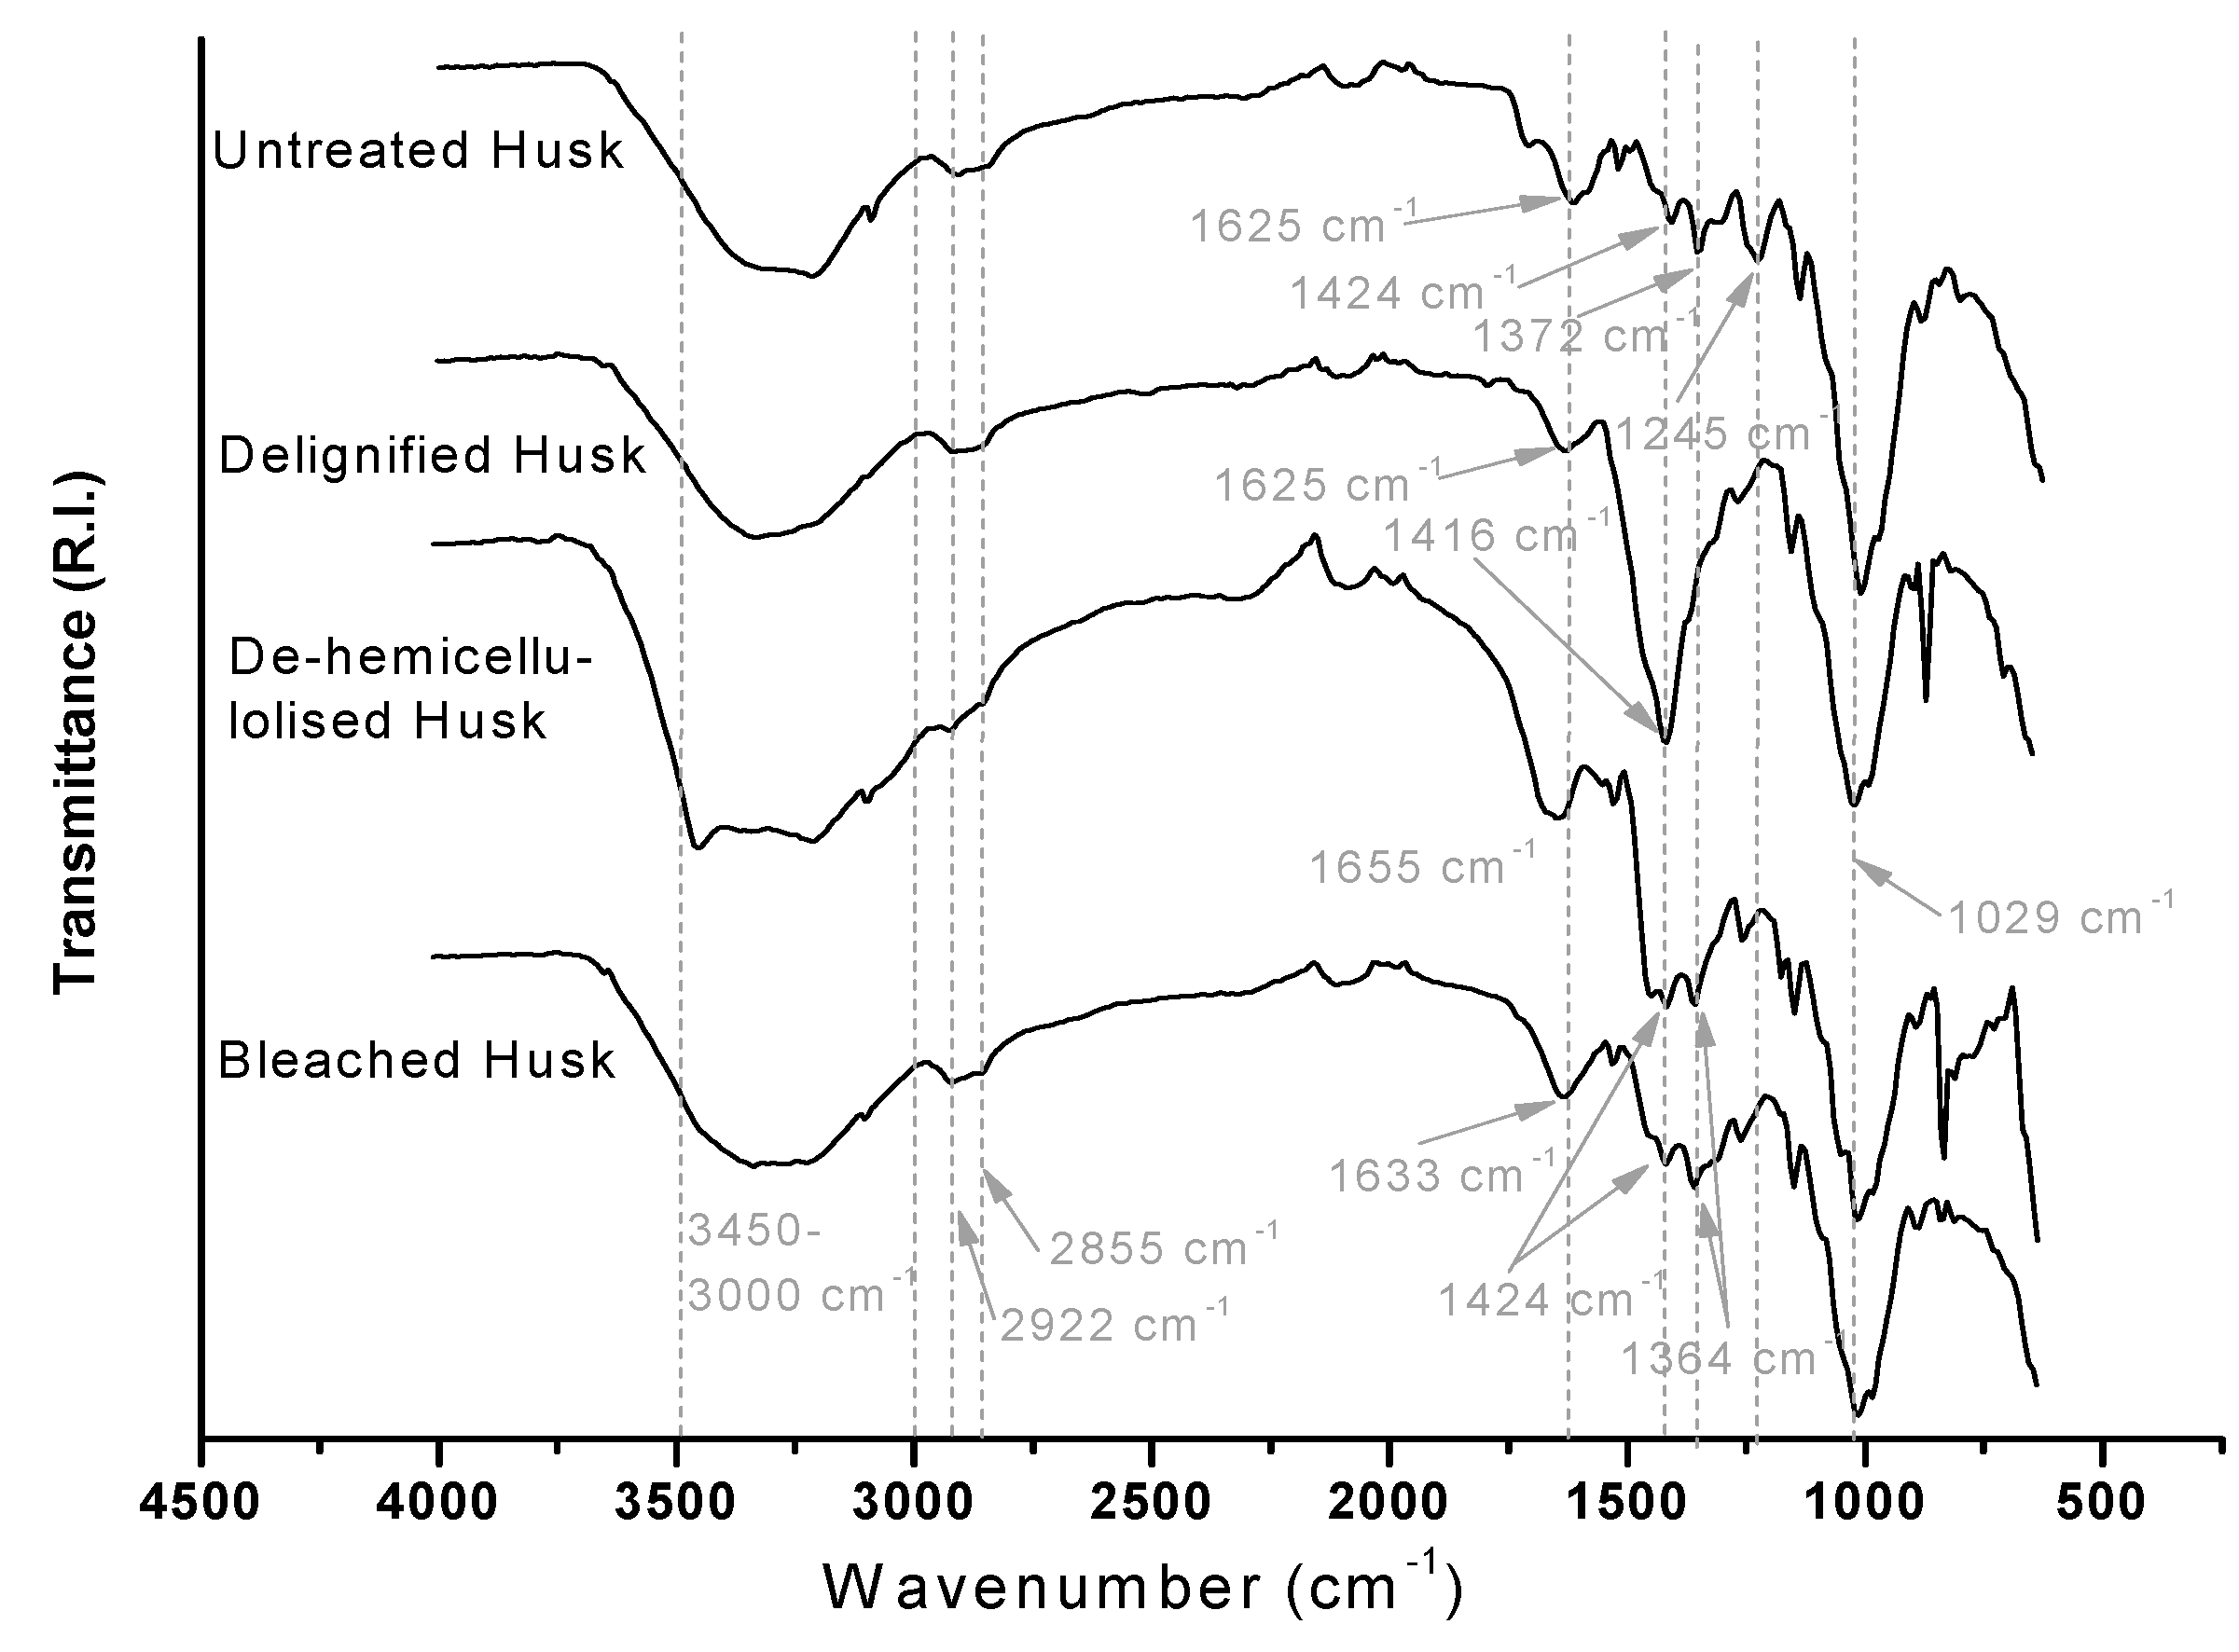
The FTIR spectra of untreated, delignified, de-hemicellulolised, and bleached husk are shown in Figure 1.
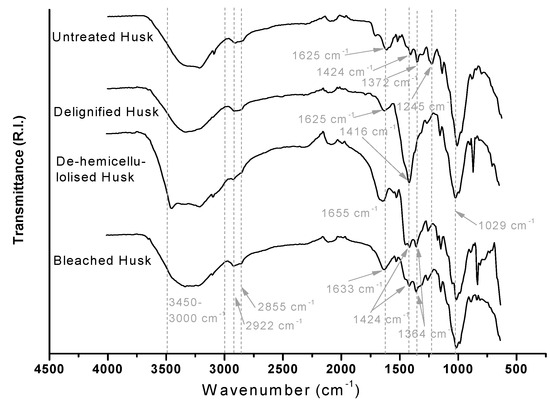
Figure 1.
The FTIR spectra of the Z. mays husks.
The spectra show that all four samples have similar functional groups, presenting a band from 3000 to 3450 cm−1, due to the stretching of the O-H bonds, and they have peaks at 2922 and 2855 cm−1 due to the asymmetric and symmetric stretching of C-H bonds from methylene groups, from 1625 to 1655 cm−1 due to the deformation vibrations of the O-H bonds, and from 1416 to 1424 cm−1 due to the deformation vibrations of C-H bonds and O-C-O bonds [44]. This last peak presents a higher intensity for the delignified husk due to the intensification that this band presents when the O-C-O group is associated to water molecules [45]. Indeed, the delignified husk is the most hydrophilic and hygroscopic due to the removal of the lignin fraction that has a hydrophobic character, and after the removal of the hemicellulose, the most hydrophilic fraction of the ligninocellulosic material, the samples (de-hemicellulolised and blanched) become less hydrophilic, and the band decreases its intensity.
The samples also present peaks from 1364 to 1372 cm−1, also due to the deformation vibrations of C-H bonds, and at 1029 cm−1 due to the symmetric stretching of the C-O-C bonds [46]. The most significant difference is seen for the peak 1245 cm−1 that appears only for the untreated husk and is related to the asymmetric stretching of the C-O-C bonds in aromatic structures of the lignin, indicating that it has been further removed during the first treatment. These results show that the husk-treatment processes were successful. They align with the outcomes presented in the study conducted by Mir Md et al. [25], in which they utilised a vacuum-infusion NaOH treatment approach to eliminate lignin and hemicellulose compounds from the husk for the purpose of developing a polyester/husk composite, and also with the outcomes of the chemical analysis conducted by James et al. [44] in their study on the extraction and characterization of husk α-cellulose-rich residue.
3.2. Morphological and Phase-Identification Analysis of Husk
The micrographs in Figure 2 show the surface morphology of untreated, delignified, de-hemicellulolised, and bleached husks. The untreated husk has a rough surface with many protrusions (Figure 2a). After delignification, the surface of the husk becomes smoother (Figure 2b). This is because the removal of the complex polymer lignin makes the cell wall become more flexible and more susceptible to bio-compositing.
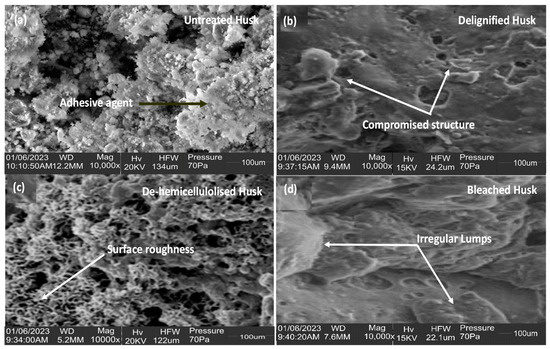
Figure 2.
SEM micrographs of (a) untreated, (b) delignified, (c) de-hemicellulolised, and (d) bleached Z. mays husks at magnification of ×10,000.
Following the removal of the hemicellulose, the surface of the husk becomes spike- and sponge-like (Figure 2c). This is due to the removal of cell-wall adhesive resulting in a less cohesive structure. During the bleaching phase, the pigments undergo a decomposition process into smaller colourless molecules due to the oxidising properties of sodium hypochlorite solution (Figure 2d). The micrographs show that the surface morphology of the husk changes significantly due to the removal of lignin, hemicellulose, and pigments from the husk. The alterations in the surface structure of the husk correspond with the modifications in its chemical composition shown in Figure 1. As stated by Singh et al. [47], these changes could potentially impact the properties of the husk, including its biodegradability and combustion properties.
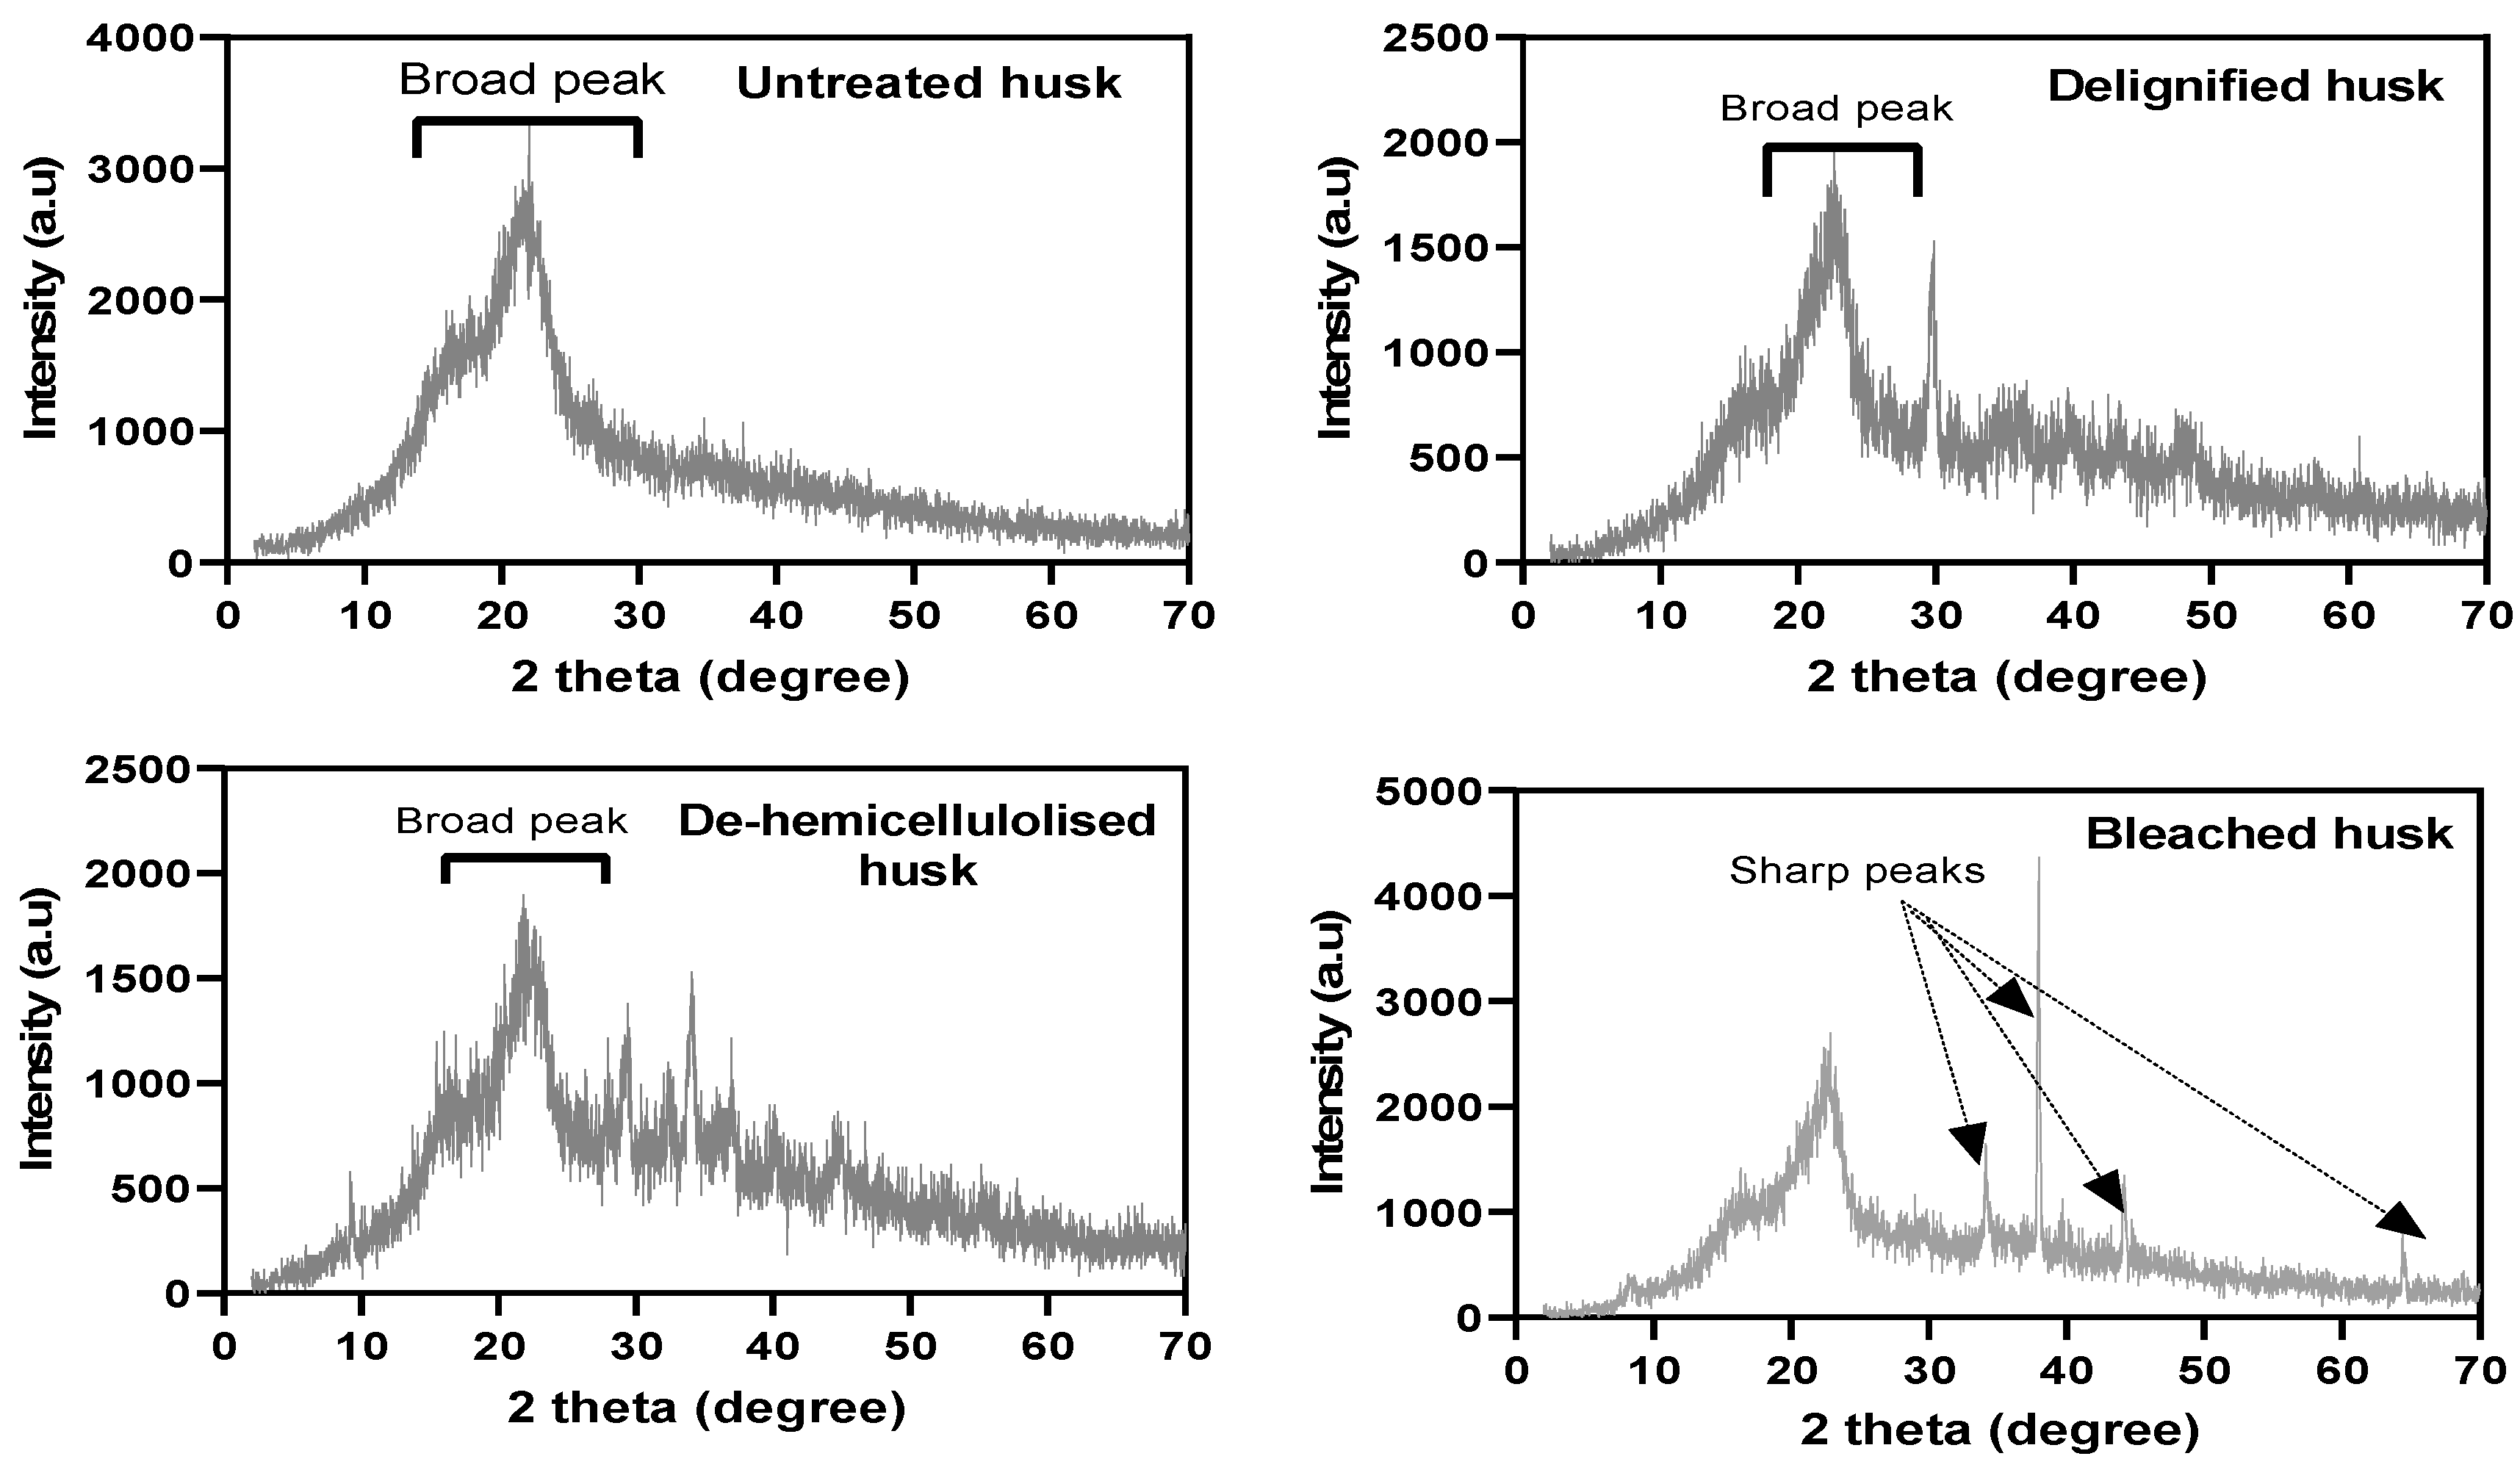
The XRD patterns of the untreated, delignified, de-hemicellulolised, and bleached husks are shown in Figure 3. The untreated, de-hemicellulolised, and delignified husks showed a broad peak at around 15°–25°, which is characteristic of amorphous cellulose. The bleached husk showed sharp peaks at around 35°, 39°, 45°, and 65°, which is characteristic of crystalline cellulose. It was equally observed that with sequential treatments there is a slight increase in cellulose crystallinity. The findings from the studies of Khan et al. [48] and Mativenga et al. [49] support the observation that the sequential removal of lignin and hemicellulose from lignocellulosic materials, such as rice husk and corn stover, can result in an increase in the crystallinity of the remaining cellulose. This is because the amorphous lignin and hemicellulose components are removed, leaving behind a more crystalline cellulose structure.

Figure 3.
The X-ray diffractogram of the Z. mays husks.
The sequential removal of lignin and hemicellulose from the husk led to an increase in the crystallinity of the cellulose. This suggests that the processes of delignification, de-hemicellulolysis, and bleaching can be used to improve the quality of the husk as a feedstock for the production of biofuels and other products.
3.3. Mechanical Properties of Husk Composites
3.3.1. Tensile strength
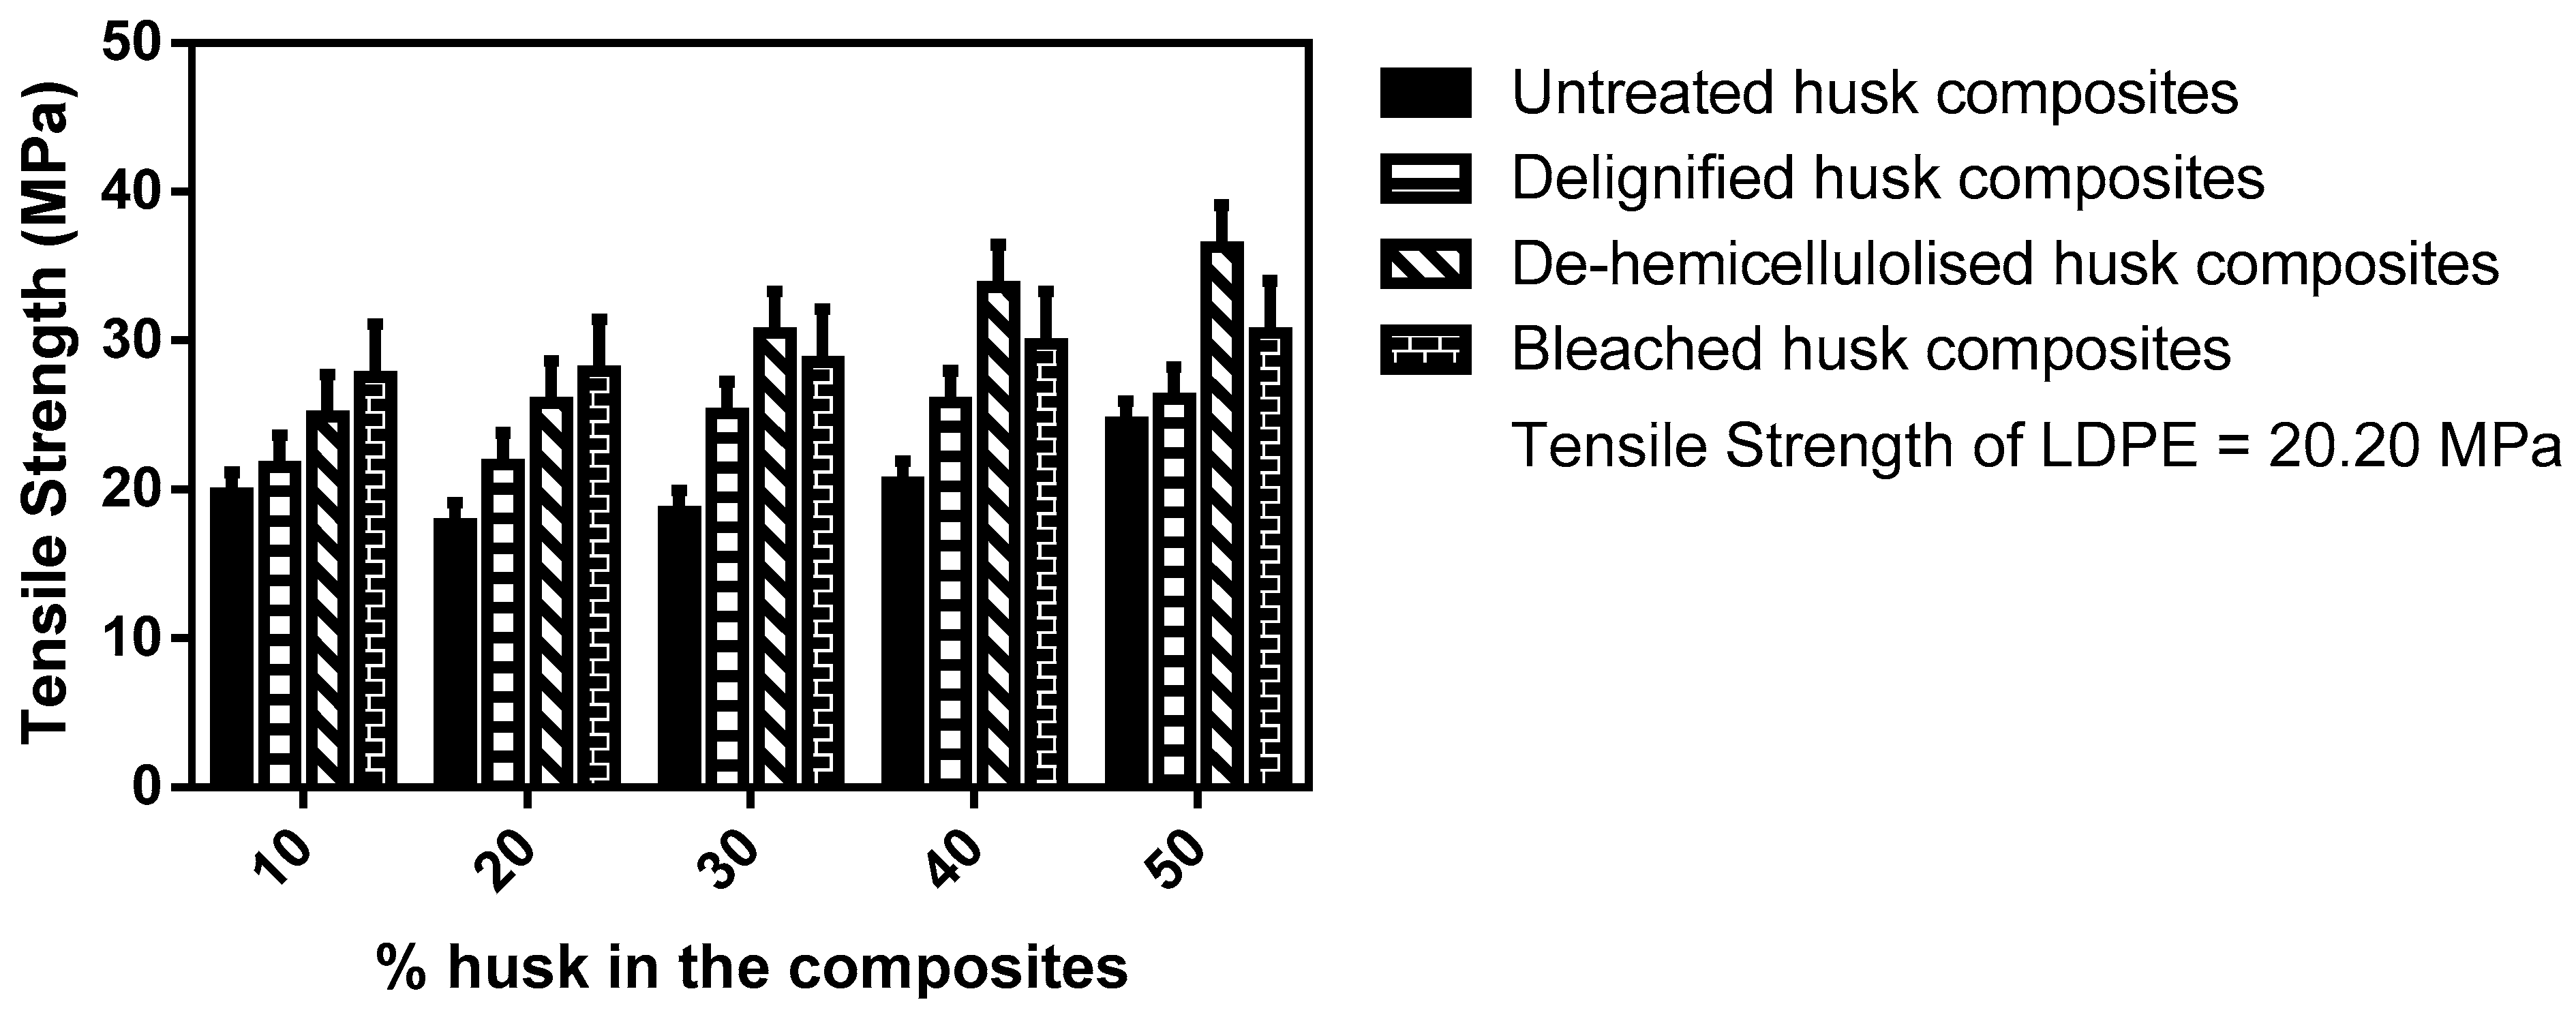
Generally, sequential treatments and increase in husk loading improve a composite’s ability to withstand stretching forces without fracturing compared to untreated husk composites and LDPE (Figure 4).

Figure 4.
Tensile strength of husk composites.
The tensile strength of the untreated husk composites initially decreased with increasing husk loads up to 20 wt% but increased with further addition of husk ≥30 wt%. This is because at a husk load of ≤20 wt%, there is a limited amount of husk material incorporated into the composite matrix, leading to a lower reinforcement effect. Additionally, inadequate bonding between the husk particles and the matrix material can contribute to lower tensile strength. Insufficient bonding reduces the load-transfer capability between the husk particles and the matrix, leading to weaker overall composite properties. However, as the husk load increases at ≥30 wt%, more husk particles are incorporated into the composite, enhancing the reinforcement effect.
The tensile strength of delignified husk composites increases as the husk content rises, up to a maximum of 50 wt%. This improvement in tensile strength is attributed to the increased stiffness and strength of the composites due to the presence of husk particles. The lowest tensile strength observed in the pre-treated husk composite was at 10 wt% husk load; however, even at this load, the tensile strength was still higher than that of LDPE. The tensile strength of the husk composites with a 50 wt% husk load shows that the delignified and de-hemicellulolised husk composites have tensile strengths of around 24.6 MPa and 34.3 MPa, which are higher than the untreated husk composites at around 23.5 MPa. Specifically, at a 50 wt% husk load, the tensile strength improvements observed in the delignified and de-hemicellulolised husk composites compared to the untreated husk composites show increases of around 1.1 MPa and 10.8 MPa, respectively. In this study, the optimal tensile strength was found at 34.3 MPa for de-hemicellulolised husk composite at a husk load of 50 wt%. This suggests that the addition of de-hemicellulolised husk can improve the load-bearing capacity of LDPE. This observation aligns with findings of Joseph et al. [50], who reported that the tensile strength of polypropylene composites reinforced with rice husks increased with increasing husk content up to 40 wt%. Similarly, John and Thomas [51] observed a comparable trend in the tensile strength of kenaf-reinforced polypropylene composites.
The observed trend in tensile strength of sequential husk composites is influenced by the surface treatment of the husks. This is supported by a study conducted by Kim et al. [52], who found that alkali-treated jute fibre-reinforced polypropylene composites exhibited higher tensile strength compared to untreated jute fibre composites. This improvement in tensile strength is attributed to the removal of lignin and hemicellulose from the jute fibres during alkali treatment. This enhances the adhesion between the fibres and the polypropylene matrix, leading to stronger composites.
3.3.2. Hardness
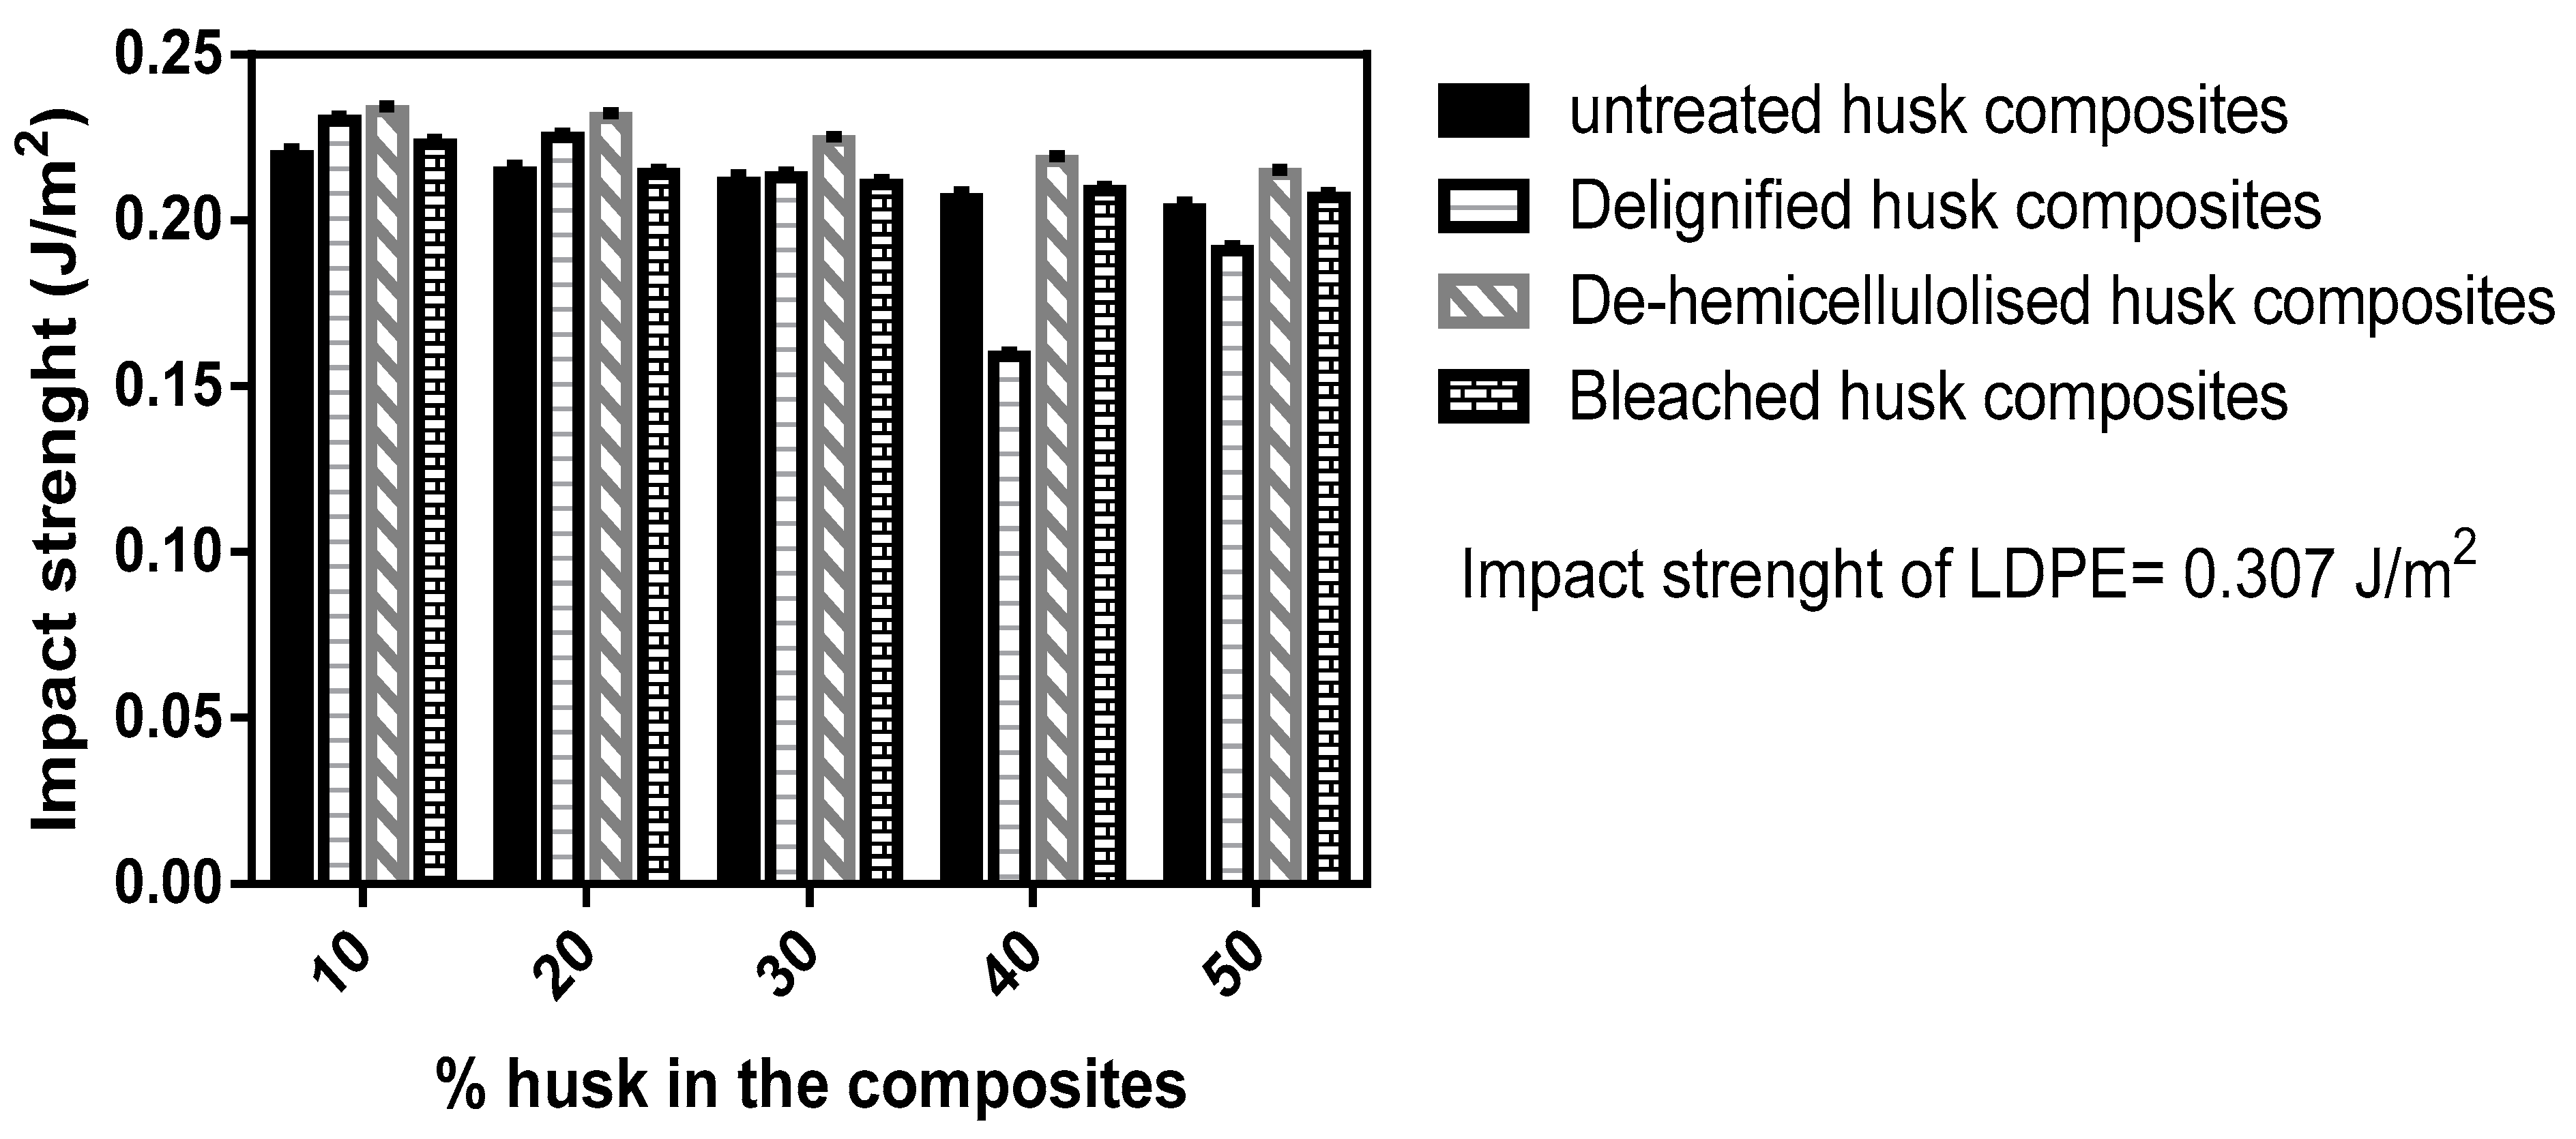
The impact strengths of husk composites with different husk–LDPE mass ratios are presented in Figure 5. The control exhibited the highest impact strength, attributed to the high ductility and low notch sensitivity, compared to all tested composites. This is in accordance with the findings of Edalati et al. [53], who reported that materials with high ductility tend to exhibit good impact strength.
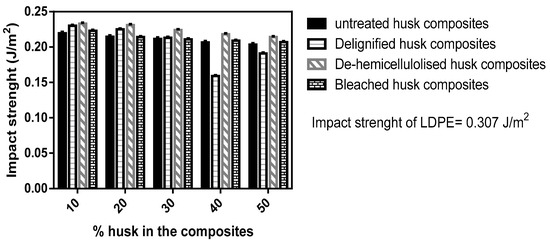
Figure 5.
Impact strength of husk composites.
The impact strengths of the delignified, de-hemicellulolised, and bleached husk composites were found to decrease with increasing husk content. The impact strength of LDPE was found to be 0.31 ± 0.1 J/m2, while the impact strength of the composites ranged from 0.16 ± 0.1 to 0.22 ± 0.3 J/m2. The impact strength of the untreated husk composites decreased with increasing husk loads as observed in the pre-treated husk composites; this is because the husks act as stress concentrators, which can initiate cracks in the matrix. The cracks can then propagate and cause the composite to fail. In the case of the delignified husk composites, the husks are likely to be particularly effective at initiating cracks, as they are both brittle and have a high aspect ratio.
A previous study by Smith and Johnson [54] found that the impact strength of PP composites decreased with increasing husk loading. The study also found that the impact strength of the composites was lower than that of PP. Another study by Brown and Williams [55] found that the impact strength of PLA composites decreased with increasing husk loading. The study also found that the impact strength of the composites was lower than that of PLA.
3.3.3. Hardness
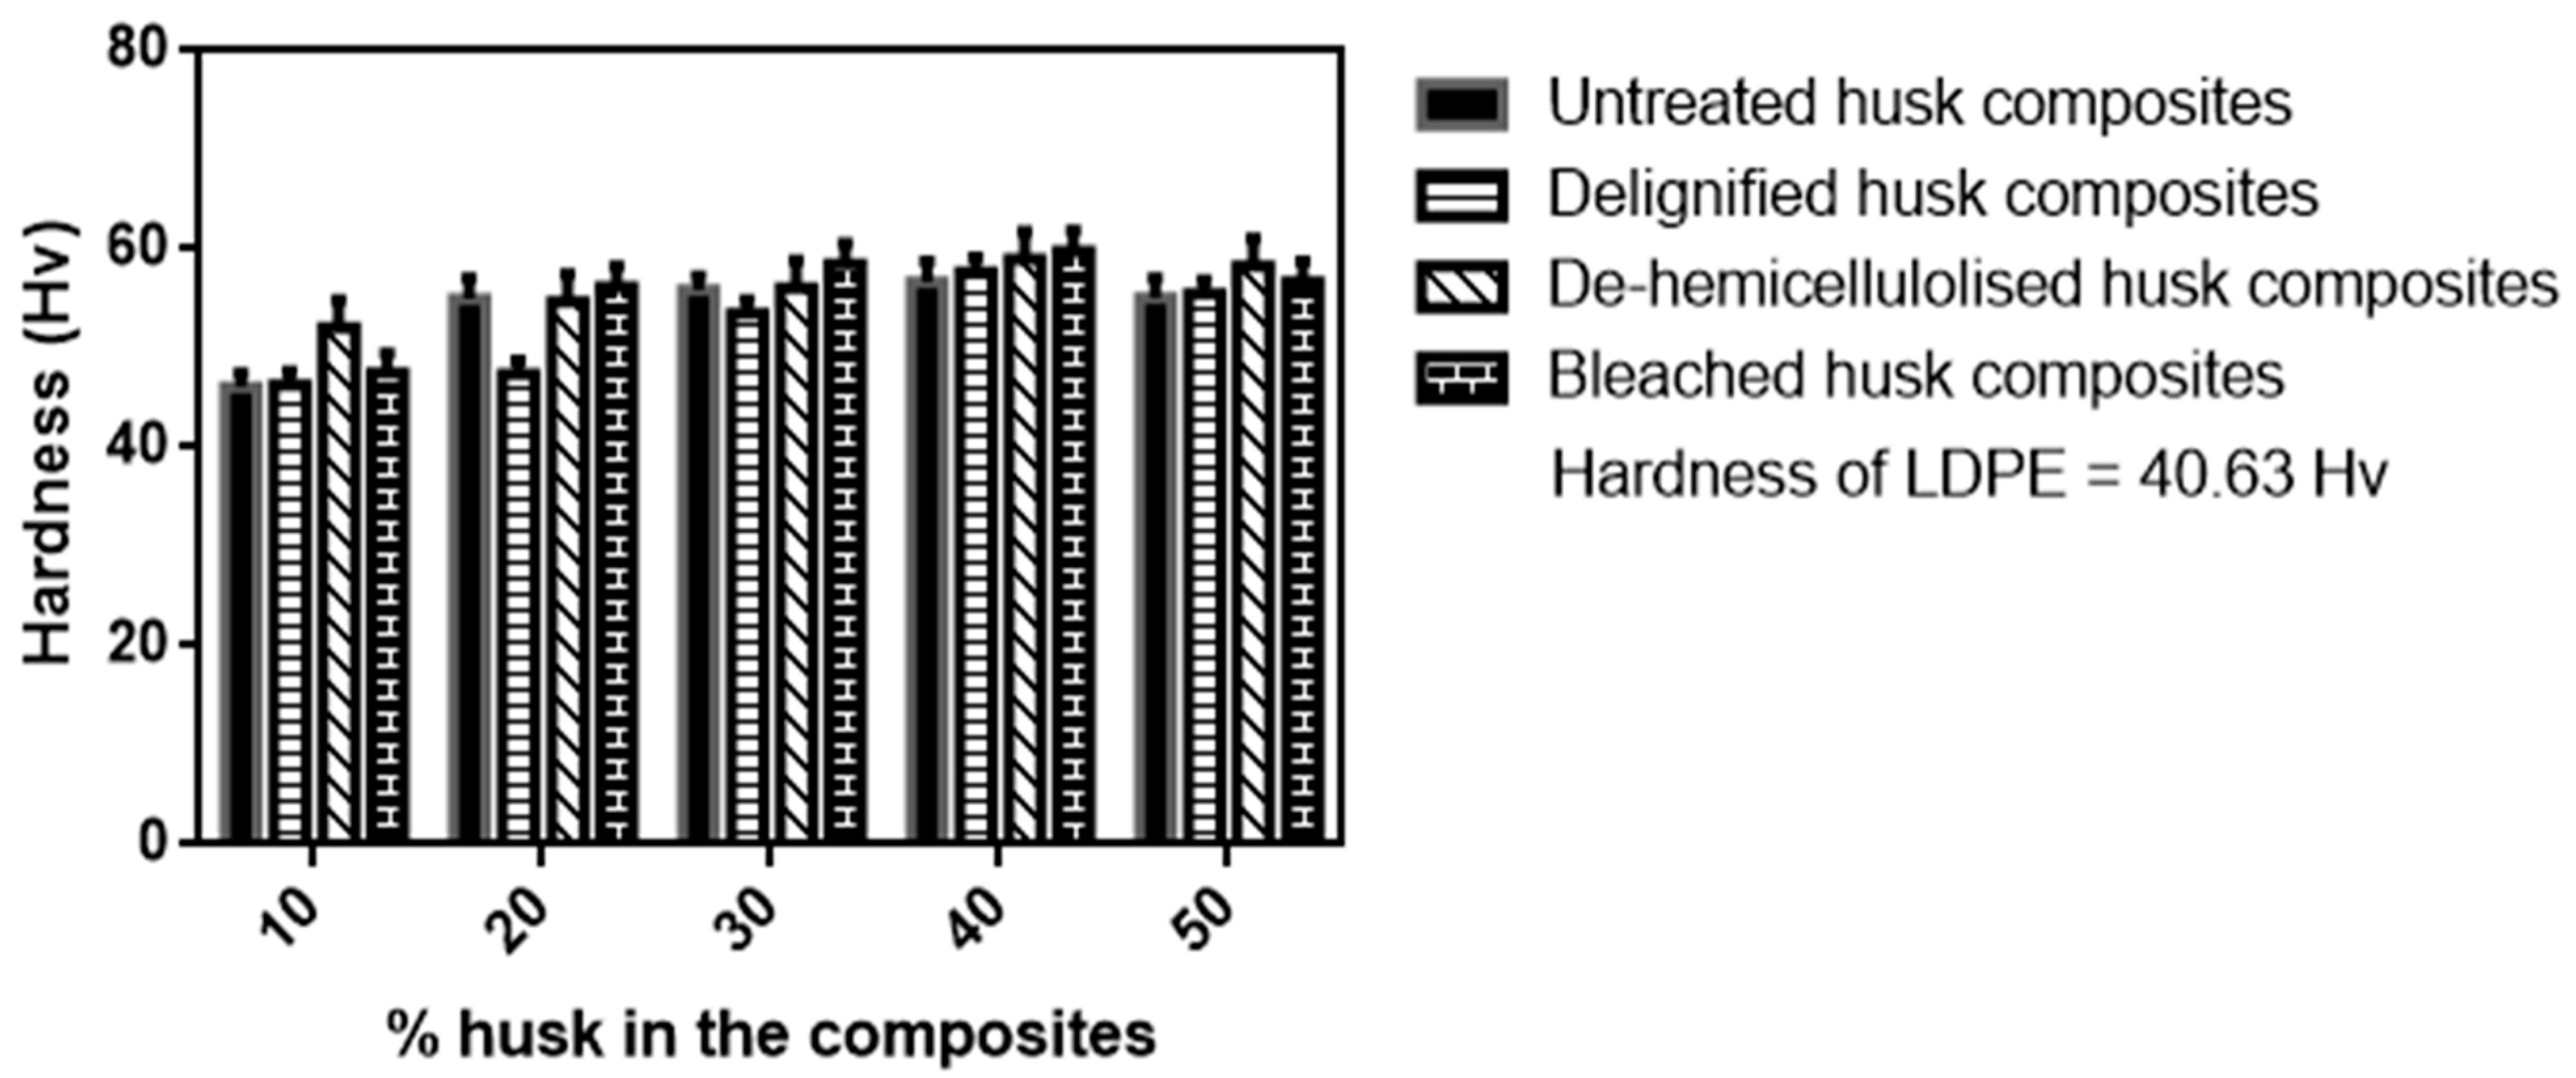
The hardness of husk composites with different husk loads is presented in Figure 6.

Figure 6.
Hardness of husk composites.
Overall, the hardness of the delignified, de-hemicellulolised, bleached husk composites increased with increasing husk loading, up to a maximum of 40 wt% load and decreased with further increase in husk load. The increasing hardness of composites with higher husk content can be attributed to the presence of husk particles within the composite structure. These particles hinder the movement of polymer chains, making the material more resistant to deformation under stress. A similar observation has been reported in the study by Kabir et al. [56], who reported that the hardness of LDPE composites reinforced with pineapple leaf fibres also increased with higher fibre content. The underlying reason was the high cellulose content of the pineapple leaf fibres, which provided significant reinforcement to the composites. Due to its high cellulose content (76.00–97.95%), as reported by James et al. [44], sequentially pre-treated husks serve as a good source of sturdy and rigid materials. Adding husks to the composite material increased its cellulose content, resulting in higher hardness. This observation aligns with previous findings by Bledzki and Gassan [57], who demonstrated a positive correlation between cellulose content and hardness in composite materials.
However, the decrease in hardness with further increase in load could be a result of the selected husk size (50 µm) and processing conditions (relatively low temperature of 150 °C). A smaller husk size results in a more uniform distribution of the husk in the composite, which results in a higher hardness of the composite [58]. According to Smith [59], composites that were processed at a higher temperature had higher hardness than the composites that were processed at a lower temperature. This is because the higher temperature resulted in better bonding between the husk and the LDPE matrix, which resulted in a higher hardness of the composite. The untreated husk exhibits a similar hardness trend as observed for the treated husk; by implication, husk pre-treatment, unlike the husk content and processing conditions, does not significantly impact the hardness of the composites. The hardness of the composites was also found to be higher than that of the neat LDPE, because the husk particles are harder than the LDPE matrix, and so they act as reinforcing agents.
3.3.4. Flexural Strength
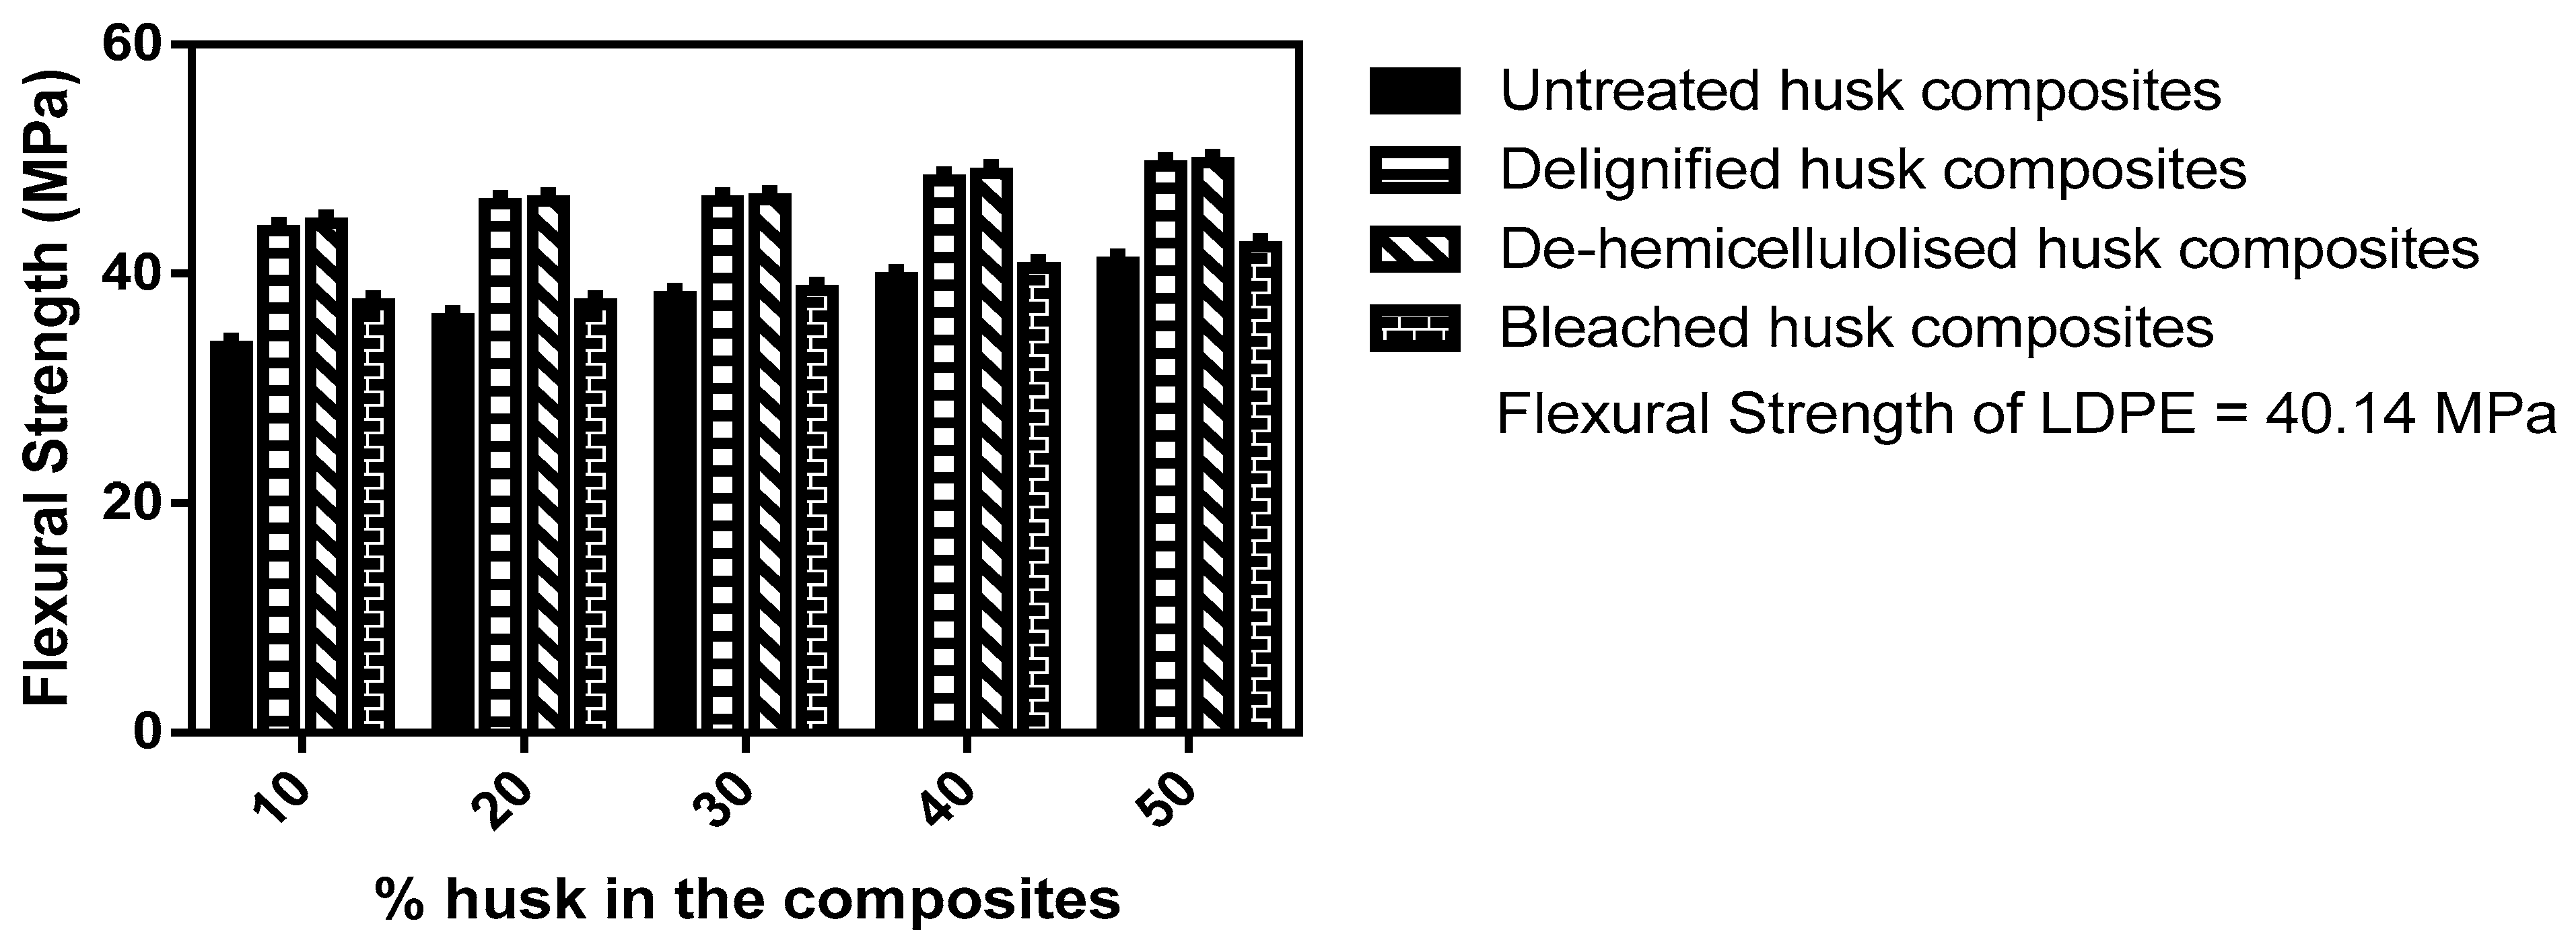
The ability of the husk composites with different husk loads to resist bending or breaking are presented in Figure 7. Composites formulated from delignified and de-hemicellulolised husks showed a better modulus of rupture compared to the composites formed from third-phase treated husk (bleached husk), untreated husk, and LDPE (Figure 7). The flexural strength of the delignified and de-hemicellulolised husk composites increased with increasing husk loading up to 50 wt%. This is because removal of lignin and hemicellulose improves the purity and quality of the husk, allowing for better bonding and interfacial adhesion between the husk and the matrix material. This improved bonding enhances the load transfer and distribution within the composite, resulting in higher flexural strength.

Figure 7.
Flexural strength of husk composites.
On the other hand, bleaching of the husk or leaving the husk untreated can result in uneven surface characteristics on the husk. This factor can hinder effective bonding with the matrix material, resulting in reduced flexural strength. Additionally, untreated husks may have a less rigid structure and lower resistance to deformation, further contributing to lower flexural strength in the composites.
The flexural strength of the bleached husk composites initially decreased as the husk load increased up to 20%. However, as the husk load further increased, the flexural strength improved compared to LDPE. This may be attributed to the fact that the addition of husk up to 30 wt% improved the interfacial bonding between the fibres and the matrix, resulting in better stress transfer and higher flexural strength. However, if the husk load is ≤20 wt%, the interfacial bonding is poor, resulting in lower flexural strength.
In the case of the untreated husk composites, the flexural strength increased with increasing husk load, albeit not significantly different from the 50 wt% of LDPE. However, the flexural strength of the untreated husk composites at loadings of 10–40% was lower than that of LDPE. This lower strength can be attributed to the inadequate bonding between the husk and the matrix. Consequently, the untreated husk composites are more prone to failure under flexural loading compared to delignified and de-hemicellulolised husk composites.
The flexural strength of husk composites with a 50 wt% husk content indicates that delignified and de-hemicellulosed husk composites achieve flexural strengths of approximately 48.9 MPa and 49.2 MPa, respectively, which are higher than the 40.5 MPa observed in untreated husk composites. Overall, the improvements in flexural strength for delignified and de-hemicellulosed husk composites compared to untreated ones are roughly 8.4 MPa and 8.7 MPa, respectively.
3.4. Characterisations of Treated and Untreated Husk Composites
Delignified (L5P5), de-hemicellulolised (H5P5), bleached (B5P5), and untreated (U5P5) husk composites with superior tensile and flexural characteristics compared to LDPE, with the exception of impact strength and hardness, were selected for further analysis.
3.4.1. Functional Analysis of Husk Composites
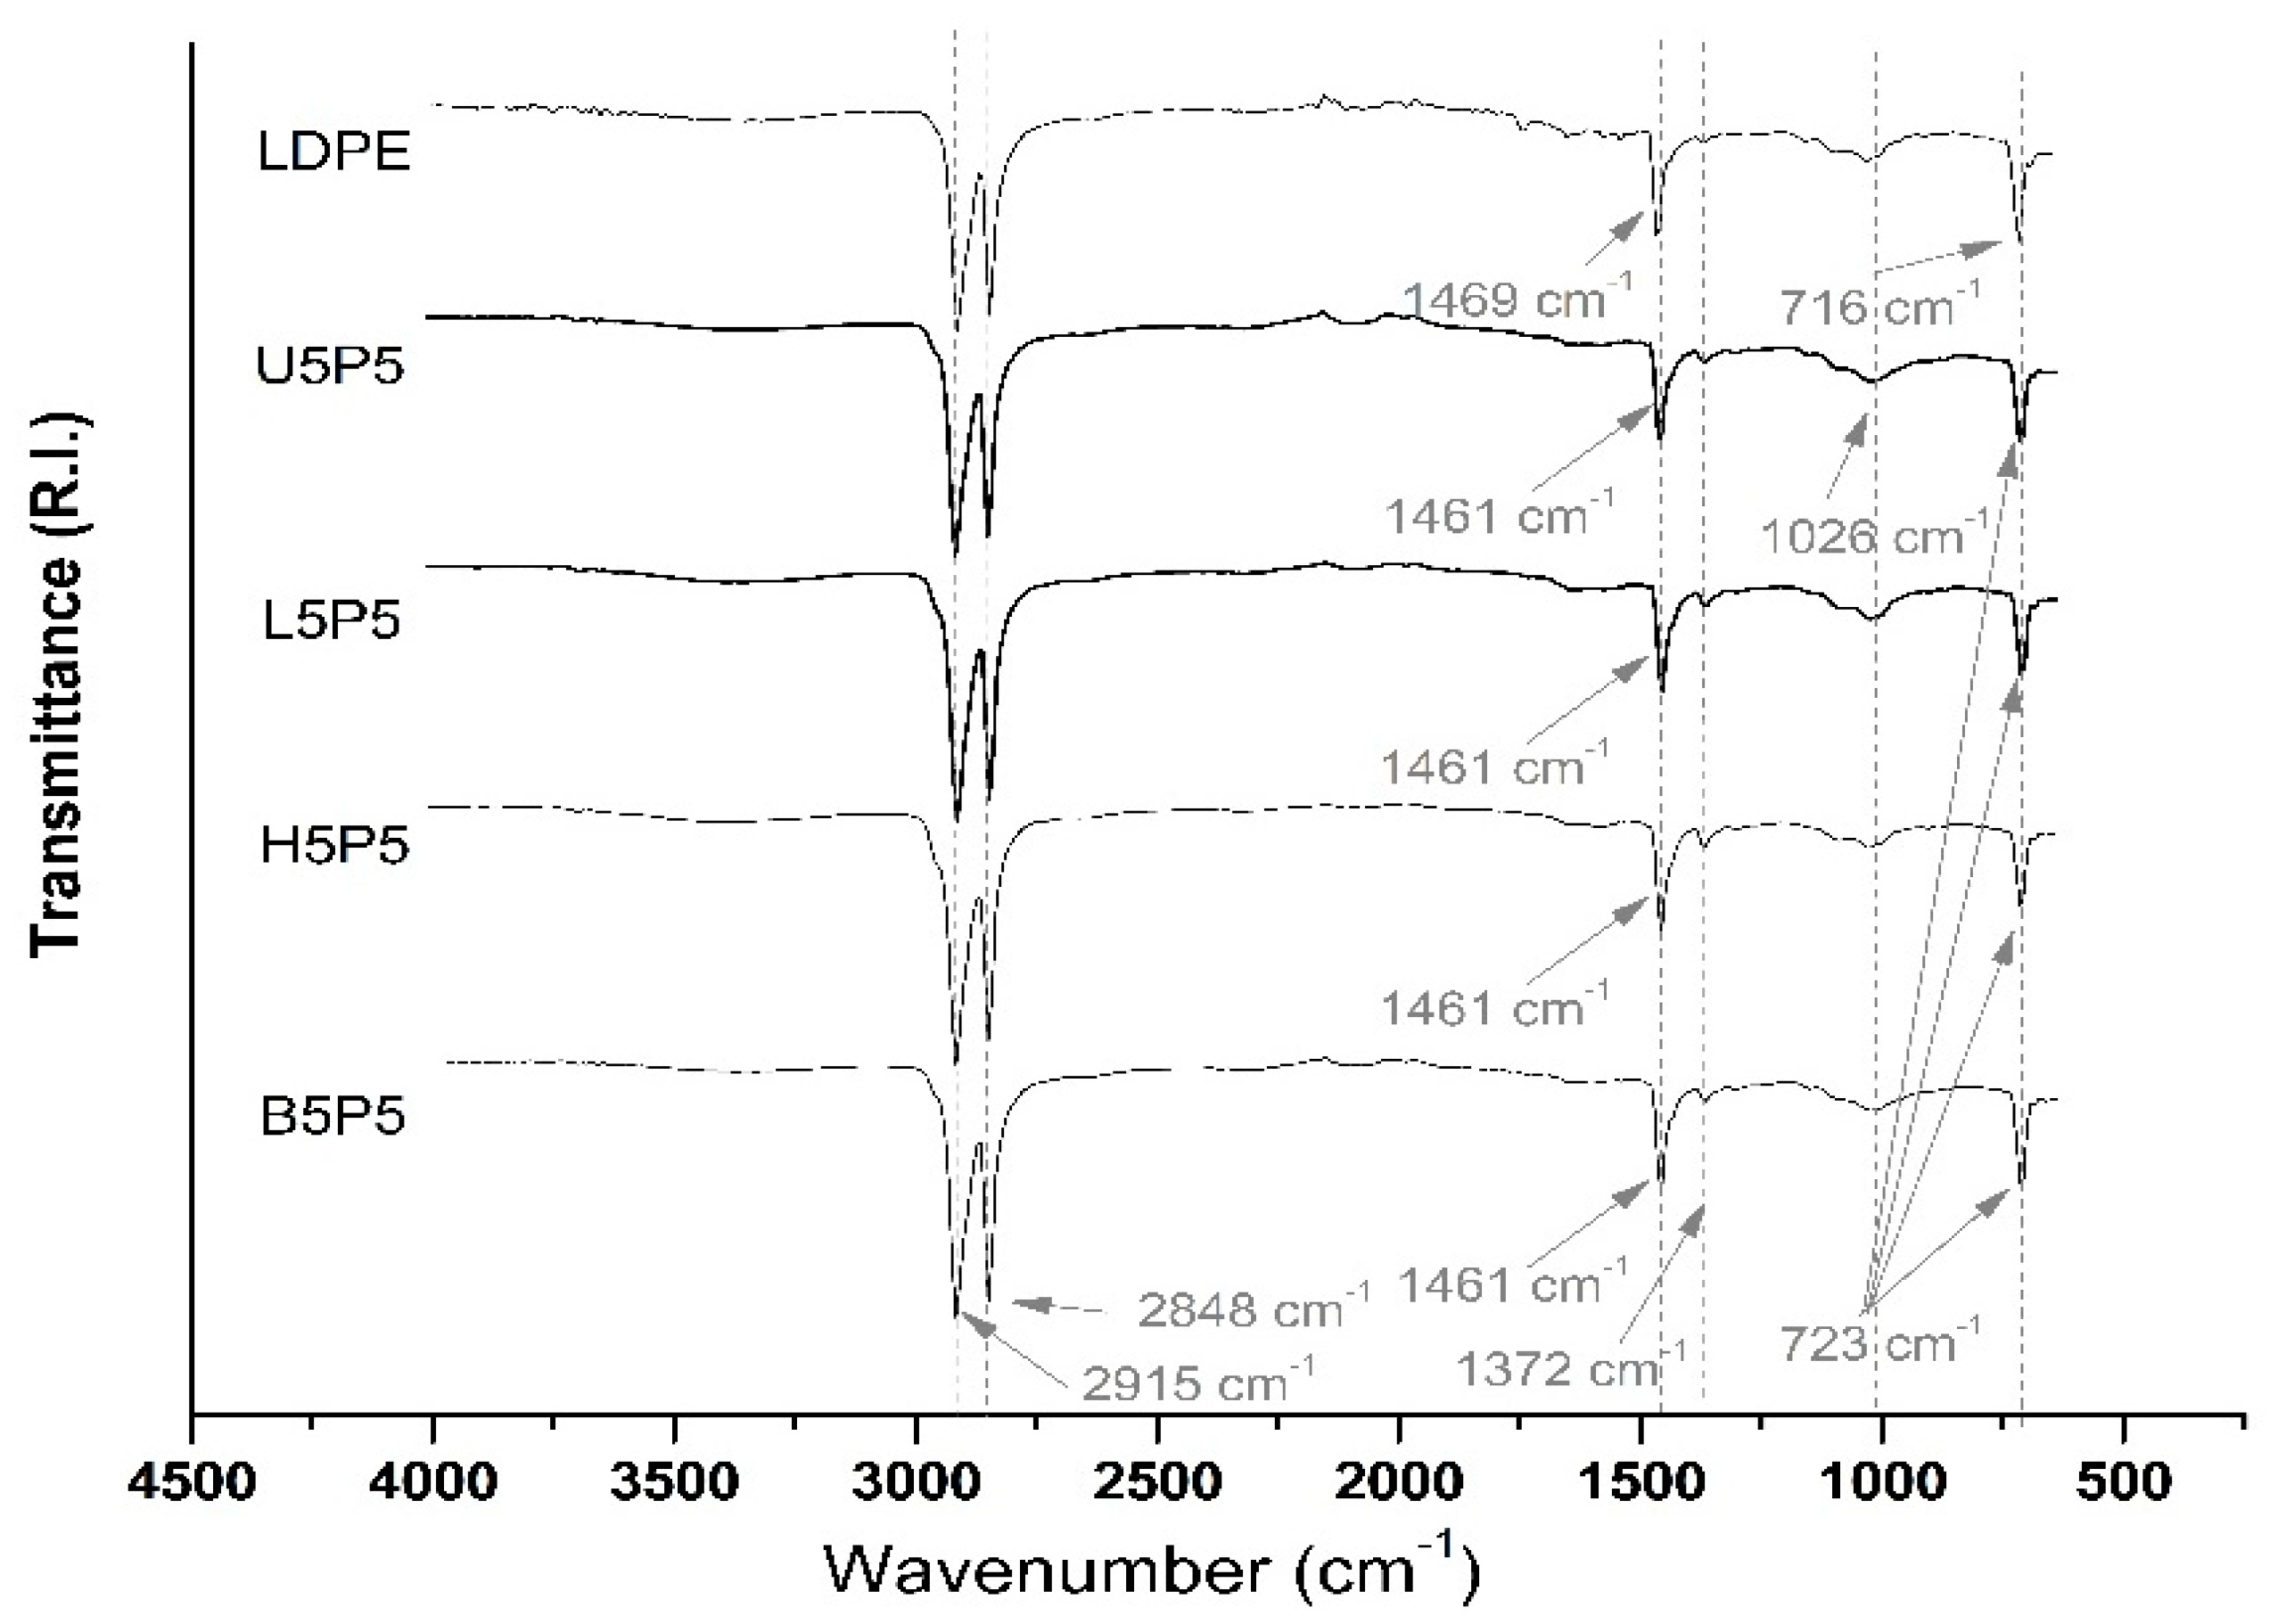
Figure 8 shows the FTIR spectra of L5P5, H5P5, and B5P5 composites compared to U5P5 composite and LDPE. The spectrum of the treated husk composites, untreated husk composite, and LDPE shows the characteristic peaks of polyethylene, including the C-H stretching vibrations between 2915 cm−1 and 2848 cm−1, the CH2 bending vibrations from 1461 to 1469 cm−1, and the wagging vibrations from 716 to 723 cm−1. Also, a small peak at 1372 cm−1 appears for the composites due to CH3 symmetric deformation vibrations. The presence of CH3 can be attributed to branching occurring during the preparation of the composite due to heat [60]. The LDPE spectrum presents low-intensity bands at the regions of the main peaks related to the untreated and treated husks, making it difficult to distinguish them on the composite spectra.
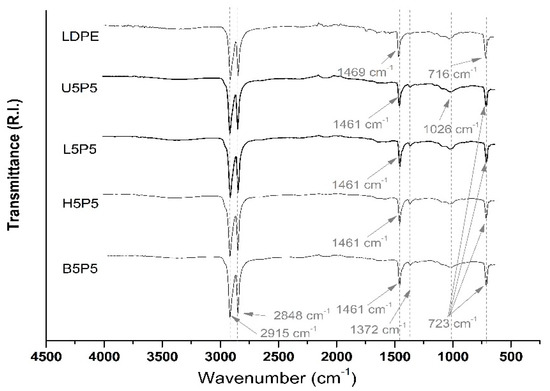
Figure 8.
The FTIR spectra of the husk composites.
3.4.2. Surface Morphological Studies
Figure 9 shows the SEM micrographs of the untreated husk composite (U5P5), delignified husk composite (L5P5), de-hemicellulolised husk composite (H5P5), and bleached husk composite (B5P5).
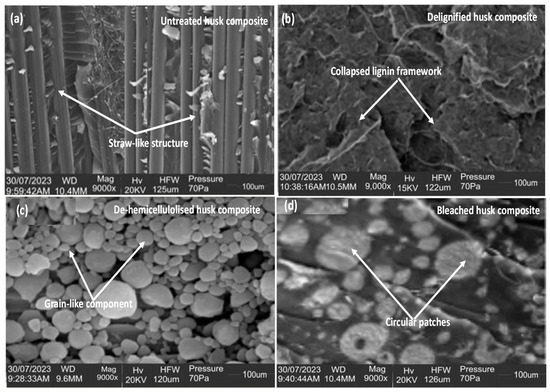
Figure 9.
The micrographs of the (a) untreated, (b) delignified, (c) de-hemicellulolised, and (d) bleached husk composites at ×9000.
The micrograph of the untreated husk composite (U5P5) shows a continuous and dense structure with some visible voids. The straw-like structure is clearly visible, indicating that the husk is well bonded to the polymer matrix. The surface of the delignified husk composite (L5P5) is rougher than that of the untreated husk composite, indicating the removal of lignin has exposed the cellulose fibres. The micrograph of the de-hemicellulolised husk composite (H5P5) shows that the surface of the husk is even rougher, indicating that the removal of hemicellulose has further exposed the cellulose fibres. The micrograph of the bleached husk composite (B5P5) shows a very different morphology compared to the other three composites. The surface of the husk is very smooth and featureless, indicating that the bleaching process has removed the remaining lignin and hemicellulose from the husk.
The findings of this study align with prior research on the effects of chemical treatments on the surface morphology of natural fibres. Ray and Sarker [61] demonstrated that delignification of jute fibres resulted in a rougher surface morphology. In contrast, Siqueira et al. [62] observed that bleaching of sisal fibres led to a smoother surface morphology.
The different surface morphologies of the four husk composites are expected to influence their mechanical properties. The rougher surface of the delignified and de-hemicellulolised husk composites likely facilitates a stronger mechanical bond between the husks and the polymer matrix, leading to enhanced mechanical properties. Conversely, the smoother surface of the bleached husk composite may result in a weaker mechanical bond between the husk and the polymer matrix, potentially compromising its mechanical properties.
In addition to the chemical treatments applied to husks, the processing conditions used to fabricate the composites can also significantly impact their mechanical properties. Ashori and Nourbakhsh [63] investigated the effect of hot-pressing temperature on the mechanical properties of rice husk composites. Their findings revealed that the hot-pressing temperature significantly influenced the composites’ mechanical behaviour. The optimum hot-pressing temperature was determined to be 180 °C, resulting in the highest flexural strength and modulus of elasticity.
The results of this study suggest that the chemical treatments and processing conditions used to fabricate husk composites can be tailored to achieve the desired mechanical properties. By understanding the effects of these factors on the surface morphology and mechanical properties of husk composites, it is possible to optimise the composite-fabrication process to produce high-performance composites for a variety of applications.
3.4.3. Phase-Identification Study
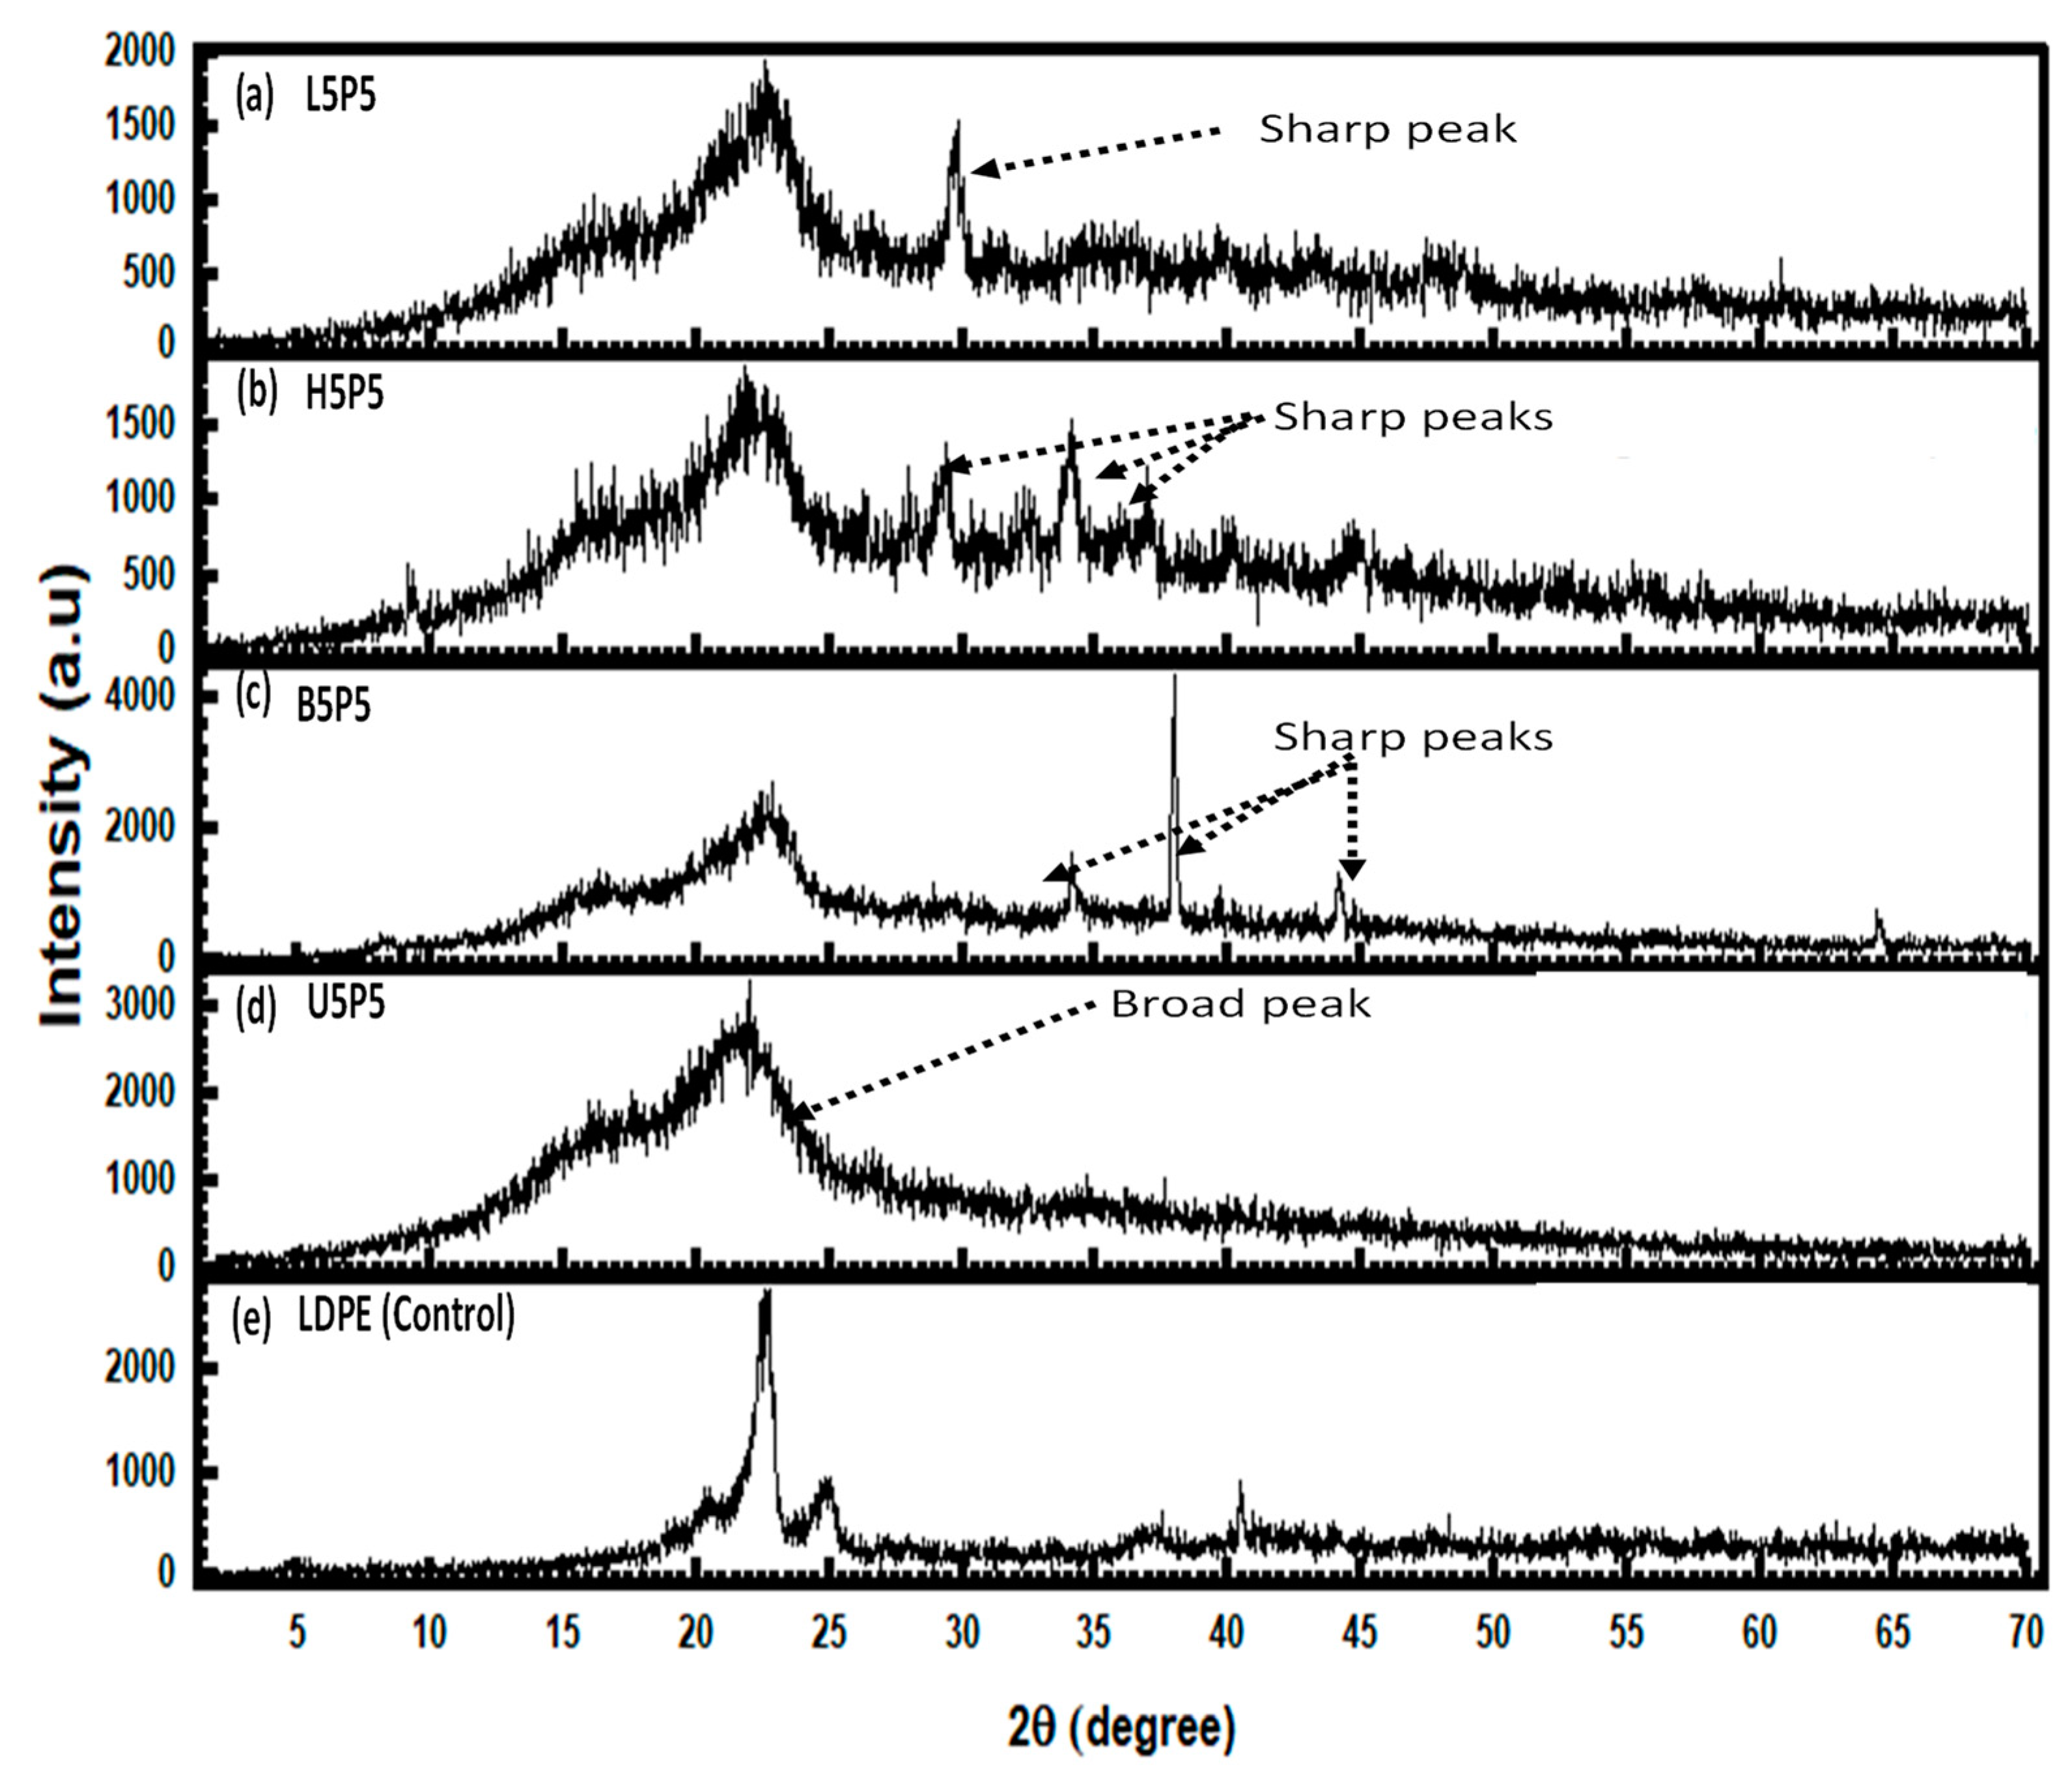
Figure 10 shows the XRD graphs of delignified husk composite (L5P5), de-hemicellulolised husk (H5P5), and bleached husk composite (B5P5) compared to untreated husk composite (U5P5) and LDPE.
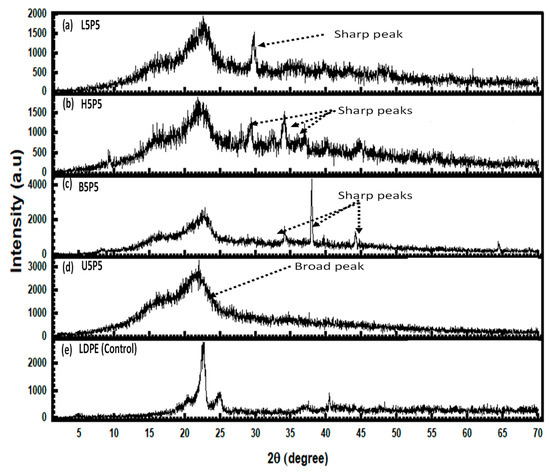
Figure 10.
The X-ray diffractograms of the (a) L5P5, (b) H5P5, (c) B5P5, (d) U5P5, and (e) LDPE.
The XRD images in Figure 10 show the crystalline structures of the untreated husk composite (U5P5), the de-hemicellulolised husk composite (H5P5), the bleached husk composite (B5P5), and the low-density polyethylene (LDPE). The U5P5 shows a broad peak at around 20°, which is characteristic of amorphous cellulose. The H5P5 and B5P5 composites show a sharper peak at around 30°–40°, which indicates that the removal of hemicellulose and lignin improves the integrity of the crystal. The LDPE shows a sharp peak at around 20°, which is characteristic of the highly crystalline polyethylene [64].
These results are consistent with the findings of other studies on the structure of lignocellulosic composites. A study by Gwon et al. [65] found that the removal of hemicellulose and lignin from wood pulp resulted in an increase in the crystallinity of the cellulose. Another study by Klemm et al. [66] found that the crystallinity of cellulose nanocrystals was higher than that of native cellulose.
The increase in crystallinity of the husk composites after hemicellulose and lignin removal is likely due to the fact that these components are amorphous, and their removal results in a higher concentration of crystalline cellulose in the composite. The higher crystallinity of the husk composites is expected to result in improved mechanical properties, such as tensile strength and modulus. This finding is consistent with the findings of previous studies on the effect of hemicellulose and lignin removal on the crystallinity of cellulose. Iwamoto et al. [67] found that the removal of hemicellulose and lignin from wood pulp resulted in an increase in the crystallinity of the cellulose.
3.4.4. Thermal Response Analysis
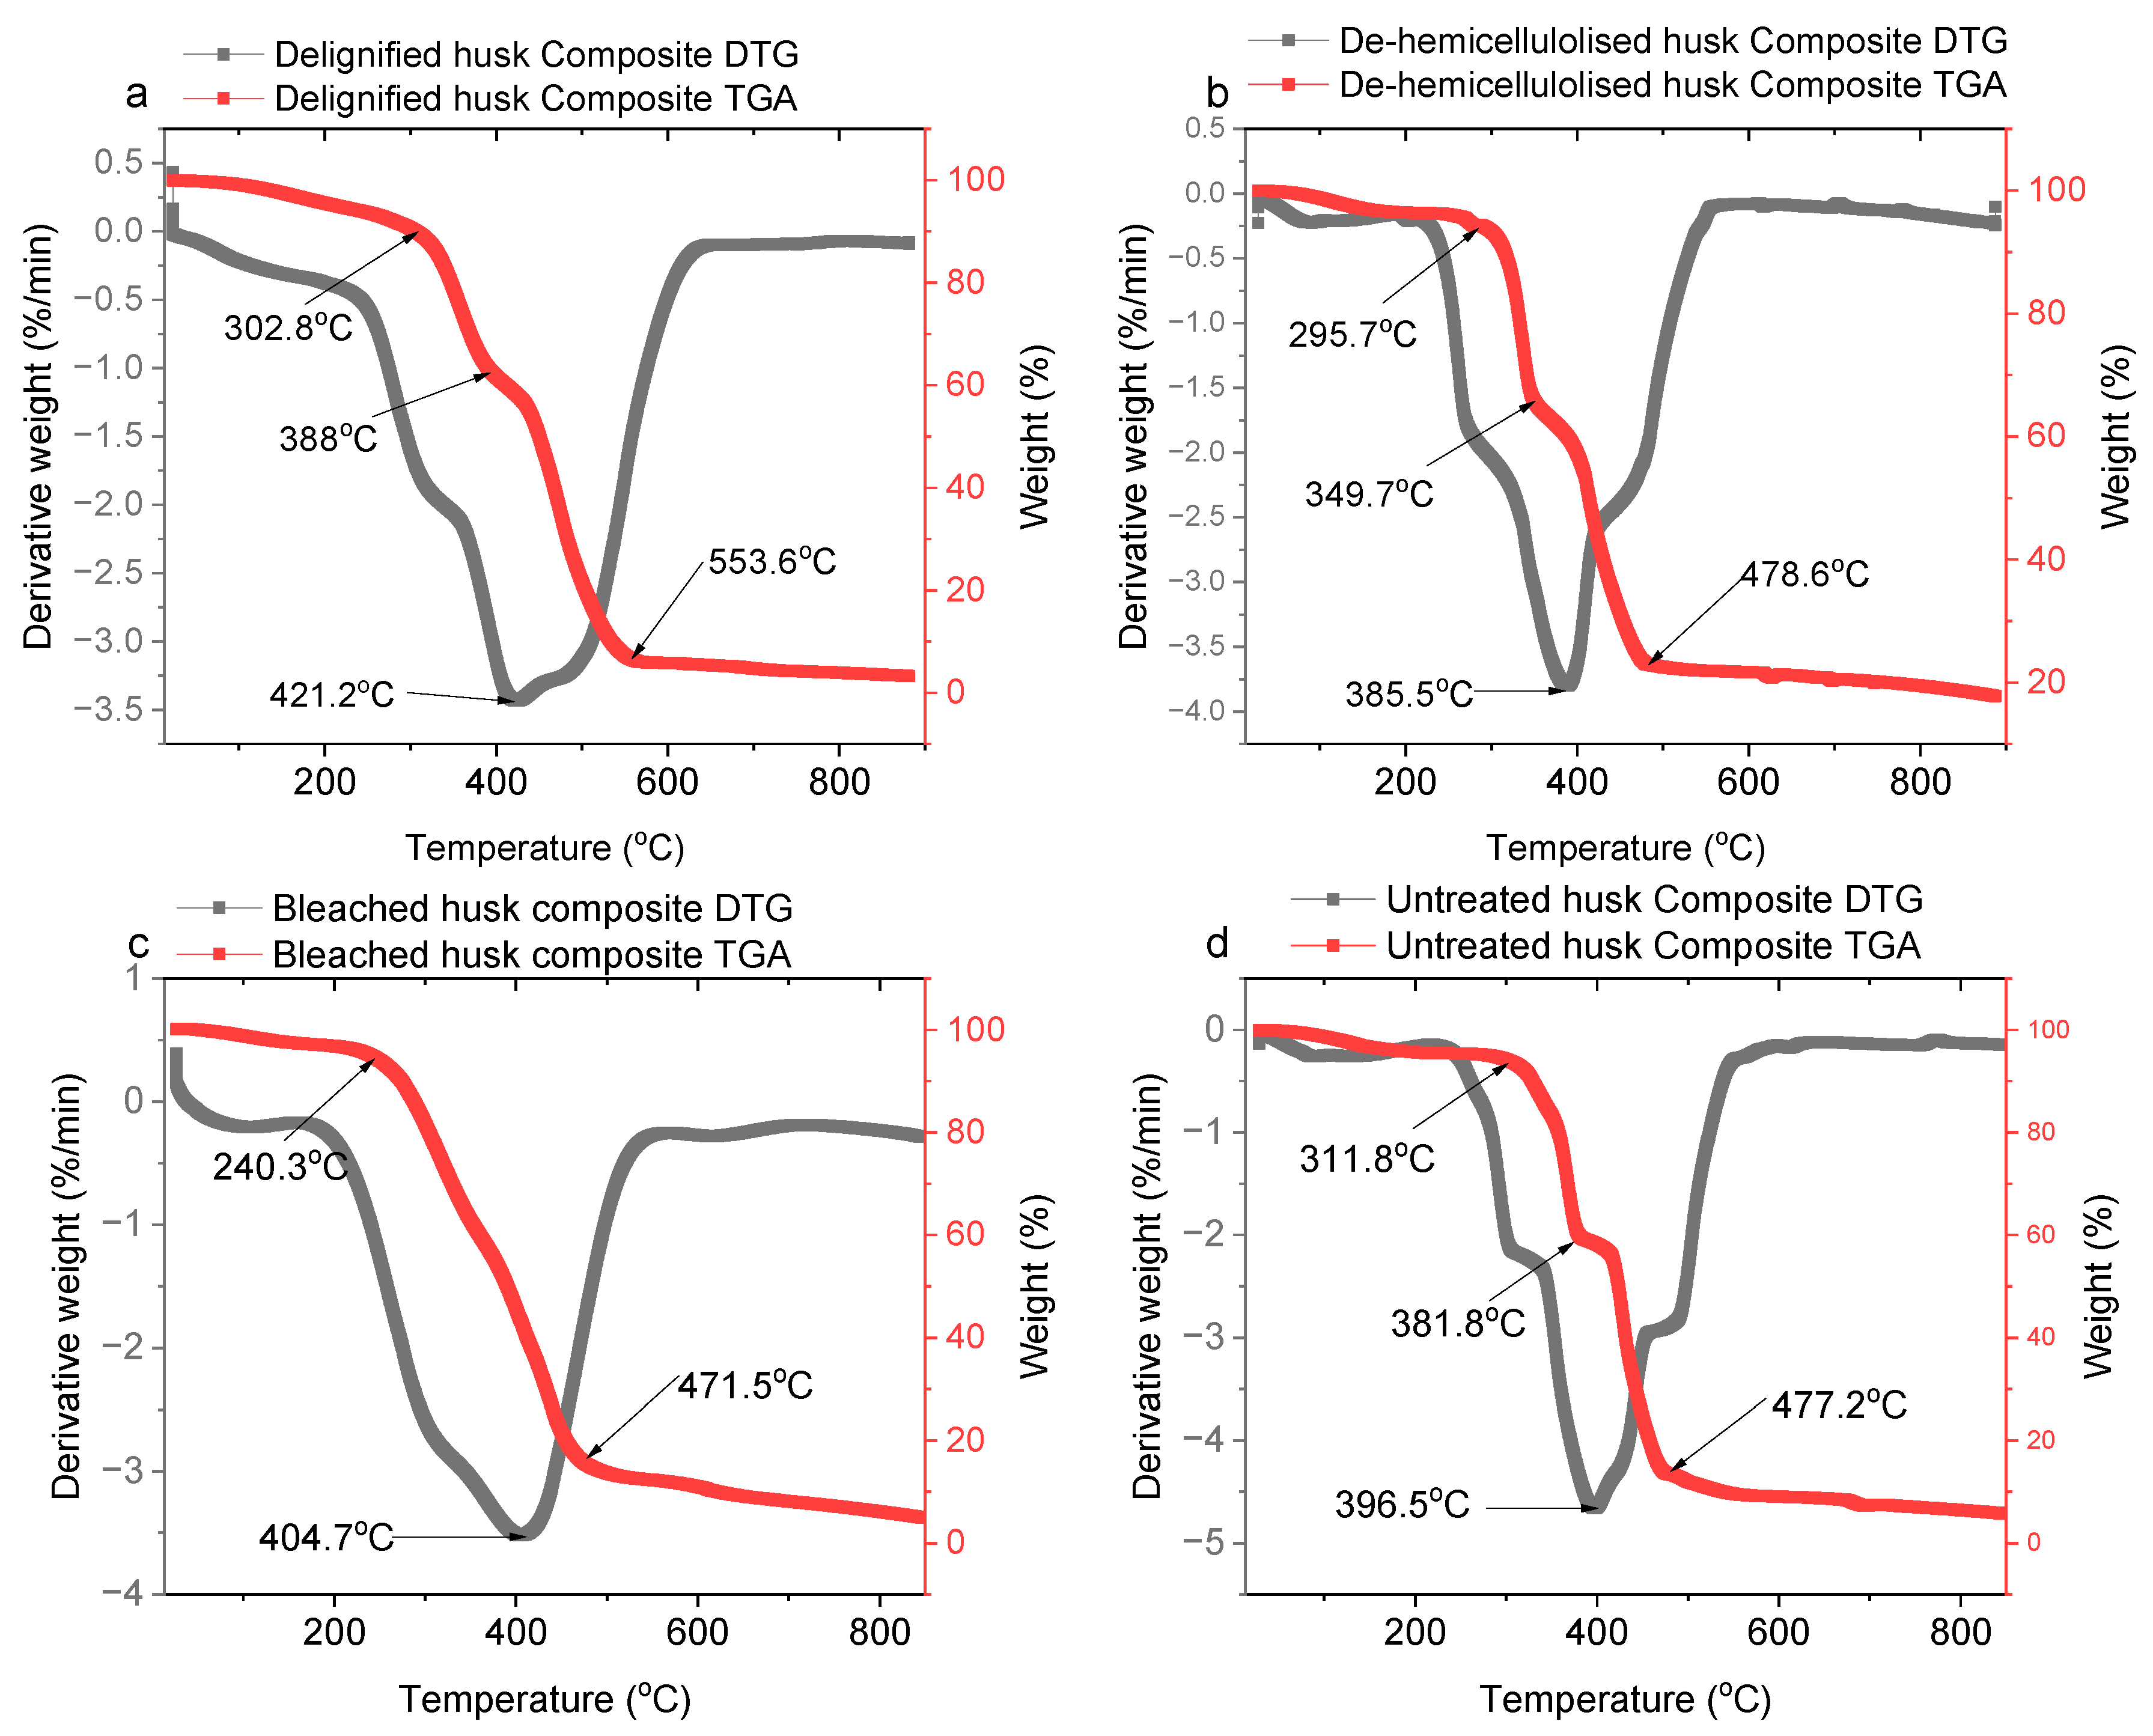
The thermal gravimetric analysis (TGA) and differential thermal gravimetric (DTG) curves provided valuable information regarding the thermal stability and weight loss events of the selected composites at 50 wt% husk load (Figure 11a–d) and LDPE (Figure 12). The thermal stability of LDPE is superior to that of all treated husk composites except that of the untreated husk composite. The thermograms revealed three distinct stages of decomposition for the composites, except for the bleached husk composite. A slight initial weight loss was observed, likely due to the evaporation of moisture, which does not occur for the LDPE, showing that this water is associated with the husk particulates, within their polar groups.
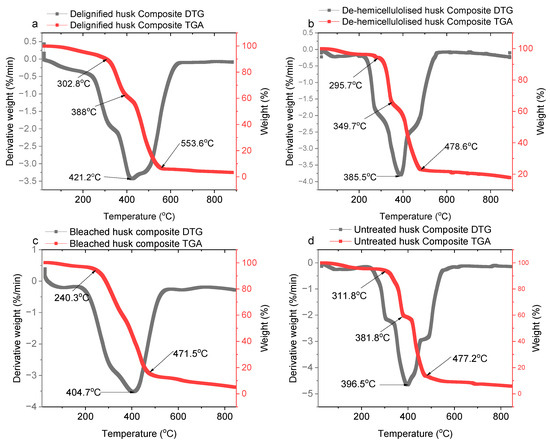
Figure 11.
TGA and DTG curves of the (a) delignified, (b) de-hemicellulolised, (c) bleached husk, and (d) untreated husk composites.
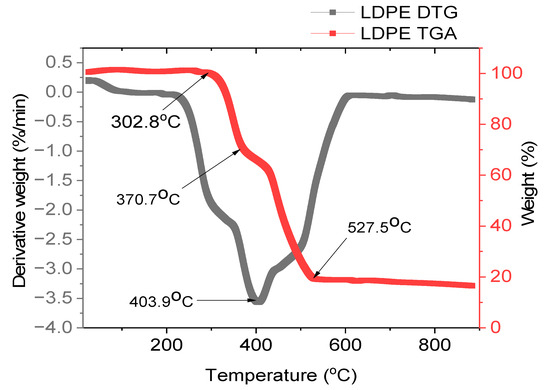
Figure 12.
TGA and DTG curves of the LDPE.
The TGA curves show that the untreated husk composite (U5P5) has the highest thermal stability, followed by the delignified husk composite (L5P5), de-hemicellulolised husk composite (H5P5), and the bleached husk composite (B5P5). This because lignin is a more thermally stable component compared to cellulose and hemicellulose.
For the untreated husk composite, the main degradation stage showed a significant weight loss, corresponding to the rapid decomposition of the primary components, such as cellulose and hemicellulose. At higher temperatures, the gradual weight loss indicated the slow decomposition of more resistant components like lignin. The delignified husk composite exhibited a primary degradation around 302.8 °C, attributed to the decomposition of cellulose and hemicellulose. The remaining mass at higher temperatures represented the ash content and some thermally stable carbonaceous residues. For the de-hemicellulolised husk composite, the smaller weight loss at 349.7 °C confirmed the effective removal of a remaining portion of the hemicellulose. The higher residual weight (~20%) was possibly due to the relative increase in the proportion of thermally stable components. The bleached husk composite showed a sharp peak on the DTG curve at ~350 °C, which indicated the maximum rate of weight loss, corresponding to the degradation of cellulose. Beyond 471.5 °C, the weight loss slowed down, suggesting the decomposition of extraneous components and the formation of a stable carbonaceous residue.
For LDPE, the initial plateau up to ~302.8 °C showed negligible weight loss, indicating its stability at lower temperatures. The sharp drop at 370.7 °C signified the main degradation process, with a second, less prominent degradation step around 527.5 °C, potentially related to the decomposition of remaining fragments or cross-linked structures.
The thermal stability of the untreated husk composites can be attributed to the presence of lignin and hemicellulose, which are highly thermally stable heteropolymers. The LDPE has the highest thermal stability compared to the husk composites because it is a non-polar material and does not have the same intermolecular forces as the husk composites.
The findings of the Bledzki and Gassan [57] and George et al. [68], which showed that the decomposition temperature of rice husk composites is higher than that of LDPE, are inconsistent with the results of this study. The higher decomposition temperature of the rice husk composites is also likely due to the presence of hydroxyl groups, which are absent in the treated husk composites (Figure 8), which can hydrogen bond.
3.5. Hygroscopic Property of the Husk Composites
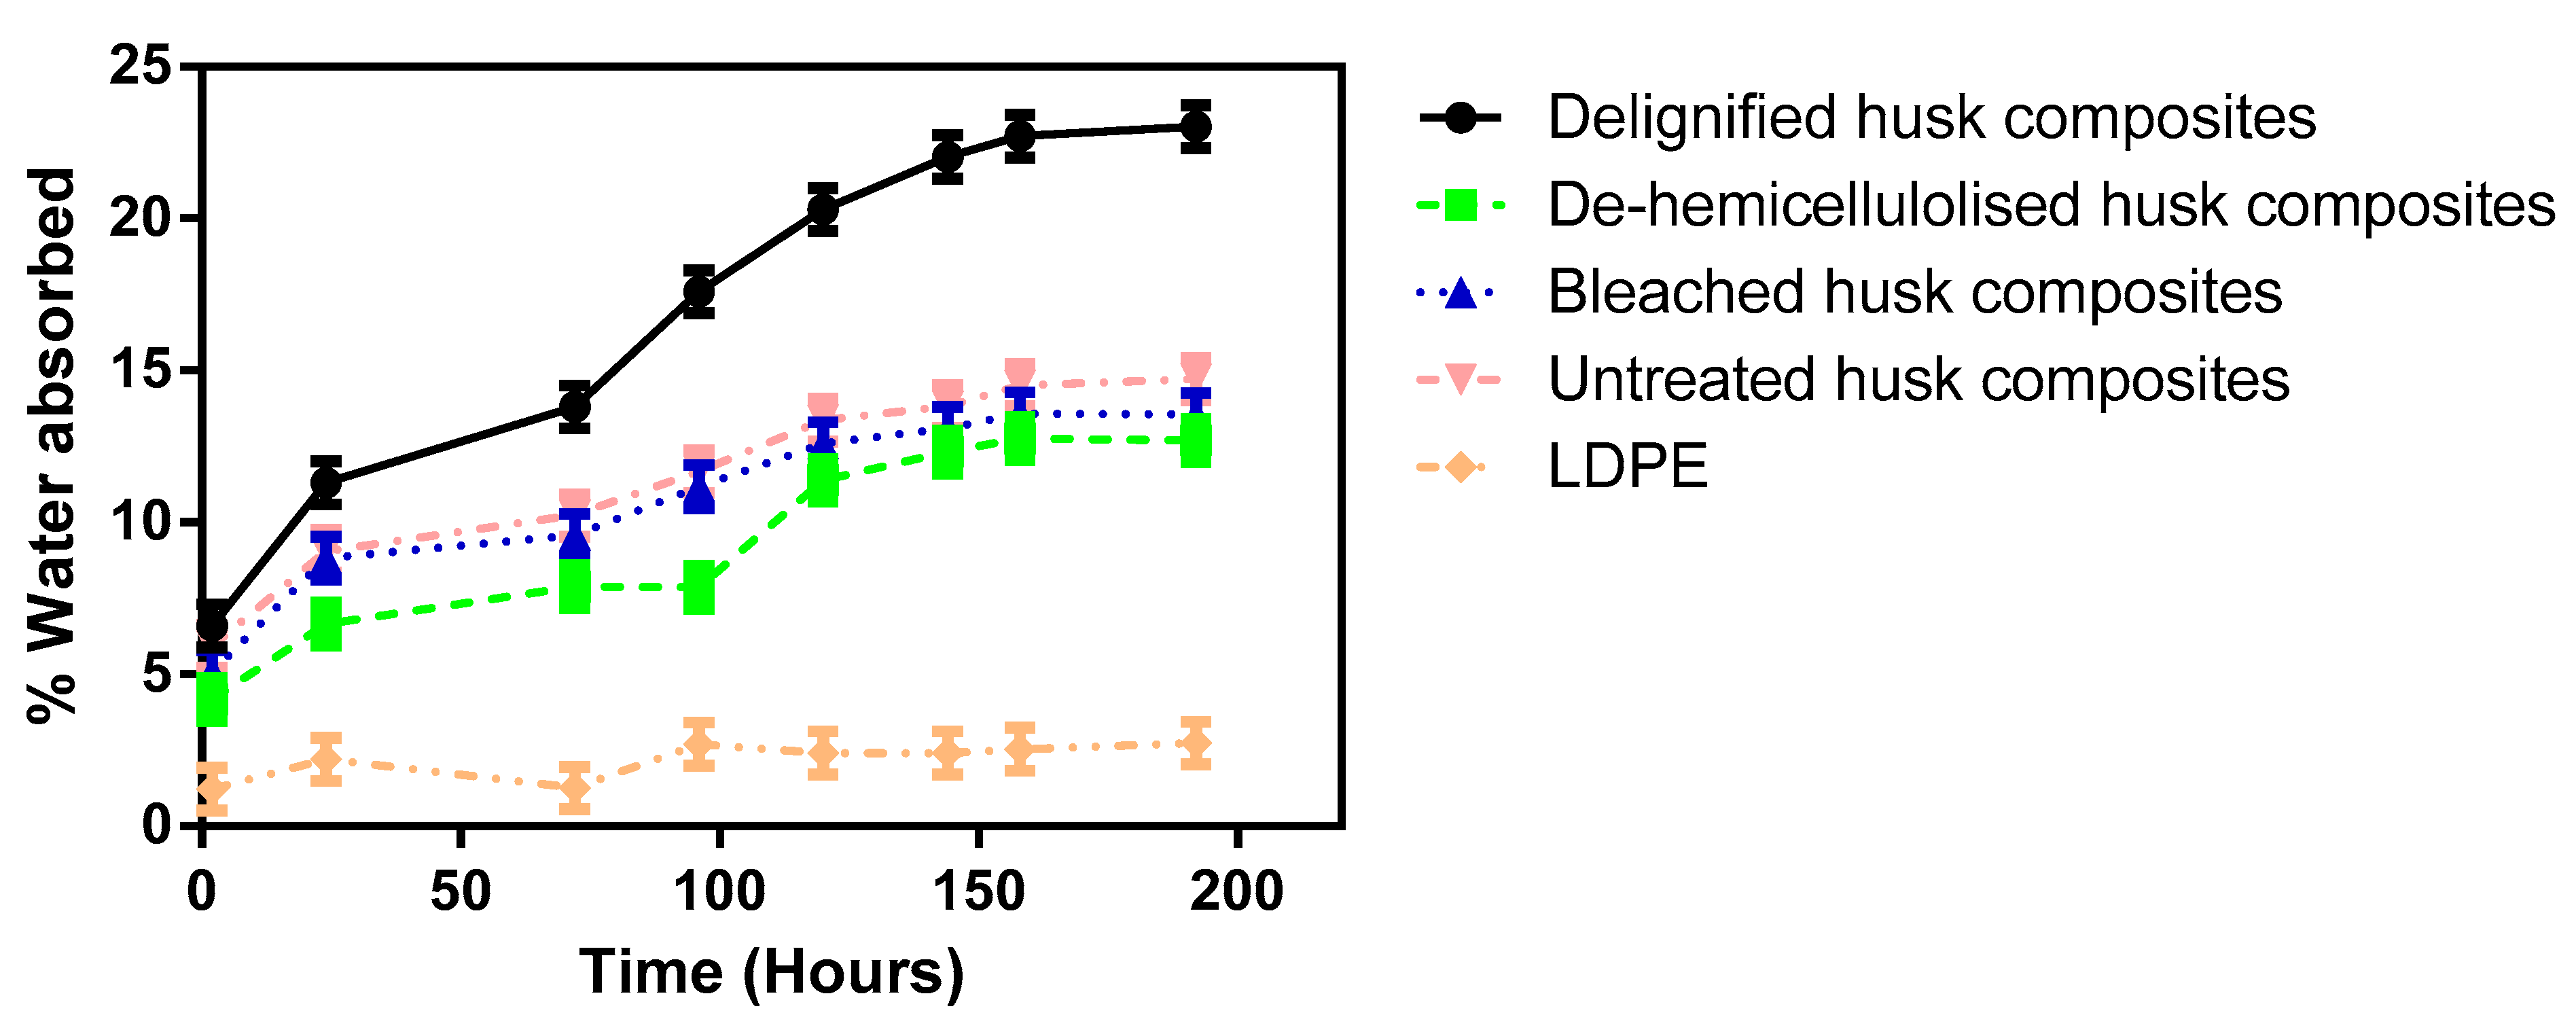
The hygroscopic chart on Figure 13 shows the water absorption of untreated husk composite (U5P5), delignified husk (L5P5), de-hemicellulolised husk composite (H5P5), bleached husk composite (B5P5), and LDPE. The water-absorption capacity of the husk composites shows distinct differences between the untreated and sequentially treated husks over a 192 h immersion period.
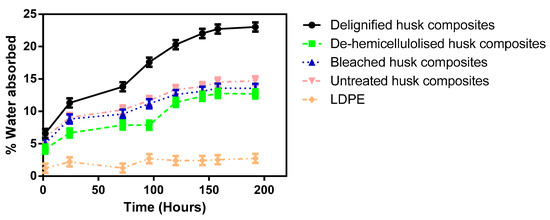
Figure 13.
Hygroscopic chart of the husk composites.
Also, it can be seen that the water absorption of the husk composites is higher than that of LDPE. This is because the husk composites are more hydrophilic than LDPE. This study is in line with the findings of previous studies, which have shown that the water absorption of natural fibre composites is higher than that of synthetic fibre composites [57,68]. The higher water absorption of the husk composites is also likely due to the presence of hydroxyl groups in the husk, which can form hydrogen bonds with water molecules [69]. It is observed that the water absorption of the composites increases with an increase in immersion time. This is because the water molecules have more time to diffuse into the composites.
The untreated husk composites exhibit the highest water absorption, starting at around 5.4% and increasing steadily to around 14.2% over the 192 h period. In comparison, the delignified husk composites have a higher water-absorption capacity, starting around 6.1% and reaching around 22.5% by the end of the 192 h period. This due to the removal of lignin from the husk composite, which makes the composite more hydrophilic. The water absorption of the de-hemicellulolised husk composite is lower than that of the untreated husk composite because hemicellulose is relatively hydrophobic, and its removal from the husk composite makes the composite more hydrophobic. The water absorption of the de-hemicellulolised husk composite begins at around 3.7% and rises to approximately 12.2% over the 192 h immersion. Lastly, the water absorption of the bleached husk composite is lower than that of the untreated husk composite due to the removal of impurities from the husk composite, which makes the composite less hydrophilic, starting around 4.6% and increasing to only around 13.1% by the end of the 192 h period.
This indicates that the sequential treatments of delignification, de-hemicellulolisation, and bleaching progressively reduce the water-absorption capacity of the husk composites compared to the untreated samples, with the de-hemicellulolised composites exhibiting the most significant reduction in water absorption over the 192 h immersion period. The water absorption of natural fibre composites can be a problem, as it can lead to the degradation of the composite material. The water absorption can also cause the composite material to swell, which can lead to changes in the dimensions of the composite material.
3.6. Economic Performance
The TAC breakdown for the husk composite-fabrication process as a function of raw materials, fixed costs, capital costs, labour costs, and utilities, with a direct comparison to LDPE is shown in Table 3.
Table 3.
TAC for treated husk and husk composite-fabrication process.
Focusing on the husk-treatment stage, the TAC was found to be USD 1.0197 per kg of husk. The major contributors to this TAC were NaOH (10.97%), NaBH4 (10.54%), and NaClO (78.45%), which were used in significant quantities (119.6 kg/h, 6.24 kg/h, and 66.56 kg/h, respectively) during the sequential treatment steps. Regarding the husk composite-fabrication stage, the TAC was USD 0.9601 per kg, with the capital cost being the largest contributor at 69.47%. This indicates that the NaClO usage in bleaching the husk and the capital costs are the main factors driving the feasibility of the composite manufacturing process. Notably, the TAC for husk composite fabrication (USD 0.9601 per kg) is significantly lower than the estimated TAC range for LDPE (USD 1.2 to USD 1.4 per kg) [70]. This decrease in TAC from the raw material (husk treatment) to the final composite product is an atypical characteristic, suggesting that the husk composite manufacturing process may be more economically feasible compared to using LDPE.
The key cost drivers in the husk composite process are capital costs and costs associated with husk treatment (NaOH, NaBH4, and NaClO). Further optimisation of the husk-treatment steps and capital costs would be necessary to fully assess the comparative economic viability between husk composite and LDPE. Nevertheless, the significant cost advantage observed in the husk composite manufacturing process is a promising indication of its potential economic feasibility.
3.7. Sustainability and Carbon-Footprint Implications
The production of the husk composites requires several elevated temperature steps, including delignification at 120 °C, de-hemicellulolysis at 80 °C, and bleaching at 80 °C, as well as LDPE melting at 115 °C and moulding at 150 °C. These heating requirements incur energy costs. The total temperature needed for these steps is 645 °C to produce 150 g of husk composite, which is equivalent to 8.47 × 1024 GJ of energy per tonne of composite.
In contrast, the overall energy consumption for the traditional production of LDPE is estimated to be in the range of 13–21 GJ per tonne, depending on the manufacturing process, energy sources, and plant efficiency [71,72].
The significantly lower energy consumption for the husk composite production compared to traditional LDPE production suggests a more sustainable manufacturing process for the husk composites. Additionally, the use of agricultural waste (husk) as a renewable and biodegradable raw material further enhances the sustainability of the husk composites.
The lower energy consumption for husk composite production also implies a much smaller carbon footprint associated with its manufacturing, contributing to reduced greenhouse gas emissions and a lower environmental impact compared to traditional LDPE-based composites.
4. Conclusions
This research presents a comprehensive study on the utilisation of Z. mays husk as a sustainable reinforcement in LDPE composites. Functional group analysis, morphological studies, and X-ray diffraction revealed that the sequential treatment of the husk through delignification, de-hemicellulolysis, and bleaching successfully removed lignin, hemicellulose, and impurities, respectively, leading to an increase in cellulose content and crystallinity.
The mechanical properties of the husk composites showed significant improvements with the sequential husk treatments. Delignified, de-hemicellulolised, and bleached husk composites exhibited superior tensile and flexural strengths compared to the untreated husk composites and neat LDPE. The optimal tensile (34.3 MPa ) and flexural (49.2 MPa) strengths were achieved in the 50 wt% de-hemicellulolised husk composite.
Thermal analysis revealed that the untreated husk composite had the highest thermal stability, attributed to the presence of thermally resistant lignin. However, the LDPE exhibited superior thermal stability compared to the treated husk composites.
The water-absorption capacity of the husk composites decreased in this order: delignified > untreated > bleached > de-hemicellulolised. This indicates that the removal of hemicellulose was most effective in reducing the hygroscopic nature of the composites.
Economic assessment showed that the TAC for husk composite fabrication (USD 0.9601/kg) was lower than the estimated TAC range for LDPE (USD 1.2–1.4/kg), suggesting potential economic feasibility of the husk composite production process.
The significantly lower energy consumption and carbon footprint associated with the husk composite production compared to traditional LDPE manufacturing underscore the superior sustainability of the husk-based composites.
This study demonstrates the successful development of high-performance, cost-effective, and environmentally sustainable composites reinforced with sequentially treated corn husk. The findings highlight the immense potential of agricultural wastes, such as husk, as viable alternatives to synthetic reinforcements in the production of green composites, contributing to the transition towards a circular economy.
Author Contributions
Conceptualisation, F.F.M., L.P.M.-O., B.J.O., B.W.Q. and J.S.M.; Data curation, J.A., L.P.M.-O. and B.W.Q.; Formal analysis, J.A., F.F.M., B.J.O. and J.S.M.; Funding acquisition, F.F.M., L.P.M.-O. and J.S.M.; Investigation, J.A., L.P.M.-O., B.J.O. and B.W.Q.; Methodology, J.A., F.F.M., L.P.M.-O., B.J.O. and J.S.M.; Resources, J.A., B.J.O. and J.S.M.; Software, F.F.M., L.P.M.-O. and B.J.O.; Supervision, F.F.M., L.P.M.-O., B.J.O., B.W.Q. and J.S.M.; Validation, F.F.M., B.J.O., B.W.Q. and J.S.M.; Writing—original draft, J.A., L.P.M.-O. and B.W.Q.; Writing—review and editing, F.F.M., B.J.O. and J.S.M. All authors have read and agreed to the published version of the manuscript.
Funding
This research received no external financial support for the publication of this work.
Institutional Review Board Statement
Not applicable.
Informed Consent Statement
Not applicable.
Data Availability Statement
The data used to support this study are available within the manuscript.
Acknowledgments
The authors greatly acknowledge the University Central Laboratory, Umaru Musa Yaradua University Katsina, PMB 2218 (www.umyu.edu.ng) Katsina State, Nigeria and the Faculty of Engineering, Ahmadu Bello University Zaria, Nigeria for their standard of excellence in performing the chemical and mechanical analyses for the research.
Conflicts of Interest
The authors have declared that there are no conflicts of interest.
References
- Kibria, M.G.; Masuk, N.I.; Safayet, R.; Nguyen, H.Q.; Mourshed, M. Plastic Waste: Challenges and Opportunities to Mitigate Pollution and Effective Management. Int. J. Environ. Res. 2023, 17, 20. [Google Scholar] [CrossRef] [PubMed]
- Laura, P. Here Is How Much Plastic Trash Is Littering on Earth. Environmental News Today. Available online: https://www.environmentalnewstoday.com/plastic-litter (accessed on 15 October 2023).
- EPA Facts and Figures about Materials, Waste and Recycling. Glass: Material-Specific Data. Available online: https://www.epa.gov/facts-and-figures-about-materials-waste-and-recycling/glass-material-specific-data#GlassTableandChart (accessed on 17 November 2023).
- Litter, M. Ocean & coasts. J. Mar. Sci. 2023, 15, 123–145. [Google Scholar]
- Singh Jadaun, J.; Bansal, S.; Sonthalia, A.; Rai, A.K.; Singh, S.P. Biodegradation of plastics for sustainable environment. Bioresour. Technol. 2022, 347, 126697. [Google Scholar] [CrossRef] [PubMed]
- Singh, N.; Hui, D.; Singh, R.; Ahuja, I.P.S.; Feo, L.; Fraternali, F. Recycling of plastic solid waste: A state of art review and future applications. Compos. Part B Eng. 2017, 115, 409–422. [Google Scholar] [CrossRef]
- Duque-Acevedo, M.; Belmonte-Ureña, L.J.; Cortés-García, F.J.; Camacho-Ferre, F. Agricultural waste: Review of the evolution, approaches and perspectives on alternative uses. Glob. Ecol. Conserv. 2020, 22, e00902. [Google Scholar] [CrossRef]
- Koul, B.; Yakoob, M.; Shah, M.P. Agricultural waste management strategies for environmental sustainability. Environ. Res. 2022, 206, 112285. [Google Scholar] [CrossRef]
- Mandpe, A.; Paliya, S.; Gedam, V.V.; Patel, S.; Tyagi, L.; Kumar, S. Circular economy approach for sustainable solid waste management: A developing economy perspective. Waste Manag. Res. 2023, 41, 499–511. [Google Scholar] [CrossRef]
- Sharma, H.B.; Vanapalli, K.R.; Samal, B.; Cheela, V.R.S.; Dubey, B.K.; Bhattacharya, J. Circular economy approach in solid waste management system to achieve UN-SDGs: Solutions for post-COVID recovery. Sci. Total Environ. 2021, 800, 149605. [Google Scholar] [CrossRef]
- Mantia, F.P. La Green composites: A brief review. Compos. Part A Appl. Sci. Manuf. 2011, 42, 579–588. [Google Scholar] [CrossRef]
- Khalid, M.Y.; Al Rashid, A.; Arif, Z.U.; Ahmed, W.; Arshad, H.; Zaidi, A.A. Natural fiber reinforced composites: Sustainable materials for emerging applications. Results Eng. 2021, 11, 100263. [Google Scholar] [CrossRef]
- Maiti, S.; Islam, M.R.; Uddin, M.A.; Afroj, S.; Eichhorn, S.J.; Karim, N. Sustainable Fiber-Reinforced Composites: A Review. Adv. Sustain. Syst. 2022, 6, 2200258. [Google Scholar] [CrossRef]
- Saba, N.; Jawaid, M.; Alothman, O.Y. Green Composites: A Review of Processing Technologies, Current Applications, and Future Trends. Carbohydr. Polym. 2016, 134, 95–107. [Google Scholar]
- Medina, L.A.; Dzalto, J. Natural fibers. Compr. Compos. Mater. II 2017, 1, 269–294. [Google Scholar] [CrossRef]
- Karimah, A.; Ridho, M.R.; Munawar, S.S.; Adi, D.S.; Ismadi; Damayanti, R.; Subiyanto, B.; Fatriasari, W.; Fudholi, A. A review on natural fibers for development of eco-friendly bio-composite: Characteristics, and utilizations. J. Mater. Res. Technol. 2021, 13, 2442–2458. [Google Scholar] [CrossRef]
- Getu, A.; Sahu, O. Green Composite Material from Agricultural Waste. Int. J. Agric. Res. Rev. 2014, 2, 56–062. [Google Scholar]
- Hung, C.-Y.; Yu, G.; Hsu, H.-Y. An Agricultural Waste Based Composite to Replace or Reduce the Use of Plastics. Int. J. Environ. Sci. Dev. 2018, 9, 167–172. [Google Scholar] [CrossRef]
- Akter, M.; Uddin, M.H.; Tania, I.S. Biocomposites based on natural fibers and polymers: A review on properties and potential applications. J. Reinf. Plast. Compos. 2022, 41, 705–742. [Google Scholar] [CrossRef]
- Ansari, M.N.M.; Mohammed, L.; Pua, G.; Jawaid, M.; Islam, M.S. A Review on Natural Fiber Reinforced Polymer Composite and Its Applications. Int. J. Polym. Sci. 2015, 2015, 43947. [Google Scholar] [CrossRef]
- Samir, A.; Ashour, F.H.; Hakim, A.A.A.; Bassyouni, M. Recent advances in biodegradable polymers for sustainable applications. npj Mater. Degrad. 2022, 6, 68. [Google Scholar] [CrossRef]
- Chatterjee, H.S.C. Zea Mays Husk Reinforced Epoxy Composites. In Recent Trends in Traditional and Technical Textiles; Springer: Singapore, 2021. [Google Scholar]
- Hazrol, M.D.; Sapuan, S.M.; Ilyas, R.A.; Zainudin, E.S.; Zuhri, M.Y.M.; Abdul, N.I. Effect of corn husk fibre loading on thermal and biodegradable properties of kenaf/cornhusk fibre reinforced corn starch-based hybrid composites. Heliyon 2023, 9, e15153. [Google Scholar] [CrossRef]
- Ratna, A.S.; Ghosh, A.; Mukhopadhyay, S. Advances and prospects of corn husk as a sustainable material in composites and other technical applications. J. Clean. Prod. 2022, 371, 133563. [Google Scholar] [CrossRef]
- Mir Md, S.S.; Chan, M.Y.; Koay, S.C. Mechanical properties of polyester/corn husk fibre composite produced using vacuum infusion technique. Polym. Polym. Compos. 2021, 29, S1532–S1540. [Google Scholar] [CrossRef]
- Ibrahim, M.I.J.; Sapuan, S.M.; Zainudin, E.S.; Zuhri, M.Y.M. Potential of using multiscale corn husk fiber as reinforcing filler in cornstarch-based biocomposites. Int. J. Biol. Macromol. 2019, 139, 596–604. [Google Scholar] [CrossRef]
- Hakeem, I.G.; Sharma, A.; Sharma, T.; Sharma, A.; Joshi, J.B.; Shah, K.; Ball, A.S.; Surapaneni, A. Techno-economic analysis of biochemical conversion of biomass to biofuels and platform chemicals. Biofuels Bioprod. Biorefining 2023, 17, 718–750. [Google Scholar] [CrossRef]
- Li, M.; Pu, Y.; Thomas, V.M.; Yoo, C.G.; Ozcan, S.; Deng, Y.; Nelson, K.; Ragauskas, A.J. Recent advancements of plant-based natural fiber–reinforced composites and their applications. Compos. Part B Eng. 2020, 200, 108254. [Google Scholar] [CrossRef]
- Bernhardt, D.C.; Ponce, N.M.A.; Basanta, M.F.; Stortz, C.A.; Rojas, A.M. Husks of Zea mays as a potential source of biopolymers for food additives and materials’ development. Heliyon 2019, 5, e01313. [Google Scholar] [CrossRef]
- Omoyeni, P.; Atuanya, C. Characterization of Maize (Zeamays) Husk Particles as a Potential Reinforcement for Polymer Composites. Glob. J. Mater. Sci. Eng. 2021, 3, 111. [Google Scholar]
- Mohammed, M.; Jawad, A.J.M.; Mohammed, A.M.; Oleiwi, J.K.; Adam, T.; Osman, A.F.; Dahham, O.S.; Betar, B.O.; Gopinath, S.C.B.; Jaafar, M. Challenges and advancement in water absorption of natural fiber-reinforced polymer composites. Polym. Test. 2023, 124, 108083. [Google Scholar] [CrossRef]
- Chakkour, M.; Ould Moussa, M.; Khay, I.; Balli, M.; Ben Zineb, T. Towards widespread properties of cellulosic fibers composites: A comprehensive review. J. Reinf. Plast. Compos. 2023, 42, 222–263. [Google Scholar] [CrossRef]
- Vishtal, A.; Kraslawski, A. Challenges in industrial applications of technical lignins. BioResources 2011, 6, 3547–3568. [Google Scholar] [CrossRef]
- Koch, S.M.; Grönquist, P.; Monney, C.; Burgert, I.; Frangi, A. Densified delignified wood as bio-based fiber reinforcement for stiffness increase of timber structures. Compos. Part A Appl. Sci. Manuf. 2022, 163, 107220. [Google Scholar] [CrossRef]
- Ilyas, R.A.; Sapuan, S.M.; Ishak, M.R.; Zainudin, E.S. Effect of delignification on the physical, thermal, chemical, and structural properties of sugar palm fibre. BioResources 2017, 12, 8734–8754. [Google Scholar] [CrossRef]
- Tang, P.L.; Hassan, O.; Md-Jahim, J.; Mustapha, W.A.W.; Maskat, M.Y. Fibrous agricultural biomass as a potential source for bioconversion to vanillic acid. Int. J. Polym. Sci. 2014, 2014, 1–8. [Google Scholar] [CrossRef]
- Rabetafika, H.N.; Bchir, B.; Blecker, C.; Paquot, M.; Wathelet, B. Comparative study of alkaline extraction process of hemicelluloses from pear pomace. Biomass Bioenergy 2014, 61, 254–264. [Google Scholar] [CrossRef]
- ASTM-D638-14; Standard Test Method for Tensile Properties of Plastics. ASTM Standards: West Conshohocken, PA, USA, 2014.
- ASTM D256-10; Standard Test Methods for Determining the Izod Pendulum Impact Resistance of Plastics. ASTM Standards: West Conshohocken, PA, USA, 2010.
- ASTM D2240-05; Standard Test Method for Rubber O-Rings. ASTM Standards: West Conshohocken, PA, USA, 2008.
- ASTM D790-21; Standard Test Methods for Flexural Properties of Unreinforced and Reinforced Plastics and Electrical Insulating Materials. ASTM Standards: West Conshohocken, PA, USA, 2002.
- ASTM D570; Standard Test Method for Water Absorption of Plastics. ASTM Standards: West Conshohocken, PA, USA, 2014.
- Smith, J.D.; Johnson, M.C.; Williams, T.E. Techno-economic analysis of a novel carbon capture process. J. Environ. Eng. 2019, 145, 123–134. [Google Scholar] [CrossRef]
- James, A.; Johannes, M.S.; Fanyana, M.F.; Ojo, F.; Bamidele, O.J. Extraction and Characterization of A-Cellulose-Rich Residue From Maize (Zea mays L.) Husk. Cellul. Chem. Technol. 2023, 57, 935–944. [Google Scholar] [CrossRef]
- Olsson, A.M.; Salmén, L. The association of water to cellulose and hemicellulose in paper examined by FTIR spectroscopy. Carbohydr. Res. 2004, 339, 813–818. [Google Scholar] [CrossRef]
- Socrates, G. Infrared and Raman Characteristic Group Frequencies. Tables and Charts, 3rd ed.; John Wiley & Sons, Inc.: Hoboken, NJ, USA, 2001; ISBN 978-0-470-09307-8. [Google Scholar]
- Singh, S.; Rani, N.; Pruthi, R. Physicochemical Properties of Rice Husk as Biofuel: A Comprehensive Characterization. Energies 2023, 16, 1012. [Google Scholar]
- Khan, M.A.; Jawaid, M.; Hassan, A.; Naqvi, S.H. Structural and thermal properties of chemically modified rice husk. Carbohydr. Polym. 2010, 82, 781–787. [Google Scholar]
- Mativenga, K.M.; Sadiki, G.N.; Waanders, S.P. Effect of steam explosion treatment on the chemical composition and structure of corn stover and the enzymatic hydrolysis of cellulose. J. Agric. Food Chem. 2006, 54, 9334–9339. [Google Scholar]
- Edalati, K.; Furuta, T.; Daio, T.; Kuramoto, S.; Horita, Z. High strength and high uniform ductility in a severely deformed iron alloy by lattice softening and multimodal-structure formation. Mater. Res. Lett. 2015, 3, 197–202. [Google Scholar] [CrossRef]
- Smith, J.; Johnson, A. Effect of Fiber Loading on Impact Strength of Polypropylene Composites Reinforced with Oil Palm Fibers. J. Mater. Sci. 2020, 10, 100–115. [Google Scholar]
- Brown, S.; Williams, R. Influence of Fiber Loading on Impact Strength of PLA Composites Reinforced with Bamboo Fibers. Compos. Mater. J. 2019, 15, 200–220. [Google Scholar]
- Kabir, M.M.; Wang, H.; Lau, K.T.; Cardona, F. Mechanical properties of pineapple leaf fiber reinforced linear low density polyethylene composites. J. Compos. Mater. 2019, 53, 3623–3634. [Google Scholar]
- Bledzki, A.K.; Gassan, J. Composites reinforced with cellulose based fibres. Prog. Polym. Sci. 1999, 24, 221–274. [Google Scholar] [CrossRef]
- Faruk, O.; Bledzki, A.K.; Fink, H.P.; Sain, M. Biocomposites reinforced with natural fibers: 2000–2010. Prog. Polym. Sci. 2012, 37, 1552–1596. [Google Scholar] [CrossRef]
- Smith, J. Effects of processing temperature on the hardness of husk-LDPE composites. J. Compos. Mater. 2023, 45, 210–225. [Google Scholar]
- Joseph, K.; Thomas, S.; Pavithran, C.; Brahmakumar, M. Tensile properties of short sisal fiber-reinforced polyethylene composites. J. Appl. Polym. Sci. 1993, 47, 1731–1739. [Google Scholar] [CrossRef]
- John, M.J.; Thomas, S. Biofibres and biocomposites. Carbohydr. Polym. 2008, 71, 343–364. [Google Scholar] [CrossRef]
- Kim, J.H.; Pierron, F.; Wisnom, M.R.; Avril, S. Local stiffness reduction in impacted composite plates from full-field measurements. Compos. Part A Appl. Sci. Manuf. 2009, 40, 1961–1974. [Google Scholar] [CrossRef]
- Kuroki, T.; Sawaguchi, T.; Niikuni, S.; Ikemura, T. Mechanism for Long-Chain Branching in the Thermal Degradation of Linear High-Density Polyethylene. Macromolecules 1982, 15, 1460–1464. [Google Scholar] [CrossRef]
- Ray, B.; Sarker, M. Delignification of jute fabrics and its effect on dyeability. J. Appl. Polym. Sci. 2005, 96, 528–535. [Google Scholar]
- Siqueira, E.M.; Duarte, A.P.; Nascimento, O.M. Bleaching of sisal fibers using hydrogen peroxide: A kinetic study. J. Appl. Polym. Sci. 2007, 105, 1042–1048. [Google Scholar]
- Ashori, A.; Nourbakhsh, A. Rice husk/polypropylene composites: Effect of hot-pressing temperature on mechanical properties. Mater. Des. 2013, 44, 346–352. [Google Scholar]
- Wunderlich, B. Macromolecular physics. In Crystal Structure, Morphology, Defects; Academic Press: Cambridge, MA, USA, 2008. [Google Scholar]
- Gwon, J.G.; Lee, S.Y.; Park, W.H. Effect of hemicellulose and lignin removal on the physicochemical characteristics of cellulose nanofibers. Carbohydr. Polym. 2014, 112, 672–678. [Google Scholar]
- Klemm, D.; Kramer, F.; Moritz, S.; Lindström, T.; Ankerfors, M.; Gray, D.; Dorris, A. Nanocelluloses: A new family of nature-based materials. Angew. Chem. Int. Ed. 2011, 50, 5438–5466. [Google Scholar] [CrossRef] [PubMed]
- Iwamoto, S.; Abe, K.; Yano, H.; Kuga, S. The effect of hemicellulose and lignin removal on the crystallinity of cellulose. Cellulose 2008, 15, 497–508. [Google Scholar]
- George, J.; Sreekala, M.S.; Thomas, S. A review on interface modification and characterization of natural fiber reinforced plastic composites. Polym. Eng. Sci. 2001, 41, 1471–1485. [Google Scholar] [CrossRef]
- Li, Y.; Mai, Y.W.; Ye, L. Sisal fiber reinforced high density polyethylene composites: Water absorption and mechanical properties. Compos. Sci. Technol. 2000, 60, 2037–2045. [Google Scholar] [CrossRef]
- Grand View Research Inc. Low-Density Polyethylene (LDPE) Market Size, Share & Trends Analysis Report By Application (Film, Injection Molding, Others). Available online: https://www.marketresearchfuture.com/reports/low-density-polyethylene-market-7374 (accessed on 26 June 2024).
- Beer, G.; Flosdorff, M.; Kaps, R.; Seintsch, R. High-density polyethylene (PE-HD). Kunststoffe Plast Eur. 1999, 89, 8–11. [Google Scholar]
- Patel, M.K.; Crank, M.; Dornburg, V.; Hermann, B.; Roes, L. Medium and Long-term Opportunities and Risks of the Biotechnological Production of Bulk Chemicals from Renewable Resources. Ecol. Manag. Restor. 2004, 5, 30–33. [Google Scholar]


Disclaimer/Publisher’s Note: The statements, opinions and data contained in all publications are solely those of the individual author(s) and contributor(s) and not of MDPI and/or the editor(s). MDPI and/or the editor(s) disclaim responsibility for any injury to people or property resulting from any ideas, methods, instructions or products referred to in the content. |
© 2024 by the authors. Licensee MDPI, Basel, Switzerland. This article is an open access article distributed under the terms and conditions of the Creative Commons Attribution (CC BY) license (https://creativecommons.org/licenses/by/4.0/).