
Research on Fuzzy Evaluation of Land Environmental Security in Three Provinces of Northeast China


Abstract
1. Introduction
2. Overview of the Study Region
3. Indicator Creation and Data Sources
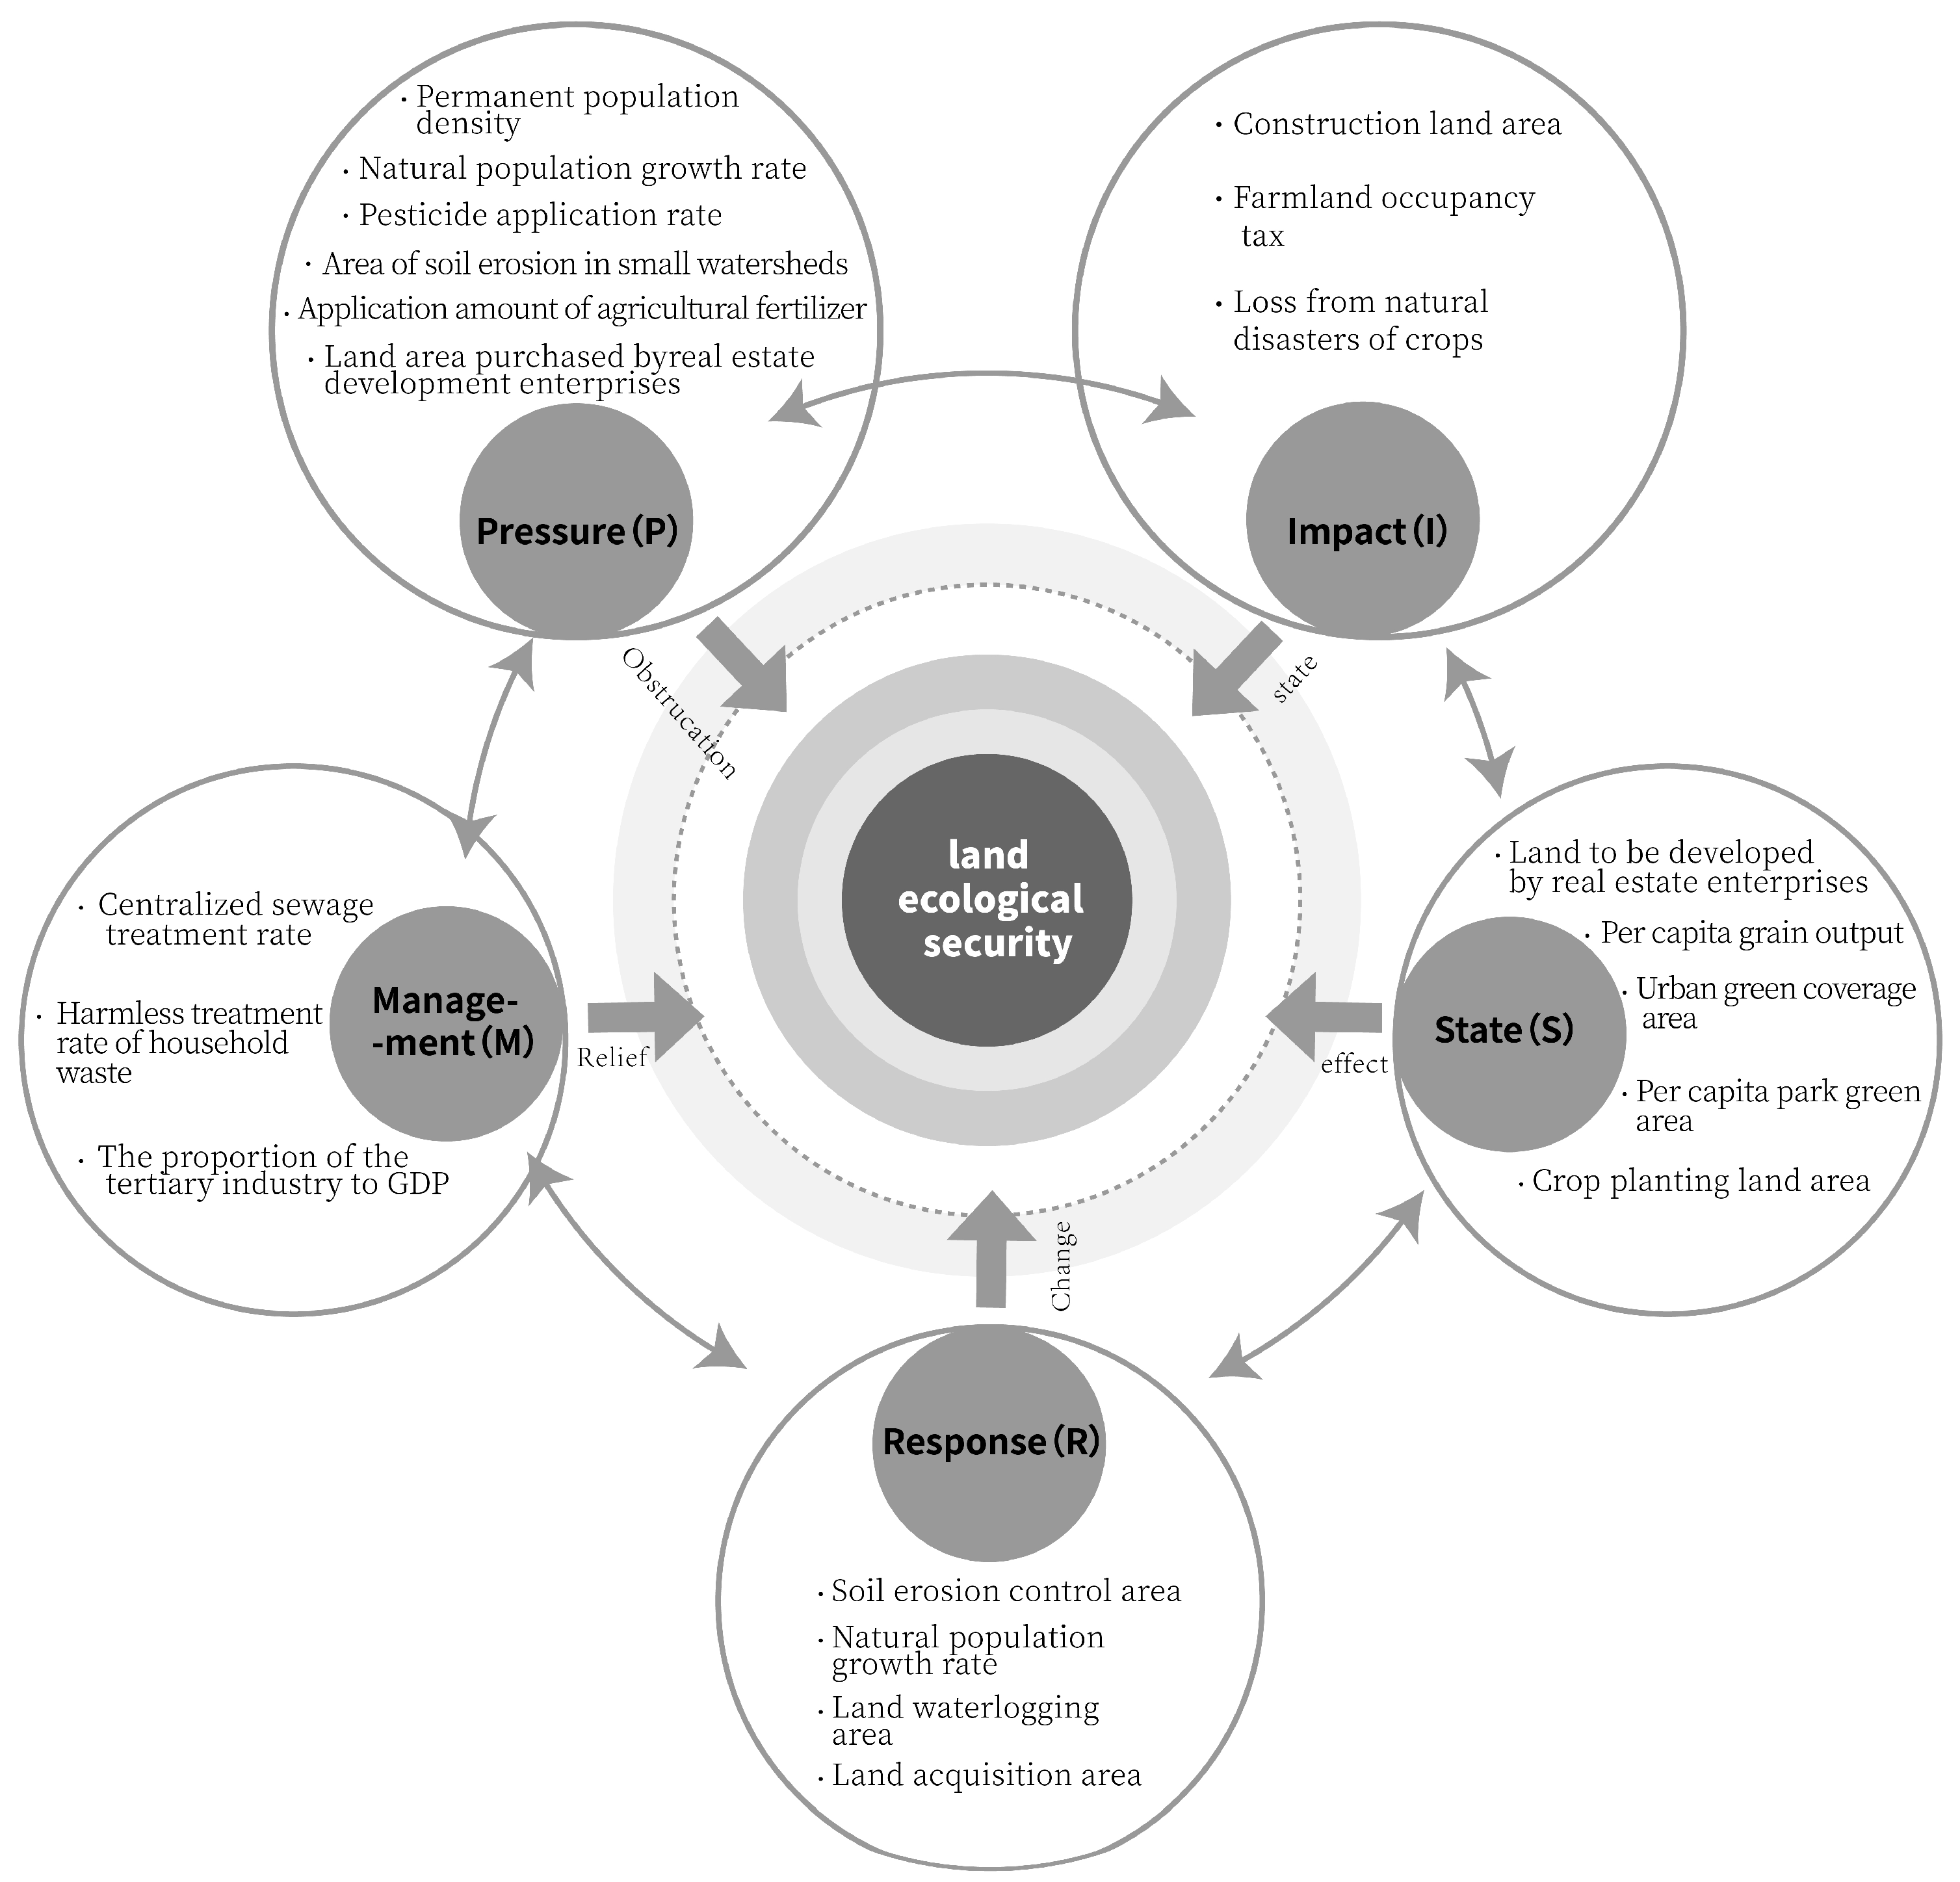
3.1. PSIRM (Pressure; State; Impact; Response; Management)
3.2. Data Sources
4. Data Calculation Process
4.1. The Weight of Indicators Is Determined Using the Entropy-Weighted Approach
4.2. Evaluation Level Division
5. Data Analysis
5.1. An Assessment of Soil Ecologically Security’s Temporal Dimension in the Three Provinces in the Northeast
- (1)
- The period 2012–2015 indicated an upward trajectory. An indicator is the overall area of soil erosion in sub-watersheds. P3 was larger in 2012 and decreased in 2013, but increased from 3202.1 thousand hectares to 3624.1 thousand hectares between 2013 and 2015. Pesticide application (P4) increased from 190,803 tons to 205,109.12 tons. Pesticide and fertilizer application (P5) increased from 5,939,100 tons to 6,386,400 tons. Residential land area (I1) increased from 5218.8 square kilometers to 5524.5 square kilometers. Crop damage due to natural disasters (I3) increased from 3414.7 thousand hectares to 3504.3 thousand hectares. The area devoted to soil erosion control (R1) decreased from 15,349.2 thousand hectares to 10,485.5 thousand hectares. Overall, negative indicators had a greater impact than positive ones, resulting in a downward trend in the indicators. First, insufficient attention has been paid to environmental management, while the usage of both pesticides and fertilizers with chemicals keeps rising. The ecological environment is the main disincentive at this stage due to incomplete diffusion of the new concept of green agriculture. Second, the three eastern provinces region are large agricultural provinces with economies that are heavily dependent on agriculture and thus face problems of overexploitation and heavy cultivation of arable land [20]. As the size of marshes, meadows, and woods have shrunk, the area of soil erosion has increased over the years, land reserves have decreased, and ecosystem functions have weakened.
- (2)
- The 2015–2018 period saw a slight increase. In terms of negative indicators, the population density of local residents (P1) and there was an annual drop in the rate of population growth (P2) due to natural factors. In terms of positive indicators, the area covered by urban green spaces (S3) increased from 338,355.51 ha to 354,674.46 ha. The area of green space per capita (S4) rose from 12.01 square meters to 12.63 square meters. The area of sown land (S5) rose from 221.93 million hectares to 249,613 million hectares. The area devoted to combating soil erosion (R1) rose from 10,485.5 thousand hectares to 12,675.7 thousand hectares. Domestic garbage (M2) was treated at a rate of 91.23%, up from 86.03%. Positive factors slightly offset negative ones, resulting in a slight increase in the index. The reasons for this are as follows. Firstly, the influence of politics, increased awareness of the need to have fewer children, the rising cost of educating children, and declining population density and natural growth rate have reduced the barriers to pressure. Secondly, economic development of the northeastern region has raised awareness of environmental protection, and the government has made great efforts to manage land, increase the area of flooded land, and improve the rate of soil erosion control. Thirdly, the area has started to prioritize land-use efficiency and utilize scarce building space extensively. In the northeast, the utilization of urban building land has become more intensive, efficient, and comprehensive due to the strengthening of city planning intensity and productivity.
- (3)
- It is basically flat in 2018–2021. In terms of positive contributing factors, per capita food production (S2) rose from 1276.0133 kg/capita to 1596.6467 kg/capita. Positive factors such as urban green space coverage area (S3), per capita park green space area (S4), and soil erosion control area (R1) promoted an increase in the land’s ecology index. In terms of negative factors, in small watersheds, the area affected by soil erosion (P3) increased from 3879.8 billion acres to 3953.6 thousand hectares. The domain of land purchased by real estate development enterprises (P6) and (S1) the area of land to be developed by real estate increased from 2020 to 2021. Both favorable and unfavorable influencing elements balanced one another. The reasons for their formation are as follows. First, the level of ecological health within land resources has increased, and the ecological safety index has risen. Second, the influence of the natural world and human activity on land ecology has diminished, while the degree of biological management and repair has increased.
5.2. Assessment of the Ecological Stability of Land Assets in Terms of PSIMR
5.3. Evaluation of Spatial Dimensions of Land Ecology in Each Province of the Three Northeastern Provinces Region
6. Indicator Correlation Analysis
Ranking of Factors Affecting Land Ecological Security
7. Discussion
8. Conclusions
Author Contributions
Funding
Informed Consent Statement
Data Availability Statement
Conflicts of Interest
References
- Cheng, H.; Zhu, L.; Meng, J. Fuzzy Evaluation of the Ecological Security of Land Resources in Mainland China Based on the Pressure-State-Response Framework. Sci. Total Environ. 2022, 804, 150053. [Google Scholar] [CrossRef] [PubMed]
- Cai, T.; Zhang, X.; Xia, F.; Zhang, Z.; Yin, J.; Wu, S. The Process-Mode-Driving Force of Cropland Expansion in Arid Regions of China Based on the Land Use Remote Sensing Monitoring Data. Remote Sens. 2021, 13, 2949. [Google Scholar] [CrossRef]
- Chen, A.; Hao, Z.; Wang, R.; Zhao, H.; Hao, J.; Xu, R.; Duan, H. Cultivated Land Sustainable Use Evaluation from the Perspective of the Water–Land–Energy–Food Nexus: A Case Study of the Major Grain-Producing Regions in Quzhou, China. Agronomy 2023, 13, 2362. [Google Scholar] [CrossRef]
- Dong, G.; Liu, Z.; Niu, Y.; Jiang, W. Identification of Land Use Conflicts in Shandong Province from an Ecological Security Perspective. Land 2022, 11, 2196. [Google Scholar] [CrossRef]
- Zhu, H.; He, Z. Regulation simulation of land-use ecological security, based on a CA model and GIS: A case-study in Xingguo County, China. Land Degrad. Dev. 2022, 33, 1564–1578. [Google Scholar]
- Guo, Y.; Chen, P.; Zhu, Y.; Zhang, H. Study on Comprehensive Evaluation of Human Settlements Quality in Qinghai Province, China. Ecol. Indic. 2023, 154, 110520. [Google Scholar] [CrossRef]
- Lu, Y.; Li, P.; Li, M.; Wen, M.; Wei, H.; Zhang, Z. Coupled Dynamics of Soil Water and Nitrate in the Conversion of Wild Grassland to Farmland and Apple Orchard in the Loess Drylands. Agronomy 2023, 13, 1711. [Google Scholar] [CrossRef]
- Li, C.; Wang, X.; Ji, Z.; Li, L.; Guan, X. Optimizing the Use of Cultivated Land in China’s Main Grain-Producing Areas from the Dual Perspective of Ecological Security and Leading-Function Zoning. Int. J. Environ. Res. Public Health 2022, 19, 13630. [Google Scholar] [CrossRef]
- Lu, X.; Zhang, Y.; Lin, C.; Wu, F. Analysis and Comprehensive Evaluation of Sustainable Land Use in China: Based on Sustainable Development Goals Framework. J. Clean. Prod. 2021, 310, 127205. [Google Scholar] [CrossRef]
- Li, Y.; Lian, Z.; Zhai, T.; Xie, X.; Wang, Y.; Li, M. Assessment of Land Ecological Security Based on the Boston Model: A Case Study from China. Land 2023, 12, 1348. [Google Scholar] [CrossRef]
- Li, Y.; Geng, H. Evolution of Land Use Landscape Patterns in Karst Watersheds of Guizhou Plateau and Its Ecological Security Evaluation. Land 2022, 11, 2225. [Google Scholar] [CrossRef]
- Liu, G.; Xie, H. Simulation of Regulation Policies for Fertilizer and Pesticide Reduction in Arable Land Based on Farmers’ Behavior—Using Jiangxi Province as an Example. Sustainability 2018, 11, 136. [Google Scholar] [CrossRef]
- Pu, L.; Yang, J.; Yu, L.; Xiong, C.; Yan, F.; Zhang, Y.; Zhang, S. Simulating Land-Use Changes and Predicting Maize Potential Yields in Northeast China for 2050. Int. J. Environ. Res. Public Health 2021, 18, 938. [Google Scholar] [CrossRef]
- Qian, F.; Wang, W.; Wang, Q. Implementing Land Evaluation and Site Assessment (LESA System) in Farmland Protection: A Case-Study in Northeastern China. Land Degrad. Dev. 2021, 32, 2437–2452. [Google Scholar] [CrossRef]
- Shan, Y.; Wei, S.; Yuan, W.; Miao, Y. Evaluation and Prediction of Land Ecological Security in Shenzhen Based on DPSIR-TOPSIS-GM (1, 1) Model. PLoS ONE 2022, 17, e0265810. [Google Scholar]
- Spiertz, H. Challenges for Crop Production Research in Improving Land Use, Productivity and Sustainability. Sustainability 2013, 5, 1632–1644. [Google Scholar] [CrossRef]
- Song, G.; Zhang, H. Cultivated Land Use Layout Adjustment Based on Crop Planting Suitability: A Case Study of Typical Counties in Northeast China. Land 2021, 10, 107. [Google Scholar] [CrossRef]
- Tang, Z.; Song, W.; Zou, J. The Early Effect of Black Land Protection Plan in Northeast China on Industrial Pollution Using Synthetic Control Method. Land 2022, 11, 585. [Google Scholar] [CrossRef]
- Wang, Z.; Yang, J.; Deng, X.; Lan, X. Optimal Water Resources Allocation under the Constraint of Land Use in the Heihe River Basin of China. Sustainability 2015, 7, 1558–1575. [Google Scholar] [CrossRef]
- Xu, Y.; Liu, H.; Lyu, J.; Xue, Y. What Influences Farmers’ Adoption of Soil Testing and Formulated Fertilization Technology in Black Soil Areas? An Empirical Analysis Based on Logistic-ISM Model. Int. J. Environ. Res. Public Health 2022, 19, 15682. [Google Scholar] [CrossRef]
- Wen, M.; Zhang, T.; Li, L.; Chen, L.; Hu, S.; Wang, J.; Liu, W.; Zhang, Y.; Yuan, L. Assessment of Land Ecological Security and Analysis of Influencing Factors in Chaohu Lake Basin, China from 1998–2018. Sustainability 2021, 13, 358. [Google Scholar] [CrossRef]
- Wu, R.; Wang, Y.; Liu, B.; Li, X. Spatial-Temporal Changes of NDVI in the Three Northeast Provinces and Its Dual Response to Climate Change and Human Activities. Front. Environ. Sci. 2022, 10, 974988. [Google Scholar] [CrossRef]
- Wu, Z.M.; Yu, Z.X.; Li, Y.; Liu, J.; Wang, J.S.; Zhang, C. The Study of Land Use Evolution and Landscape Ecological Security Evaluation in Dianchi Lake Basin. J. Southwest For. Univ. 2022, 41, 122–129. [Google Scholar]
- Wang, H.; Feng, R.; Li, X.; Yang, Y.; Pan, Y. Land Use Change and Its Impact on Ecological Risk in the Huaihe River Eco-Economic Belt. Land 2023, 12, 1247. [Google Scholar] [CrossRef]
- Xu, L.; Yin, H.; Li, Z.; Li, S. Land Ecological Security Evaluation of Guangzhou, China. Int. J. Environ. Res. Public Health 2014, 11, 10537–10558. [Google Scholar] [CrossRef]
- Xiao, D.; Niu, H.; Guo, J.; Zhao, S.; Fan, L. Carbon Storage Change Analysis and Emission Reduction Suggestions under Land Use Transition: A Case Study of Henan Province, China. Int. J. Environ. Res. Public Health 2021, 18, 1844. [Google Scholar] [CrossRef] [PubMed]
- Yang, R.; Du, W.; Yang, Z. Spatiotemporal Evolution and Influencing Factors of Urban Land Ecological Security in Yunnan Province. Sustainability 2021, 13, 2936. [Google Scholar] [CrossRef]
- Zhang, X.; Chen, M.; Guo, K.; Liu, Y.; Liu, Y.; Cai, W.; Wu, H.; Chen, Z.; Chen, Y.; Zhang, J. Regional Land Eco-Security Evaluation for the Mining City of Daye in China Using the GIS-Based Grey TOPSIS Method. Land 2021, 10, 118. [Google Scholar] [CrossRef]
- Zhou, Y.; Zhang, X.; Yu, H.; Liu, Q.; Xu, L. Land Use-Driven Changes in Ecosystem Service Values and Simulation of Future Scenarios: A Case Study of the Qinghai–Tibet Plateau. Sustainability 2021, 13, 4079. [Google Scholar] [CrossRef]
- Zhang, L.; Peng, W.; Zhang, J. Assessment of Land Ecological Security from 2000 to 2020 in the Chengdu Plain Region of China. Land 2023, 12, 1448. [Google Scholar] [CrossRef]
- Zhu, Y.; Zhong, S.; Wang, Y.; Liu, M. Land Use Evolution and Land Ecological Security Evaluation Based on AHP-FCE Model: Evidence from China. Int. J. Environ. Res. Public Health 2021, 18, 12076. [Google Scholar] [CrossRef]


| Category | Normative Layer | Indicator Layer | Unit | Convergence | Weighting |
|---|---|---|---|---|---|
| The Three Eastern Provinces’ Region’s Environmental Security of the Land Indicator System | P: Pressures | P1 Density of resident population | (persons/km2) | − | 0.0374 |
| P2 Natural population growth rate | (%) | − | 0.0267 | ||
| P3 Soil erosion area of sub-watersheds | (thousand hectares) | − | 0.0406 | ||
| P4 Amount of pesticide application | (tons) | − | 0.0335 | ||
| P5 Fertilizer application for agricultural use (pure) | (million tons) | − | 0.0496 | ||
| P6 Area of land acquired by real estate development enterprises | (million square meters) | − | 0.1053 | ||
| S: Stresses | S1 Land to be developed by real estate enterprises | (million square meters) | − | 0.0325 | |
| S2 Food production per capita | (Kg/person) | + | 0.0374 | ||
| S3 Urban green coverage | (hectares) | + | 0.0762 | ||
| S4 Green park area per capita | (m2) | + | 0.0354 | ||
| S5 Crop sown land area | (million hectares) | + | 0.0746 | ||
| I: Impact | I1 Construction land area | (square kilometers) | − | 0.0312 | |
| I2 Cultivated land occupation tax | (billions) | + | 0.1107 | ||
| I3 Natural disaster losses of crops | (thousand hectares) | − | 0.0266 | ||
| R: Response | R1 Soil erosion control area | (thousand hectares) | + | 0.0475 | |
| R2 Total afforestation area | (hectares) | + | 0.0223 | ||
| R3 Land de-flooding area | (thousand hectares) | + | 0.0162 | ||
| R4 Land expropriation area | (square kilometers) | − | 0.0886 | ||
| M: Management | M1 Centralized sewage treatment rate | (%) | + | 0.0338 | |
| M2 Harmless treatment rate of domestic garbage | (%) | + | 0.0339 | ||
| M3 Tertiary industries’ share of GDP | (%) | + | 0.0400 |
| Closeness | [0–0.2) | [0.2–0.4) | [0.4–0.6) | [0.6–0.8) | [0.8–1) |
|---|---|---|---|---|---|
| Ecological security of land resources | unsafe | less secure | critical safety | relatively safe | secure |
| Annum | D+ | D− | Value of Total Relative Closeness | Ordering |
|---|---|---|---|---|
| 2012 | 0.146 | 0.192 | 0.569 | 1 |
| 2013 | 0.159 | 0.154 | 0.491 | 2 |
| 2014 | 0.163 | 0.129 | 0.442 | 3 |
| 2015 | 0.191 | 0.091 | 0.322 | 9 |
| 2016 | 0.197 | 0.091 | 0.317 | 10 |
| 2017 | 0.199 | 0.106 | 0.349 | 8 |
| 2018 | 0.181 | 0.118 | 0.393 | 7 |
| 2019 | 0.186 | 0.123 | 0.398 | 6 |
| 2020 | 0.188 | 0.141 | 0.428 | 5 |
| 2021 | 0.188 | 0.147 | 0.439 | 4 |
| Year | 2012 | 2013 | 2014 | 2015 | 2016 | 2017 | 2018 | 2019 | 2020 | 2021 |
|---|---|---|---|---|---|---|---|---|---|---|
| Pressure | 0.739 | 0.612 | 0.506 | 0.42 | 0.368 | 0.336 | 0.302 | 0.18 | 0.123 | 0.138 |
| Stress | 0.154 | 0.227 | 0.193 | 0.208 | 0.191 | 0.451 | 0.576 | 0.702 | 0.857 | 0.933 |
| Impact | 0.735 | 0.8 | 0.749 | 0.213 | 0.296 | 0.209 | 0.265 | 0.228 | 0.262 | 0.202 |
| Response | 0.923 | 0.357 | 0.25 | 0.262 | 0.229 | 0.227 | 0.303 | 0.317 | 0.324 | 0.344 |
| Management | 0.045 | 0.099 | 0.27 | 0.508 | 0.638 | 0.726 | 0.85 | 0.918 | 0.979 | 0.966 |
| Comprehensive | 0.569 | 0.491 | 0.442 | 0.322 | 0.317 | 0.349 | 0.393 | 0.398 | 0.428 | 0.439 |
| Criteria Level | Relevance | Ranking | Indicator Level | Relevance | Ranking |
|---|---|---|---|---|---|
| P: Pressures | 0.646 | 2 | P1 | 0.904 | 5 |
| P2 | 0.723 | 21 | |||
| P3 | 0.96 | 1 | |||
| P4 | 0.906 | 4 | |||
| P5 | 0.88 | 10 | |||
| P6 | 0.884 | 9 | |||
| S: Stresses | 0.55 | 5 | S1 | 0.915 | 3 |
| S2 | 0.84 | 16 | |||
| S3 | 0.857 | 14 | |||
| S4 | 0.859 | 13 | |||
| S5 | 0.862 | 12 | |||
| I: Impact | 0.634 | 3 | I1 | 0.854 | 15 |
| I2 | 0.864 | 11 | |||
| I3 | 0.808 | 19 | |||
| R: Response | 0.786 | 1 | R1 | 0.935 | 2 |
| R2 | 0.901 | 6 | |||
| R3 | 0.886 | 8 | |||
| R4 | 0.891 | 7 | |||
| M: Management | 0.563 | 4 | M1 | 0.833 | 17 |
| M2 | 0.78 | 20 | |||
| M3 | 0.808 | 18 |
Disclaimer/Publisher’s Note: The statements, opinions and data contained in all publications are solely those of the individual author(s) and contributor(s) and not of MDPI and/or the editor(s). MDPI and/or the editor(s) disclaim responsibility for any injury to people or property resulting from any ideas, methods, instructions or products referred to in the content. |
© 2024 by the authors. Licensee MDPI, Basel, Switzerland. This article is an open access article distributed under the terms and conditions of the Creative Commons Attribution (CC BY) license (https://creativecommons.org/licenses/by/4.0/).
Share and Cite
Wang, Y.; Zhou, H.; Guo, Y.; Zhang, L. Research on Fuzzy Evaluation of Land Environmental Security in Three Provinces of Northeast China. Sustainability 2024, 16, 4907. https://doi.org/10.3390/su16124907
Wang Y, Zhou H, Guo Y, Zhang L. Research on Fuzzy Evaluation of Land Environmental Security in Three Provinces of Northeast China. Sustainability. 2024; 16(12):4907. https://doi.org/10.3390/su16124907
Chicago/Turabian StyleWang, Yu, Hanru Zhou, Yanlong Guo, and Linfu Zhang. 2024. "Research on Fuzzy Evaluation of Land Environmental Security in Three Provinces of Northeast China" Sustainability 16, no. 12: 4907. https://doi.org/10.3390/su16124907
APA StyleWang, Y., Zhou, H., Guo, Y., & Zhang, L. (2024). Research on Fuzzy Evaluation of Land Environmental Security in Three Provinces of Northeast China. Sustainability, 16(12), 4907. https://doi.org/10.3390/su16124907