Article

Investigating the Key Factors Affecting Public Transport Ridership in Developing Countries through Structural Equation Modeling

1
Department of Transportation Engineering and Management, University of Engineering and Technology Lahore, Lahore 54890, Pakistan
2
Department of Computer Science, University of Engineering and Technology Lahore, Lahore 54890, Pakistan
3
Faculty of Engineering, Sohar University, Sohar 311, Oman
4
Department of Civil Engineering, The University of Hong Kong, Pokfulam Road, Hong Kong 999077, China
5
Department of Engineering and Architecture, University of Enna Kore, 94100 Enna, Italy
*
Authors to whom correspondence should be addressed.
Sustainability 2024, 16(11), 4426; https://doi.org/10.3390/su16114426
Submission received: 8 April 2024 / Revised: 13 May 2024 / Accepted: 20 May 2024 / Published: 23 May 2024
(This article belongs to the Collection Sustainability in Urban Transportation Planning)

Abstract

:
Every country requires efficient public transportation to reduce the reliance on motor vehicles, decrease harmful emissions and noise pollution, and, most importantly, provide accessible transportation for urban populations with limited resources. Yet, several challenges hinder the efficiency of the public transportation system, affecting factors like daily ridership, infrastructure, revenue, and operations. Therefore, this research investigated barriers and their impact on the daily ridership of rail transit services, especially in densely populated areas characterized by high automobile usage, inadequate pedestrian facilities, and limited connectivity to other transportation modes. To accomplish this goal, a self-administered questionnaire was developed, and a survey was conducted to collect responses from commuters at various public transport hubs. Structural equation modeling (SEM) was used to analyze data gathered from a sample of 1000 participants. The findings from the SEM model indicated a positive correlation between Instrumental Attractiveness (IA) and Facility Design and Operation (FDO) with daily travel. Conversely, Service and Information (SI) along with Environmental Comfort (EC) exhibited a negative correlation with daily travel. Private sector employees without personal vehicles and a monthly income below fifty thousand exhibited a strong preference for public transport. Individuals with higher incomes who owned vehicles showed lower preferences towards public transport usage. The main contributors to low ridership in public transport included poor connectivity with metro and feeder buses, lack of availability of discount tickets, insufficient seating at stations, and inadequate route map information. Gasoline prices have a notable impact on daily ridership too, as higher fuel prices tend to attract more travelers to use public transport. The ridership data demonstrate a positive trend in response to increased gasoline prices. The findings from this study are useful for transportation engineers, practitioners, planners, and policymakers.

1. Introduction

With urbanization accelerating globally, there is a growing demand for efficient and sustainable mass transit systems, especially in developing countries [1]. According to projections from the World Bank, ridership on public transportation in these regions is expected to increase by more than 50% by 2030, driven by rapid population growth and urbanization [2,3]. Moreover, the United Nations estimates that by the same year, over 60% of the world’s population will be living in urban areas, with a substantial proportion residing in underdeveloped countries. [4]. This demographic shift highlights the critical need for expanded and modernized public transit infrastructure to address the increasing demand for transportation services [5,6].
Over the past two decades, Lahore has experienced significant urbanization, leading to profound changes in its demographics and landscape [7]. Several factors, including population growth, rural-to-urban migration, and the presence of economic opportunities in cities, have contributed to the significant surge in urban development. To accommodate the expanding population and economic activity, Lahore has witnessed the development of new residential areas, commercial zones, and infrastructure projects. Therefore, urbanization has brought about both opportunities and challenges for the city, especially in terms of public transport [8]. Urbanization has raised living standards for residents, promoting economic growth and creating job opportunities. However, it has also led to challenges such as worsening traffic congestion, strain on public infrastructure, and environmental degradation [9].
The increasing demands of urbanization present significant challenges to transportation infrastructure, highlighting the need for an efficient and sustainable public transportation system. Among these systems, metro rails emerge as a crucial mode of transport, especially in rapidly growing cities experiencing substantial population growth. Metro rails are acknowledged as a cost-efficient and environmentally friendly solution for addressing the transportation needs of urban travelers [10]. It provides high-capacity transit, which helps to alleviate congestion on roads and reduce emissions, contributes to enhanced air quality, and mitigates the environmental effects of urban transportation [11].
The significance of metro rails in urban transportation helps in addressing issues such as increasing traffic demands associated with urbanization. This highlights the necessity for additional research to improve the effectiveness of the provision of metro rails and extend their coverage to meet the needs of growing populations through evolving mobility patterns [12]. However, challenges arise when transportation projects such as metro rails face lower daily ridership than initially projected, which leads to inefficient use of infrastructure and resources. The possible solutions from the literature show that developing nations need to invest in new technologies that enhance accessibility and improve service quality. These efforts are essential for meeting the needs of a growing urban population and fostering sustainable urban development [13,14].
To effectively address the challenges associated with low ridership in rail transit services, especially in cities with inadequate connectivity to the existing mass transit facilities, a comprehensive understanding of the factors influencing ridership patterns is essential. Prior research on factors affecting transit ridership has primarily examined variables such as service quality parameters and demographic characteristics. However, these studies have overlooked the application of SEM models to investigate the complex interrelationships among other factors, particularly within the context of underdeveloped countries with limited connectivity with existing mass transit services, including metro buses and feeder routes. This highlights the existence of a significant research gap, in which there is insufficient understanding of the primary factors that influence ridership in developing nations. Therefore, the research questions addressed in this study are as follows: First, what are the specific factors that influence low ridership in rail transit services, particularly in cities with inadequate connectivity with existing mass transit facilities? Second, what demographic characteristics contribute significantly to ridership patterns in underdeveloped regions where access to integrated mass transit services is inadequate? Third, what are the complex interrelationships among various factors that influence transit ridership, and how can SEM models be applied to better understand these relationships?
This research aims to address whether public transport users indeed prioritize transit operational services, specifically their accessibility, affordability, and entertainment services, over other service quality parameters in developing countries like Pakistan. A questionnaire survey was developed and conducted in the city of Lahore, Pakistan. A total of 1000 complete responses were collected, and the data were analyzed using SEM techniques. The study comprises three primary objectives. First, to analyze the current ridership trends of the rail transit system in the city. Second, to conduct a passenger satisfaction survey at metro train stations to gather user perceptions about this service. Third, to utilize SEM to identify key factors influencing ridership based on the collected responses from travelers. The paper is organized as follows: Section 2 introduces the theoretical framework and pertinent literature. Section 3 describes the survey methods, sampling techniques, and analysis procedures. Subsequently, Section 4 presents the findings from the survey and analysis. Section 5 provides a discussion of the results and findings. Lastly, the Conclusion Section summarizes the key findings of the study.

2. Literature Review

Public transportation systems play a pivotal role in shaping urban landscapes and addressing mobility challenges in modern cities [15]. In underdeveloped countries, the demand for efficient public transit is particularly acute due to rapid urbanization and population growth [16]. This is because rapid urbanization and private vehicle ownership are surging at an exponential rate in developing countries. This is primarily because the current public transportation systems are inefficient and poorly connected. Private vehicles contribute significantly to pollution, including CO2 emissions that damage the environment [17,18]. Therefore, the option of opting for public transport is inevitable and this was conducted to highlight the factors to engage public transport at its fullest.
The success of urban transportation largely depends on how well the public transit system functions, especially in areas targeted by metro networks. A critical component of an effective public transportation system is achieving sufficient ridership [19]. This helps improve connectivity, reduce traffic congestion and emissions, and ensure that mobility is accessible to the maximum number of people. However, many regions experiencing rapid population growth, both in developed and developing countries, struggle with low levels of public transit ridership [20]. The provision of public transport is viable only when it is well-accessible, well-connected, and integrated with other modes so that people shift themselves from other modes of travel to public transport. Therefore, this study was conducted to investigate the factors that can help users to shift towards transit trains.
Transit ridership studies have revealed a diverse array of influencing factors, including population growth in highly developed areas, fare price, routes, service frequency, stop and station accessibility, safety, the percentage of people who own private cars, population density, land use, and the cost and availability of parking, etc. [21]. Predominantly, these factors are classified into three overarching categories that impact ridership: socio-demographic, geographical, and public economic factors. Taking into consideration these important aspects, this study has accounted for various variables related to accessibility and connectivity concerning socio-economic aspects.
Studies show that public transport users were more concerned about transition operational service, e.g., accessibility, affordability, and entertainment service in comparison to other service quality parameters. Diab [22] found that offering good passenger services, discounted ticket availability, clean and comfortable vehicles, reliable schedules, and friendly and helpful staff can help attract more riders to the facility and have a significant impact on public transportation ridership [23]. Therefore, a particular focus on services related to passengers was engaged in this study, which is a main player in increasing ridership.
Bogota, as an example, has a comprehensive public transportation system that includes buses, taxis, and a bus rapid transit system [24,25]. Bogota’s public transportation system offers a great way to get around the city as it is efficient, affordable, and convenient. Alom [26] mentioned that in Dhaka (Bangladesh), fare pricing exerts a significant influence on individuals’ decisions to utilize public transportation services. Also, the authorities in India have shifted their attention towards the promotion of public transportation usage because of escalating trends of urbanization and the proliferation of motor vehicles on roads [27]. Hence, this study has particularly focused on the challenges faced by underdeveloped countries like Pakistan, where public transportation is relatively a newer concept and challenges lie when it is compared with other traditional modes in terms of ridership. Along with other mixed analysis methods, most of such studies [28,29] are carried out by employing various regression analysis techniques to identify factors influencing ridership in rail transit systems compared to traditional regression analysis. In addition, widely multivariate methods are employed in transportation planning analysis to assess traveler behaviors toward public transit services [30,31]. Methodologies like regression analysis and SEM offer insights into ridership dynamics, SEM stands out for its ability to assess complex relationships and quantify direct and indirect effects on ridership. However, the SEM model in such scenarios has many advantages over other regression models and is preferred in this study.
The SEM model can examine complex relationships among different factors, such as environment safety, accessibility, and demographic variables and also quantify the direct and indirect effects of these factors on ridership, providing insights into which aspects have the most significant impact. A few studies [32] utilized SEM to identify the shared and autonomous vehicle ridership experience. Kim [33] employed SEM to pinpoint vital factors influencing public perception of transit facility facilities. Mandhani [27] utilized SEM to analyze passenger perception of railway services. Similarly, Ali [34] used SEM to analyze and measure service quality parameters offered by transit service services. Hakimi [35] employed SEM to examine passenger satisfaction with light rail transit service. Therefore, SEM is considered suitable and extensively utilized within the realm of transportation planning and engineering.
The public transportation system plays a crucial role by facilitating the mobility of large populations. Within public transportation options, metro rails are often favored for their eco-friendliness and ability to accommodate a significant number of passengers [27]. However, in underdeveloped nations where resources are scarce, effective planning and integration with existing transport services are essential for the success of rail transit initiatives.
Usually, government bodies provide subsidies to these public transport services to address challenges arising from rapid population increase, built-environment urbanization development, and increased private vehicle ownership [36]. As a result, low ridership in such regions raises sustainability concerns for such transit systems. Moreover, if developing countries experience low ridership levels below what is necessary for the sustainable operation of transportation projects, it becomes challenging for them to justify initiating future public transport facilities [37]. As political will in adopting and implementing public transport is one of the key aspects, therefore, this study has taken views on governmental policies to enhance the demand for light rail transit.
Several factors contribute towards minimal ridership, as discussed above, but lack of political motivations is one of the biggest contributors that drives the project downhill with inadequate planning [38]. Therefore, it is essential to thoroughly investigate the specific reasons for the gap between actual and desired ridership levels, especially in the context of developing nations. Previous studies are insufficient to address the issue of ridership, especially in the context of under-developed countries, and highlight the need for comprehensive research to identify and address the underlying factors affecting ridership. Hence, there is a significant gap in our understanding of the pivotal factors influencing ridership. This lack of essential insight could lead policymakers to misallocate resources, potentially overlooking opportunities to effectively address pressing transportation needs. Table 1 shows the details of previous studies with research gaps and availed conclusions.
The literature presented in Table 1 highlights significant gaps in understanding and addressing challenges within public transportation systems, particularly in underdeveloped countries experiencing rapid urbanization. Despite the crucial role of public transit in mitigating urban mobility issues, inefficiencies and poor connectivity persist due to inadequate infrastructure and planning. Studies emphasize the importance of achieving sufficient ridership for the success of transit systems, yet many regions struggle with low levels of public transport usage, influenced by factors such as fare pricing and service quality. In addition, political motivations and inadequate planning often hinder the success of public transportation initiatives, jeopardizing sustainability and future investments. Addressing these gaps requires comprehensive planning, integration with existing transport services, and political commitment to ensure the effectiveness and sustainability of public transit systems, especially in rapidly growing urban areas of developing nations.
A broad spectrum of transportation-related studies reveals various gaps and advancements that have happened so far. Previous studies focused on metro rail systems, delving into user travel patterns and factors influencing ridership, yet gaps persist in understanding the long-term impact of certain interventions like subsidies and urban transport policies. Urban transport policies, in advanced countries, have shown to influence car ownership trends, but gaps remain in comprehensively addressing the dynamics between policy implementation and behavioral shifts. While public transport subsidies in countries where public transport dominates demonstrated positive effects initially, challenges arise in sustaining these impacts over time, especially in identifying underlying causes of changes in demand.
Studies investigating passenger satisfaction with LRT services and service quality models in metro rail systems provide valuable insights, yet gaps exist in fully integrating passenger expectations and perceived value into service enhancements. The impact of external factors, such as the COVID-19 pandemic, on public transport ridership and bike-sharing systems underscores the need for adaptive policies, although gaps remain in understanding the long-term implications and designing effective responses.
Research on TNCs’ influence on travel demand highlights shifts in mode choice, but gaps persist in quantifying the overall impact on transport systems and addressing potential environmental and equity concerns. Similarly, studies on train ticket pricing and BRT demand prediction contribute to understanding traveler behavior, yet gaps remain in integrating these findings into comprehensive transport planning frameworks, particularly in developing countries.
Overall, while the existing literature offers valuable insights into various aspects of transportation systems, there are persistent gaps in understanding long-term impacts, integrating diverse factors into policy frameworks, and addressing emerging challenges such as the rise of TNCs and the effects of global crises. Therefore, this study took the identified gaps mentioned above and built upon the previous work by addressing the perception-based needs of travel through public transport, prioritizing transit operational services such as accessibility, affordability, etc., and service quality parameters which affect ridership. This study analyzed the current ridership trends of the rail transit system in the metropolitan city by conducting passenger satisfaction surveys at metro train stations to gather users’ perceptions about the services by applying the most suitable technique, i.e., SEM, which helped to identify key factors influencing the ridership of travelers. The findings from the study will be beneficial to developing long-term policies to enhance and maintain ridership.

3. Methodology

This section outlines the research methodology utilized in this study, detailing the design of the research questionnaire. Subsequently, a comprehensive data collection process was conducted, involving not only daily commuters of the OLMRTS facility but also technical interviews with relevant authorities to gather expert insights. After acquiring the data, advanced analytical techniques, including SEM and other statistical methodologies, were applied to analyze the collected information.

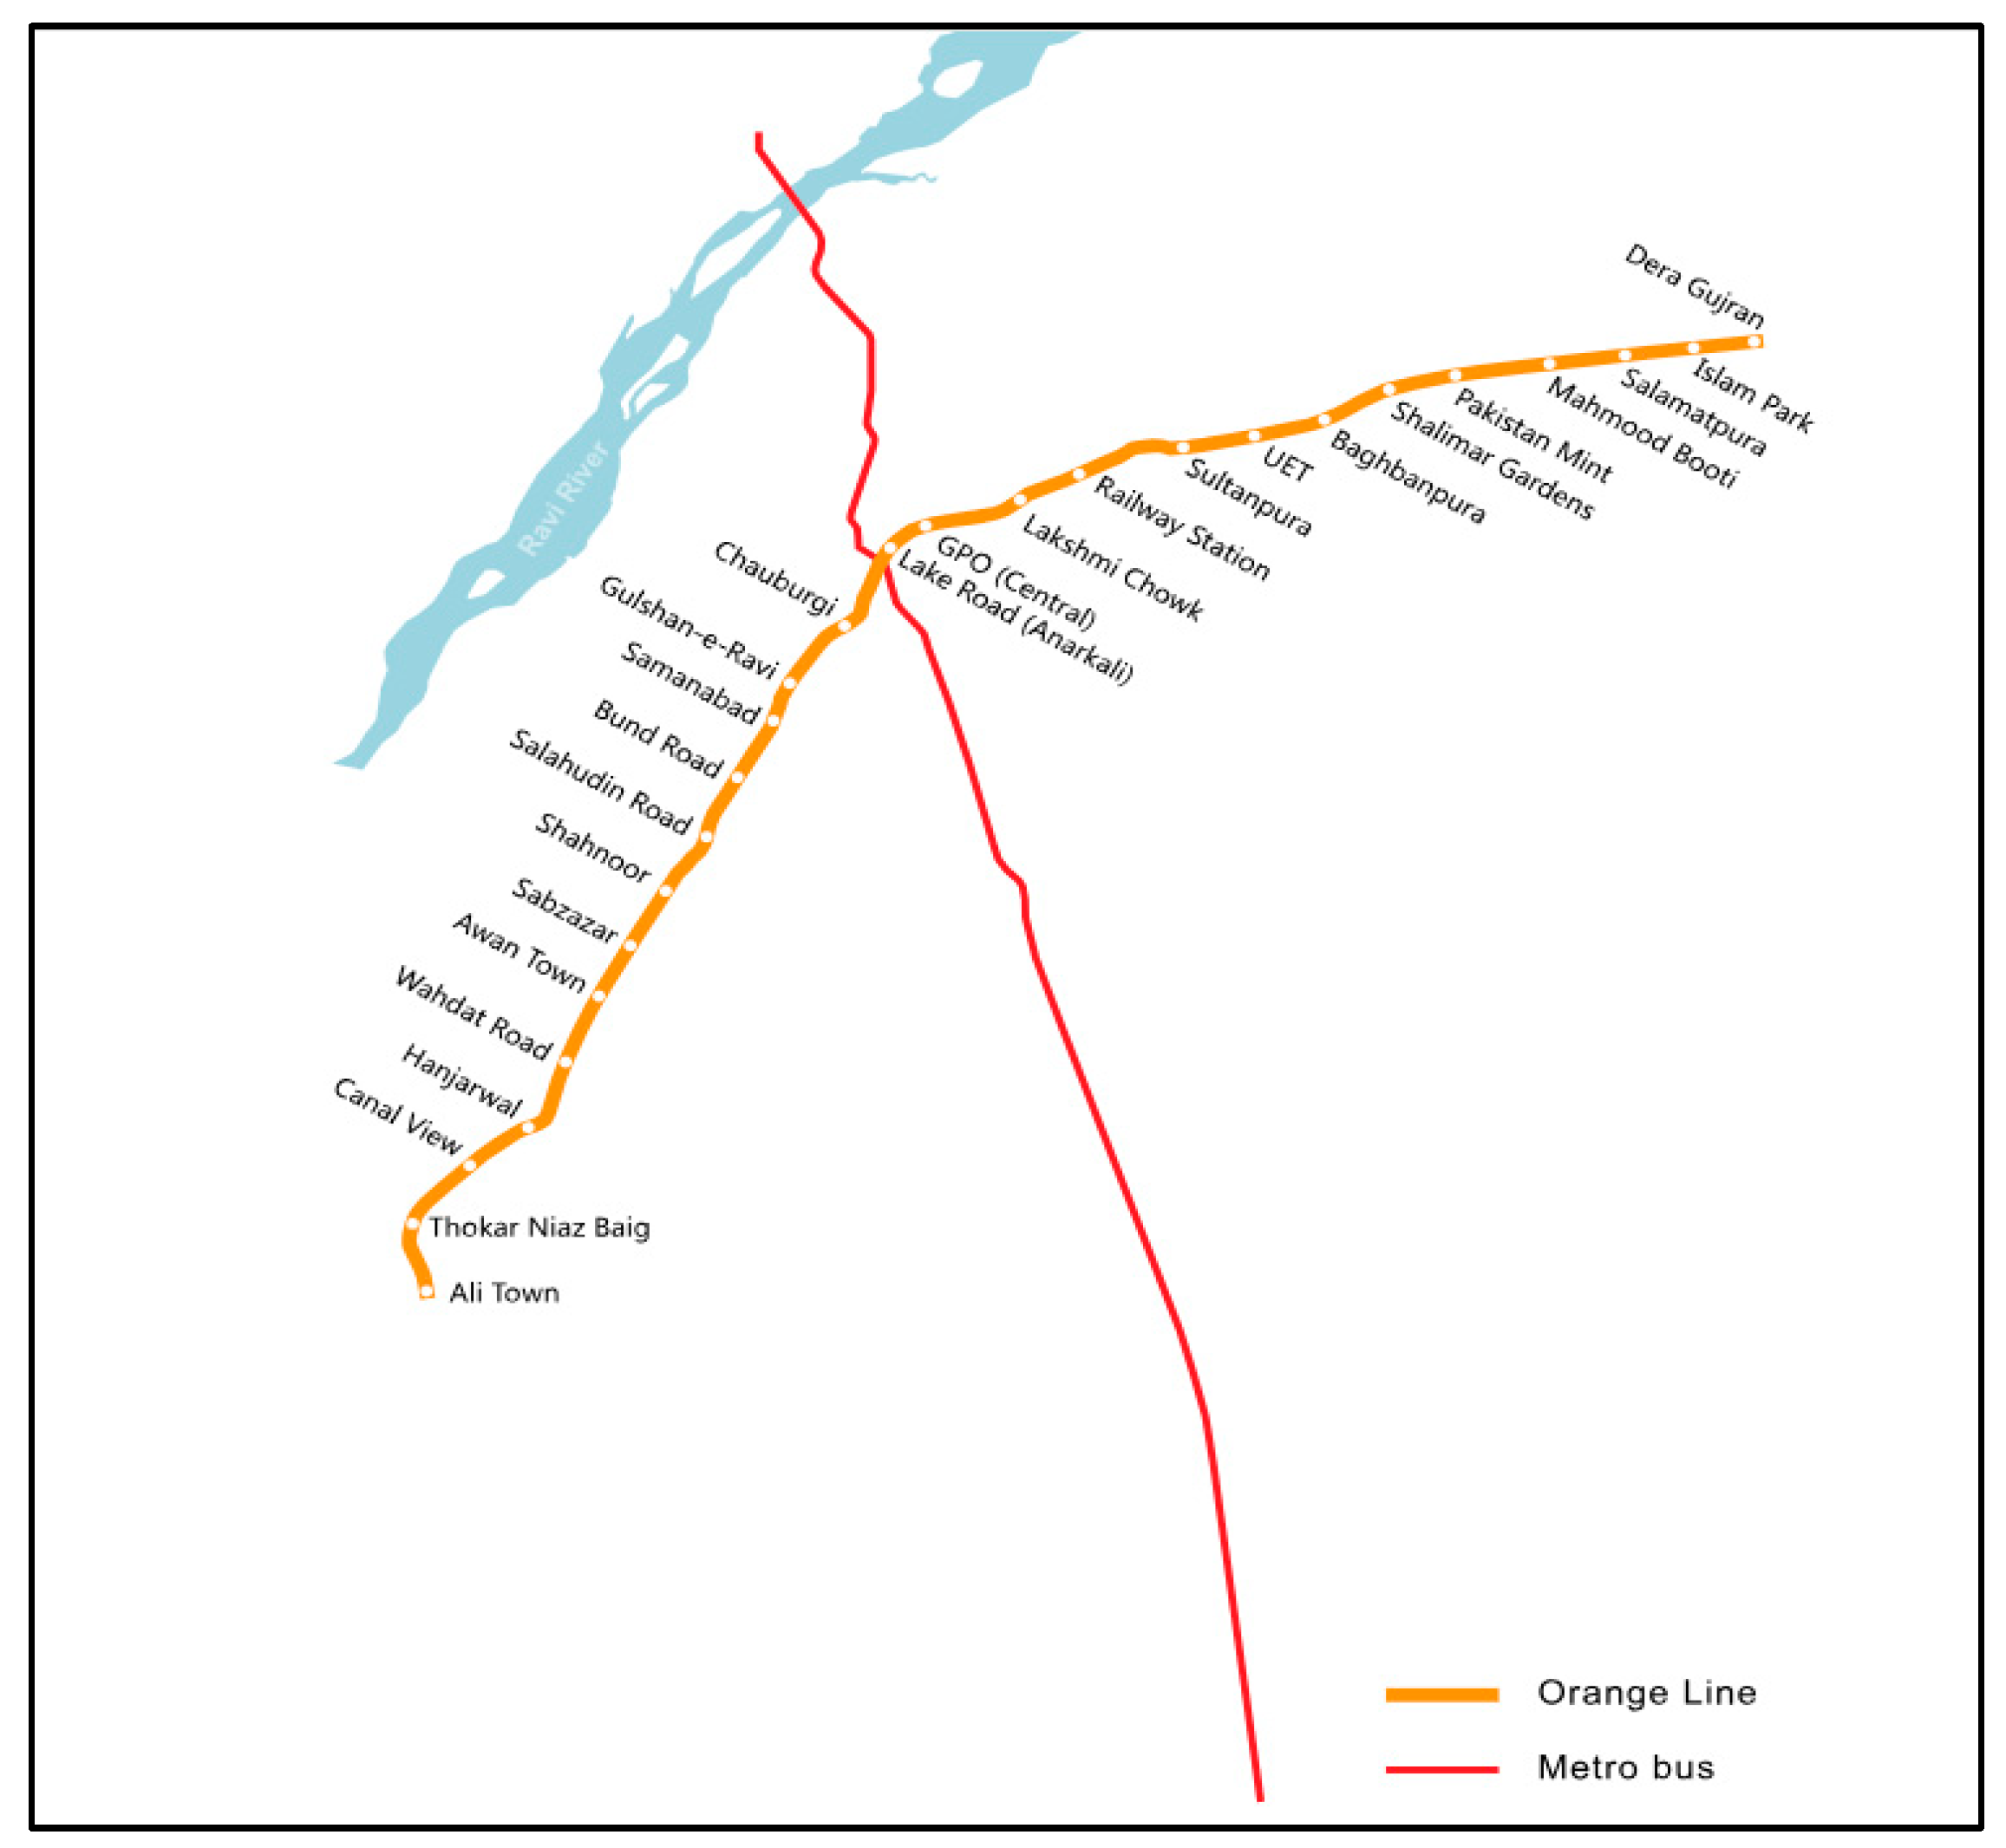
3.1. Selection of the Study Area

Over the past fifteen years, the population of Lahore has been growing rapidly, and according to the Excise and Taxation Department, there are currently 3.99 million registered vehicles in Lahore [40]. Automobiles significantly contribute to traffic congestion, accidents, and air quality issues in the city. The city’s population is increasing as more individuals migrate from their hometowns in pursuit of better job opportunities and educational prospects. The increasing trend of migration and population growth is driving up demand for travel on road infrastructure. Consequently, government agencies are collaborating with the Japan International Cooperation Agency (JICA) to find solutions to the rapid motorization on roads [41]. The JICA master plan included four metro lines—the Green Line, Orange Line, Blue Line, and Purple Line—designed to accommodate high passenger volumes and address increasing traffic demands while minimizing environmental impacts on the city.

3.2. Design of Questionnaire

The questionnaire was structured into five sections. The first section gathered demographic information from travelers, including socio-demographic characteristics such as gender, age, education, profession, income, vehicle ownership, travel frequency, and proximity to nearby stations. The second section focused on travelers’ trip details and mode-choice preferences. The third section assessed service quality through various parameters like accessibility, affordability, connectivity, and access to feeder routes using a five-point Likert scale ranging from 1 (very good) to 5 (very poor). The fourth section investigated the price model, examining travelers’ preferences in terms of fare type and ticketing methods. The final section of the survey includes suggestions for improvements to existing services.

3.3. Survey and Sample Size

The survey was conducted at multiple stations of the OLMRTS to gather accurate and reliable information from daily users. The primary objective of this survey was to identify the key factors influencing travelers’ choice to use the Orange Line Metro Rail Transit System over other available modes of transportation. The sample size was determined using the Yamane formula equation [42] to determine the survey’s minimal requirement, obtained by Equation (1).
n = N 1 + N e 2
The sample size (denoted as n) in Yamane’s formula is calculated using the population size (N) of Lahore city and a desired margin of error (e), typically set at 5%. Yamane’s formula is particularly effective for surveys conducted on finite populations where the total population size is known and relatively limited. To gather passenger opinions about the Orange Line Metro Rail Transit System, a passenger satisfaction survey was conducted at all 26 stations with the consent of the Punjab Mass Transit Authority (PMA), shown in Figure 1.
A total of 1083 responses were collected from travelers, and when data were cleaned and validated, it was observed that 83 responses had discrepancies—either the questionnaire was not filled in or showed biases as all options were marked where only one was asked for, and critical questions were not answered with other missing sections, particularly demographic information. In this particular case, the decision to discard 83 responses out of 1083 collected was based on a predetermined set of criteria that constituted an incomplete response. The critical key information was demographic data, responses to critical questions, or any other criteria deemed necessary for the study’s objectives.
It is necessary to mention here that with complete responses, it was ensured that the dataset used for analysis was as accurate and representative as possible. This allowed for more valid and reliable findings to be drawn from the data, enhancing the credibility of conclusions and recommendations based on the research. This way, the transparency of the study was enhanced, the standards of honesty and rigor were maintained in the methodology, and reinforcement of the trustworthiness of findings within the scientific community and among stakeholders was executed. The survey was carried out from July 2022 to August 2022.

3.4. Analysis Methods

The SEM technique to analyze the collected data in this study represents a valuable method within the transportation engineering domain for exploring travel patterns. SEM is recognized for its capability to test multiple hypotheses simultaneously within a single structural model, making it a popular choice among researchers [27,43,44]. In this research, the AMOS software, integrated into the IBM SPSS Statistics version 23 package, was utilized for SEM analysis to conduct confirmatory assessments on the collected data. This approach was chosen to validate measurement models and confirm correlations between observed and unobserved variables.
An SEM consists of two parts: (i) the latent variable model, which presents the correlations between the endogenous and exogenous unobserved or latent variables and allows for the direct assessment of the structural model, and (ii) the measurement model, which describes the correlation between latent and observed variables or indicators. Let ‘p’ denote the number of observed variables in the model (X1, X2, X3, ……………, Xp), ‘m’ represents the number of underlying factors or latent variables (F1, F2, F3, ……………, Fm) and Xj is the observed variable connected with any possible latent variable. Equation (2) assumes that there are ‘m’ number of latent variables and each observed variable is a linear function of the latent variable or factor with a residual error (ej).
X j = a j 1 F 1 + a j 2 F 2 + + a j m F 1 m + e j
where the factor loadings or regression estimates of measurement equations are aj1, aj2, …, ajm, which shows that aj1 is the factor loading of the jth variable on the first factor (F1). The factor loadings show the contribution of a specific observed variable to a particular factor. Variables with higher factor loadings have more influence in explaining the corresponding factor.
SEM offers several advantages over conventional regression analysis by accommodating multiple observed and latent variables in a unified model. Through the examination of goodness-of-fit parameters such as the Comparative Fit Index (CFI), Goodness of Fit Index (GFI), and Adjusted Goodness of Fit Index (AGFI), the validity of the structural model can be assessed. Previous studies recommend that these indices should exceed 0.9 for a satisfactory model fit. Additionally, a root mean square error of approximation (RMSEA) and root mean square residual (RMS) values less than 0.08 are indicative of a well-fitting structural model [45,46].

3.5. Analysis of the OLMRTS Ridership Trends

The OLMRTS is the first light metro rail service in Pakistan. It officially started its commercial operation on 25 October 2020 and it was designed to meet the traffic congestion problems of Lahore and to provide efficient transit services while reducing carbon emissions [47]. This line consists of 26 stations, of which 24 are elevated stations, having a total track length of 24.12 km, and 2 stations are underground. The Punjab Mass Transit Authority (PMA) is the regulatory body responsible for its daily operations. The OLMRTS was meticulously designed for the city and is equipped to handle a daily capacity of 200,000 people [48]. The gathered daily ridership data reveal a discrepancy between the actual ridership and the projected ridership.
Figure 2 presents the OLMRTS daily ridership data over six months, specifically from January 2022 to August 2022. The daily ridership data from January to August 2022 show patterns and variations in the way the transport system was used during that time. Starting in January, ridership typically exhibits an increasing trend from January to March. During this time, March has the highest ridership values, indicating a peak in the demand for public transport. On the other hand, April sees a sharp decline in ridership, with values falling significantly from the preceding months. The ridership reaches its lowest point throughout the entire dataset in May as a result of this decline. Ridership shows a discernible rebound starting in June, with values progressively rising. Nevertheless, June and July ridership levels fall short of the year-end highs recorded earlier. While slightly lower than in July, August still has a greater proportion than the other months.

4. Analysis and Results

In the following section, the findings and outcomes of the research are presented, providing insights into the analyzed data and effectively addressing the research objectives. The analysis involved the use of AMOS structural equation modeling (SEM), Origin, and other statistical techniques to examine correlations between variables and ridership patterns.

4.1. Socio-Economic and Demographic Characteristics of Users

Table 2 presents the socioeconomic and demographic characteristics of the respondents. The proportion of male passengers is nearly double that of female passengers. The majority of respondents (86%) are between 18 and 30 years old. Additionally, 54% of users have completed undergraduate studies, while 23% hold postgraduate qualifications. The results indicate that 44% of respondents are students, and 38% are employed in the private sector. These findings highlight the significant presence of students and private sector employees among daily commuters, emphasizing the need for public transport services tailored to their specific needs. Individuals who own businesses represent approximately 11% of respondents, whereas those employed by government organizations comprise only 6%. More than half (53%) of respondents do not own a vehicle, indicating a strong reliance on public transit, particularly the metro system. The remaining 47% of respondents who own vehicles still opt to use the metro, suggesting a preference due to convenience, cost-effectiveness, or environmental considerations. Approximately 34% of daily travelers have walking access to metro stations. Motorbikes are used by 28% of travelers, while rickshaws are used by 15%. Car users account for 8%, and 5% use private transportation. A small percentage (4%) utilize speedo/metro buses, and 3.5% use bicycles. Shared vehicles are used by 1.8% of respondents. In terms of travel frequency, 43% of respondents are daily travelers, 39% travel occasionally, and 9.4% and 8.4% have weekly and monthly commuting patterns, respectively.

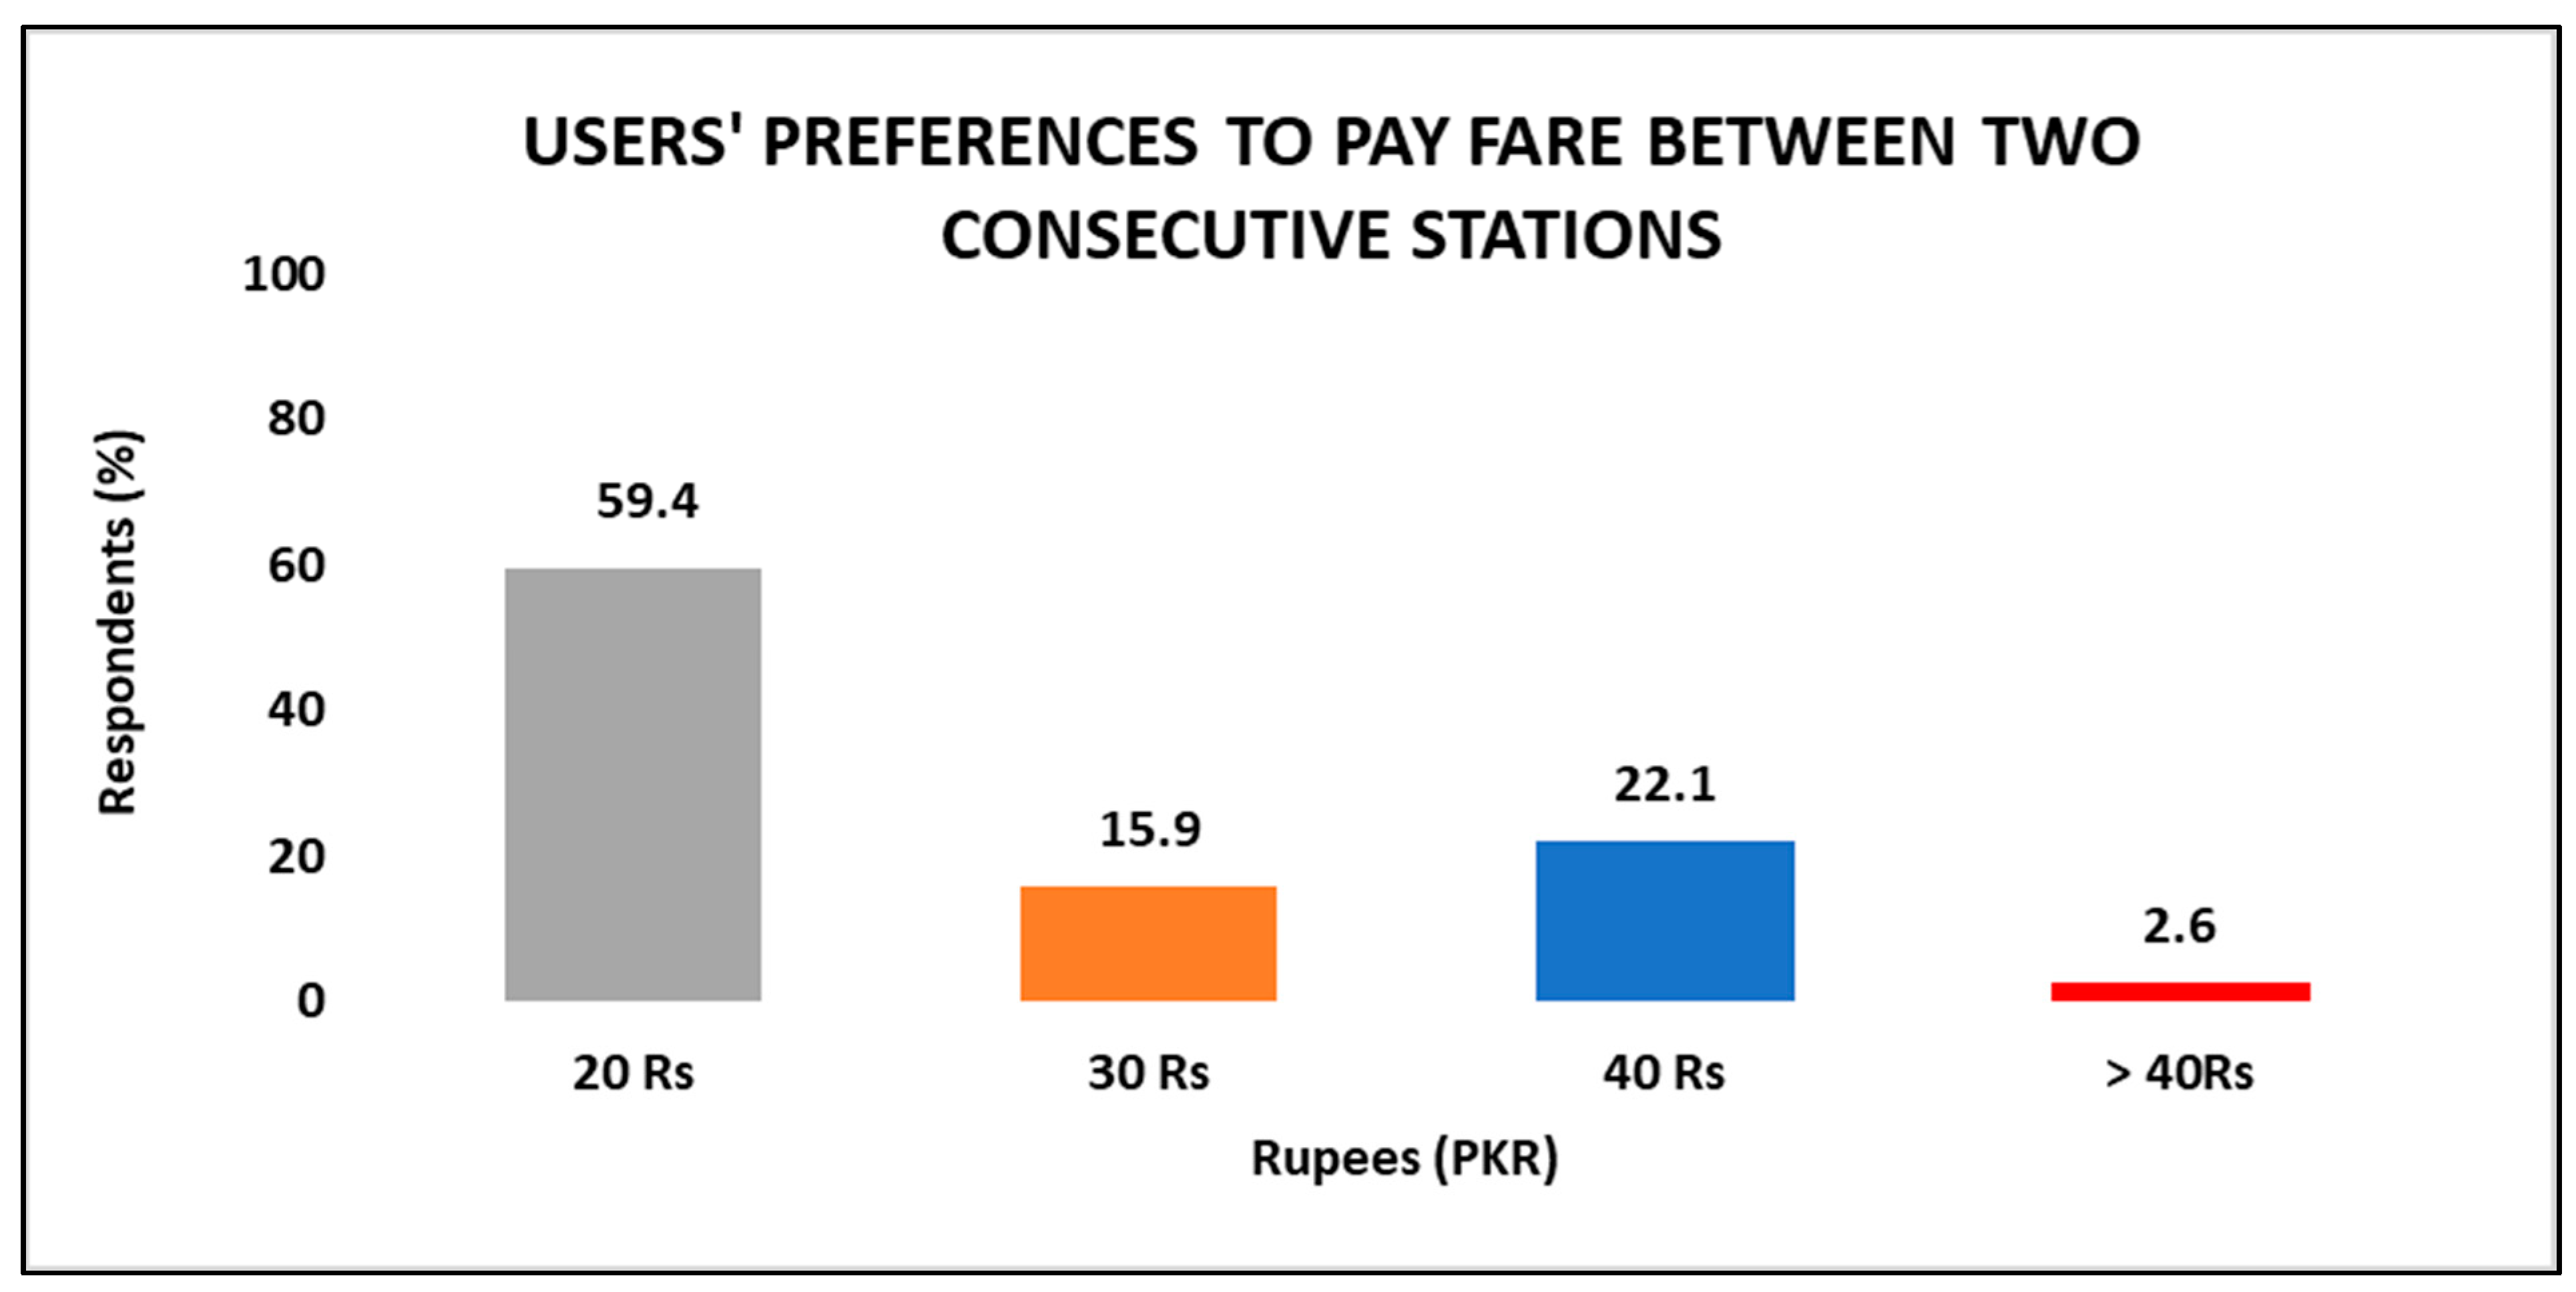
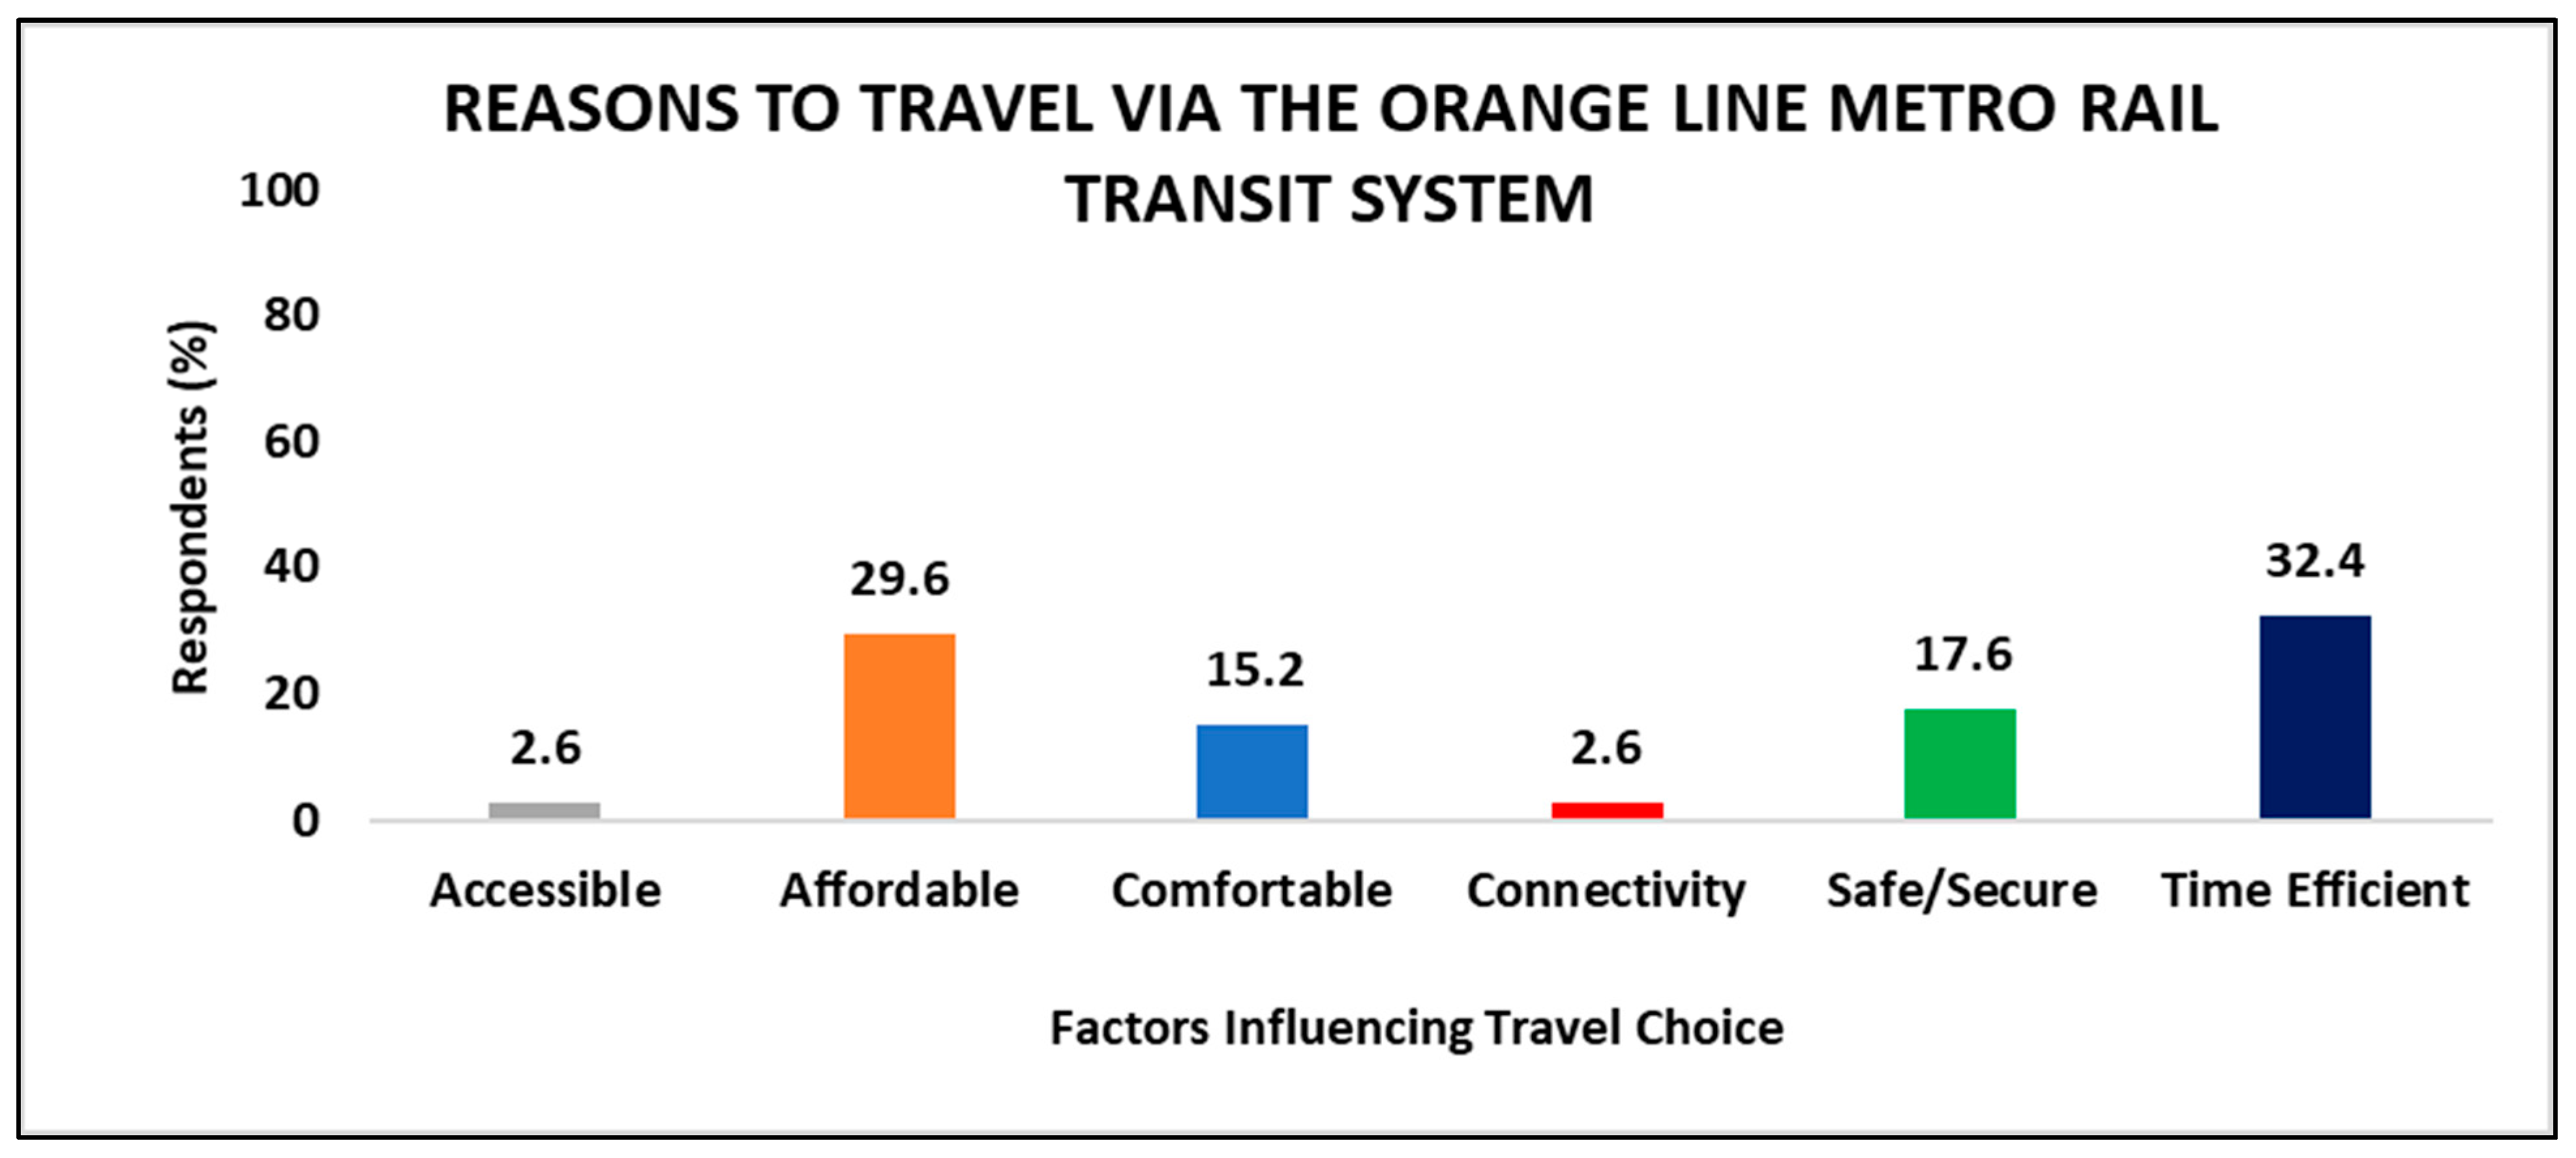
4.2. Understanding Ridership Patterns and Fare Preferences of Users

Figure 3 shows that 59.4% of OLMRTS passengers choose a minimum fare of PKR 20 between two consecutive stations, while 22.1% opted for a PKR 40 fare. Additionally, 15.9% and 2.6% selected PKR 30 or more as the minimum fare between two consecutive stations based on current fuel prices. Although the OLMRTS currently charges PKR 40 for a trip between two stations, a significant 59% of daily commuters indicated a preference for a PKR 20minimum fare. Within the rail system, this minimum fare represents the cost of a short-distance travel journey, covering the minimal distance between consecutive stations at a reduced rate. It ensures that passengers making short trips pay a fairly affordable price, distinct from those traveling the entire length of the line.
Figure 4 reveals that 52% of travelers selected distance-based fares for travel. In contrast, 35% preferred the flat fare policy and 13% selected the time-based fare policy for traveling. The fare type for two consecutive OLMRTS stations typically followed a distance-based pricing model, where passengers were charged based on the distance traveled between the two stations. Passengers can either use a smart card or cash as a payment method, and the cost is calculated automatically upon entry and exit at the stations. When analyzing how fare prices affected mode selections, it was found that people typically choose modes with cheaper fares than other options. This suggested that fare pricing is a major factor in commuters’ mode choice decisions, as there is a clear preference pattern available to them as a more affordable fare option.
Figure 5 shows the key factors that influence the shift of passengers from other modes to OLMRTS.
Figure 5 illustrates that overall, 32% of commuters chose OLMRTS for its time efficiency, while 30% chose it for its affordability. Additionally, 18% of passengers opted for safety, 15% chose comfort, and 2.6% selected accessibility and connectivity as primary reasons for choosing OLMRTS over other modes of transportation. The OLMRTS offers passengers timely access to educational institutions, employment opportunities, and recreational purposes by reducing traffic congestion.

4.3. Analyzing the Relationship between Daily Ridership and Fuel Prices

Figure 6 shows the relationship between ridership and fuel prices over eight months, spanning from January 2022 to August 2022. During the initial period, from January to mid-May 2022, fuel prices remained relatively stable, ranging from PKR 144 to 149 per liter, and did not significantly impact the daily ridership of the Orange Line Metro Rail Transit System.
Towards the end of May 2022, a substantial increase in fuel prices, as regulated by the Oil and Gas Regulatory Authority (OGRA), was observed, resulting in prices reaching PKR 179 per liter. This abrupt surge in fuel prices was associated with a notable uptick in the daily ridership of the OLMRTS. In the first week of June 2022, fuel prices further escalated to PKR 209 per liter, coinciding with a continued rise in ridership. Mid-June witnessed another spike in fuel prices, with rates soaring to PKR 233 per liter. However, this increase in fuel costs was correlated with a decline in passenger numbers. As August 2022 commenced, fuel prices once again surged, peaking at PKR 248 per liter, marking an all-time high for the year and adversely impacting the daily ridership. A discernible upward trend in ridership with rising fuel prices suggests that, in uncertain economic times, people may turn to more environmentally friendly modes of transportation. This emphasizes how crucial it is to offer appealing and effective public transport options as a competitive substitute for driving a private vehicle.
Table 3 shows the mean and standard deviations of variables derived from responses to a questionnaire, encompassing both latent and defined variables. Standard deviation measures the dispersion of data points from the average, with a lower value indicating that the data points are closer to the mean and a higher value suggesting greater variability. The latent variable Environment and Comfort (EC) factor loading “Environmental Friendliness” received the highest mean score (1.909), indicating high satisfaction among respondents. However, there is moderate variation in the responses (standard deviation = 0.89), suggesting some differing opinions. In the Facility Design and Operation (FDO), factor loading such as “Access to Feeder Routes” scored highest (mean = 2.143), showing relatively good satisfaction. “Train Punctuality” had the lowest standard deviation, meaning passengers generally agreed on this aspect. In the Service and Information (SI) latent variable, “Trip Time Information” had the lowest mean score (1.49), indicating lower satisfaction. Despite this, there was moderate variation in responses (standard deviation = 0.727), showing differing opinions among respondents. Moreover, in the Instrumental and Attractive (IA) factor loading, “Seating Capacity” received the highest mean score (3.27), indicating strong satisfaction in this area. Within the Instrumental and Attractive (IA) category, the variable “Seating Capacity” obtained the highest mean score of 3.27. Lastly, the variable related to “Connectivity with Metro Bus” within this category exhibited the lowest standard deviation, signifying a relatively consistent consensus among passengers regarding the connectivity aspect, despite potential variations in mean scores.

4.4. Assessing Reliability and Validity of Latent Variables through Confirmatory Factor Analysis

The confirmatory factor analysis (CFA) was employed to validate the relationships among a set of latent variables. This approach allows researchers to identify and measure the latent constructs that explain the observed variability in the data. One commonly used metric to assess the reliability of these latent variables is Cronbach’s alpha, with values greater than 0.6 typically considered acceptable, indicating a moderate level of internal consistency reliability. However, higher Cronbach’s alpha values, such as those exceeding 0.7 or 0.8, suggest a stronger level of reliability and consistency in the measurements.
Table 4 presents the Cronbach’s alpha values for each latent variable examined in the study, revealing four significant latent variables.
The results of the CFA indicate that all latent variables investigated exceeded the threshold of 0.6 for Cronbach’s alpha, demonstrating acceptable levels of internal consistency reliability. Among these variables, EC emerged as the most reliable, with a Cronbach’s alpha value of 0.814, indicating high internal consistency. Moreover, EC exhibited the highest factor loading (0.753) about its construct, highlighting its strong association with suitability in extreme weather conditions. Conversely, the variable FDO demonstrated the lowest reliability, with a Cronbach’s alpha value of 0.613, indicating a slightly lower level of internal consistency. Similarly, SI exhibited a Cronbach’s alpha value of 0.699, while the IA had a value of 0.626, both falling within the acceptable range.
However, SI displayed the lowest factor loading (0.521) about its construct, indicating a weaker association with trip time information compared to other latent variables. Overall, the Cronbach’s alpha values obtained for the latent variables indicate satisfactory levels of internal consistency reliability, signifying that the variables within each group are interrelated. These results instill confidence in the reliability of the measurements for the latent constructs investigated in the study, validating their suitability for further analysis.

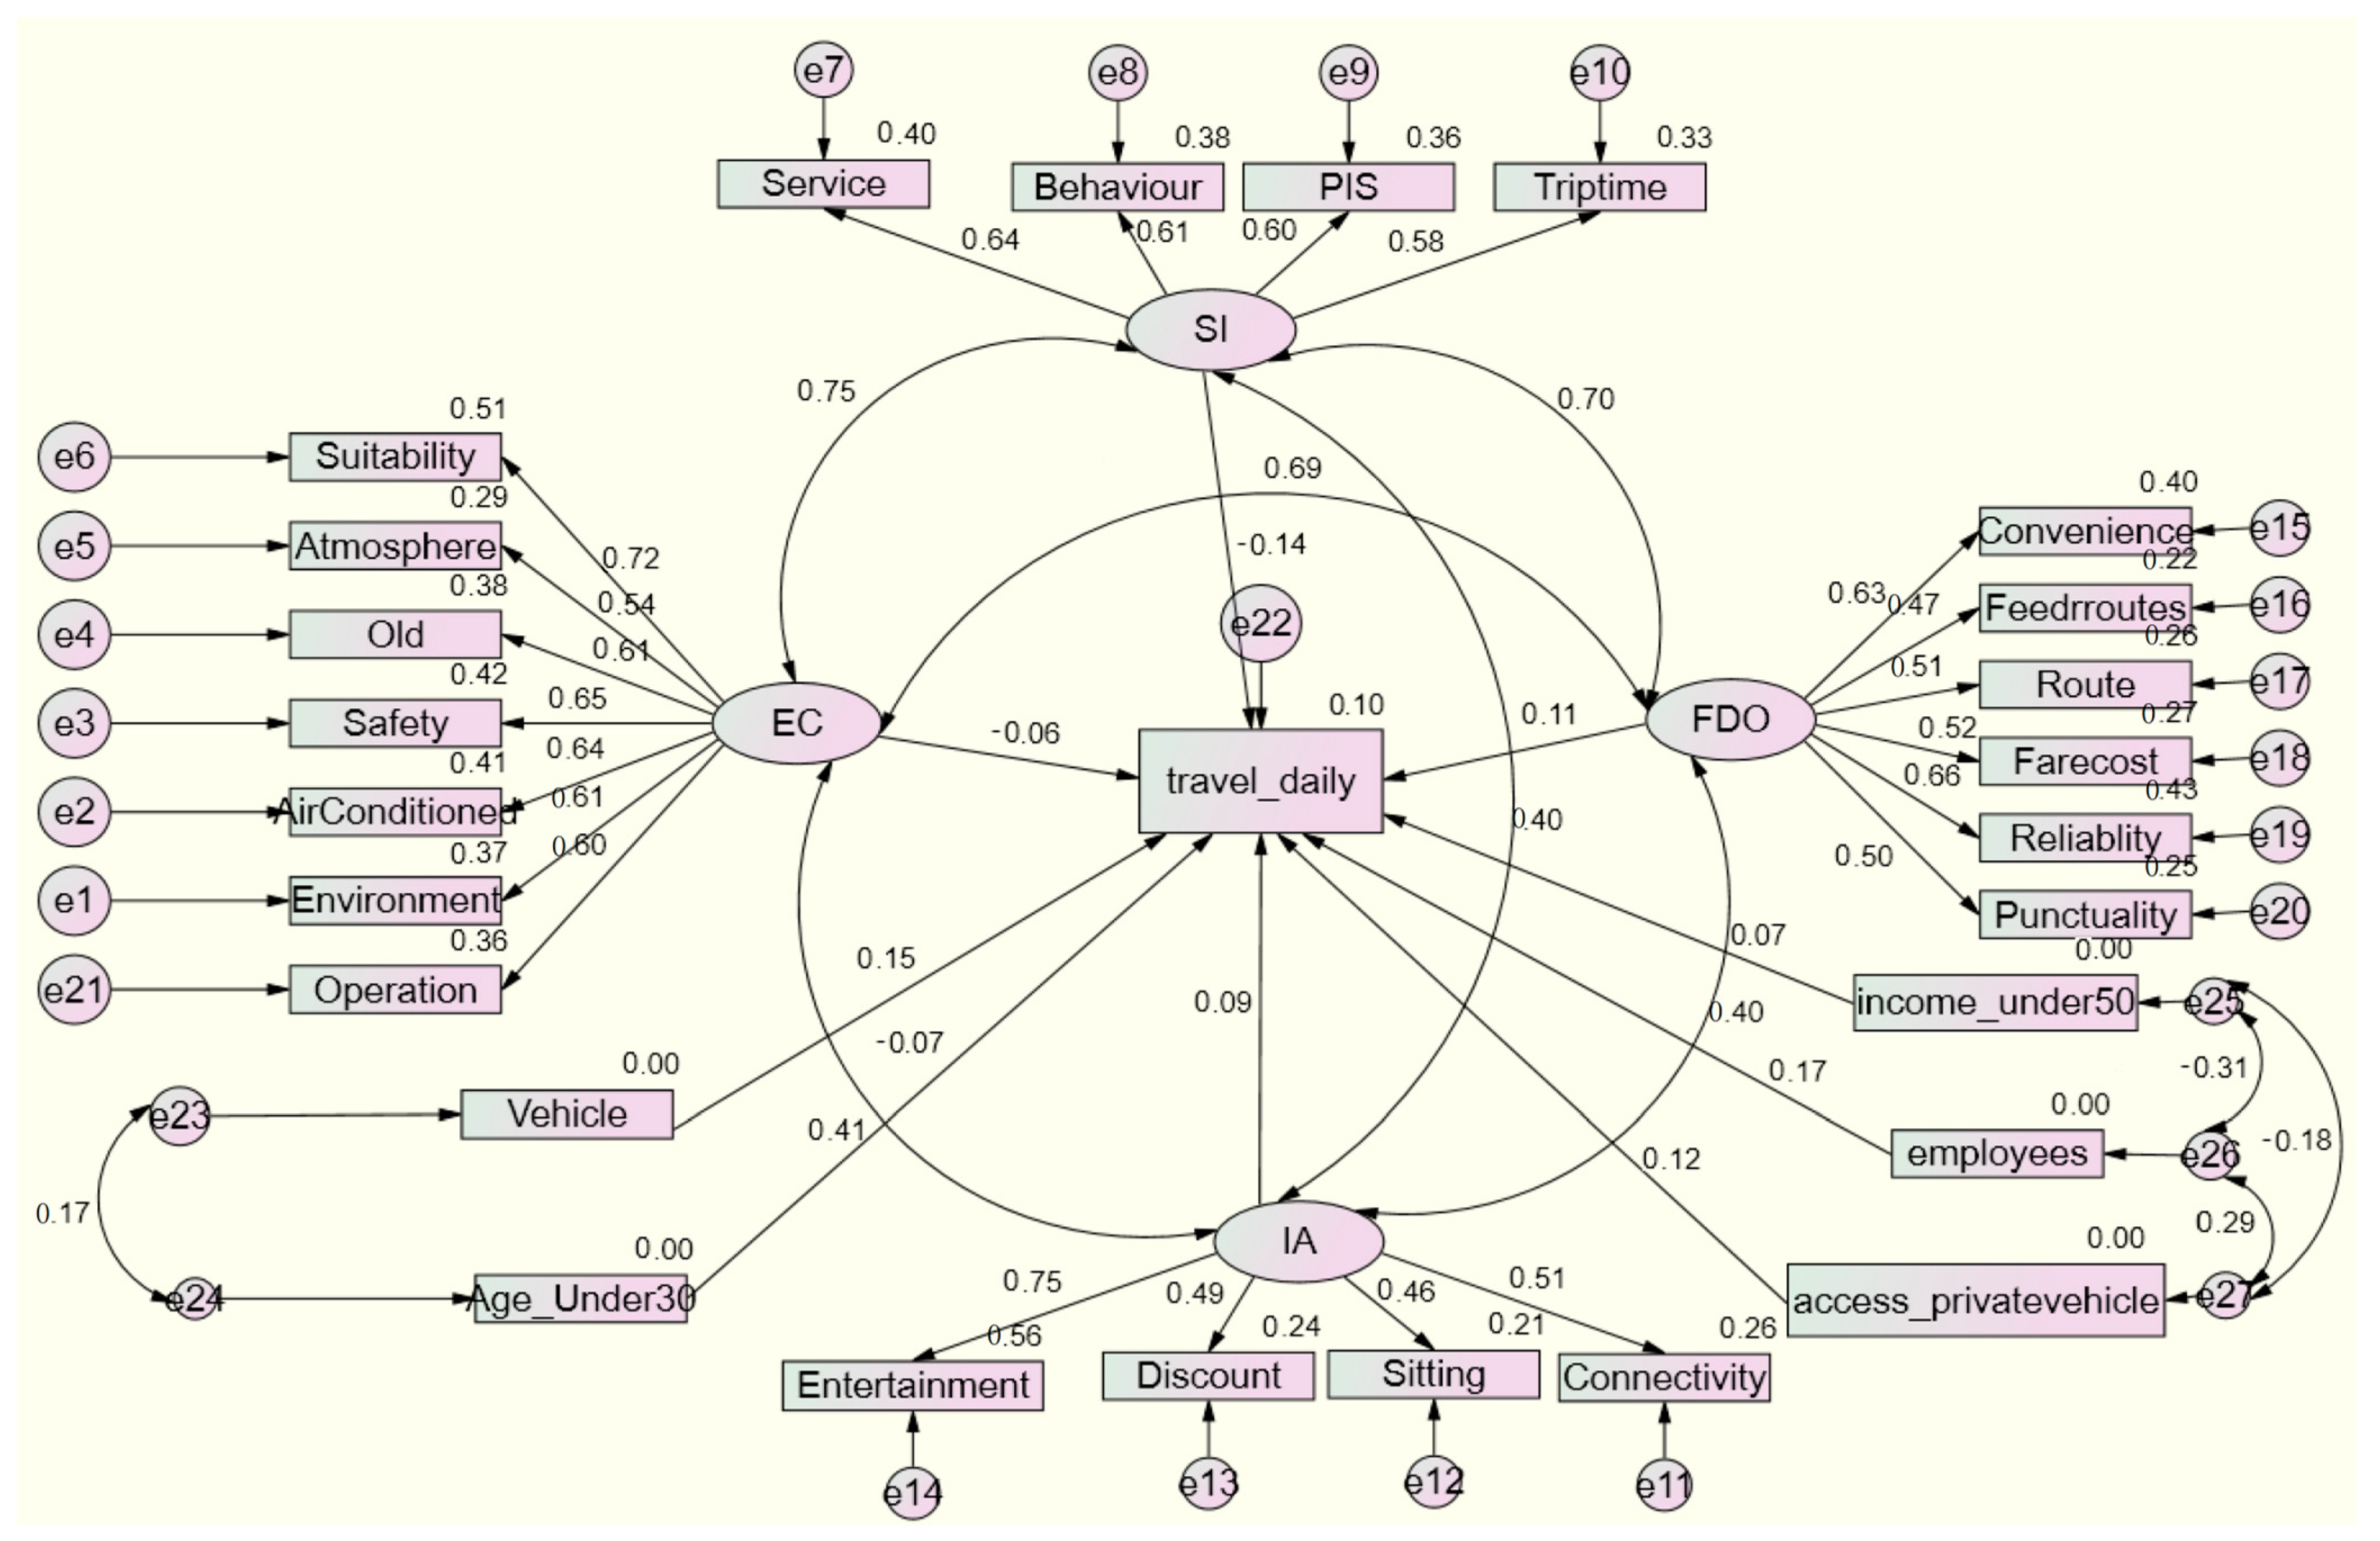
4.5. Evaluating SEM Model for Factors Influencing Commuters Daily Travel Behavior

Following the completion of the CFA, the data collected from the questionnaire were analyzed using SEM to investigate the hypothesized relationships between identified factors and the daily travel behavior of commuters afterward. Tang et al. (2021) [49] suggested that the Comparative Fit Index (CFI), the Goodness of Fit Index (GFI), and the Adjusted Goodness of Fit Index (AGFI) should ideally exceed 0.9. In terms of the structural model’s quality, the root mean square error of approximation (RMSEA) and root mean square residual (RMS) values should be below 0.08 to indicate a favorable model fit.
In developing the model, all observed variables of income, age under 30, employees as a profession, vehicle ownership, and private vehicle (car and motorcycle) as access mode were included as binary variables in the structural model. They were coded as 1, 0. For example, 1 if income is less than 50,000, otherwise 0; 1 if age is under 30 years, otherwise 0; 1 if respondents own a vehicle, otherwise 0; 1 if profession is employee, otherwise 0; and 1 if access mode is private vehicle, otherwise 0.
Table 5 shows the SEM model fit summary. Overall, this model is considered good and is acceptable based on the values evident from [50]. The CMIN/Df ratio, which assesses the appropriateness of the model fit, is calculated as 6.241. This ratio indicates that the model’s chi-square statistic is 6.241 times greater than the degrees of freedom. The CFI value is reported as 0.754. The CFI serves as an indicator of how well the model fits the data. In this case, the value of 0.754 falls short of the ideal value of 1.0, suggesting that there is room for improvement in achieving a more optimal fit between the structural equation model and the actual data. The GFI is computed as 0.874, signifying a relatively positive fit of the model to the observed data. In structural equation modeling, a GFI value closer to 1.0 is indicative of a robust fit, making 0.874 a favorable outcome in this context. Similarly, the AGFI stands at 0.847, indicating that the model’s fit is reasonably strong.
Like the GFI, a higher AGFI value, closer to 1.0, signifies a more robust fit between the model and the data. The RMSEA is reported as 0.072, which suggests that the model’s approximation to the population covariance matrix is moderately acceptable. An RMSEA value below the threshold of 0.08 is commonly considered to represent a reasonable fit between the model and the observed data. Lastly, the RMSR is found to be 0.047, implying that the model exhibits a relatively low residual error. A lower RMSR value is typically indicative of a well-fitting model, as it reflects a smaller degree of discrepancy between the model and the actual data.
Figure 7 presents a hypothetical model based on the survey results, showcasing four latent variables: Service and Information (SI), Environment and Comfort (EC), Facility Design and Operation (FDO), and Instrumental and Attractive (IA). In the above figure, the daily travel represents the dependent variable, while the remaining four variables, namely, SI, EC, FDO, and IA, are latent, each associated with distinct observed variables. In the developed model, observed variables are interconnected with arrows, representing the relationships between them., i.e., the observed variables such as convenience, feeder routes, route, fare cost reliability, and punctuality are linked to the latent variable FDO, indicating that these observed variables contribute to the overall construct of Facility Design and Operation. Similarly, variables including suitability, atmosphere, old age, safety, air conditioning, environment, and operation are connected to the latent variable EC, representing aspects related to Environment and Comfort. Additionally, service, behavior, PIS, and trip time are linked to the latent variable SI. Finally, entertainment, discount, sitting, and connectivity are linked to IA. Each observed variable is associated with a margin of error, which reflects the level of uncertainty or variability in the measurement of that variable. A larger margin of error indicates greater uncertainty in the measurement, while a smaller margin of error suggests more precise estimates. Overall, the model illustrates the complex interrelationships between various aspects of the data and provides a visual representation of how different observed variables contribute to the overall latent constructs. By examining these relationships, researchers can gain insights into the underlying factors influencing the responses and better understand the dynamics of public perceptions and preferences regarding public transportation facilities.
Table 6 provides insights into the standard estimates for each variable, along with their corresponding t-values and p-values, offering valuable information about their significance with daily travel. Beginning with the observed variable IA, the standard estimated value indicates a positive relationship with daily travel, with a t-value > 1.96 and a p-value < 0.05, meeting the criteria for statistical significance. This suggests that Instrumental and Attractive factors play a significant role in influencing individuals’ daily travel behavior. Other variables such as EC (t-value = −0.908, p-value = 0.364), SI (t-value = −1.859, p-value = 0.063), and age under thirty years (t-value = −2.414, p-value = 0.16) have a negative relationship with daily travel, and their t-value < 1.96 and p-value> 0.05 are not up to standard, implying that these variables did not significantly affect the likelihood of people daily traveling.
These results suggest that factors such as extreme weather conditions, service information, and age below thirty years may not significantly impact individuals’ likelihood of daily travel. Similarly, the variable FDO (t-value = 1.717, p-value = 0.86) exhibited a positive relationship with the daily variables, and the associated t < 1.96 and p-value > 0.05 do not meet the desired criteria for statistical significance; therefore, it is considered insignificant that it shows a positive relationship with daily travel, but its associated t-value and p-value do not meet the standard criteria for statistical significance, rendering it insignificant in explaining daily travel behavior. Further analysis reveals that variables such as participants who engage in private jobs without owning vehicles and have a lower monthly income (25,000–50,000) exhibit positive relationships with daily travel. These findings suggest that individuals in these demographic groups are more likely to engage in daily travel activities, possibly due to their reliance on public transportation services offered by the OLMRTS.
However, it is important to note that despite these variables having associations with daily travel, their statistical significance may vary, as evidenced by their respective t-values and p-values. Moreover, it is crucial to consider the broader context and potential confounding factors that may influence the relationship between these variables and daily travel behavior. Factors such as socioeconomic status, geographic location, and access to alternative transportation modes may also play a significant role in shaping individuals’ travel patterns. Additionally, values highlight the importance of conducting robust statistical analyses to accurately assess the significance of various factors in predicting daily travel behavior.

4.6. Exploring Factors Influencing Ridership in Underdeveloped Countries: Insights from Technical Interviews

Table 7 presents the outcomes of technical interviews conducted to identify primary factors influencing ridership in underdeveloped countries. Open-ended questions were posed to government representatives and private transport operators to solicit their perspectives on enhancing ridership. Descriptive statistics offer a comprehensive insight into diverse parameters affecting ridership satisfaction within the public transportation sector. The mean daily ridership stands at 2.00, reflecting a moderate level of ridership engagement. Conversely, the availability of park-and-ride facilities and connectivity exhibit mean scores of 1.50, indicating potential deficiencies in infrastructure provision. In contrast, reliability and time efficiency, alongside service quality, garner relatively higher mean ratings of 4.50 and 3.75, respectively, signifying positive perceptions within these dimensions. Existing fare policy and operation timing demonstrate moderate mean ratings of 3.50, suggesting areas amenable to optimization. The economical mode receives a mean score of 3.75, showcasing a favorable stance. Standard deviations and variances across factors indicate varying degrees of variability, underscoring the nuanced nature of ridership satisfaction. These findings collectively illuminate critical areas of strength and areas warranting targeted interventions to enhance the overall quality of the public transportation experience.

5. Discussion

The findings indicated a notable gender imbalance among respondents, with a majority being male. The gender disparity in representation could be influenced by the common role of females as housewives in Pakistan, which may limit their opportunities for extensive travel experiences compared to males. Among respondents who identified as students and were under 18 years old, there was a clear preference for using the Orange Line metro rail service due to its affordability and convenience for local travel. Respondents with higher monthly incomes and access to private vehicles showed less interest in public transportation options, often relying on their vehicles due to the flexibility they provide in reaching various destinations [16].
Public transport policies should be developed to specifically address the needs of lower- and middle-income individuals. These policies must prioritize affordability, accessibility, and convenience to ensure that transportation options are viable and attractive to this demographic. Findings suggested that people using the OLMRTS reach stations on foot. This indicates that the accessibility of the public transport system plays a crucial role in attracting more users. Another noteworthy finding highlighted that a majority of respondents prioritize time efficiency when choosing transportation options, favoring the Orange Line metro over other existing modes of travel. This suggests a shift in preferences towards time-saving services, with convenience outweighing purely economic considerations for many individuals in today’s society [51].
Additionally, a significant number of users expressed a preference for a distance-based fare system over a flat fare. The majority of these users indicated a desired fare of PKR 20 for traveling between two connected stations based on distance. This suggests that travelers value a fare structure that reflects the actual distance traveled, potentially offering a fairer and more equitable pricing model for their commuting needs [52].
The attribute called entertainment services shows a strong connection with the latent variable “EC”, indicating that travelers prefer having entertainment options while on board. Additionally, factors such as suitability in extreme weather conditions, passenger safety, and operational timing of the train also strongly correlate with this variable. This suggests that travelers are choosing public transport due to its early operating hours, reliability during extreme weather conditions, and high safety standards, which are important considerations for passengers.
Furthermore, passenger information systems and passenger services show a positive relationship with the latent variable “SI.” Travelers prioritize access to train timetables and other relevant information in advance to plan their trips effectively while at home. This highlights the importance of clear and accessible information systems and quality passenger services in influencing travelers’ choices and satisfaction with public transit services like the OLMRTS.
Factors such as convenience and reliability show a positive relationship with the latent variable “FDO”, indicating that daily travelers prioritize these aspects when selecting a transit facility. On the other hand, connectivity with feeder routes does not show a strong correlation with the latent variable “FDO”. This implies that most travelers do not prefer to use multiple modes of transportation for their daily commuting needs. The lack of emphasis on feeder routes suggests that travelers using public transportation prioritize direct and seamless journeys, minimizing the need for transfers or additional modes of transit during their daily travels [53].
In addition, it is important to note that for successful user choice, public transport must be reliable. Travelers are generally not attracted to public transport options that are perceived as unreliable. Therefore, reliability plays a critical role in influencing travelers’ decisions when selecting a mode of transportation, especially for daily commuting. This suggests that public transport is preferred by daily commuters due to its convenience and reputation for reliability [54].
These insights from the technical interview pave the way for targeted interventions to enhance overall public transportation experiences in these regions. The data highlight the need for changes, including a new fare structure, sufficient parking infrastructure for privately owned vehicles, and the addition of designated park-and-ride facilities at stations, to address the difficulties encountered by OLMRTS users. The traveler’s decision to use public transportation for their daily commute was negatively impacted by the flat fare system and the lack of adequate parking infrastructure for privately owned cars and motorcycles. A well-secured park-and-ride facility at the stations would help to draw in more customers, which would result in a significant rise in the number of riders. These improvements could result in a considerable rise in ridership and a modal shift towards more environmentally friendly modes of transportation, which would lessen traffic jams and urban air pollution.

6. Conclusions

This study explored the key factors affecting the daily ridership of Pakistan’s first Metro Rail Transit service. It offers new perspectives on the variables affecting ridership of rail transit systems in developing nations with limited resources and high population densities. The results confirmed the significant correlations between the observed variables and their respective latent variables.
The results revealed that the latent variables, i.e., EC and SI, demonstrated high reliability, with Cronbach’s alpha values exceeding 0.7. Conversely, FDO and IA exhibited moderate reliability, surpassing the threshold of 0.6. IA emerged as the key latent variable, exhibiting a positive relationship with daily ridership and significantly influencing the ridership of OLMRTS. Observed variables such as entertainment services and connectivity to the metro bus service were found to be key drivers shaping ridership, displaying strong correlations with IA.
FDO also showed a positive structural relationship with daily ridership, but its influence was not as pronounced as that of IA. However, significant correlations were observed between FDO and observed variables such as reliability and convenience. The latent variable EC has a negative structural relationship with daily travel. However, observed variables including suitability for extreme weather conditions and passenger safety exhibited strong correlations with EC, suggesting their significant impact on daily ridership. Similarly, SI also has a negative structural relationship with daily travel. Individuals employed in the private sector, those with a monthly income below PKR 50,000, and individuals with access to stations via private transportation means were found to play a direct and substantial role in shaping ridership patterns.
Additionally, the lack of discounted tickets and inadequate integration with existing mass transit systems were identified as deterrents to choosing the OLMRTS. The results also highlighted the impact of external factors such as gasoline prices on metro rail ridership. A significant increase in ridership was observed in response to rising fuel prices, indicating a potential shift towards more sustainable transportation options during periods of economic uncertainty.
Overall, the findings of this study provide valuable insights into the complex interplay of factors influencing ridership. By understanding these dynamics, policymakers and transportation planners can develop targeted interventions and strategies aimed at improving public transportation infrastructure, enhancing service quality, and promoting sustainable transportation options in urban areas.
Several limitations in this study need to be acknowledged. Firstly, this research solely focused on demographic factors and service quality parameters, neglecting external influences on travelers’ behavior. Secondly, the survey was confined to collecting opinions of travelers at OLMRTS station transit facilities and did not gather data on private transport use along the OLMRTS route. Despite these limitations, this research provides valuable insights for enhancing public transport efficiency in developing countries characterized by high population density and limited resources.
Future studies may assess the effectiveness of the OLMRTS route alignment and connectivity with feeder routes by assessing factors such as passenger volume, travel times, and overall public satisfaction with the system. Although there are certain limitations, the findings of this research offer valuable insights into the factors influencing public transport ridership, particularly in developing countries with inadequate connectivity to existing transport infrastructure.

Author Contributions

Conceptualization, M.A. and N.A.; methodology, M.A., I.A. and M.I.Y.; formal analysis, N.A.; investigation, I.A., M.I.Y. and M.A.J.; resources, M.A.; writing—original draft, I.A., M.A.J. and N.A.; writing—review & editing, I.A., M.I.Y. and T.C.; visualization, G.T. and T.C.; supervision, T.C.; funding acquisition, G.T. All authors have read and agreed to the published version of the manuscript.

Funding

This research received no external funding.

Institutional Review Board Statement

Ethical review and approval were waived for this study due to this study being a non-interventional study that did not involve biological human experiments and patient data. In addition, this study was completely voluntary and non-coercive, and responses remain anonymous.

Informed Consent Statement

Informed consent was obtained from all subjects involved in the study.

Data Availability Statement

The data can be made available upon request from corresponding authors.

Conflicts of Interest

The authors declare no conflict of interest.

References

  1. Mead, L. The road to sustainable transport. Int. Inst. Sustain. Dev. 2021, 5, 2021-05. [Google Scholar]
  2. Li, Z.; Gao, F.; Xiao, C.; Tang, J. The effects of the urban built environment on public transport ridership: Similarities and differences. Travel Behav. Soc. 2023, 33, 100630. [Google Scholar] [CrossRef]
  3. Zannat, K.E.; Laudan, J.; Choudhury, C.F.; Hess, S. Developing an agent-based microsimulation for predicting the Bus Rapid Transit (BRT) demand in developing countries: A case study of Dhaka, Bangladesh. Transp. Policy 2024, 148, 92–106. [Google Scholar] [CrossRef]
  4. Moreno-Monroy, A.I.; Schiavina, M.; Veneri, P. Metropolitan areas in the world. Delin. Popul. Trends. J. Urban Econ. 2021, 125, 103242. [Google Scholar] [CrossRef]
  5. Zavareh, M.F.; Mehdizadeh, M.; Nordfjærn, T. Active travel as a pro-environmental behaviour: An integrated framework. Transp. Res. Part D Transp. Environ. 2020, 84, 102356. [Google Scholar] [CrossRef]
  6. Ruiz-Meza, J.; Montoya-Torres, J.R. Tourist trip design with heterogeneous preferences, transport mode selection and environmental considerations. Ann. Oper. Res. 2021, 305, 227–249. [Google Scholar] [CrossRef] [PubMed]
  7. Arif, M.M.; Ahmad, S.R.; Abubakar, M. Impacts of air pollution on human health in Lahore city, Pakistan: A review. Glob. Res. J. Nat. Sci. Technol. 2023, 1, 39–48. [Google Scholar]
  8. Bajwa, A.U.; Sheikh, H.A. Contribution of Road Transport to Pakistan’s Air Pollution in the Urban Environment. Air 2023, 1, 237–257. [Google Scholar] [CrossRef]
  9. Nadeem, M.; Aziz, A.; Al-Rashid, M.A.; Tesoriere, G.; Asim, M.; Campisi, T. Scaling the potential of compact city development: The case of Lahore, Pakistan. Sustainability 2021, 13, 5257. [Google Scholar] [CrossRef]
  10. Chan, H.-Y.; Chen, A.; Li, G.; Xu, X.; Lam, W. Evaluating the value of new metro lines using route diversity measures: The case of Hong Kong’s Mass Transit Railway system. J. Transp. Geogr. 2021, 91, 102945. [Google Scholar] [CrossRef]
  11. Lin, D.; Broere, W.; Cui, J. Metro systems and urban development: Impacts and implications. Tunn. Undergr. Space Technol. 2022, 125, 104509. [Google Scholar] [CrossRef]
  12. Graham, D.J.; Carbo, J.M.; Anderson, R.J.; Bansal, P. Understanding the costs of urban rail transport operations. Transp. Res. Part B Methodol. 2020, 138, 292–316. [Google Scholar]
  13. Jenelius, E.; Cebecauer, M. Impacts of COVID-19 on public transport ridership in Sweden: Analysis of ticket validations, sales and passenger counts. Transp. Res. Interdiscip. Perspect. 2020, 8, 100242. [Google Scholar]
  14. Thommen, C.; Hintermann, B. Price versus Commitment: Managing the demand for off-peak train tickets in a field experiment. Transp. Res. Part A Policy Pract. 2023, 174, 103691. [Google Scholar] [CrossRef]
  15. Ceder, A. Urban mobility and public transport: Future perspectives and review. Int. J. Urban Sci. 2021, 25, 455–479. [Google Scholar] [CrossRef]
  16. Guzman, L.A.; Hessel, P. The effects of public transport subsidies for lower-income users on public transport use: A quasi-experimental study. Transp. Policy 2022, 126, 215–224. [Google Scholar] [CrossRef]
  17. Mehmood, U. Transport energy consumption and carbon emissions: The role of urbanization towards environment in SAARC region. Integr. Environ. Assess. Manag. 2021, 17, 1286–1292. [Google Scholar] [CrossRef] [PubMed]
  18. Adams, S.; Boateng, E.; Acheampong, A.O. Transport energy consumption and environmental quality: Does urbanization matter? Science of The Total Environment 2020, 744, 140617. [Google Scholar] [CrossRef]
  19. Ibraeva, A.; de Almeida Correia, G.H.; Silva, C.; Antunes, A.P. Transit-oriented development: A review of research achievements and challenges. Transp. Res. Part A Policy Pract. 2020, 132, 110–130. [Google Scholar] [CrossRef]
  20. Hasselwander, M.; Bigotte, J.F.; Antunes, A.P.; Sigua, R.G. Towards sustainable transport in developing countries: Preliminary findings on the demand for mobility-as-a-service (MaaS) in metro Manila. Transp. Res. Part A Policy Pract. 2022, 155, 501–518. [Google Scholar] [CrossRef]
  21. Anwar, A.; Leng, H.; Ashraf, H.; Haider, A. Measuring the Transit-Oriented Development (TOD) Levels of Pakistani Megacities for TOD Application: A Case Study of Lahore. Sustainability 2024, 16, 2209. [Google Scholar] [CrossRef]
  22. Diab, E.; DeWeese, J.; Chaloux, N.; El-Geneidy, A. Adjusting the service? Understanding the factors affecting bus ridership over time at the route level in Montréal, Canada. Transportation 2021, 48, 2765–2786. [Google Scholar] [CrossRef]
  23. Gonzalez, J.N.; Perez-Doval, J.; Gomez, J.; Vassallo, J.M. What impact do private vehicle restrictions in urban areas have on car ownership? Empirical evidence from the city of Madrid. Cities 2021, 116, 103301. [Google Scholar] [CrossRef]
  24. Guzman, L.A.; Cardona, S.G. Density-oriented public transport corridors: Decoding their influence on BRT ridership at station-level and time-slot in Bogotá. Cities 2021, 110, 103071. [Google Scholar] [CrossRef]
  25. Oviedo, D.; Granada, I.; Perez-Jaramillo, D. Ridesourcing and travel demand: Potential effects of transportation network companies in Bogotá. Sustainability 2020, 12, 1732. [Google Scholar] [CrossRef]
  26. Alom, M.M. Transit Ridership of Dhaka Metro Rail: Understanding the Views of Prospective Users. Bangladesh J. Public Adm. 2022, 30, 13–28. [Google Scholar] [CrossRef]
  27. Mandhani, J.; Nayak, J.K.; Parida, M. Interrelationships among service quality factors of Metro Rail Transit System: An integrated Bayesian networks and PLS-SEM approach. Transp. Res. Part A Policy Pract. 2020, 140, 320–336. [Google Scholar] [CrossRef]
  28. He, Y.; Zhao, Y.; Tsui, K.-L. Geographically modeling and understanding factors influencing transit ridership: An empirical study of Shenzhen metro. Appl. Sci. 2019, 9, 4217. [Google Scholar] [CrossRef]
  29. Gan, Z.; Yang, M.; Feng, T.; Timmermans, H.J.P. Examining the relationship between built environment and metro ridership at station-to-station level. Transp. Res. Part D Transp. Environ. 2020, 82, 102332. [Google Scholar] [CrossRef]
  30. Loa, P.; Mashrur, S.M.; Nurul Habib, K. What influences the substitution of ride-sourcing for public transit and taxi services in Toronto? An exploratory structural equation model-based study. Int. J. Sustain. Transp. 2023, 17, 15–28. [Google Scholar] [CrossRef]
  31. Siyal, A.W.; Chen, H.; Chen, G.; Memon, M.M.; Binte, Z. Structural equation modeling and artificial neural networks approach to predict continued use of mobile taxi booking apps: The mediating role of hedonic motivation. Data Technol. Appl. 2021, 55, 372–399. [Google Scholar] [CrossRef]
  32. Etminani-Ghasrodashti, R.; Ketankumar Patel, R.; Kermanshachi, S.; Rosenberger, J.M.; Foss, A. Modeling users’ adoption of shared autonomous vehicles employing actual ridership experiences. Transp. Res. Rec. 2022, 2676, 462–478. [Google Scholar] [CrossRef]
  33. Kim, J.; Lee, S. Determining factors affecting public bike ridership and its spatial change before and after COVID-19. Travel Behav. Soc. 2023, 31, 24–36. [Google Scholar] [CrossRef]
  34. Ali, N.; Javid, M.A.; Rahim, A. Predicting Transit Mode Choice Behavior from Parents’ Perspectives: A Case Study in Lahore, Pakistan. Jordan J. Civ. Eng. 2020, 14, 476–489. [Google Scholar]
  35. Hakimi Ibrahim, A.N.; Borhan, M.N.; Mat Yazid, M.R.; Rahmat, R.A.; Yukawa, S. Factors Influencing Passengers’ Satisfaction with the Light Rail Transit Service in Alpha Cities: Evidence from Kuala Lumpur, Malaysia Using Structural Equation Modelling. Mathematics 2021, 9, 1954. [Google Scholar] [CrossRef]
  36. Yang, L.; Chen, W.; Wu, F.; Li, Y.; Sun, W. State-guided city regionalism: The development of metro transit in the city region of Nanjing. Territ. Politics Gov. 2023, 11, 1459–1479. [Google Scholar] [CrossRef]
  37. Sanchez-Atondo, A.; Garcia, L.; Calderon-Ramirez, J.; Gutiérrez-Moreno, J.M.; Mungaray-Moctezuma, A. Understanding public transport ridership in developing countries to promote sustainable urban mobility: A case study of Mexicali, Mexico. Sustainability 2020, 12, 3266. [Google Scholar] [CrossRef]
  38. Linovski, O.; Manaugh, K.; Baker, D.M. The route not taken: Equity and transparency in unfunded transit proposals. Transp. Policy 2022, 122, 77–84. [Google Scholar] [CrossRef]
  39. He, Y.; Zhao, Y.; Tsui, K.L. Modeling and Analyzing Modeling and Analyzing Impact Factors of Metro Station Ridership: An Approach Based on a General Estimating Equation Factors Influencing Metro Station Ridership: An Approach based on General Estimating Equation. IEEE Intell. Transp. Syst. Mag. 2020, 12, 195–207. [Google Scholar] [CrossRef]
  40. Iqbal, A.; Rehman, Z.U.; Ali, S.; Ullah, K.; Ghani, U. Road traffic accident analysis and identification of black spot locations on highway. Civ. Eng. J. 2020, 6, 2448–2456. [Google Scholar] [CrossRef]
  41. Tariq, A.; Mumtaz, F. Modeling spatio-temporal assessment of land use land cover of Lahore and its impact on land surface temperature using multi-spectral remote sensing data. Environ. Sci. Pollut. Res. 2023, 30, 23908–23924. [Google Scholar] [CrossRef]
  42. Herath, P.; Dharmarathna, W.; Wickramasinghe, W.; Edirisinghe, A. Travel Behaviour Analysis and Exploration of Mode Choice Variability of Short-Distance Travellers. Eng. J. Inst. Eng. Sri Lanka 2023, 56, 51–62. [Google Scholar] [CrossRef]
  43. Ha, S.-T.; Ibrahim, W.H.W.; Lo, M.-C.; Mah, Y.-S. Factors Affecting Satisfaction and Loyalty in Public Transport using Partial Least Squares Structural Equation Modeling (PLS-SEM). Artic. Int. J. Innov. Technol. Explor. Eng. 2019, 8, 569–575. [Google Scholar] [CrossRef]
  44. Ashraf Javid, M.; Abdullah, M.; Ali, N.; Dias, C. Structural equation modeling of public transport use with COVID-19 precautions: An extension of the norm activation model. Transp. Res. Interdiscip. Perspect. 2021, 12, 100474. [Google Scholar] [CrossRef]
  45. Hu, L.T.; Bentler, P.M. Cutoff criteria for fit indexes in covariance structure analysis: Conventional criteria versus new alternatives. Struct. Equ. Model. A Multidiscip. J. 1999, 6, 1–55. [Google Scholar] [CrossRef]
  46. Marsh, H.W.; Hau, K.-T.; Wen, Z. In search of golden rules: Comment on hypothesis-testing approaches to setting cutoff values for fit indexes and dangers in overgeneralizing Hu and Bentler’s (1999) findings. Struct. Equ. Model. 2004, 11, 320–341. [Google Scholar] [CrossRef]
  47. Shahid, A.; Ansub, M.; Hafeez, A.; Saleem, H.; Basharat, A. Socio-Economic Impacts of Transit Projects (A Case Study of Orange Line Lahore). Saudi J. Civ. Eng. 2020, 4, 161–169. [Google Scholar] [CrossRef]
  48. Hassan, M.M. Determinants of Customers Satisfaction in Orange Line Train, Lahore, Determinants of Customers Satisfaction in Orange Line Train, Lahore, Pakistan; BS Project In Statistics COMSATS University Islamabad, Lahore Campus: Lahore, Pakistan, 2021. [Google Scholar]
  49. Tang, T.; Gu, Z.; Yang, Y.; Sun, H.; Chen, S.; Chen, Y. A data-driven framework for natural feature profile of public transport ridership: Insights from Suzhou and Lianyungang, China. Transp. Res. Part A Policy Pract. 2024, 183, 104049. [Google Scholar] [CrossRef]
  50. Goretzko, D.; Siemund, K.; Sterner, P. Evaluating model fit of measurement models in confirmatory factor analysis. Educ. Psychol. Meas. 2024, 84, 123–144. [Google Scholar] [CrossRef]
  51. Chowdhury, S.; Ceder, A.A.; Schwalger, B. The effects of travel time and cost savings on commuters’ decision to travel on public transport routes involving transfers. J. Transp. Geogr. 2015, 43, 151–159. [Google Scholar] [CrossRef]
  52. Saharan, S.; Bawa, S.; Kumar, N. Dynamic pricing techniques for Intelligent Transportation System in smart cities: A systematic review. Comput. Commun. 2020, 150, 603–625. [Google Scholar] [CrossRef]
  53. Zhu, Z.; Qin, X.; Ke, J.; Zheng, Z.; Yang, H. Analysis of multi-modal commute behavior with feeding and competing ridesplitting services. Transp. Res. Part A Policy Pract. 2020, 132, 713–727. [Google Scholar] [CrossRef]
  54. Sinha, S.; Swamy, H.S.; Modi, K. User perceptions of public transport service quality. Transp. Res. Procedia 2020, 48, 3310–3323. [Google Scholar] [CrossRef]
Figure 1. The 26 stations are shown along the Orange Line Metro Rail Transit System route from where the passenger satisfaction surveys were conducted (source: Wikipedia).
Sustainability 16 04426 g001
Figure 2. Daily OLMRTS ridership spanning January to August 2022, showcasing the fluctuating trends in ridership levels over the first eight months of the year (data source: PMA, compiled by author).
Sustainability 16 04426 g002
Figure 3. Minimum fare suggested by the users of Orange Line Metro Rail Transit between two consecutive stations transit.
Sustainability 16 04426 g003
Figure 4. Traveler’s preferences regarding types of fare system to be implemented.
Sustainability 16 04426 g004
Figure 5. Key factors that influence the shift of passengers from other modes to OLMRTS.
Sustainability 16 04426 g005
Figure 6. Ridership vs. fuel price comparison (source: OGRA).
Sustainability 16 04426 g006
Figure 7. Developed SEM model (source: Author).
Sustainability 16 04426 g007
Table 1. Prior research on factors affecting ridership in developed and developing nations.
AuthorsResearch GapSampleAnalysis MethodConclusion
[26]Focused on metro rail systems, user travel patterns, attitudes, and similar factors affecting ridership625 users from the Dhaka metro railQualitative analysis
Cross-sectional survey
The inconsistency between regression analysis and the existing theoretical framework suggests that the study was conducted during the metro rail’s construction phase. Discrepancies such as walkable footprint, transfer services, and the inclusion of female-only coaches were noted. Importantly, fare amounts emerged as a critical determinant of ridership.
[23]How urban transport policies, like car-restriction measures, affect people’s decisions about owning a carA total of 28,794 households were surveyedEmpirical analysis Multilevel Ordered Logit ModelBuilt environment factors play a significant role in shaping car ownership trends in Madrid. Policies aimed at discouraging private vehicle use have a deterrent effect on households’ car purchasing decisions. Transport policies implemented in Madrid have a notable impact on trends in car ownership.
[16]Long-term effectiveness of public transport subsidies, to focus on the impact of subsidies on the ridership of low-income individualsThe survey included 361,744 individuals with Sisben iii scoresQuasi-experimental studyThe public transport subsidy in Bogotá has a positive effect on the total number of trips made. Over time, the effect of the subsidy on trips has decreased, particularly noticeable on weekends. There are challenges in identifying the causes of changes in public transport demand.
[35]Investigates the utilization of the LRT system to examine the factors influencing passenger satisfaction with light rail transit serviceThe study encompassed 417 responses from LRT passengers in Kuala LumpurStructural Equation ModellingPassenger expectation, perceived quality, and perceived value impact satisfaction. The study enhances theoretical and managerial aspects of passenger satisfaction.
[39]Spatiotemporal factors affecting longitudinal station-level ridership to propose a novel data-driven method for estimating metro ridership108General Estimating Equation (GEE) modelThe GEE model is superior to OLS for capturing temporal factors. The autoregressive structure is recommended for observations collected at different time points.
[13]Examining the impact of COVID-19 on public transport ridership in SwedenData were collected from three regions in Sweden: Stockholm, Vastra Gotaland, and SkaneUtilized disaggregated ticket validation data for the analysis of public transport ridershipPublic transport ridership in Sweden experienced a significant decline during the COVID-19 pandemic. The decrease in ridership can be attributed to a decline in the number of active public transport users. During the pandemic, there was a shift from monthly tickets to single tickets among travelers.
[33]Analysis of factors influencing public bike ridership before and after the outbreak by delving into the repercussions of COVID-19 on public bike ridership in SeoulThe study analyzed 1473 observationsConducting origin-destination analysis and spatial regression modeling using public bike ridership dataPublic parks and subway stations have a notable influence on public bike ridership. Improved accessibility to bike lanes correlates with an increase in public bike ridership.
Policy recommendations are proposed to encourage public bike ridership during the COVID-19 pandemic.
[27]The research specifically targets service quality aspects through service quality models of metro Rail Transit, aiming to enhance them to attract a larger passenger base2390 passengersIntegrated Bayesian Networks and Partial Least Squares Structural Equation ModellingPassenger ease emerges as the most influential factor in determining overall service quality. Amenities rank lowest in terms of their influence on overall service quality. The OSQ index suggests moderate passenger satisfaction with the Delhi metro. The study offers insights for improving service quality to enhance metro transit ridership. Hidden interrelationships among service quality factors are identified to develop effective improvement strategies.
[25]Explored shifts in travel demand resulting from Transportation Network Companies in Bogotá, Colombia1732 surveys in BogotaMode choice model with utility maximization protocol using mixed logitApproximately one-third of public transportation trips may shift to TNCs. Taxi and private vehicle-transferred trips contribute to new TNC demand. Half of reallocated trips from public transport are complementary.
The increase in vehicle km traveled post-substitution ranges from 1.3 to 14.5 times.
[14]The study investigates train ticket pricing and demand management, analyzing the effects of pricing and timing strategies on ticket sales11,490 observationsEmployed Latin squares approach for evaluating outcomes of different sales settingsInvestigated the impact of changes in train ticket characteristics on demand for long-distance trains. Field experiment data yielded more credible results compared to existing studies. Conducted a direct comparison of the effects of price and pre-sale deadline on ticket sales.
[3]Implementation of agent-based microsimulation tools in predicting Bus Rapid Transit (BRT) demand1016 surveysDemand forecasting model for BRT using MATSimAgent-based simulation tools predict Bus Rapid Transit (BRT) demand influenced by travel factors. BRT demand is highest with multi-modal access/egress connections. The absence of agent-based models in developing countries impacts transport effectiveness. The base model indicates that public transport and non-motorized transport dominate trips.
Table 2. Distribution of demographic and socioeconomic attribution of travelers.
AttributesCategoriesDistribution (%)No. of Respondents
GenderMale68680
Female32320
Age (Years)under 182.828
18–3085.6856
31–458.888
46–652.222
Above 650.66
QualificationPrimary education3.131
Secondary school4.343
Higher secondary school14.7147
Bachelor’s degree54.4544
Master’s degree23.5235
ProfessionStudent44.4444
Private employee38.1381
Government employees6.666
Self-business10.9109
Monthly incomeUnder 25,00048.7487
25,000–50,00029.1291
50,000–100,00016.1161
Above 100,0006.161
Vehicle ownershipYes47470
No53530
Access to Orange Line stationBy walk33.5335
Bicycle3.535
Motorbike28280
Car8.383
Shared Vehicle1.818
Qingqi/Rickshaw15.4154
Metrobus/Speedo5.353
Others4.242
Travel frequencyOccasionally39.3393
Daily42.9429
Weekly9.494
Monthly8.484
Table 3. Mean and standard deviation score of variables.
Observed and Latent VariablesMean ScoreStandard Deviation (SD)
Environment and Comfort (EC)1.5630.738
Are you finding the orange train suitable in extreme weather conditions?
Is the traveling environment conducive to travel?1.7550.797
Do you think the Orange Line train is suitable for the elderly citizen?1.7720.827
Do you believe the orange line ensures passenger safety?1.6150.788
Are you satisfied with the train’s air conditioning?1.550.771
Do you think the train service is environmentally friendly?1.9090.89
Are you satisfied with the current train operation timing?1.7310.741
Facility Design and Operation (FDO)1.60.648
Do you think the train service is convenient?
Are you satisfied with feeder bus access to Orange Line stations?2.1430.996
Are you satisfied with the details on the train route map?1.6410.804
Are you satisfied with the current fare costs for traveling?1.6510.733
Do you believe that the Orange Line provides reliable service?1.6760.712
Are you satisfied with the Orange Line train’s punctuality?1.4090.6
Service and information (SI)1.7770.863
Are you satisfied with the passenger service on the Orange Line train?
Are you satisfied with the station staff’s behavior?1.7070.856
Are you satisfied with the passenger information system of the Orange Line train?1.910.835
Does the orange line provide you with trip time information?1.490.727
Instrumental and Attractive (IA)2.7161.177
Are you satisfied with the train entertainment service?
Do you think discounted tickets are available for travelers?3.261.281
Is there seating available at the station for daily commuters?3.271.409
Are you satisfied with the Orange Line train and metro bus connectivity?2.2671.06
Table 4. Observed variables for factor loading and Cronbach alpha values.
Latent VariablesObserved VariablesFactor LoadingCronbach’s Alpha
Environment and Comfort (EC)Suitability in extreme weather conditions0.7530.814
Traveling atmosphere0.643
Old age people friendly0.636
Passenger safety0.633
Air-conditioned quality0.606
Environmentally friendly0.597
Current train operation timing0.580
Facility Design and Operation (FDO)Convenience0.6550.613
Access to feeder routes0.609
Route map information0.609
Fare cost0.560
Reliability0.557
Punctuality of train0.557
Service and Information (SI)Passenger service at the station0.7290.699
Station staff behavior0.721
Passenger information system0.605
Trip time information0.521
Instrumental and Attractive (IA)Entertainment service0.7150.626
Discounted ticket availability0.665
Sitting arrangements at the station0.628
Connectivity to metro bus0.550
Table 5. SEM model fit summary.
Fit IndexModel Value
CMIN/Df6.241
Comparative Fit Index0.754
Goodness of Fit Index (GFI)0.874
Adjusted Goodness of Fit Index (AGFI)0.847
Root mean square of approximation (RMSEA)0.072
Root mean square residual (RMSR)0.047
Table 6. Observed variable standard estimates along with t and p-value.
Hypothesized RelationshipStandard Estimatest Valuep-ValueRemarks
Instrumental and Attractive → Daily travel0.0912.0980.036Significant
Vehicle ownership → Daily travel0.1514.935***Significant
Monthly income under fifty thousand → Daily travel0.0742.3240.02Significant
Private employees → Daily travel0.1735.265***Significant
Access to Orange Line station through private vehicle → Daily travel0.1213.799***Significant
Environment and Comfort → Daily travel−0.063−0.9080.364Insignificant
Service and Information → Daily travel−0.145−1.8590.063Insignificant
Age under thirty years → Daily travel−0.074−2.4140.16Insignificant
Facility Design and Operation → Daily travel0.1121.7170.86Insignificant
*** p < 0.001.
Table 7. Descriptive analysis of technical interviews.
QuestionsNMeanStd. DeviationVariance
Daily Ridership42.000.8160.667
Availability of Park and Ride facility41.500.5770.333
Existing fare policy43.501.0001.000
Reliability and time efficiency44.500.5770.333
Economical mode43.750.5000.250
Connectivity41.500.5770.333
Service Quality43.750.5000.250
Operation timing43.500.5770.333
Smart Metro Card42.000.8160.667
Disclaimer/Publisher’s Note: The statements, opinions and data contained in all publications are solely those of the individual author(s) and contributor(s) and not of MDPI and/or the editor(s). MDPI and/or the editor(s) disclaim responsibility for any injury to people or property resulting from any ideas, methods, instructions or products referred to in the content.

