Article

Impact of Plant Layout on Microclimate of Summer Courtyard Space Based on Orthogonal Experimental Design

1
College of Landscape Architecture and Art, Fujian Agriculture and Forestry University, 15 Shangxiadian Rd., Fuzhou 350002, China
2
College of Architecture and Urban Planning, Tongji University, Shanghai 200092, China
*
Author to whom correspondence should be addressed.
Sustainability 2024, 16(11), 4425; https://doi.org/10.3390/su16114425
Submission received: 9 April 2024 / Revised: 4 May 2024 / Accepted: 21 May 2024 / Published: 23 May 2024

Abstract

:
With the rapid development of urbanization and industrialization, many green spaces have been replaced by urban buildings, resulting in decreased green spaces in courtyard space. Nonetheless, as an enclosed green space integrated with the natural environment, courtyard space plays a vital role in regulating environmental microclimate, so it is necessary to study its microclimate through vegetation greening. Therefore, this study took courtyard spaces in humid and hot areas as an example, and with the help of ENVI-met 5.5.1 software, introduced an orthogonal experimental design to simulate various plant layout models, including tree layout (TL), shrub layout (SL), grass layout (GL), and the interaction of their combined layout, and analyzed the simulation results of temperature, humidity, and wind speed. The results show that first of all, plant layout plays a crucial role in cooling and wind control, and the more uniform the plant layout, the better it is for cooling and ventilation. Secondly, plant layout showed a changing pattern of cooling and wetting in the morning, noon, and afternoon periods. Furthermore, TL had the best cooling and humidifying effect in the morning and midday, and the combined interaction of TL, SL, and GL and of SL and GL significantly affected the wind speed in the courtyard space. During the afternoon, the combined interaction of TL with SL and SL with GL outperformed the single-plant-element type of layout regarding cooling and humidification efficiency. Finally, scattered-form tree layout, single-form shrub layout, and 20% grass layout were the best combinations of plant layout for cooling, humidity reduction, and ventilation. The results provide reference data and an empirical case for the microclimate optimization of summer courtyard spaces.

1. Introduction

As an organic part of traditional siheyuan architecture [1], courtyard space is surrounded by surrounding buildings or structures to form an enclosed green space integrated with the natural environment [2], which is famous for its ability to regulate the environmental microclimate [3,4]. However, with the rapid development of urbanization, many green spaces are constantly being replaced by urban buildings, and green spaces in the courtyard space are also constantly being reduced and replaced by artificial materials such as asphalt, concrete, and other hard pavement [5]. Therefore, optimizing courtyard space through vegetation greening is significant for enhancing the microclimate of buildings’ outdoor spaces and improving environmental sustainability.
Previous studies on the microclimate of courtyards have mainly been conducted through the influence of architectural and landscape elements. In terms of architecture, it mainly focuses on the geometric shape [6], size and proportion [7], and orientation [8] of buildings. However, in terms of landscape elements, the influence of vegetation landscape elements on the microclimate of courtyard space is mainly studied. First, initial studies by Vaezizadeh [9] and Soflaei et al. [10] have demonstrated the capacity of trees and shrubs to significantly lower temperatures and enhance humidity within courtyard spaces. Building upon this foundation, Meili [11] and Yang [12] further explored the comparative effectiveness of trees versus grass in augmenting thermal comfort. Their findings point to the superior cooling capabilities of trees relative to grass. Secondly, with the increasing research on the ecological benefits of plants, more and more scholars have begun to explore the influence of plant landscape elements from the perspective of spatial layout. Han et al. [1] emphasized that reasonable adjustment of plant layout can significantly improve the potential of temperature reduction and wind control in courtyard spaces. Further, Zhao et al. [13] explored the layout of trees with different spacing. They found that equidistant placement of trees can promote air circulation and reduce shadow overlap, thus forming the best microclimate. Abdi et al. [14] explored different designs of tree layout. They found that the best tree layout in northwest Iran was the rectangular layout of evergreen trees and deciduous trees planted in the inner row at an angle of 90 degrees to the prevailing wind. Zolch et al. [15] explored the layout of trees with different sun orientations and pointed out that the layout of trees on the sunny side can provide the most effective cooling. Although there have been many studies exploring plant layout, there are still fewer studies focusing on courtyard space, and typical vegetation greening configurations in courtyard space are mainly dominated by shrubs and grasses, with relatively few tree configurations; however, trees have mainly dominated previous studies on plant layout, and there is a lack of studies that consider the layout of shrubs and grasses. Therefore, clarifying the differences between the layout combinations of trees, shrubs, and grasses on the microclimate regulation ability of courtyard space can help planners scientifically and effectively develop microclimate quality improvement programs. Finally, based on the review of previous studies on the regulation of the microclimate by trees, shrubs, and grasses, it is found that there are complex interactions among the three of them that affect the microclimate [16,17], and different combinations and pairings will affect their regulation of the microclimate individually [18,19,20,21,22]. For example, the shade of trees will shade the grass, affecting the cooling of the grass and the consumption of water [23]; shrubs will reduce wind speeds under the crown height of trees [24]. In summary, plants can regulate the microclimate by changing their own biochemical or physical properties and the form of their layout. Currently, most of the research mainly focuses on how plants modify the microclimate through their respective biochemical or physical properties, leading to a gradual saturation of research in this field. In addition, most existing studies only consider the impact of a single-plant change on the microclimate [25,26,27], ignoring the coordination and collective effects among different plants. Therefore, it would be more conducive to strengthening the ability of plants to regulate the microclimate if the planting design of trees, shrubs, herbs, and their combined interaction was comprehensively considered in the greening design. In addition, given that our study i located within a courtyard space, surrounded by a uniform building structure, biochemical or physical interactions between different plant types were susceptible to interference by building shadows [3,28]. Therefore, it is more suitable to explore the influence of different plant layouts on its microclimate in the study of courtyard space.
In the past, the most commonly used research methods for studying the urban microclimate were fixed-point measurements [29] and numerical simulation [30]. However, with the rapid development of computer technology, numerical simulation is more convenient and efficient than fixed-point measurements. It can realize the simulation prediction that the measurement cannot accomplish through the user’s design of the site’s spatial characteristics; so, numerical simulation has become the mainstream microclimate research method. Various models based on RANS modeling calculations are available for urban microclimate applications [31], for example, FLUENT [32], OpenFOAM [33], Star-CCM [34], and ENVI-met [30]. Among them, ENVI-met has a greater mesh size, a higher mesh resolution, and more flow field details than other simulation methods, which can effectively manage the complex energy balance of various surfaces and dynamically couple water, plant, soil, and atmospheric processes [31,35,36,37,38]. Moreover, the latest version can better solve the influence of multi-object interaction on numerical simulation and provide more accurate results for numerical simulation [39]. Most previous ENVI-met-related studies have focused on subtropical humid climates, and between 2015 and 2024, many scholars (such as Ghaffarianhoseini [40], Forouzandeh [38], Liu [39], etc.) used ENVI-met to explore the microclimate of courtyard space in hot and humid areas, and confirmed that ENVI-met can provide accurate simulation results. In general, in numerical simulation with ENVI-met, it is necessary to calibrate and verify the results through field measurements [41]. Common calibration variables include air temperature, relative humidity, wind speed, and average radiation temperature. In the study of Vuckovic et al. [42], it was noted that outdoor air temperature and relative humidity as calibration variables can significantly improve the accuracy of simulation results. In the study of Xu [43] et al., air temperature, relative humidity, and wind speed were used to verify that the simulation results of ENVI-met could accurately reflect the site’s microclimate. Chen [44] and Andreou [45] et al. pointed out that the use of average radiation temperature to adjust the outdoor comfort model is prone to be affected by wind speed and solar radiation, and the simulation results are prone to error. It can be concluded that air temperature, relative humidity, and wind speed are the best calibration variables.
Orthogonal experimental design is a multifactorial, multilevel research methodology that selects representative points from a comprehensive array of experiments based on their orthogonal properties [46]. This approach allows representative cases to be extracted from a more comprehensive set, enabling researchers to conclude a limited but significant subset of experiments. In addition to this, another advantage of the method is the ability to easily weigh non-quantitative variables (e.g., layout structure) for comparison. Orthogonal experiments have been widely used in the field of built environments. For example, Yang et al. [47] developed 25 mathematical models for temperature, humidity, wind speed, and metabolic rate using orthogonal experiments and multivariate regression analyses. Chen [48] and others used this method to design 27 experimental scenarios in order to compare the extent of and differences in the influence of different landscape elements, such as vegetation, water bodies, and underlying surface, on the thermal environment of a residential area in Lhasa. Li et al. [49] applied an orthogonal experimental design to assess the effects of six factors on the thermal environment of a subway station through only 18 simulations, significantly reducing the 1458 tests required initially. This shows that the orthogonal design of experiments is an efficient and widely applicable design method in various scientific disciplines, especially for experiments that simulate predictions of scenarios. Nevertheless, there are often differences and limitations in considering non-interaction and interaction effects in orthogonal experimental designs [50]. Specifically, the choice of whether to consider interactions depends heavily on the specific objectives of the study. For example, when studying the influence of the layout of trees, shrubs, and grasses on the microclimate, previous studies have shown that trees, shrubs, and grasses will affect each other’s effect on regulating the microclimate [17], so interaction needs to be considered. However, this often increases the complexity of experimental design and configuration, and too many interactions will increase the error of the experimental results to a certain extent [51]. Therefore, to avoid these problems, allocating enough blank columns to minimize errors with the help of accurate test equipment and suitable orthogonal test design tables is necessary.
To sum up, there still needs to be a more systematic understanding of how the tree, shrub, and grass plant layout and their combined interaction can improve the microclimate of courtyard space. In this study, considering the complex interactions between trees, shrubs, and grass, 27 plant layout models were established through orthogonal experimental design, effectively reducing the number of experimental designs and shortening the experimental time. Temperature, humidity, and wind speed were simulated for 27 plant layouts using ENVI-met 5.5.1 software. Taking the courtyard space of a university in a humid and hot area as the research area, the primary purpose was to explore how to effectively use the comprehensive effect of plant layout to improve the microclimate of summer courtyard spaces. Specifically, the following questions need to be answered:
What is the potential of plant layout to improve the microclimate of summer courtyard spaces?
What is the variation rule of the influence of plant layout on the microclimate of summer courtyard spaces in different periods?
How does the arrangement of trees, shrubs, and herbs and their combined interaction affect the microclimate of summer courtyard spaces?
What is the best combination of plant layouts in summer courtyard spaces in hot and humid areas?

2. Materials and Methods

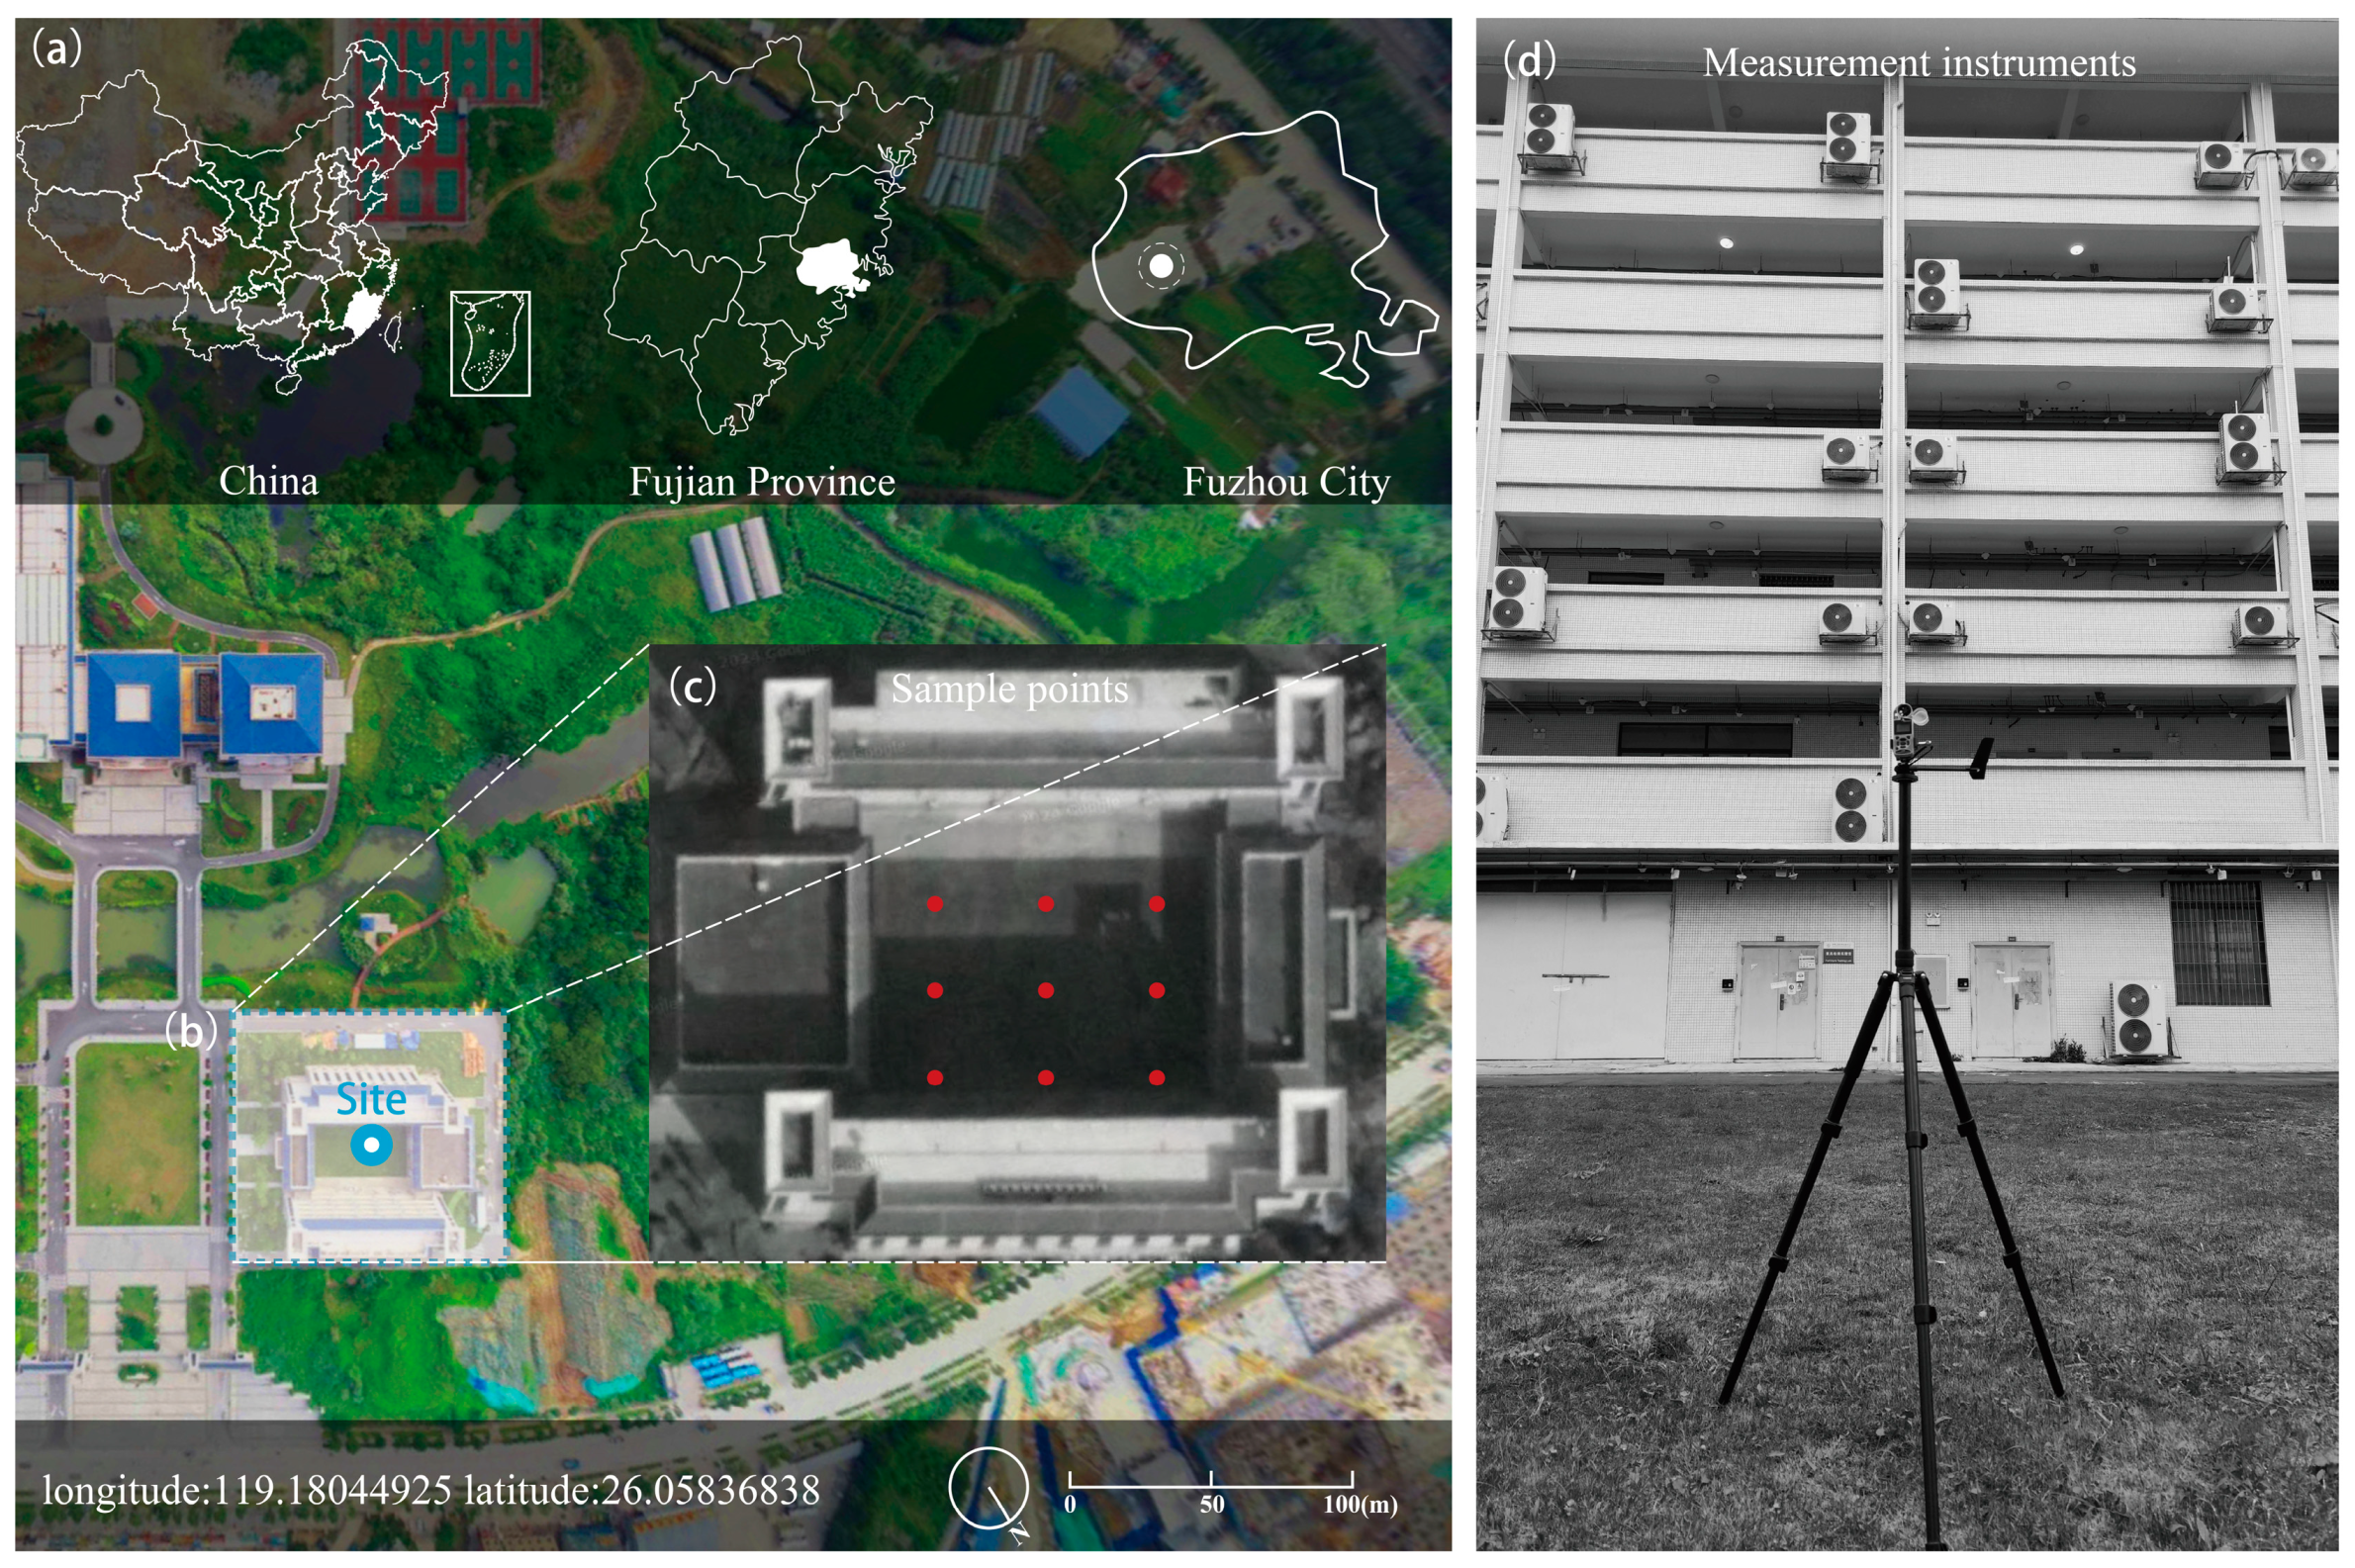
2.1. Overview of the Study Area

Located on the southeast coast of China between latitudes 25°15′ N and 26°39′ N and longitudes 118°08′ E and 120°31′ E, Fuzhou is known for its high summer temperatures, often exceeding 35 degrees Celsius. This climatic feature has earned it the nickname “The Melting Pot of China”. The study plot was the most widely used and largest teaching building in Fujian Agriculture and Forestry University (Qishan Campus) in Minhou County, Fuzhou City. As shown in Figure 1, the dimensions of the teaching building are 76 m × 70 m, which includes a 40 m × 40 m inner courtyard. At present, the green space of the courtyard uses a simple lawn design, lacking the strategic combination of trees, shrubs, and grass to effectively combat the heat, which cannot meet the thermal comfort needs of teachers and students. Therefore, it is necessary to further improve the courtyard space’s microclimate through strategic plant layout. It is worth noting that Minhou County of Fuzhou City is in the development and construction stage. The overall urban form is unified, the density of buildings around the campus is low, and the courtyard building can minimize the influence of potential external confounding factors or variables on the microclimate of the inner courtyard space due to its unique enclosed structure.

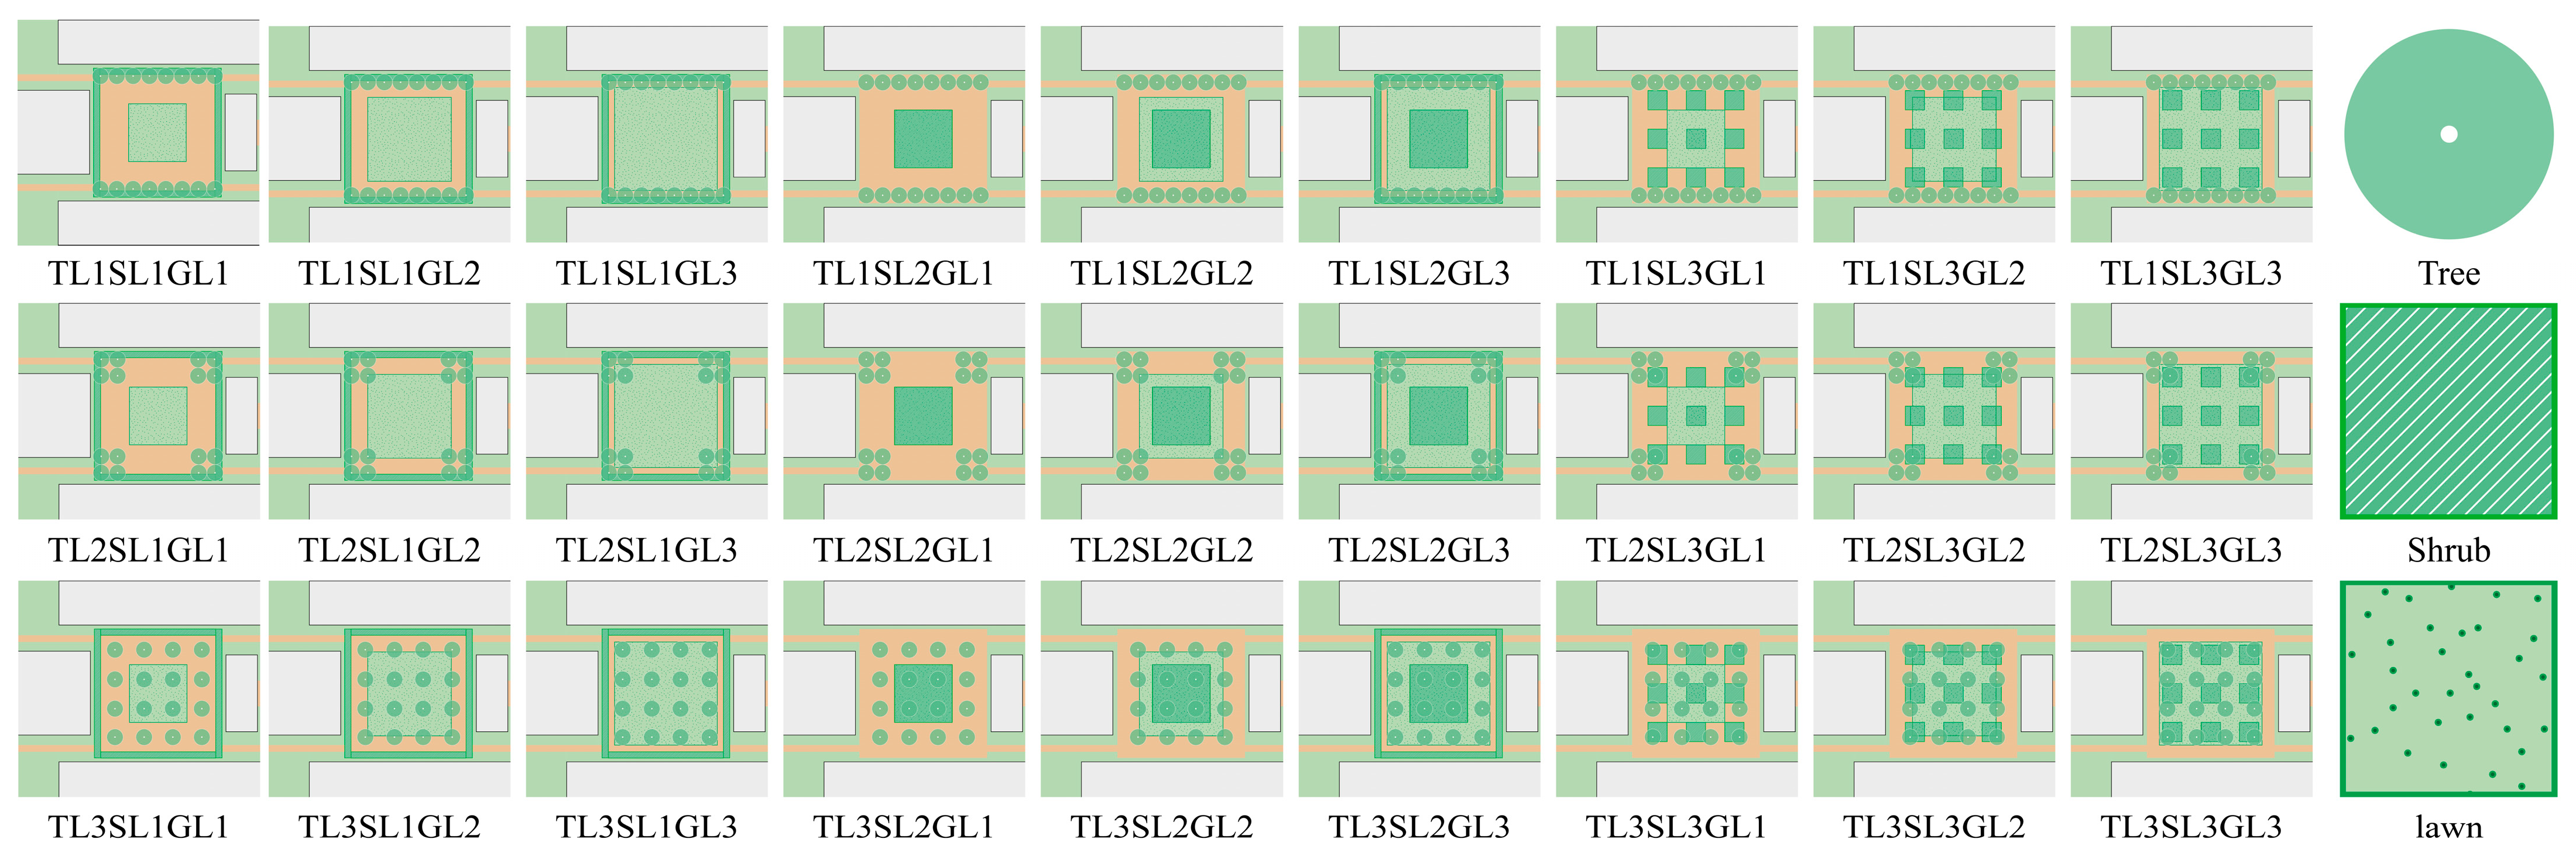
2.2. Orthogonal Design of Experiment

As shown in Figure 2, the literature review in this study reveals that the layout of trees, shrubs, and grasses significantly affects the microclimate of the courtyard space, and there is a significant interaction between these elements [52,53]. Therefore, the combined interaction of trees, shrubs, and grass, irrigation interaction, grass interaction, and shrub interaction were selected as the experimental factors.
The results show that in the hot and humid areas, the tree layout of the university campus mainly included “banded form”, “surrounding form”, and “scattered form”, and the shrub layout included “enclosing form”, “single form”, and “scattered form”. The grass layout was “20% grass”, “40% grass”, and “60% grass”. Thus, as shown in Figure 3, three-factor levels were established for tree, shrub, and grass layouts in this study.
As shown in Table 1 and Figure 4, standard L27(3*13) orthogonal matrices were used in this study, and columns 9, 10, 12, and 13 in the array were all left as “blank”, a strategy used to reduce potential random errors [53].

2.3. Numerical Simulation

2.3.1. Software Introduction

The study in this paper uses data from ENVI-met 5.5.0, a computational fluid dynamics (CFD) simulation tool known for its comprehensive approach to modeling microclimates in urban environments. The whole simulation model consists of four subsystems, namely, atmosphere, soil, vegetation, and buildings, and a one-dimensional boundary model which provides a wide range of environmental factor parameters to choose from, with a maximum spatial and temporal resolution of 1 s and 0.5 m, respectively [54]. The specific formulas for the above subsystems are shown in the paper by ENVI-met authors [55]. Using the simulation software, we can establish the total equivalent coverage of the three factors which cannot be achieved through in situ measurements [56,57].

2.3.2. Model Parameter Settings

According to the size of the simulation site, the modeling grid size of ENVI-met is 76 m × 70 m × 63 m. The grid cell size is set to dx = 1, dy = 1, and dz = 2. In order to eliminate the interference of other factors, the wind speed is uniformly set to 1.6 m/s, the wind direction is set to 180°, and the soil parameter is set to a fixed scale. For other parameter settings, please refer to Table 2.

2.3.3. Selection of Plant Model

In order to eliminate the interference of other factors, the parameters such as tree height, crown width, and the sub-branch height of trees and shrubs were not adjusted, and only the layout of plants in the model was adjusted. Three-dimensional models with shapes and sizes similar to those of standard trees in the Fuzhou area were constructed using the Albero plant database, while the models that came with the system were selected for shrubs and grasses.

2.3.4. ENVI-Met Model Validation

This study used a Kestrel 5500 handheld meteorological instrument to record temperature, humidity, and wind speed at 1.4 m above the ground. The observation period was from 8:00 to 18:00, and the data were collected every hour, as shown in Figure 1. ENVI-met was simulated from 6:00 to 19:00, focusing on the data from 8:00 to 18:00. In order to improve the accuracy of the simulation, the environmental conditions, building structure, road shape, pavement layout, and other related plot characteristics of the simulated plot were consistent with the actual situation.
The coefficient of determination (R2) [27] and root mean square error (RMSE) [58] were used as critical indicators of model accuracy to evaluate the validity of the simulation results. R2 values close to 1 and RMSE values close to 0 indicate the height of model accuracy [58]. As shown in Figure 5, the correlation analysis between the observed temperature, humidity, and wind speed data and the simulated data indicates a linear correlation, and the errors generated are all within the acceptable range. This study confirms that the ENVI-met model can accurately reflect the microclimate variation in the study area. It validates the application of the model in assessing the effect of plant layout on the microclimate of summer courtyard spaces.

3. Results

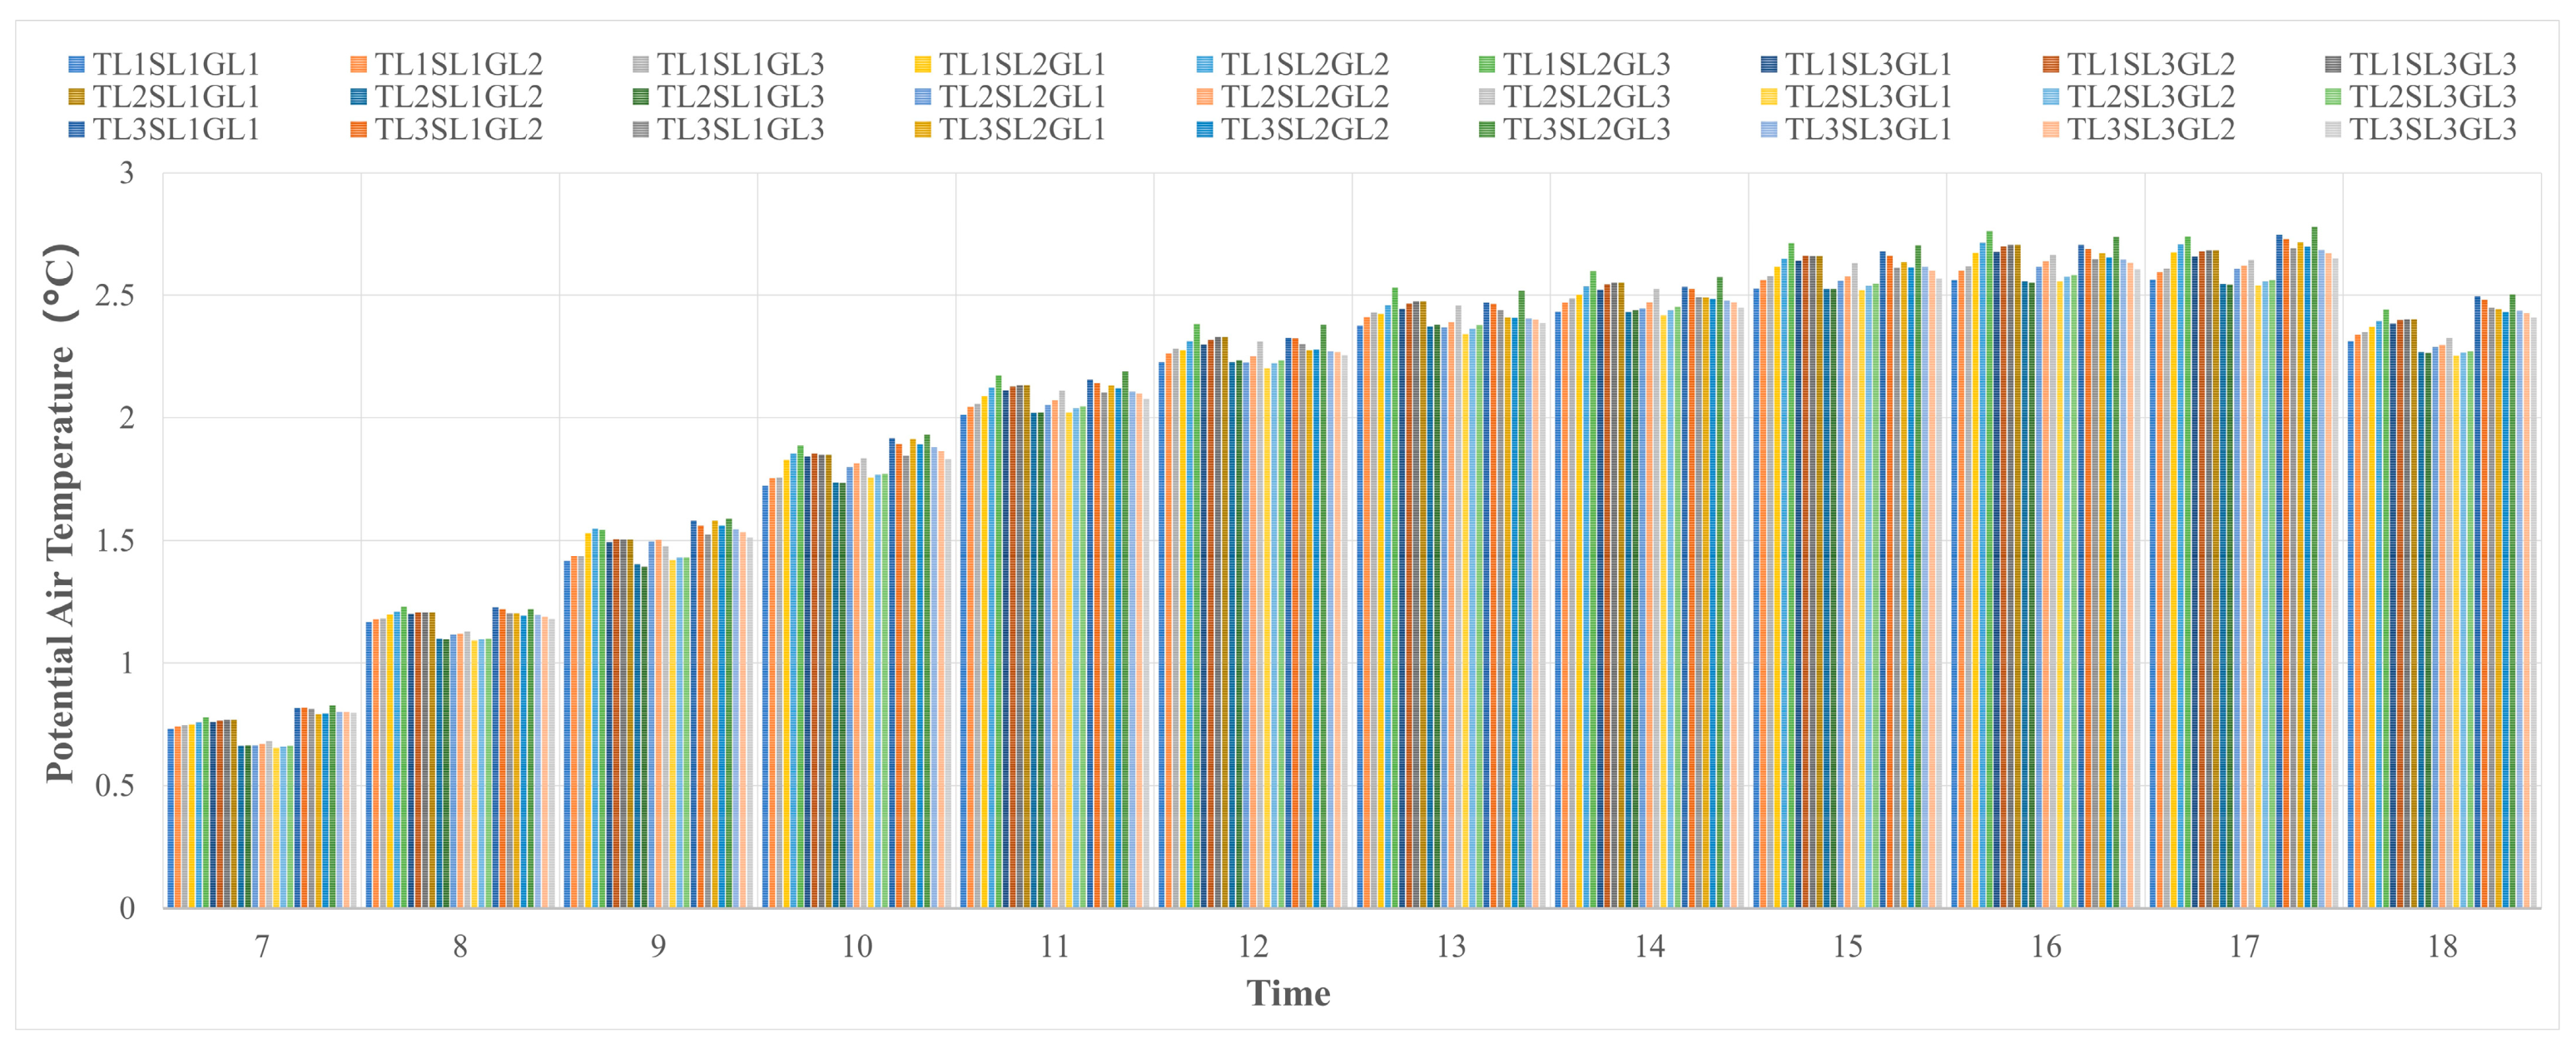
3.1. Effects of Different Plant Layouts on Temperature

3.1.1. Primary and Secondary Influence and Optimal Level Ranking

Intuitive analysis can analyze test results without reducing statistical significance [59,60,61]. Firstly, the range (R) was used to determine the degree of influence of different factors on the test index values. Secondly, the optimal level and optimal combination of factors were judged by comparing the test indicators’ average value (k). As shown in Table 3, the temperature change trend in the courtyard space was the same in each period. By comparing the range R of each factor in the morning, noon, and afternoon, it was found that TL had the most significant effect on the courtyard space temperature in each period, followed by SL and GL.
Taking reducing the temperature of the test index as the optimal goal, the level indexes of each factor were compared with k1, k2, and k3, shown in Table 3. The optimal horizontal order of each factor was obtained: the mean temperature corresponding to TL is k3 < k1 < k2 in the morning and afternoon and k1 < k3 < k2 at noon. The mean temperature corresponding to SL is k2 < k3 < k1 in the morning, k2 < k1 < k3 in the afternoon, and k1 < k3 < k2 in the afternoon. The mean temperature corresponding to GL is k1 < k3 < k2 in the morning, is k3 < k2 < k1 at noon, and k3 < k1 < k2 in the afternoon.

3.1.2. Significance and Influence Degree Analysis

Analysis of variance was used to evaluate the effects and significance of different types of plants and their combined interaction on the experimental indicators. The Sig value is an indicator to test the significance of changes in factor levels [62]. When the Sig value is less than 0.01, it indicates that this factor significantly affects the test index. When the Sig value is 0.05 or less than 0.05, the factor significantly influences the detection index; when the Sig value is more significant than 0.05, the influence is insignificant [63,64]. The F-value is the ratio of the square of the average deviation of each factor level to the square of the average deviation caused by the error. The larger the F-value, the more significant the fluctuation in the experimental index caused by the change in the factor and the more significant the influence [65,66].
The results of Table 4 show that the effect of TL on temperature was highly significant in the morning and at noon (Sig. < 0.01). SL was significant only in the noon period (Sig. < 0.05); TL × SL was significant at noon (Sig. < 0.05) and highly significant in the afternoon (Sig. < 0.01). SL × GL significantly affected temperature at noon and in the afternoon (Sig. < 0.05). TL × GL and GL had no significant effect on courtyard space temperature in all periods (Sig. > 0.05). Based on the F-value, it can be seen that the order of significance of the effect of each plant and its interaction combinations on the temperature of the courtyard space in the morning time period is TL > SL > TL × SL > SL × GL > TL × GL > GL; in the noon period, it is TL > TL × SL × SL > SL × GL > SL × GL > SL × GL > TL × GL; in the afternoon period, it is TL × SL > SL × GL > TL > SL > GL > TL × GL.

3.1.3. Optimal Combination of Interactions

Determining the best combination of factors with significant interaction can provide a reference for selecting appropriate factor levels in the design [59]. The average temperature of the three experimental indicators corresponding to the combination of each factor level in different periods was calculated, and the interaction calculation table was drawn. Table 5 shows that the best combination of TL and SL for cooling at noon is TL1SL2 and the worst is TL2SL3. In the afternoon, TL3SL1 and TL2SL3 have the best cooling effect, and TL2SL2 has the worst. At noon, the optimal combination of SL and GL is SL2GL3, and the worst is SL3GL1. In the afternoon, SL1GL3 is the best cooling combination, and SL1GL1 is the worst.

3.1.4. Comparison of Different Test Schemes and Optimal Scheme

Based on the simulation data of the scenario without plant elements, the cooling effect of each test scheme was compared, and the optimal goal was to reduce the temperature effect; that is, the scheme with a considerable cooling value was preferentially selected. As shown in Figure 6, the cooling effect is most significant in the afternoon and most minor in the morning. According to the three time periods of morning, noon, and afternoon, the cooling ability of the TL3SL2GL3 scheme is the strongest, followed by the TL1SL2GL3 scheme.

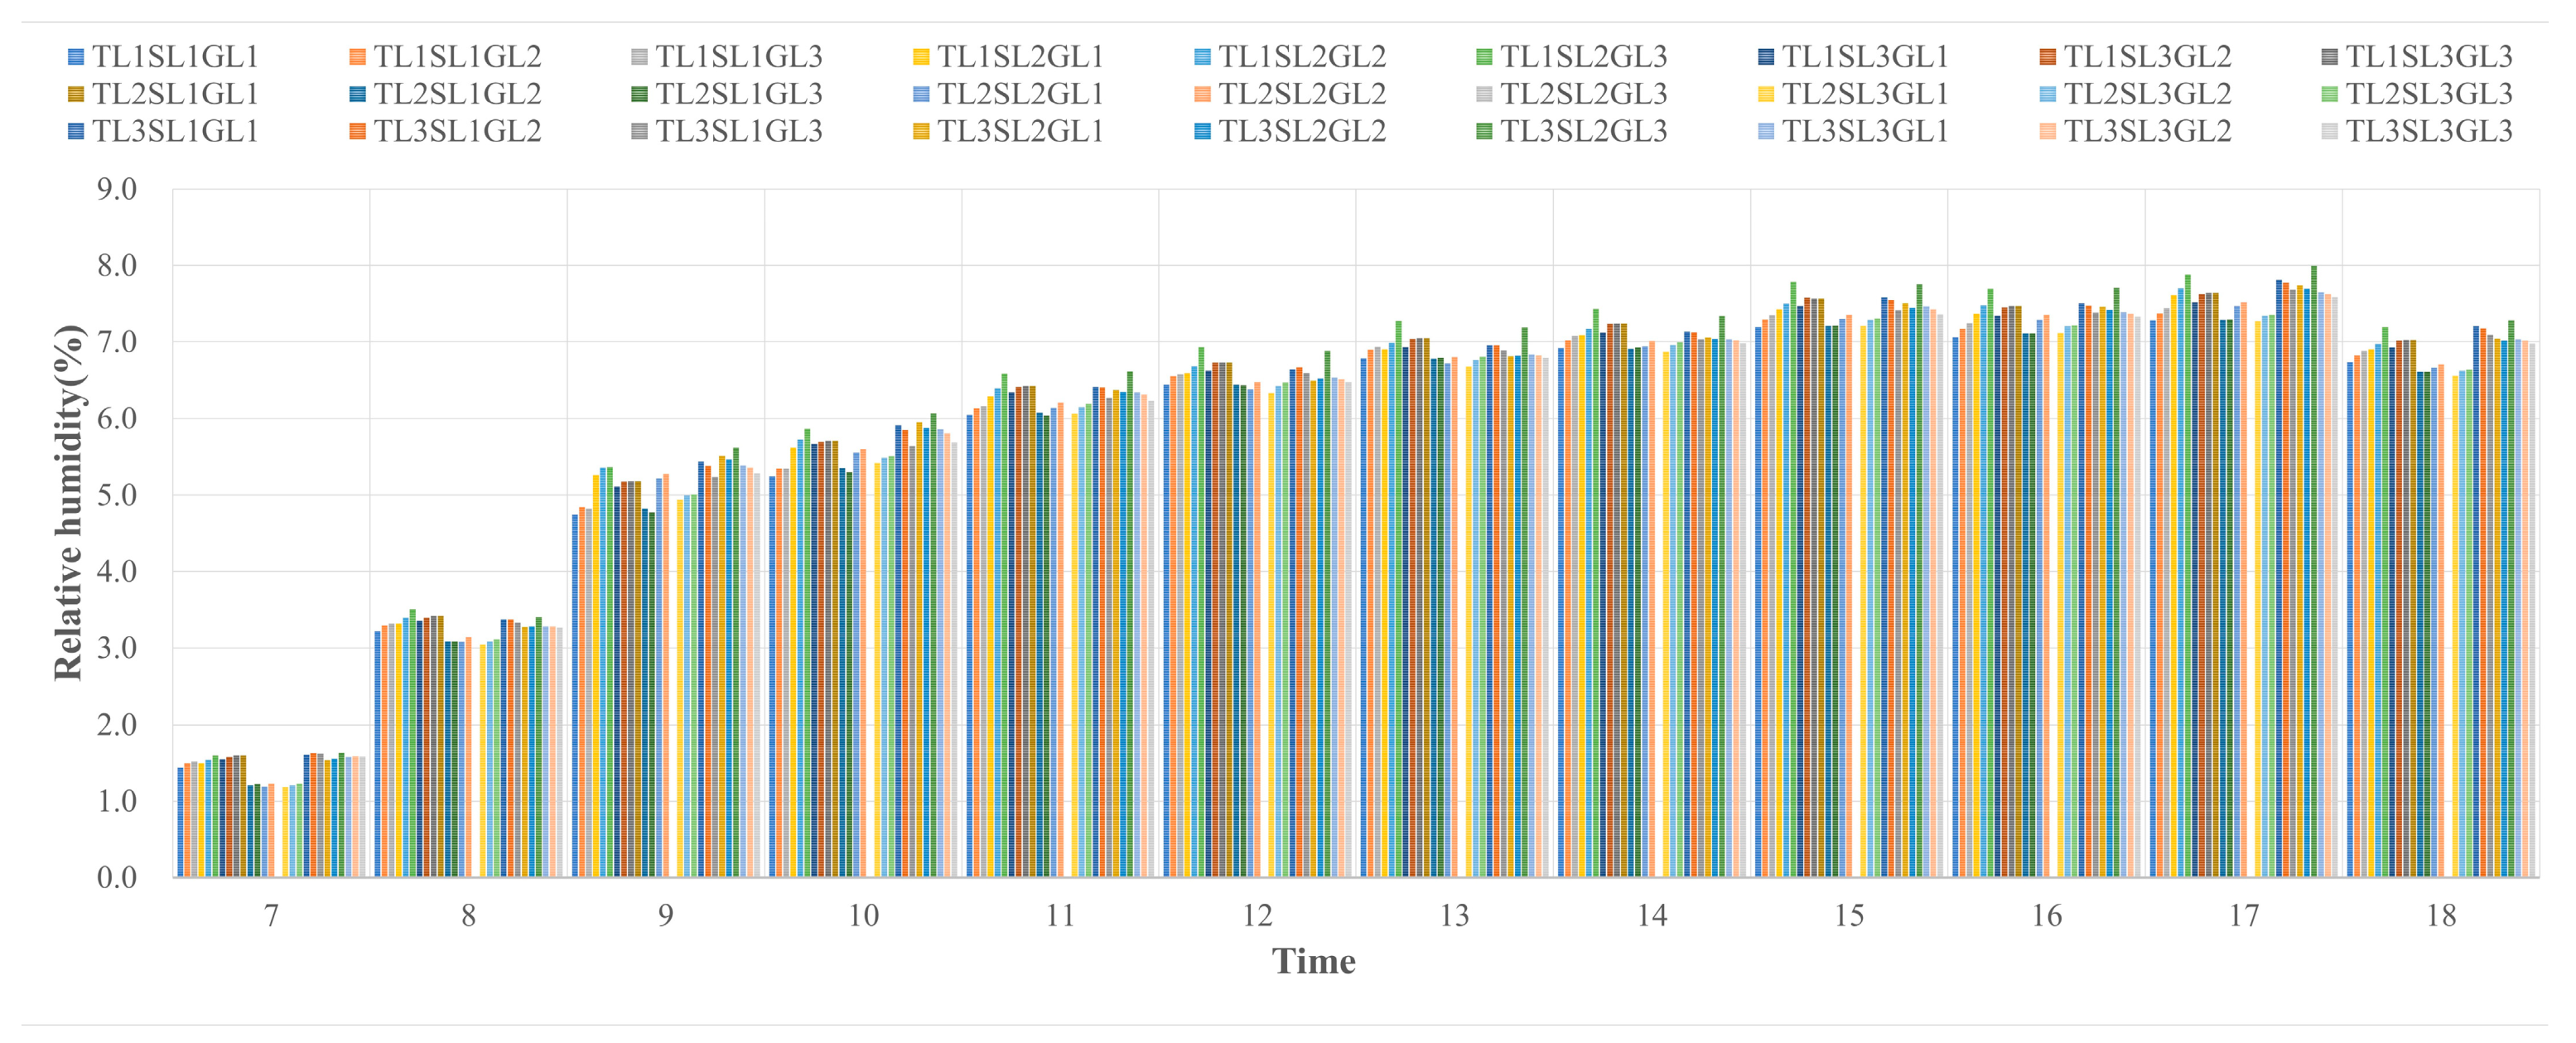
3.2. Influence of Different Plant Element Layouts on Humidity

3.2.1. Primary and Secondary Influence and Optimal Level Ranking

As shown in Table 6, the order of the effect of each factor on the humidity of the courtyard space in the morning period is TL > SL > GL; in the noon and afternoon periods, it is TL > GL > SL. The mean value of humidity corresponding to TL is k2 < k1 < k3 in both the morning and afternoon periods and k2 < k3 < k1 in the noon period; the mean value of humidity corresponding to SL is k1 < k3 < k2 in the morning and noon periods, and k2 < k3 < k1 in the afternoon period. The mean value of humidity corresponding to GL is k2 < k1 < k3 in the morning and afternoon periods, and k1 < k2 < k3 in the noon period.

3.2.2. Significance and Influence Degree Analysis

As shown by the analysis of the results in Table 7, the effect of TL on humidity is highly significant (Sig. < 0.01) in the morning period and significant (Sig. < 0.05) in the noon period; SL has a significant effect (Sig. < 0.05) on humidity only in the morning period. TL × SL is highly significant (Sig. < 0.01) only in the afternoon period, SL × GL is significant (Sig. < 0.05) in both the noon and afternoon periods (Sig. < 0.05), and GL and TL × GL have no significant effect on humidity in the courtyard space in all periods (Sig. > 0.05). From the F-values, the order of significance of the effect of each plant and its interaction combinations on the spatial temperature of the courtyard in the morning is TL > SL > TL × SL > SL × GL > TL × GL > GL; in the midday period, it is TL > SL × GL > SL > GL > TL × SL > TL × GL; and in the afternoon, it is TL × SL > SL × GL > TL > GL > SL > TL × GL.

3.2.3. Optimal Combination of Interactions

Table 8 shows that the optimal combination of TL and SL in the afternoon for dehumidification is TL2SL2 and the worst is TL3SL1. In addition, TL3SL2 and TL3SL3 have a similar dehumidification effect. The optimal combination of SL and GL for dehumidification at noon is SL3GL1, and the worst combination is SL2GL3. In the afternoon, SL1GL1 is the optimal combination for dehumidification, and SL1GL3 is the worst.

3.2.4. Comparison of Different Test Schemes and Optimal Scheme

Based on the simulation data of the scenario without plant elements, the humidity regulation effect of each test scheme was compared, and the optimal goal was to reduce the humidity effect; that is, the scheme with a low humidification value was preferred. As shown in Figure 7, the humidification effect of each scheme could be better, and noon and afternoon time periods greatly influence humidity. Considering the three time periods of morning, noon, and afternoon, the dehumidification ability of scheme TL2SL3GL1 is the strongest, followed by scheme TL2SL1GL3.

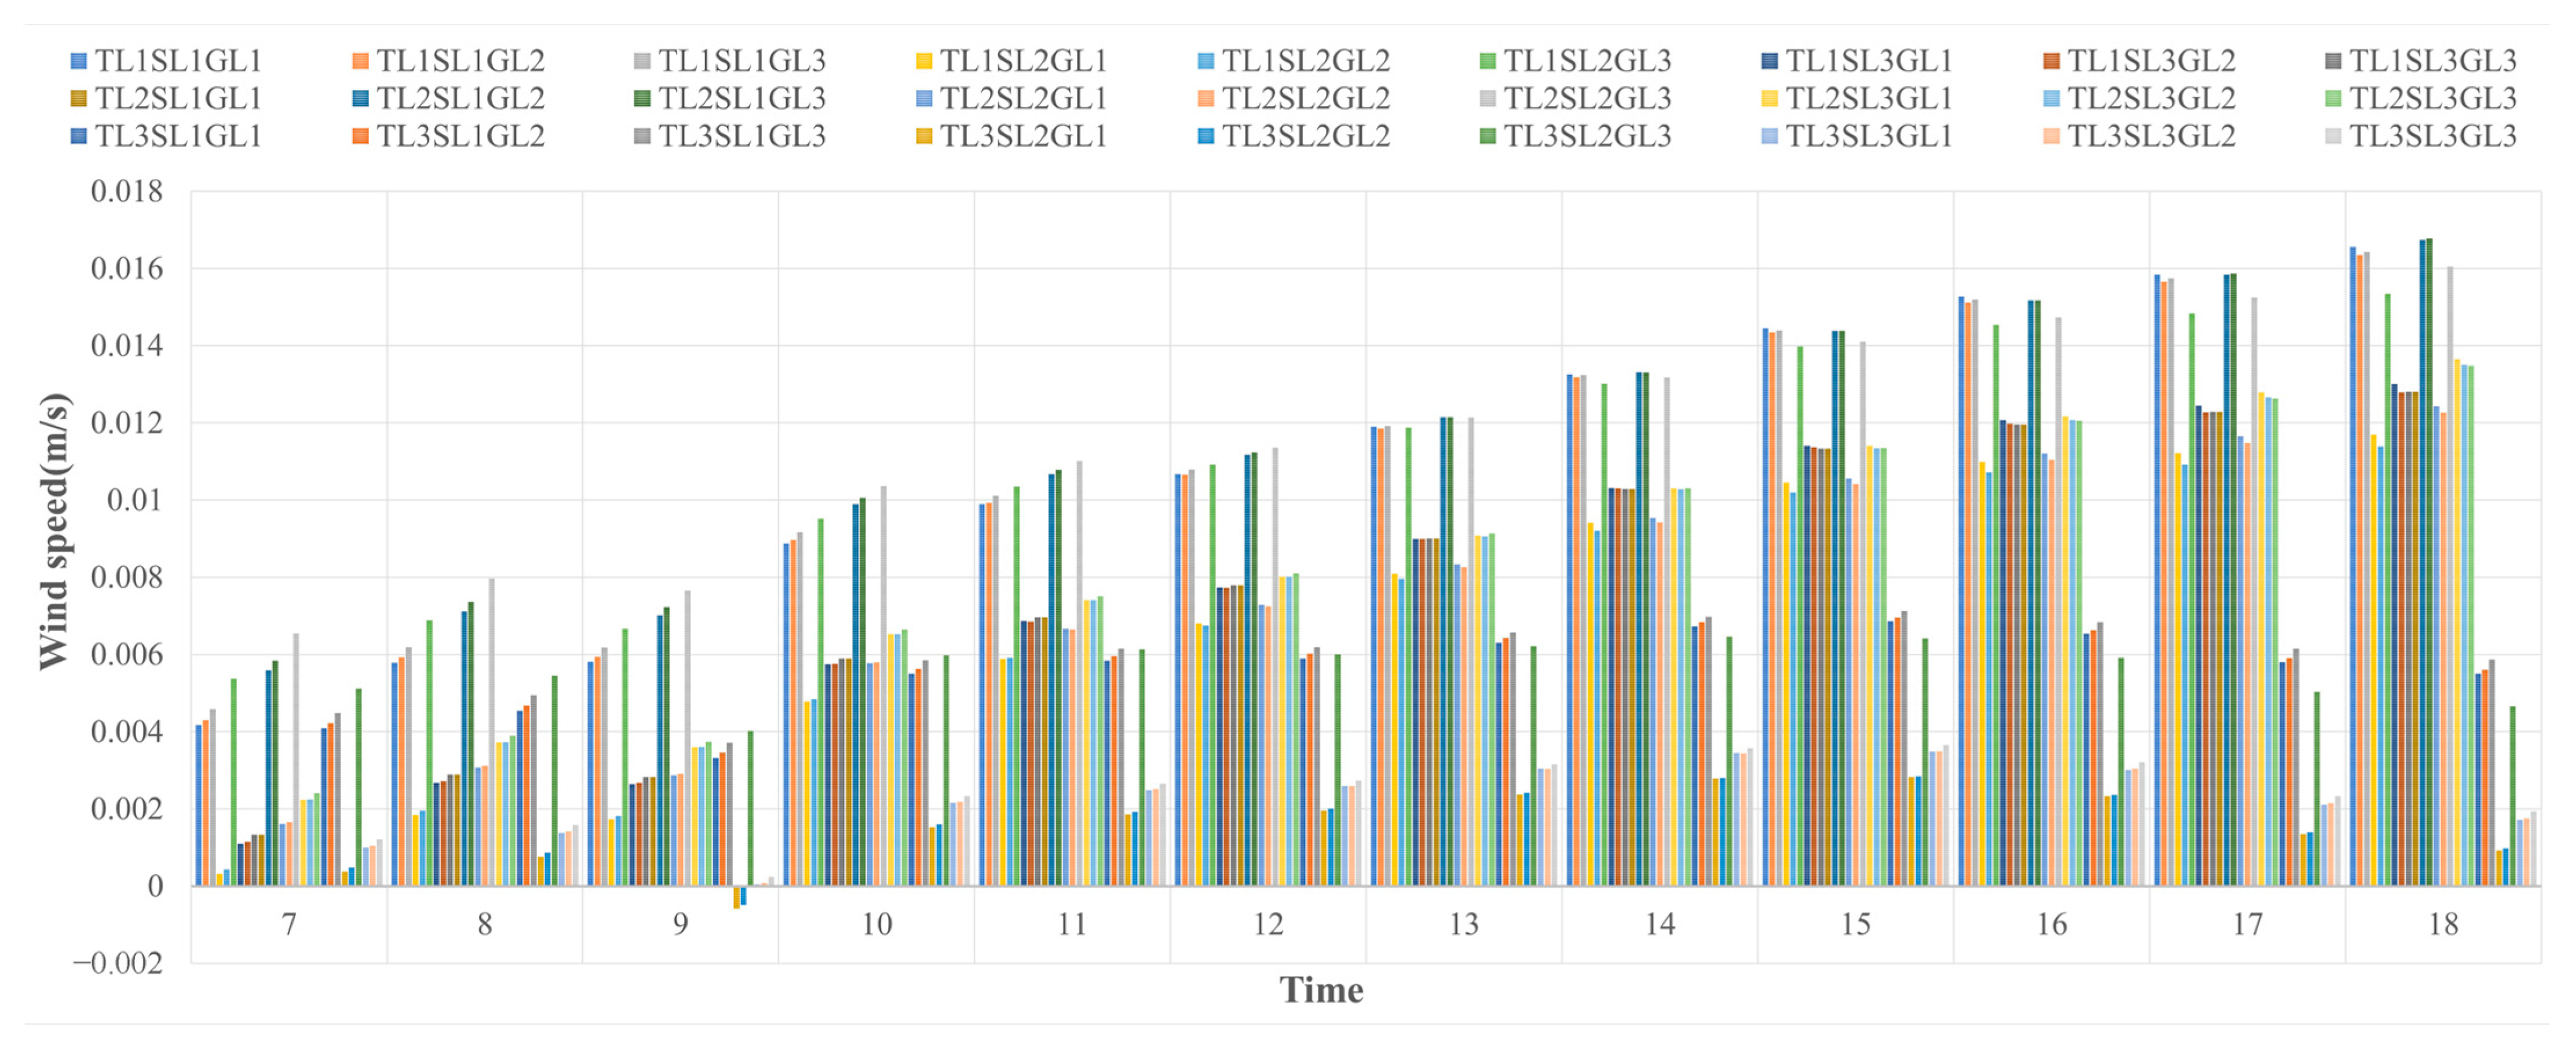
3.3. Influence of Different Plant Element Layouts on Wind Speed

3.3.1. Primary and Secondary Influence and Optimal Level Ranking

As shown in Table 9, the factors are SL > TL > GL in the morning and TL > SL > GL in the noon and afternoon periods. The level ranking is k2 < k1 < k3 in the morning period and k1 < k2 < k3 in the noon and afternoon periods for TL. SL corresponds to k1 < k2 < k3 for all periods; GL corresponds to k3 < k2 < k1 for all periods.

3.3.2. Significance and Influence Degree Analysis

As shown in Table 10, TL and SL have highly significant effects on wind speed in each period (Sig. < 0.01). GL is highly significant in the morning and noon periods (Sig. < 0.01); TL × SL is extremely significant only in the afternoon (Sig. < 0.01), SL × GL is highly significant in the morning and at noon (Sig. < 0.01), and TL × GL has no significant effect on wind speed in the courtyard space in all periods (Sig. > 0.05). According to the F-value, the order of significance of the effect of each plant and its interaction combinations on the temperature of the courtyard space in the morning is SL > TL > GL > SL × GL > TL × GL > TL × GL. The order of the midday time period is TL > SL > GL > SL × GL > TL × SL > TL × GL, and the order of the afternoon time period is TL > TL × SL > SL > GL > SL × GL > TL × GL.

3.3.3. Optimal Combination of Interactions

As shown in Table 11, when TL and SL interact, the ventilation effects of TL3SL2 and TL3SL3 are similar in the afternoon; both are the optimal ventilation combination, and the worst is TL1SL1. In the interaction between SL and GL in the morning, the optimal ventilation combination is SL2GL1, and the worst ventilation combination is SL2GL3; in the noon period, the ventilation effects of SL2GL1 and SL2GL2 are similar, and the worst ventilation combination is SL1GL3.

3.3.4. Comparison of Different Test Schemes and Optimal Scheme

Each test scheme’s wind speed regulation ability was compared with the data of the scenario simulation without plant elements. The optimal goal was to enhance the ventilation effect. The scheme with the lowest wind reduction effect was the preferred scheme. As shown in Figure 8, the ventilation effect of all schemes is poor, and the effect of wind prevention is most significant in the noon and afternoon periods. In contrast, some schemes show a ventilation effect in the morning period. Considering the three time periods of morning, noon, and afternoon, scheme TL3SL2GL1 has the lowest wind reduction effect and the best ventilation effect, followed by scheme TL3SL2GL2.

4. Discussion

4.1. Microclimatic Effects of Plants in Courtyard Spaces

First, our study shows that the interactions between different plant types showed unique changes, with the combined effects of TL, SL × GL, and TL × SL on temperature beginning to dominate at noon. At the same time, the impact of TL × SL on humidity gradually diminished. In the afternoon, only TL × SL and SL × GL still played a decisive role in the influence of temperature and humidity. These findings resonate with the research results of Cohen [67], Zhang [68], and Bao [69] et al., which not only show that different tree, shrub, and grass plants can effectively improve the microclimate of the courtyard space but also show that the cooling and humidifying effect of the individual tree layout, tree irrigation, and the shrub and grass combination is better than that of the individual shrub and grass layouts. Secondly, the wind speed differed from the temperature and humidity change. In the morning and at noon, the separate arrangement of trees, shrubs, and plants had a more significant influence on wind speed compared to their combination. By the afternoon, the influence of TL × SL on wind speed increased significantly, while the impact of SL × GL and GL on wind speed decreased. Even so, TL and SL have always played a vital role in regulating wind speed. These changes were mainly due to the increase in the three-dimensional green volume in the courtyard space, which enriched the configuration of the plant community and improved the ability of plants in the area to regulate the microclimate. However, it is essential to note that it is crucial to consider the interaction between solar radiation intensity and the surrounding building morphology when mediating the observed variations in the effects of different plant layouts on temperature, humidity, and wind speed throughout the day. For example, in the morning, lower solar radiation angles lead to longer shadows from trees or taller shrubs, which could explain why TL has more pronounced cooling and humidification effects at these times [12]. However, the distribution and density of buildings can hinder or promote natural ventilation, which affects how plant layout changes wind speed [70]. Therefore, future studies should examine the complex interactions between plant layout, solar radiation, and architectural form.
Secondly, compared with previous studies that explored plant regulation of microclimates, our study paid more attention to the effect of plant layout on the microclimate because this study was conducted from the perspective of actual demand. On the one hand, considering the economic cost, plant optimization of courtyard spaces often requires a lot of time and high economic and labor costs, and it is challenging to meet the needs of landscape designers. However, designers can flexibly adjust plant layouts to achieve efficient microclimate regulation while keeping costs as low as possible. On the other hand, compared with plant layout, previous studies on plant regulation of microclimates have mainly focused on the effects of plant type and biochemical or physical effects on microclimates. These studies are easily affected by specific climatic zones, which weakens the universality of the research to a certain extent. To scientifically arrange the plant layout in the courtyard space to achieve the best microclimate effect, we found that “scattered form (TL3)”, “single form (SL2)”, and “60% of lawn (GL3)” were the optimal configurations for cooling. Surrounding form (TL2), scattered form (SL3), and 20% of lawn (GL1) were the most effective dehumidification schemes. “Scattered form (TL3)”, “single form (SL2)”, and “20% of lawn (GL1)” performed best in enhancing ventilation. These findings highlight the differences between different plant layouts in regulating the microclimate of the courtyard space. The uniformly dispersed TL and the single concentrated SL can have a good cooling and ventilation effect but cannot reduce humidity. The larger the lawn area, the better the cooling effect, but the worse the benefits of humidity reduction and ventilation. Therefore, we suggest that the advantages and disadvantages of different plant layouts should be comprehensively considered in the planning and designing of future plant layouts, and each plant layout configuration should be weighed to create a comfortable and healthy microclimate environment.
Finally, after comparing the results of our study with similar studies in other climatic zones, we found that the microclimatic effects of plant layouts varied in different climatic conditions. In a study examining microclimates in arid regions, Abdi [14] stated that a rectangular layout is the best type of tree layout to modulate the microclimate effect. However, in temperate climates, studies such as Fu [71] and Shan [72] showed that the extent of TL’s impact on summer microclimate wind speed in outdoor spaces of residential areas was banded form > scattered form > surrounding form in descending order. In contrast, our study is consistent with the findings of most studies on humid and hot climates, where scattered form was the most effective way to regulate microclimate. Studies in which the results showed that TL and SL in scattered form were found to be the most suitable for cooling include Hong [73], Lai [26], Yang [74], and Han et al [75]. This consistency suggests that dispersed trees and shrubs reduce heat accumulation in enclosed courtyard spaces. In addition, Cheung [76] and Rui [77] et al. observed that the decentralized layout of shrubs enhanced humidification and ventilation. It is hypothesized that the above differences are caused by the climatic conditions of Fuzhou’s hot and humid region and the particularities of the layout of the enclosed building, especially the high solar radiation, long hours of sunshine, building form, and building density.

4.2. Courtyard Space Plants and Urban Space Planning

The findings of this study are critical for practical applications and policy development in yard space planning and plant design. By demonstrating the effects of different plant layouts and their combined interactions on the microclimate of courtyard spaces, this paper provides a practical reference for landscape architects and urban planners. For example, in crowded places (college teaching buildings, gymnasiums, etc.), we can configure the plant layout of “scattered form (TL3)”, “single form (SL2)”, and “60% of lawn (GL3)” in the courtyard space to play a cooling role that improves the comfort of the human body. Similarly, it is possible to reduce the temperature and improve the microclimate by enhancing ventilation (20% of lawn (GL1)). Therefore, we believe that relevant local governments and greening departments can use the findings of this study in combination to develop guidelines for plant layout, thereby improving the microclimate of buildings’ outdoor spaces and achieving broader urban sustainability goals, such as mitigating heat islands, improving air quality, and reducing building energy consumption. At the same time, it is worth noting that the research results of this paper are based on a humid and hot environment with a subtropical climate background and can only be applied to similar climate environments. Other climate environments need further specific analysis [39] to ensure the scientific nature of the actual design. Regarding courtyard spaces in hot and humid areas, we need to strengthen the long-term maintenance and management of plant layout to avoid damage to other types of biodiversity. Local tree species such as Magnolia grandiflora, Bauhinia purpurea, Ficus concinna, etc., should be selected to optimize the design to achieve environmentally sustainable development.
However, this study has some limitations, such as the lack of consideration of the potential effects of solar radiation and architectural elements (e.g., the proportion of the courtyard space, building form, building height, and building facade materials) on the ability of plant layout to regulate the microclimate. According to our findings, the plant layout that is useful in the morning may no longer be applicable in the noon and afternoon periods, mainly due to the difference in shading caused by the influence of the sun’s movement. This observation is in line with the findings of Zamani [3] and Wu [28] et al., who noted that the shadows of buildings around plants significantly affected the short-wave radiation from the land surface, changing the cooling efficiency of plants. Based on the above shortcomings, future research should choose samples with regular building forms and low heights for small shading areas in the study area. At the same time, research can also explore the coordinated effects of other variables on microclimates, such as building orientation, building form, plant species, and seasonal changes. By expanding the range of influencing factors, researchers can further improve the study of the microclimate regulation of yard space by plants to achieve the best microclimate of yard spaces under different climatic conditions.

5. Conclusions

Taking the courtyard space of Fuzhou as an example, through statistical analysis, focusing on temperature, humidity, and wind speed, we used orthogonal experiments to analyze the primary and secondary effects of three plant layouts, including trees, shrubs, and grasses, on the microclimate of the courtyard space and finally proposed the most effective combination to enhance the microclimate. Four key conclusions emerged from our discussion and analysis:
(1)
Plant layout has the ability to reduce temperature and control wind, and the more dispersed and uniform the plant layout, the more conducive it is to reducing the temperature of the summer courtyard space and enhancing ventilation. However, a plant layout that is too dispersed can reduce wind speed.
(2)
The effect of plant layout on the temperature and humidity of the courtyard space in the morning, noon, and afternoon periods in summer showed a change in the law of cooling and humidification. Plant layout shows a significant ability to reduce temperature and regulate wind within the yard space. The more dispersed and uniform the plant layout, the more beneficial it is to reduce the temperature of the summer courtyard space and enhance ventilation. However, it should be noted that an overdispersed layout may reduce wind speed.
(3)
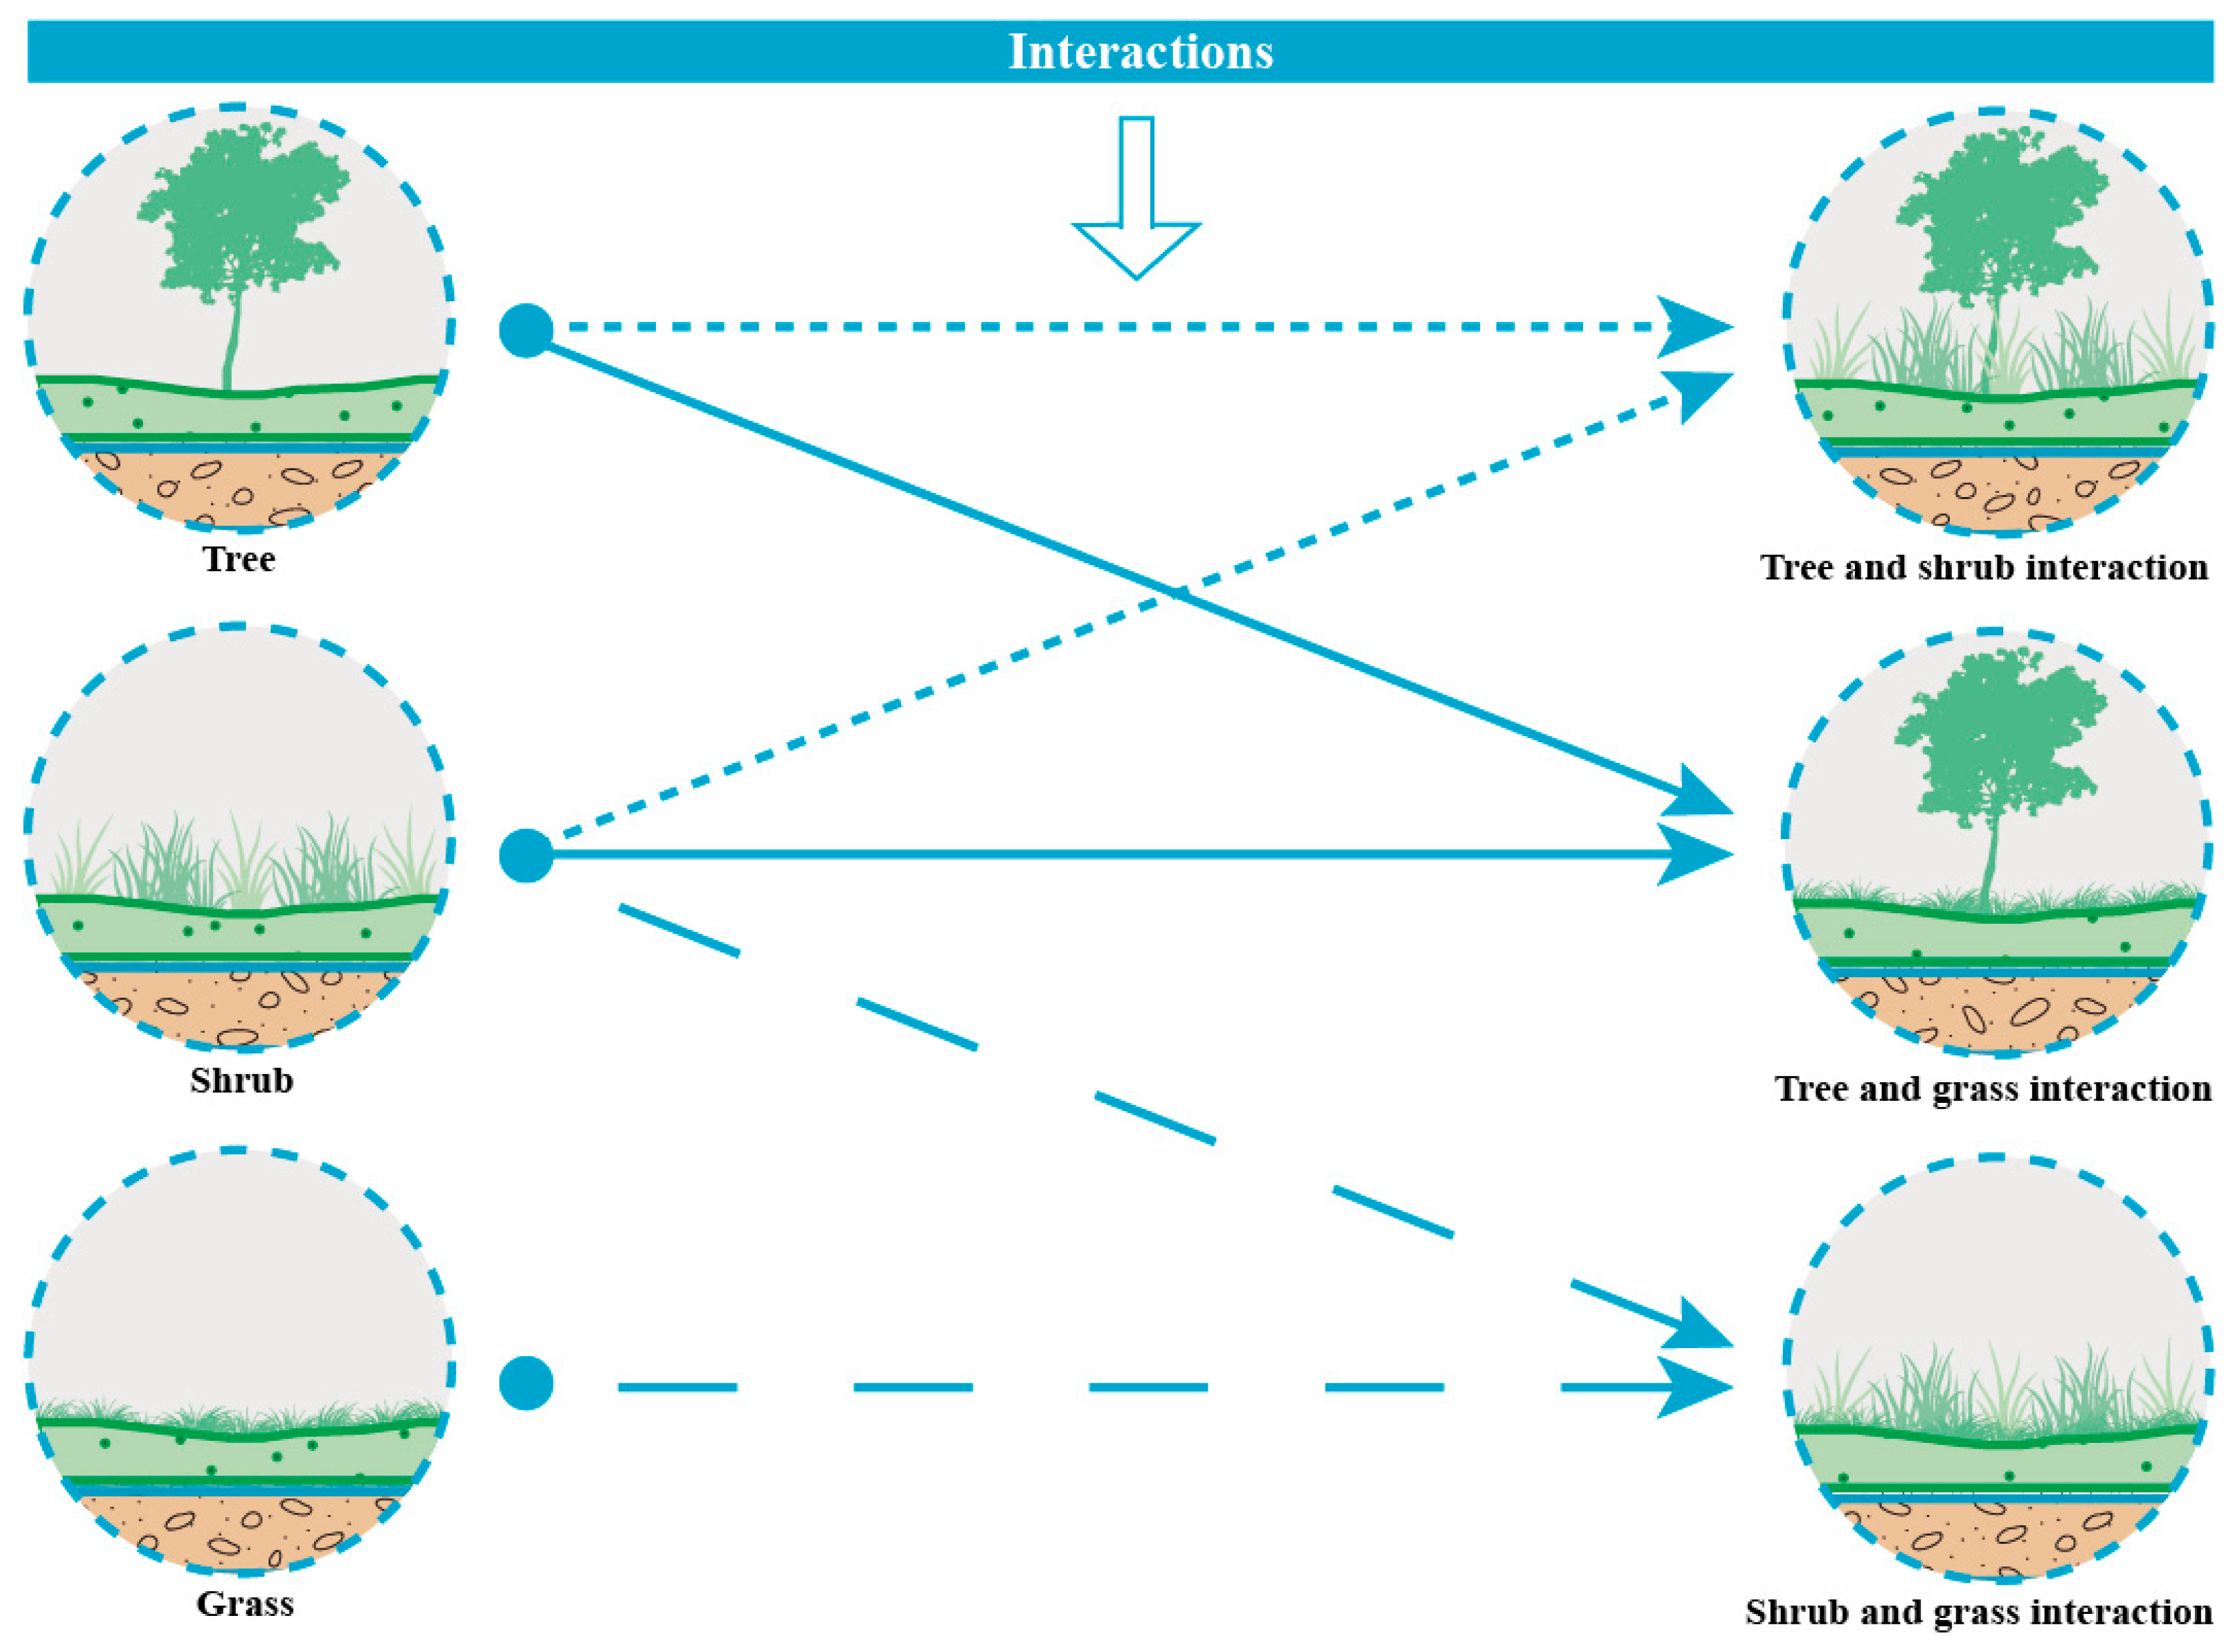
The comparison of different plant layout combinations highlighted the significant interaction among trees, shrubs, and grasses in regulating microclimate capacity. In particular, combinations such as TL × SL and SL × GL show significantly excellent cooling and humidifying efficiencies compared to individual layouts, underscoring the importance of synergistic effects.
(4)
Supported by statistical significance tests, the optimal plant layout configurations for courtyard spaces in hot and humid areas were identified as “scattered form (TL3)”, “single form (SL2)”, and “20% of lawn (GL1)”. Practical guidance was provided for improving the microclimatic conditions of courtyard spaces.
This study used ENVI-met to study the optimal configuration of plant layout based on the microclimate. This method is highly predictable and replicable, which can improve scientific design, reduce the economic cost of the actual construction, and provide a solid foundation for promotion in different microclimates and building environments. At the same time, this study also highlights the importance of integrated plant layout planning in urban microclimate management, and our recommendations for optimal plant layout combinations—“scattered form (TL3)”, “single form (SL2)”, and “20% of lawn (GL1)”—are not only statistically reliable but also practical for urban planning. These combinations provide a model for integrating different plant layouts to produce synergistic effects and enhance the overall microclimate of the urban space. At the same time, the results suggest that similar configurations can be effectively implemented in other areas with comparable climatic and urban conditions to optimize the microclimate effect of courtyard spaces. Future urban planning and development should also use these insights to design esthetically pleasing green spaces and have critical functions in managing the urban microclimate.

Author Contributions

Conceptualization, G.Z., H.X., F.L., and J.D.; methodology, G.Z., H.X., F.L., and J.D.; software, G.Z., H.X., and F.L.; validation, G.Z., H.X., and F.L.; formal analysis, G.Z., H.X., and F.L.; investigation, G.Z., H.X., and F.L.; resources, H.X. and F.L.; data curation, H.X.; writing—original draft preparation, G.Z. and H.X.; writing—review and editing, G.Z. and H.X.; visualization, G.Z. and J.D.; supervision, G.Z. and J.D.; project administration, G.Z. and J.D.; funding acquisition, G.Z. and J.D. All authors have read and agreed to the published version of the manuscript.

Funding

This study was supported by the Fujian Provincial Department of Finance—Min Cai Finger (2022) (KKy22044XA) Study on the Realization of the Value of Rural Ecological Products.

Institutional Review Board Statement

Not applicable.

Informed Consent Statement

Not applicable.

Data Availability Statement

All images in the text were drawn by the authors. The data used to support the findings of this study are available from the corresponding author upon request.

Conflicts of Interest

The authors declare that they have no known competing financial interests or personal relationships that could have influenced the work reported in this paper.

References

  1. Han, J.; Li, X.; Li, B.; Yang, W.; Yin, W.; Peng, Y.; Feng, T. Research on the influence of courtyard space layout on building microclimate and its optimal design. Energy Build. 2023, 289, 113035. [Google Scholar] [CrossRef]
  2. Du, X.; Bokel, R.; van den Dobbelsteen, A. Spatial configuration, building microclimate and thermal comfort: A modern house case. Energy Build. 2019, 193, 185–200. [Google Scholar] [CrossRef]
  3. Zamani, Z.; Heidari, S.; Hanachi, P. Reviewing the thermal and microclimatic function of courtyards. Renew. Sustain. Energy Rev. 2018, 93, 580–595. [Google Scholar] [CrossRef]
  4. Huang, Z.; Cheng, B.; Gou, Z.; Zhang, F. Outdoor thermal comfort and adaptive behaviors in a university campus in China’s hot summer-cold winter climate region. Build. Environ. 2019, 165, 106414. [Google Scholar] [CrossRef]
  5. Han, G.; Wen, Y.; Leng, J.; Sun, L. Improving comfort and health: Green retrofit designs for sunken courtyards during the summer period in a subtropical climate. Buildings 2021, 11, 413. [Google Scholar] [CrossRef]
  6. Du, X.; Bokel, R.; van den Dobbelsteen, A. Building microclimate and summer thermal comfort in free-running buildings with diverse spaces: A Chinese vernacular house case. Build. Environ. 2014, 82, 215–227. [Google Scholar] [CrossRef]
  7. Ge, J.; Wu, J.; Chen, S.; Wu, J. Energy efficiency optimization strategies for university research buildings with hot summer and cold winter climate of China based on the adaptive thermal comfort. J. Build. Eng. 2018, 18, 321–330. [Google Scholar] [CrossRef]
  8. Soflaei, F.; Shokouhian, M.; Tabadkani, A.; Moslehi, H.; Berardi, U. A simulation-based model for courtyard housing design based on adaptive thermal comfort. J. Build. Eng. 2020, 31, 101335. [Google Scholar] [CrossRef]
  9. Vaezizadeh, F.; Rashidisharifabad, S.; Afhami, R. Investigating the cooling effect of living walls in the sunken courtyards of traditional houses in Yazd. Eur. J. Sustain. Dev. 2016, 5, 27. [Google Scholar]
  10. Soflaei, F.; Shokouhian, M.; Shemirani, S.M.M. Traditional Iranian courtyards as microclimate modifiers by considering orientation, dimensions, and proportions. Front. Archit. Res. 2016, 5, 225–238. [Google Scholar] [CrossRef]
  11. Meili, N.; Acero, J.A.; Peleg, N.; Manoli, G.; Burlando, P.; Fatichi, S. Vegetation cover and plant-trait effects on outdoor thermal comfort in a tropical city. Build. Environ. 2021, 195, 107733. [Google Scholar] [CrossRef]
  12. Yang, Y.; Gatto, E.; Gao, Z.; Buccolieri, R.; Morakinyo, T.E.; Lan, H. The “plant evaluation model” for the assessment of the impact of vegetation on outdoor microclimate in the urban environment. Build. Environ. 2019, 159, 106151. [Google Scholar] [CrossRef]
  13. Zhao, Q.; Sailor, D.J.; Wentz, E.A. Impact of tree locations and arrangements on outdoor microclimates and human thermal comfort in an urban residential environment. Urban For. Urban Green. 2018, 32, 81–91. [Google Scholar] [CrossRef]
  14. Abdi, B.; Hami, A.; Zarehaghi, D. Impact of small-scale tree planting patterns on outdoor cooling and thermal comfort. Sustain. Cities Soc. 2020, 56, 102085. [Google Scholar] [CrossRef]
  15. Zölch, T.; Rahman, M.A.; Pfleiderer, E.; Wagner, G.; Pauleit, S. Designing public squares with green infrastructure to optimize human thermal comfort. Build. Environ. 2019, 149, 640–654. [Google Scholar] [CrossRef]
  16. Stabler, L.B.; Martin, C.A.; Brazel, A.J. Microclimates in a desert city were related to land use and vegetation index. Urban For. Urban Green. 2005, 3, 137–147. [Google Scholar] [CrossRef]
  17. Shashua-Bar, L.; Hoffman, M.E.; Tzamir, Y. Integrated thermal effects of generic built forms and vegetation on the UCL microclimate. Build. Environ. 2006, 41, 343–354. [Google Scholar] [CrossRef]
  18. Connors, J.P.; Galletti, C.S.; Chow, W.T. Landscape configuration and urban heat island effects: Assessing the relationship between landscape characteristics and land surface temperature in Phoenix, Arizona. Landsc. Ecol. 2013, 28, 271–283. [Google Scholar] [CrossRef]
  19. Du, S.; Xiong, Z.; Wang, Y.-C.; Guo, L. Quantifying the multilevel effects of landscape composition and configuration on land surface temperature. Remote Sens. Environ. 2016, 178, 84–92. [Google Scholar] [CrossRef]
  20. Li, X.; Zhou, W.; Ouyang, Z. Relationship between land surface temperature and spatial pattern of greenspace: What are the effects of spatial resolution? Landsc. Urban Plan. 2013, 114, 1–8. [Google Scholar] [CrossRef]
  21. Li, X.; Zhou, W.; Ouyang, Z.; Xu, W.; Zheng, H. Spatial pattern of greenspace affects land surface temperature: Evidence from the heavily urbanized Beijing metropolitan area, China. Landsc. Ecol. 2012, 27, 887–898. [Google Scholar] [CrossRef]
  22. Zhou, W.; Huang, G.; Cadenasso, M.L. Does spatial configuration matter? Understanding the effects of land cover pattern on land surface temperature in urban landscapes. Landsc. Urban Plan. 2011, 102, 54–63. [Google Scholar] [CrossRef]
  23. Shashua-Bar, L.; Pearlmutter, D.; Erell, E. The cooling efficiency of urban landscape strategies in a hot dry climate. Landsc. Urban Plan. 2009, 92, 179–186. [Google Scholar] [CrossRef]
  24. Wu, Y. The Research on Microclimate Effect of the Three-dimensional Morphology on Urban Waterfront Green Space Vegetation. Doctoral Dissertation, East China Normal University, Shanghai, China, 2020. [Google Scholar]
  25. Binarti, F.; Koerniawan, M.D.; Triyadi, S.; Matzarakis, A. The predicted effectiveness of thermal condition mitigation strategies for a climate-resilient archaeological park. Sustain. Cities Soc. 2022, 76, 103457. [Google Scholar] [CrossRef]
  26. Lai, D.; Liu, Y.; Liao, M.; Yu, B. Effects of different tree layouts on outdoor thermal comfort of green space in summer Shanghai. Urban Clim. 2023, 47, 101398. [Google Scholar] [CrossRef]
  27. Zhao, Y.; Chen, Y.; Li, K. A simulation study on the effects of tree height variations on the facade temperature of enclosed courtyard in North China. Build. Environ. 2022, 207, 108566. [Google Scholar] [CrossRef]
  28. Wu, Z.; Chen, L. Optimizing the spatial arrangement of trees in residential neighborhoods for better cooling effects: Integrating modeling with in-situ measurements. Landsc. Urban Plan. 2017, 167, 463–472. [Google Scholar] [CrossRef]
  29. Wu, Z.; Kong, F.; Wang, Y.; Sun, R.; Chen, L. The impact of greenspace on thermal comfort in a residential quarter of Beijing, China. Int. J. Environ. Res. Public Health 2016, 13, 1217. [Google Scholar] [CrossRef]
  30. Perini, K.; Chokhachian, A.; Dong, S.; Auer, T. Modeling and simulating urban outdoor comfort: Coupling ENVI-Met and TRNSYS by grasshopper. Energy Build. 2017, 152, 373–384. [Google Scholar] [CrossRef]
  31. Crank, P.J.; Sailor, D.J.; Ban-Weiss, G.; Taleghani, M. Evaluating the ENVI-met microscale model for suitability in analysis of targeted urban heat mitigation strategies. Urban Clim. 2018, 26, 188–197. [Google Scholar] [CrossRef]
  32. Blocken, B.; Stathopoulos, T.; Carmeliet, J. CFD simulation of the atmospheric boundary layer: Wall function problems. Atmos. Environ. 2007, 41, 238–252. [Google Scholar] [CrossRef]
  33. Botham-Myint, D.; Recktenwald, G.; Sailor, D. Thermal footprint effect of rooftop urban cooling strategies. Urban Clim. 2015, 14, 268–277. [Google Scholar] [CrossRef]
  34. Chen, H.; Ooka, R.; Huang, H.; Tsuchiya, T. Study on mitigation measures for outdoor thermal environment on present urban blocks in Tokyo using coupled simulation. Build. Environ. 2009, 44, 2290–2299. [Google Scholar] [CrossRef]
  35. Tsoka, S.; Tsikaloudaki, A.; Theodosiou, T. Analyzing the ENVI-met microclimate model’s performance and assessing cool materials and urban vegetation applications—A review. Sustain. Cities Soc. 2018, 43, 55–76. [Google Scholar] [CrossRef]
  36. Lindberg, F.; Grimmond, C. Nature of vegetation and building morphology characteristics across a city: Influence on shadow patterns and mean radiant temperatures in London. Urban Ecosyst. 2011, 14, 617–634. [Google Scholar] [CrossRef]
  37. Samaali, M.; Courault, D.; Bruse, M.; Olioso, A.; Occelli, R. Analysis of a 3D boundary layer model at local scale: Validation on soybean surface radiative measurements. Atmos. Res. 2007, 85, 183–198. [Google Scholar] [CrossRef]
  38. Forouzandeh, A. Numerical modeling validation for the microclimate thermal condition of semi-closed courtyard spaces between buildings. Sustain. Cities Soc. 2018, 36, 327–345. [Google Scholar] [CrossRef]
  39. Liu, S.; Middel, A.; Fang, X.; Wu, R. ENVI-met model performance evaluation for courtyard simulations in hot-humid climates. Urban Clim. 2024, 55, 101909. [Google Scholar] [CrossRef]
  40. Ghaffarianhoseini, A.; Berardi, U.; Ghaffarianhoseini, A. Thermal performance characteristics of unshaded courtyards in hot and humid climates. Build. Environ. 2015, 87, 154–168. [Google Scholar] [CrossRef]
  41. Detommaso, M.; Costanzo, V.; Nocera, F. Application of weather data morphing for calibration of urban ENVI-met microclimate models. Results and critical issues. Urban Clim. 2021, 38, 100895. [Google Scholar] [CrossRef]
  42. Vuckovic, M.; Maleki, A.; Kiesel, K.; Mahdavi, A. Simulation-Based Assessment of UHI Mitigation Measures in Central European Cities. In Proceedings of the 14th International Conference of IBPSA, Hyderabad, India, 7–9 December 2015. [Google Scholar]
  43. Xu, H.; Lin, X.; Lin, Y.; Zheng, G.; Dong, J.; Wang, M. Study on the microclimate effect of water body layout factors on campus squares. Int. J. Environ. Res. Public Health 2022, 19, 14846. [Google Scholar] [CrossRef]
  44. Chen, Y.-C.; Lin, T.-P.; Matzarakis, A. Comparison of mean radiant temperature from field experiment and modelling: A case study in Freiburg, Germany. Theor. Appl. Climatol. 2014, 118, 535–551. [Google Scholar] [CrossRef]
  45. Andreou, E. Thermal comfort in outdoor spaces and urban canyon microclimate. Renew. Energy 2013, 55, 182–188. [Google Scholar] [CrossRef]
  46. Sheng, W.; Ji, A.; Fang, R.; He, G.; Chen, C. Finite element-and design of experiment-derived optimization of screw configurations and a locking plate for internal fixation system. Comput. Math. Methods Med. 2019, 2019, 5636528. [Google Scholar] [CrossRef] [PubMed]
  47. Yang, C.; Yin, T.; Fu, M. Study on the allowable fluctuation ranges of human metabolic rate and thermal environment parameters under the condition of thermal comfort. Build. Environ. 2016, 103, 155–164. [Google Scholar] [CrossRef]
  48. Chen, L.; Zhang, Y.; Luo, Z.; Yao, F. Optimization design of the landscape elements in the Lhasa residential area driven by an orthogonal experiment and a numerical simulation. Int. J. Environ. Res. Public Health 2022, 19, 6303. [Google Scholar] [CrossRef] [PubMed]
  49. Li, A.; Ma, J.; Cui, H.; Zhang, X.; Zhang, W.; Guo, Y. Relative importance of certain factors affecting the thermal environment in subway stations based on field and orthogonal experiments. Sustain. Cities Soc. 2020, 56, 102107. [Google Scholar]
  50. Arora, A.; Yao, Y.; Mobasher, B.; Neithalath, N. Fundamental insights into the compressive and flexural response of binder-and aggregate-optimized ultra-high performance concrete (UHPC). Cem. Concr. Compos. 2019, 98, 1–13. [Google Scholar] [CrossRef]
  51. Liu, K.; Yu, R.; Shui, Z.; Li, X.; Guo, C.; Yu, B.; Wu, S. Optimization of autogenous shrinkage and microstructure for Ultra-High Performance Concrete (UHPC) based on appropriate application of porous pumice. Constr. Build. Mater. 2019, 214, 369–381. [Google Scholar] [CrossRef]
  52. Li, J.; Zheng, B.; Bedra, K.B. Evaluating the improvements of thermal comfort by different natural elements within courtyards in Singapore. Urban Clim. 2022, 45, 101253. [Google Scholar] [CrossRef]
  53. Darvish, A.; Eghbali, G.; Eghbali, S.R. Tree-configuration and species effects on the indoor and outdoor thermal condition and energy performance of courtyard buildings. Urban Clim. 2021, 37, 100861. [Google Scholar] [CrossRef]
  54. Sun, S.; Xu, X.; Lao, Z.; Liu, W.; Li, Z.; García, E.H.; He, L.; Zhu, J. Evaluating the impact of urban green space and landscape design parameters on thermal comfort in hot summer by numerical simulation. Build. Environ. 2017, 123, 277–288. [Google Scholar] [CrossRef]
  55. Bruse, M.; Fleer, H. Simulating surface–plant–air interactions inside urban environments with a three dimensional numerical model. Environ. Model. Softw. 1998, 13, 373–384. [Google Scholar] [CrossRef]
  56. Xu, X.; Liu, S.; Sun, S.; Zhang, W.; Liu, Y.; Lao, Z.; Guo, G.; Smith, K.; Cui, Y.; Liu, W. Evaluation of energy saving potential of an urban green space and its water bodies. Energy Build. 2019, 188, 58–70. [Google Scholar] [CrossRef]
  57. Feng, L.; Yang, S.; Zhou, Y.; Shuai, L. Exploring the effects of the spatial arrangement and leaf area density of trees on building wall temperature. Build. Environ. 2021, 205, 108295. [Google Scholar] [CrossRef]
  58. Liao, J.; Tan, X.; Li, J. Evaluating the vertical cooling performances of urban vegetation scenarios in a residential environment. J. Build. Eng. 2021, 39, 102313. [Google Scholar] [CrossRef]
  59. Que, X.-L.; Min, Y.; Hong, L.; Xiao, J.-W.; Ren, M.-S.; Sun, J.-L. Optimized preparation of thermal insulation hydrophobic SiO2 aerogel based on orthogonal design method. J. Porous Mater. 2022, 29, 1027–1037. [Google Scholar]
  60. Kong, Z.; Liu, J.; Zhou, C. Simulation Research on Thermal Deviation in 700 °C Ultra-Supercritical Boiler. Energies 2022, 15, 7596. [Google Scholar] [CrossRef]
  61. Liu, Y.; Sun, Y.; Infield, D.; Zhao, Y.; Han, S.; Yan, J. A hybrid forecasting method for wind power ramp based on orthogonal test and support vector machine (OT-SVM). IEEE Trans. Sustain. Energy 2016, 8, 451–457. [Google Scholar] [CrossRef]
  62. Xue, S.; Chao, X.; Wang, K.; Wang, J.; Xu, J.; Liu, M.; Ma, Y. Impact of Canopy Coverage and Morphological Characteristics of Trees in Urban Park on Summer Thermal Comfort Based on Orthogonal Experiment Design: A Case Study of Lvyin Park in Zhengzhou, China. Forests 2023, 14, 2098. [Google Scholar] [CrossRef]
  63. Ning, Q.; Lu, J.; Li, S.; Lu, X. Structural Behavior of a Fixed-End Arched Cellular Steel Beam without Lateral Support. Buildings 2024, 14, 229. [Google Scholar] [CrossRef]
  64. Su, L.; Zhang, J.; Wang, C.; Zhang, Y.; Li, Z.; Song, Y.; Jin, T.; Ma, Z. Identifying main factors of capacity fading in lithium ion cells using orthogonal design of experiments. Appl. Energy 2016, 163, 201–210. [Google Scholar] [CrossRef]
  65. Guo, S.; Zheng, D.; Zhao, L.; Liu, X. ANN-AdaBoost model for the strength-weakening coefficient of soft clay in port engineering. Sādhanā 2023, 48, 234. [Google Scholar] [CrossRef]
  66. Teruo, M. Taguchi Methods: Benefits, Impacts, Mathematics, Statistics, and Applications; ASME Press: New York, NY, USA, 2011. [Google Scholar]
  67. Cohen, P.; Potchter, O.; Matzarakis, A. Daily and seasonal climatic conditions of green urban open spaces in the Mediterranean climate and their impact on human comfort. Build. Environ. 2012, 51, 285–295. [Google Scholar] [CrossRef]
  68. Zhang, B.; Gao, J.-X.; Yang, Y. The cooling effect of urban green spaces as a contribution to energy-saving and emission-reduction: A case study in Beijing, China. Build. Environ. 2014, 76, 37–43. [Google Scholar] [CrossRef]
  69. Bao, Y.; Gao, M.; Luo, D.; Zhou, X. The influence of plant community characteristics in urban parks on the microclimate. Forests 2022, 13, 1342. [Google Scholar] [CrossRef]
  70. Liu, S.; Kwok, Y.T.; Ren, C. Investigating the impact of urban microclimate on building thermal performance: A case study of dense urban areas in Hong Kong. Sustain. Cities Soc. 2023, 94, 104509. [Google Scholar] [CrossRef]
  71. Fu, X.; Wen, Q.; Zou, T. Design optimization of vegetation in high-ise residential areas in wind environment. Sci. Technol. Eng. 2020, 20, 12560–12569. [Google Scholar]
  72. Shan, Z. Research on the Optimization Strategy of the Summer Microclimate Landscape of Outdoor Public Space in Xi’an Urban Residential Area. Master’s Thesis, Xi’an University of Architecture and Technology, Xi’an, China, 2020. Available online: https://link.cnki.net/doi/10.27393/d.cnki.gxazu.2020.000577 (accessed on 20 May 2024).
  73. Hong, B.; Lin, B. Numerical studies of the outdoor wind environment and thermal comfort at pedestrian level in housing blocks with different building layout patterns and trees arrangement. Renew. Energy 2015, 73, 18–27. [Google Scholar] [CrossRef]
  74. Yang, Y.; Zhou, D.; Wang, Y.; Meng, X.; Gu, Z.; Xu, D.; Han, X. Planning method of centralized greening in high-rise residential blocks based on improvement of thermal comfort in summer. Sustain. Cities Soc. 2022, 80, 103802. [Google Scholar] [CrossRef]
  75. Han, L. Study on Microclimate Effects of Urban Green Space Plant Communities in Hot and Humid Regions: A Case Study of Guangzhou Campus Green Space. Master’s Thesis, South China University of Technology, Guangzhou, China, 2019. Available online: https://link.cnki.net/doi/10.27151/d.cnki.ghnlu.2019.003365 (accessed on 20 May 2024).
  76. Cheung, P.K.; Jim, C.Y.; Siu, C.T. Effects of urban park design features on summer air temperature and humidity in compact-city milieu. Appl. Geogr. 2021, 129, 102439. [Google Scholar] [CrossRef]
  77. Rui, L.; Buccolieri, R.; Gao, Z.; Gatto, E.; Ding, W. Study of the effect of green quantity and structure on thermal comfort and air quality in an urban-like residential district by ENVI-met modelling. In Building Simulation; Tsinghua University Press: Beijing, China, 2019; pp. 183–194. [Google Scholar]
Figure 1. (a) Location of Fuzhou; (b) Google Earth map of study area; (c) courtyard building and sample points; (d) measurement instruments.
Sustainability 16 04425 g001
Figure 2. Interaction diagram.
Sustainability 16 04425 g002
Figure 3. Schematic diagram of factor level and plane of orthogonal test.
Sustainability 16 04425 g003
Figure 4. The layouts of the 27 studied cases.
Sustainability 16 04425 g004
Figure 5. Linearity between the simulated data and the measured data. (a) Comparison of correlation between measured temperature and simulated results; (b) comparison of correlation between measured humidity and simulated results; (c) comparison of correlation between measured and simulated wind speed results.
Sustainability 16 04425 g005
Figure 6. Comparison of cooling effect of each test scheme.
Sustainability 16 04425 g006
Figure 7. Comparison of humidification effect of each test scheme.
Sustainability 16 04425 g007
Figure 8. Comparison of wind speed effect of each test scheme.
Sustainability 16 04425 g008
Table 1. L27 (3*13) orthogonal table.
Case12345678910111213
FactorTLSLTL × SLTL × SLGLTL × GLTL × GLSL × GLEmptyEmptySL × GLEmptyEmpty
Test
number
1111111111111
1111222222222
1111333333333
1222111222333
1222222333111
1222333111222
1333111333222
1333222111333
1333333222111
2123123123123
2123231231231
2123312312312
2231123231312
2231231312123
2231312123231
2312123312231
2312231123312
2312312231123
3132132132132
3132213213213
3132321321321
3213132213321
3213213321132
3213321132213
3321132321213
3321213132321
3321321213132
TL × SL: interactive combination of tree layout and shrub layout; TL × GL: interactive combination of tree layout and grass layout; SL × GL: interactive combination of shrub layout and grass layout.
Table 2. Final boundary condition settings.
Parameter NameParameter NameParameter Values
Grid settingsModel dimensions/size of grid cell in meters76 × 70 × 63/1 m × 1 m × 2 m
Model locationBase settingsZhuangqi Building, Qishan Campus, Fujian Agriculture and Forestry University
26.08° N, 119.23° E
Microscale roughness length of surface (m)0.01
Time and dateStart date22 June 2022
Start time6:00 am
Total simulation time13
Meteorological dataSpecific humidity in 2500 m (g/kg)7
Forcing temperature (°C)From 25.4
Forcing relative humidity (%)From 71.5
Wind direction (°)180
Wind speed (m/s)1.6
Soil sectionUpper layer (0–20 cm)20 °C/50%
Middle layer (20–50 cm)20 °C/60%
Deep layer (50–200 cm)19 °C/60%
Soils and surfaceCampus building internal roadsConcrete pavement road
Table 3. Temperature orthogonal test results.
ListTLSLTL × SLTL × SLGLTL × GLTL × GLSL × GLEmptyEmptySL × GLEmptyEmpty
Morningk128.048628.063128.068628.065928.046028.059628.061228.037828.056828.057728.045628.053828.0593
k228.105728.032328.047528.047128.055128.046428.051028.058228.046928.053228.050028.043828.0557
k328.000728.059628.038828.042128.053928.049028.042828.059028.051428.044128.059528.057528.0400
R0.10500.03080.02980.02380.00900.01310.01830.02120.00990.01360.01390.01370.0193
Noonk132.075132.098532.111732.113932.099832.101032.104232.066232.099132.099832.089632.092932.1009
k232.124332.071732.090032.085532.099132.086632.089032.105032.086532.092632.079232.083532.0973
k332.075632.104832.073332.075632.076132.087432.081832.103932.089432.082532.106232.098632.0768
R0.04920.03320.03850.03830.02370.01440.02240.03880.01260.01730.02700.01510.0241
Afternoonk130.905430.889630.876430.926730.895330.898430.894430.912930.906830.906730.918730.911130.8986
k230.915930.912130.892730.844130.907830.905630.903330.917830.900830.905630.890830.887830.8910
k330.870230.889930.922430.920830.888530.887630.893930.860930.883930.879230.882030.892730.9019
R0.04570.02250.04600.08260.01930.01800.00940.05690.02290.02750.03660.02330.0109
Table 4. Analysis of temperature variance results.
TimeSourceCalibration ModeInterceptTLSLGLTL × SLTL × GLSL × GLR Squared
MorningF7.38241,366,82748.4134.9830.4233.4321.1661.713943 (adjusted R squared = 0.815)
Sig.0.004000.0390.6690.0650.3940.239
NoonF3.74835,597,7229.2073.5712.0944.4131.1333.883894 (adjusted R squared = 0.655)
Sig.0.03100.0080.0780.1860.0360.4060.049
AfternoonF3.91420,275,9724.0591.1770.6819.4520.3884.815898 (adjusted R squared = 0.669)
Sig.0.02700.0610.3560.5330.0040.8120.028
Table 5. Calculated temperature interactions between TL and SL and between SL and GL.
Noon
TL1TL2TL3
SL132.124232.113432.0579
SL232.047332.108132.0596
SL332.053832.151432.1093
SL1SL2SL3
GL132.079132.107632.1127
GL232.106832.089332.1013
GL332.109732.018132.1005
Afternoon
TL1TL2TL3
SL130.906530.927530.8347
SL230.862730.985530.8880
SL330.947030.834730.8880
SL1SL2SL3
GL130.924830.915630.8453
GL230.914430.907930.9011
GL330.829430.912730.9233
Table 6. Humidity orthogonal test results.
ListTLSLTL × SLTL × SLGLTL × GLTL × GLSL × GLEmptyEmptySL × GLEmptyEmpty
Morningk178.890878.826578.833578.842578.895378.865578.856778.945678.870178.868578.912978.883378.8675
k278.742278.970978.908778.905378.881578.908578.896078.867878.911778.884278.904778.919478.8744
k379.041378.876978.932078.926578.897578.900378.921678.860978.892678.921578.856678.871678.9324
R0.29910.14440.09850.08390.01600.04300.06480.08460.04160.05300.05630.04780.0649
Noonk164.174764.083464.063264.061264.078064.093664.080164.207464.093964.096364.115764.111164.0908
k264.036664.182464.127764.129464.093064.129064.128364.074864.138364.109064.166864.137964.0950
k364.138264.083664.158564.158964.178464.126864.141064.067364.117264.144264.066964.100464.1636
R0.13810.09900.09530.09770.10050.03530.06090.14010.04440.04790.10000.03750.0728
Afternoonk165.674165.748865.760565.634465.695865.709065.717965.663065.689865.682865.649465.677665.7067
k265.670665.666465.729365.844065.677565.687865.699865.643865.696565.690765.722165.737365.7329
k365.793565.723065.648465.659865.764965.741465.720465.831565.752065.764765.766765.723365.6986
R0.12290.08240.11220.20960.08740.05360.02060.18770.06220.08190.11730.05970.0344
Table 7. Analysis of humidity variance results.
TimeSourceCalibration ModeInterceptTLSLGLTL × SLTL × GLSL × GLR Squared
MorningF5.371924,334,464.295429.15427.00310.09832.96781.03502.0431924 (adjusted R squared = 0.752)
Sig.0.01020.00000.00020.01750.90740.08900.44580.1809
NoonF3.708315,631,412.72756.49164.12873.72233.09290.90395.5192893 (adjusted R squared = 0.652)
Sig.0.03210.00000.02110.05860.07200.08160.50520.0197
AfternoonF3.970911,499,819.71184.34561.57531.88687.29480.37966.2910899 (adjusted R squared = 0.673)
Sig.0.02620.00000.05280.26500.21320.00890.81740.0137
Table 8. Calculated humidity interactions between TL and SL and between SL and GL.
Noon
SL1SL2SL3
GL164.135064.052564.0463
GL264.068664.109064.1015
GL364.046664.385664.1032
Afternoon
TL1TL2TL3
SL165.679665.670365.8964
SL265.775665.481765.7420
SL365.567065.860065.7420
SL1SL2SL3
GL165.618865.634565.8342
GL265.653965.686665.6919
GL365.973765.678165.6429
Table 9. Wind speed orthogonal test results.
ListTLSLTL × SLTL × SLGLTL × GLTL × GLSL × GLEmptyEmptySL × GLEmptyEmpty
Morningk10.11550.11420.11570.11570.11680.11570.11570.11520.11570.11570.11670.11570.1157
k20.11490.11630.11620.11570.11630.11620.11570.11620.11620.11570.11470.11620.1157
k30.11730.11710.11570.11610.11460.11570.11610.11620.11570.11620.11620.11570.1162
R0.00240.00280.00050.00040.00220.00050.00040.00110.00050.00050.00200.00040.0005
Noonk10.10880.10890.11050.11050.11130.11040.11040.11000.11050.11040.11130.11050.1105
k20.10880.11120.11090.11040.11090.11080.11050.11090.11080.11050.10960.11080.1105
k30.11410.11170.11040.11080.10950.11050.11080.11090.11050.11080.11090.11050.1108
R0.00530.00280.00050.00040.00180.00040.00040.00090.00040.00040.00170.00040.0004
Afternoonk10.10530.10890.11120.10910.11070.11020.11020.11030.10990.10990.11020.10980.1099
k20.10880.11010.11010.11200.11030.10990.10990.11020.10990.10990.11070.11030.1103
k30.11640.11140.10920.10930.10950.11040.11040.11000.11070.11070.10950.11040.1103
R0.01110.00250.00190.00290.00110.00050.00050.00030.00080.00090.00110.00050.0004
Table 10. Analysis of wind speed variance results.
TimeSourceCalibration ModeInterceptTLSLGLTL × SLTL × GLSL × GLR Squared
MorningF11.0936593,680.961823.335931.542919.97910.90850.962010.6216961 (adjusted R squared = 0.875)
Sig.0.00080.00000.00050.00020.00080.50290.47790.0028
NoonF35.0500845,170.9760215.786050.773019.95101.27200.969012.2270987 (adjusted R squared = 0.959)
Sig.0.00000.00000.00000.00000.00100.35700.47500.0020
AfternoonF27.7766237,786.5557211.061210.23472.244711.60510.45271.1665984 (adjusted R squared = 0.949)
Sig.0.00000.00000.00000.00620.16830.00210.76850.3937
Table 11. Calculated wind speed interactions between TL and SL and between SL and GL.
Morning
SL1SL2SL3
GL10.11530.11790.1172
GL20.11380.11780.1171
GL30.11360.11310.1170
Noon
SL1SL2SL3
GL10.10970.11250.1117
GL20.10850.11250.1117
GL30.10840.10850.1116
Afternoon
TL1TL2TL3
SL10.10400.10660.1161
SL20.10710.10680.1166
SL30.10480.11290.1166
Disclaimer/Publisher’s Note: The statements, opinions and data contained in all publications are solely those of the individual author(s) and contributor(s) and not of MDPI and/or the editor(s). MDPI and/or the editor(s) disclaim responsibility for any injury to people or property resulting from any ideas, methods, instructions or products referred to in the content.

