Article

Study on the Partial Paste Backfill Mining Method in a Fully Mechanized Top-Coal Caving Face: Case Study from a Coal Mine, China

1
College of Energy and Mining Engineering, Shandong University of Science and Technology, Qingdao 266590, China
2
Shandong Energy Group Northwest Mining Company, Xi’an 710018, China
3
Shandong Energy Group Dispatching Command Center, Jinan 250101, China
*
Author to whom correspondence should be addressed.
Sustainability 2024, 16(11), 4393; https://doi.org/10.3390/su16114393
Submission received: 1 April 2024 / Revised: 22 April 2024 / Accepted: 16 May 2024 / Published: 22 May 2024

Abstract

:
Paste backfill mining is an significant part of green coal mining, which can improve resource utilization and extend the service life of mines. It is important for solving the “three under, one above” mining problem and avoiding industrial wastes such as coal gangue and fly ash that occupy farmland and pollute the environment. To address the difficult filling problem of a fully mechanized top-coal caving face (FMT-CCF), a new method of partial paste backfill mining is herein proposed. First, the partial paste backfill mining method and implementation steps of the FMT-CCF are introduced in detail. Then, the mechanistic model of the roof beam in partial paste backfill mining is established. Then, the filling structural factors on the filling effect of the 42105 FMT-CCF are determined. Dependent on the assay of the migration law of overlying stratum after filling, numerical simulation analysis is used to research the feature effect of the main filling structural factors on the filling effect. Finally, the paste filling rate, filling width, and filling strength suitable for the 42105 FMT-CCF are obtained. When the filling rate reaches 100%, a significant alteration takes place, resulting in the efficient decrease of the overlying rock stress arch shell’s height. As the width of the filling body expands from 10 m at each end to 20 m, the stress arch of the overlying rock experiences maximum reduction, specifically decreasing by approximately 14 m. When the strength of the filling body is greater than 0.4 GPa, the filling effect is better. This study has important guidance and reference significance for the partial paste backfill of FMT-CCF in thick seam mining.

1. Introduction

Coal mining can give rise to significant ecological and environmental issues on the surface, including surface subsidence, structural damage of buildings, and loss of surface water resources [1,2,3,4,5]. The primary reason for these issues is the instability of the overlying strata beam, resulting from coal extraction [6,7,8,9,10]. Paste backfill technology, a crucial component of green coal mining, plays a vital role in prolonging mine lifespan, supporting the overlying strata, and mitigating ground collapse in coal mines [11,12,13]. Nevertheless, the implementation of this technology poses numerous challenges under specific mining conditions [14,15,16,17]. Thus, it is significant to research the paste backfill mining method under special conditions.
Currently, numerous researchers have conducted extensive studies on the backfill mining method under special conditions and obtained intriguing results. Xu et al. [18] introduced three distinct partial-filling coal mining techniques: subsequent filling of the short wall caving area, isolated grouting filling of the overlying rock, and synchronous filling of longwall piers. These techniques aim to address the challenges of low filling mining efficiency and high filling costs. Deng et al. [19] presented a novel cemented filling method known as the upward layered longwall–roadway technique. This innovative approach involves filling the goaf with paste, which subsequently serves as the top plate for the top-slicing working face. This method closely resembles the upward excavation and filling method. Cao et al. [20] proposed a wide strip filling mining method aimed at alleviating the tension between achieving a high recovery rate and minimizing environmental hazards. Lu et al. [21] employed shortwall gangue-cemented backfilling technology to address the issues of high investment costs, limited adaptability to diverse geological conditions, and the interference between mining and filling operations commonly encountered in longwall filling mining. Liu et al. [22] utilized numerical modeling software to investigate the overlying strata’s evolution patterns under three distinct mining conditions: intermittent cut and fill, longwall excavation, and continuous fill. Their findings reveal that the intermittent filling and excavation method is effective in mitigating overburden damage and subsidence.
The aforementioned research results are highly significant in enhancing our understanding of filling mining under special conditions. Furthermore, the filling effect is influenced by numerous structural factors [23,24,25]. Numerous scholars have conducted studies on the stress and deformation characteristics of the wall rock in mining rooms using compacted filling plates in coal mines [26,27,28]. Their findings indicate that the primary factor influencing the cracking of the main roof is the infill rate [29,30,31]. Zhou et al. [32] conducted a comprehensive analysis of the geological conditions and structural characteristics of the dam. Their findings revealed that the deformation of the dam body is influenced by factors such as the filling rate and the equivalent exploiting height of the working surface. Ma et al. [33] employed numerical simulation software to investigate the intricate correlation between the compression ratio of the filler mass and the prediction parameters of surface subsidence. Sun et al. [34] conducted a study on the impact of various strip filling conditions on the water-conducting fracture zone, utilizing discrete element numerical tests. Their findings emphasized that the width and strength of the backfill are the primary controllable factors that significantly influence the stability of the overlying strata.
At present, numerous scholars have conducted extensive and increasingly sophisticated research on various filling methods and the diverse factors that influence their effectiveness [35,36,37]. However, the research on filling mining beneath fully mechanized top-coal caving faces (FMT-CCF) remains relatively scarce, and there is still a paucity of studies focusing on partial-filling mining. The filling mining technique that has been studied by prior scholars typically operates within a standard application environment, implying the availability of sufficient space for filling operations. Nevertheless, the collapse of the top coal within the FMT-CCF results in limited or nonexistent filling space, posing significant challenges in terms of filling operations. The traditional backfill mining method is unsuitable for application in FMT-CCF. Nevertheless, partial paste backfill mining methods offer a viable solution to the filling challenges encountered in the FMT-CCF. Additionally, this approach serves as an effective means of safeguarding the surface’s linear structure. Furthermore, it stands as one of the efficient techniques for managing solid waste accumulation within FMT-CCF.
In this paper, the filling mining method under the condition of combined mining caving coal is explored. We propose a novel partial paste backfill method specifically tailored for this type of mining. To understand the impact of filling structure factors on the filling effect, we conducted theoretical analysis and numerical modeling. Our aim is to establish reasonable filling parameters and establish a scientific foundation for future research on filling mining in FMT-CCF environments.

2. Partial-Filling Mining Method

2.1. Technical Principles

Partial-filling mining technology was developed, capitalizing on the unused space behind the end transition support and the abandoned roadways adjacent to the goaf in an FMT-CCF. In other words, the top coal will remain undisturbed within the transition support zones at both ends of the FMT-CCF. Simultaneously, the filling space within the designated range is promptly supported. Paste backfill technology is used to fill the formed filling space. The filling body utilized in this method exhibits excellent roof contact, resulting in efficient suppression of the overlying layer’s movement.

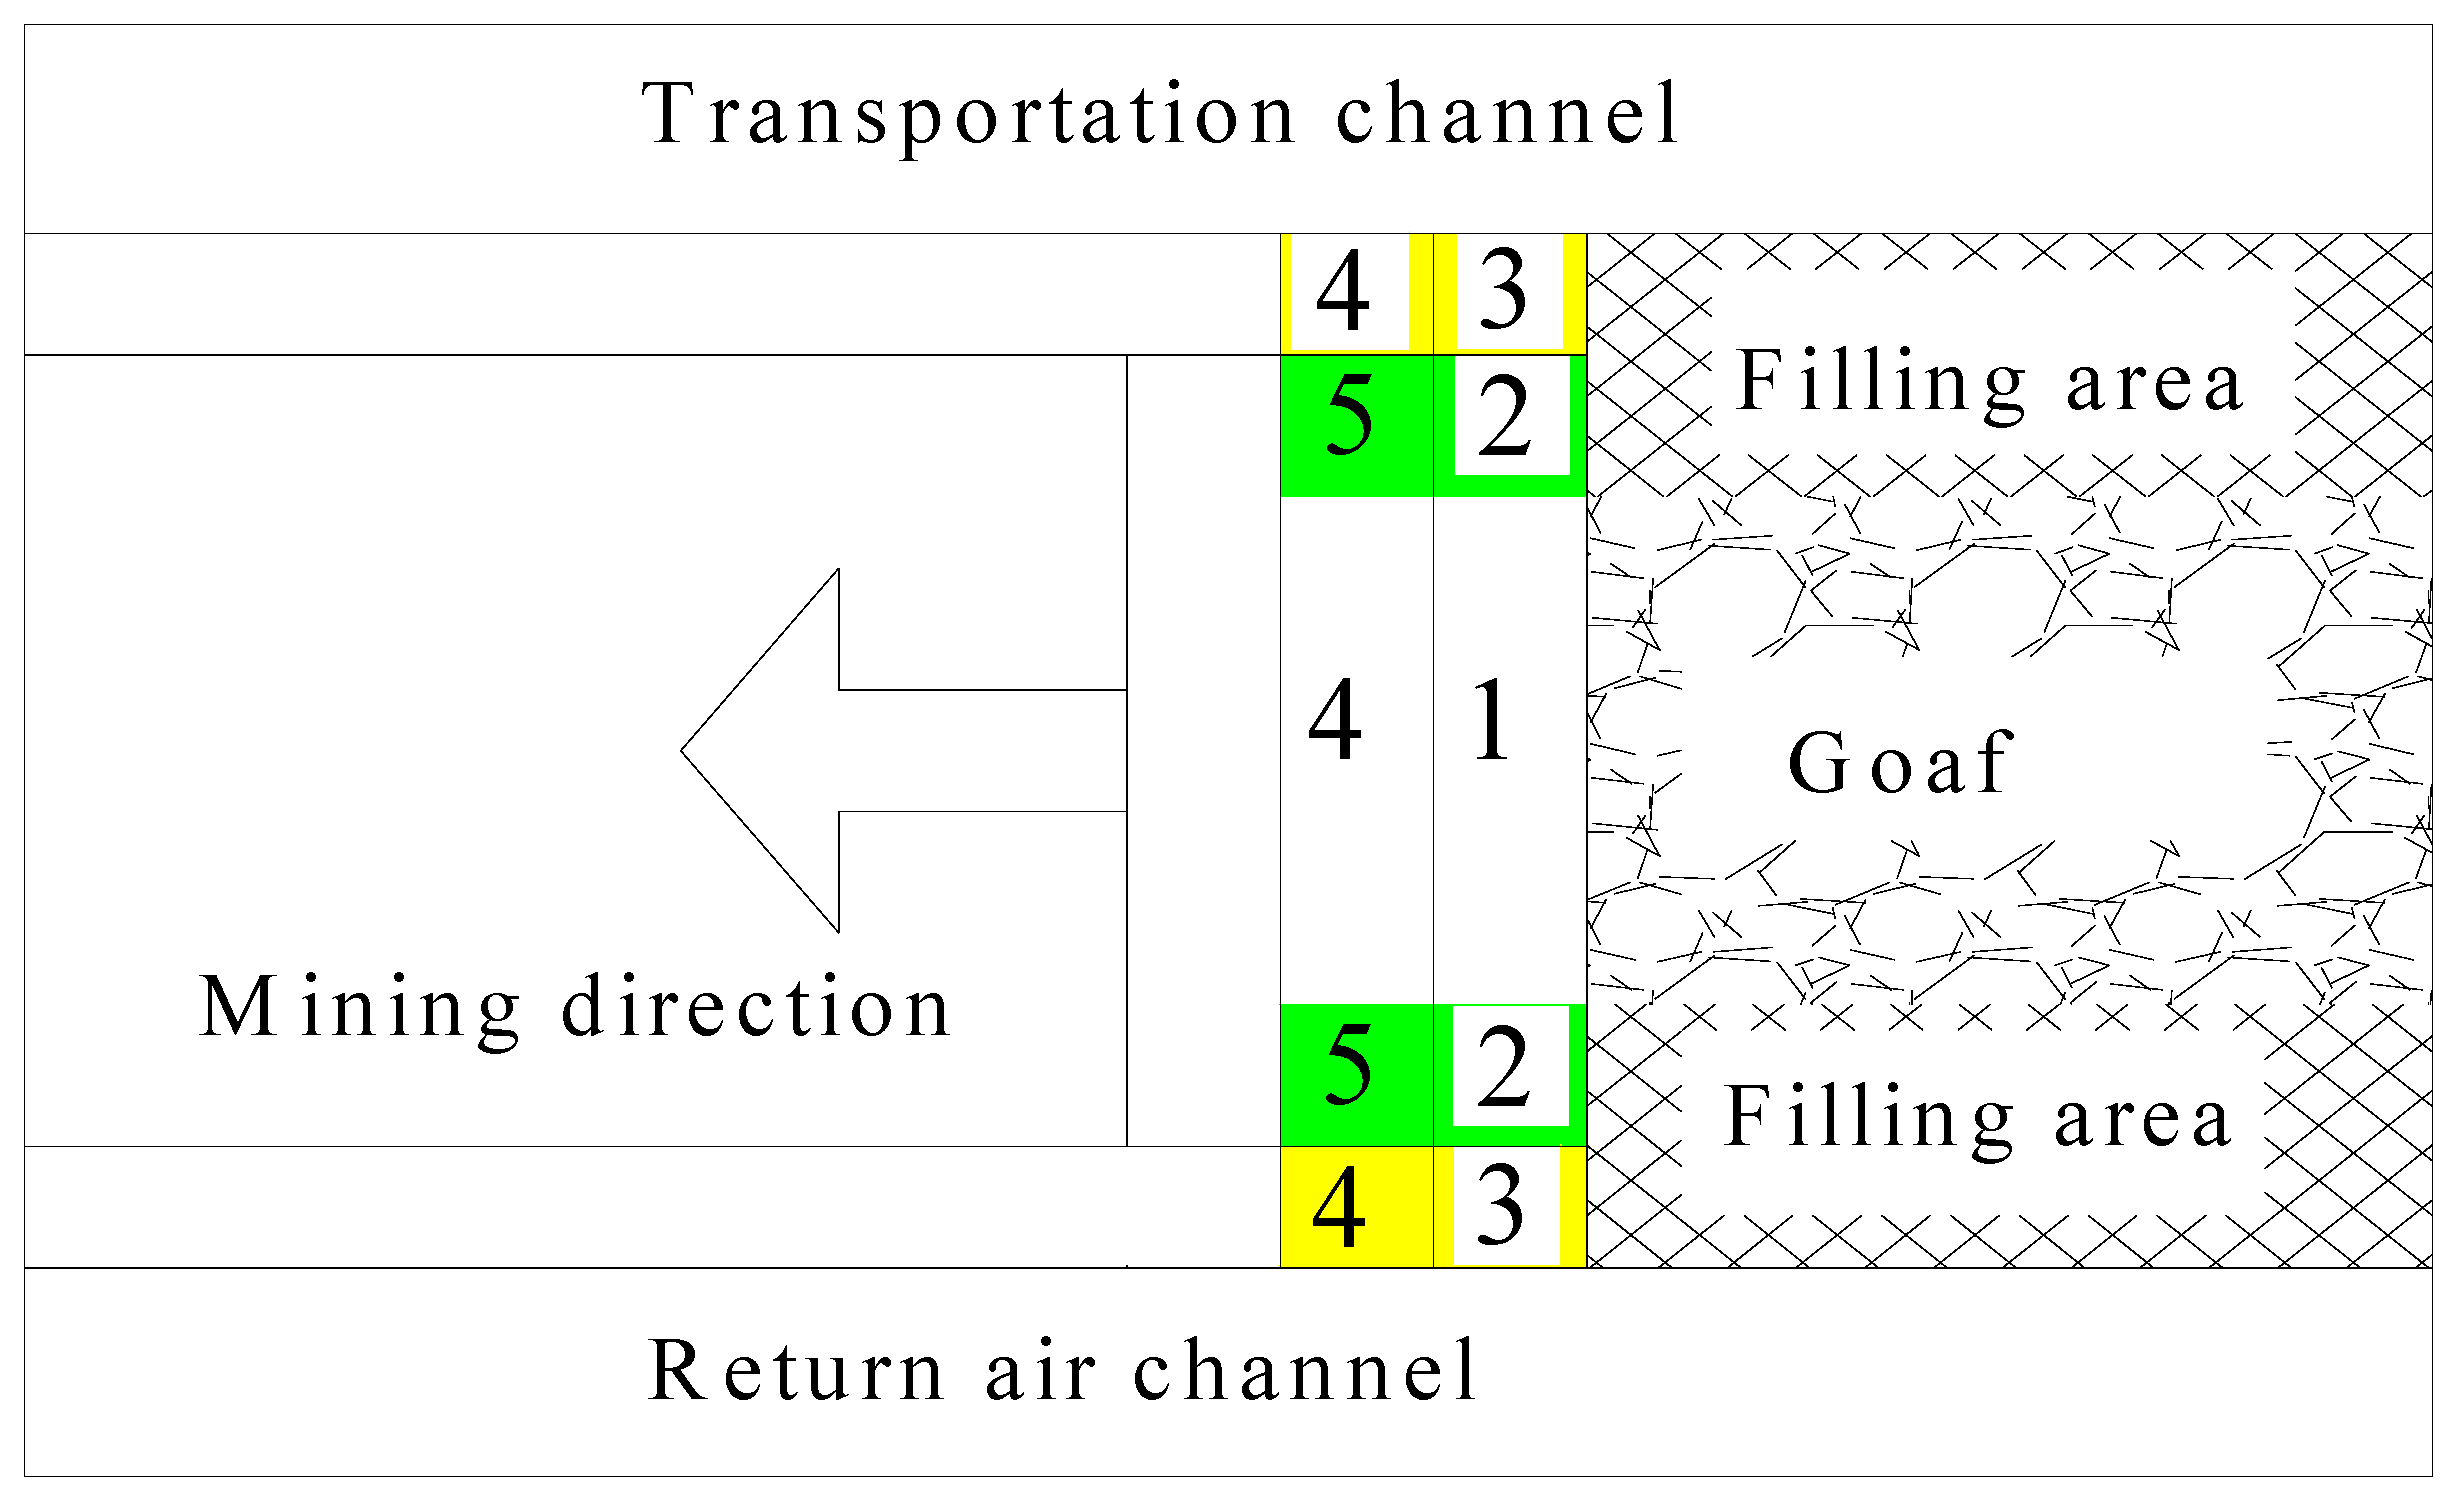
2.2. Mining and Filling Process

Partial paste backfill mining technology encompasses three key aspects: pre-mining preparation, filling space construction, and the filling process.

2.2.1. Pre-Mining Preparation

Prior to the shearer cutting the coal on the working face, a metal mesh is positioned within the transition brackets situated at both ends of the working surface and roadway. Anchor rods are subsequently inserted to provide reinforcement support. Once the anchor rod is driven into the top coal, a conical distribution of compressive stress is established in the surrounding area, ensuring structural integrity and reinforcement. As the number of anchor rods increases, the stress zones created by each rod begin to overlap and interact. Additionally, the interaction of multiple anchor rods creates an arch structure that effectively suppresses the expansion of the fractured zone within the top coal. This structural reinforcement not only enhances the overall stability of the coal face but also creates a favorable environment for the construction and maintenance of the filling space.

2.2.2. Filling Space Construction

Using a support structure to support the goaf behind the transition support, as shown in Figure 1, the filling space is constructed as follows.
After the installation of the metal mesh and anchor rod, the working face proceeds with the standard coal mining process. This involves a repetitive cycle of coal cutting, hydraulic support pushing, and scraper conveyor pushing. Within the span of the transition hydraulic supports at both ends, top coal will not be discharged, whereas the other regions will undergo normal top-coal mining. Temporary support is established through the installation of individual hydraulic props in the spaces located behind the transition brackets at both extremities as well as in the roadway positioned on either side. After the top-coal caving process is completed, the cycle of coal cutting and setting up individual hydraulic pillars is continued until the cycle filling step is reached.
Upon reaching the filling step, the coal mining process ceases temporarily. In the designated filling zone, a wooden prop is employed to replace an individual hydraulic prop for support. Beneath the wooden props, the hydraulic prop positioned in the standby area is retrieved. Subsequently, beneath the wooden pillars, the hydraulic props in the filling area are systematically collected in rows, progressing from the farthest to the nearest positions.
After retrieving the single hydraulic props in the filling area, a tarpaulin is securely fastened to the roof utilizing the hydraulic props. To guarantee that the tarpaulin remains close to the floor of the working surface and prevents the paste filling material from infiltrating the workspace, a specific length of the tarpaulin is reserved at the base and folded inward. Concurrently, any loose coal present on the ground within the filling area is manually removed, and woven bags filled with coal or other mine debris are employed to compress the tarpaulin. It is verified that the paste filling slurry remains confined and does not penetrate the working face, thus preserving normal production operations. At this juncture, the construction of the filling space is deemed complete.

2.2.3. Filling Process

Prior to filling, the hose is connected to the filling pipeline extending from the return airway and the transport roadway of the working surface. This connection establishes a linkage between the filling pipeline and the constructed filling space, thereby establishing the necessary prerequisites for the implementation of the filling operation. The distal end of the hose is inserted into the highest point of the designated filling area. To guarantee optimal filling efficiency, it is crucial that the length of the filling hose extending into the deep filling area measures no less than 0.5 m. Once the hose is properly positioned, the ground filling station activates the filling pump to commence the filling process. To prevent blockage of the filling pipeline and ensure uninterrupted filling operations, clean water is employed to flush the pipeline after each filling cycle, minimizing the risk of pipe congestion.

3. Analysis of Filling Structure Factors Affecting the Filling Effect in End Partial Filling Mining

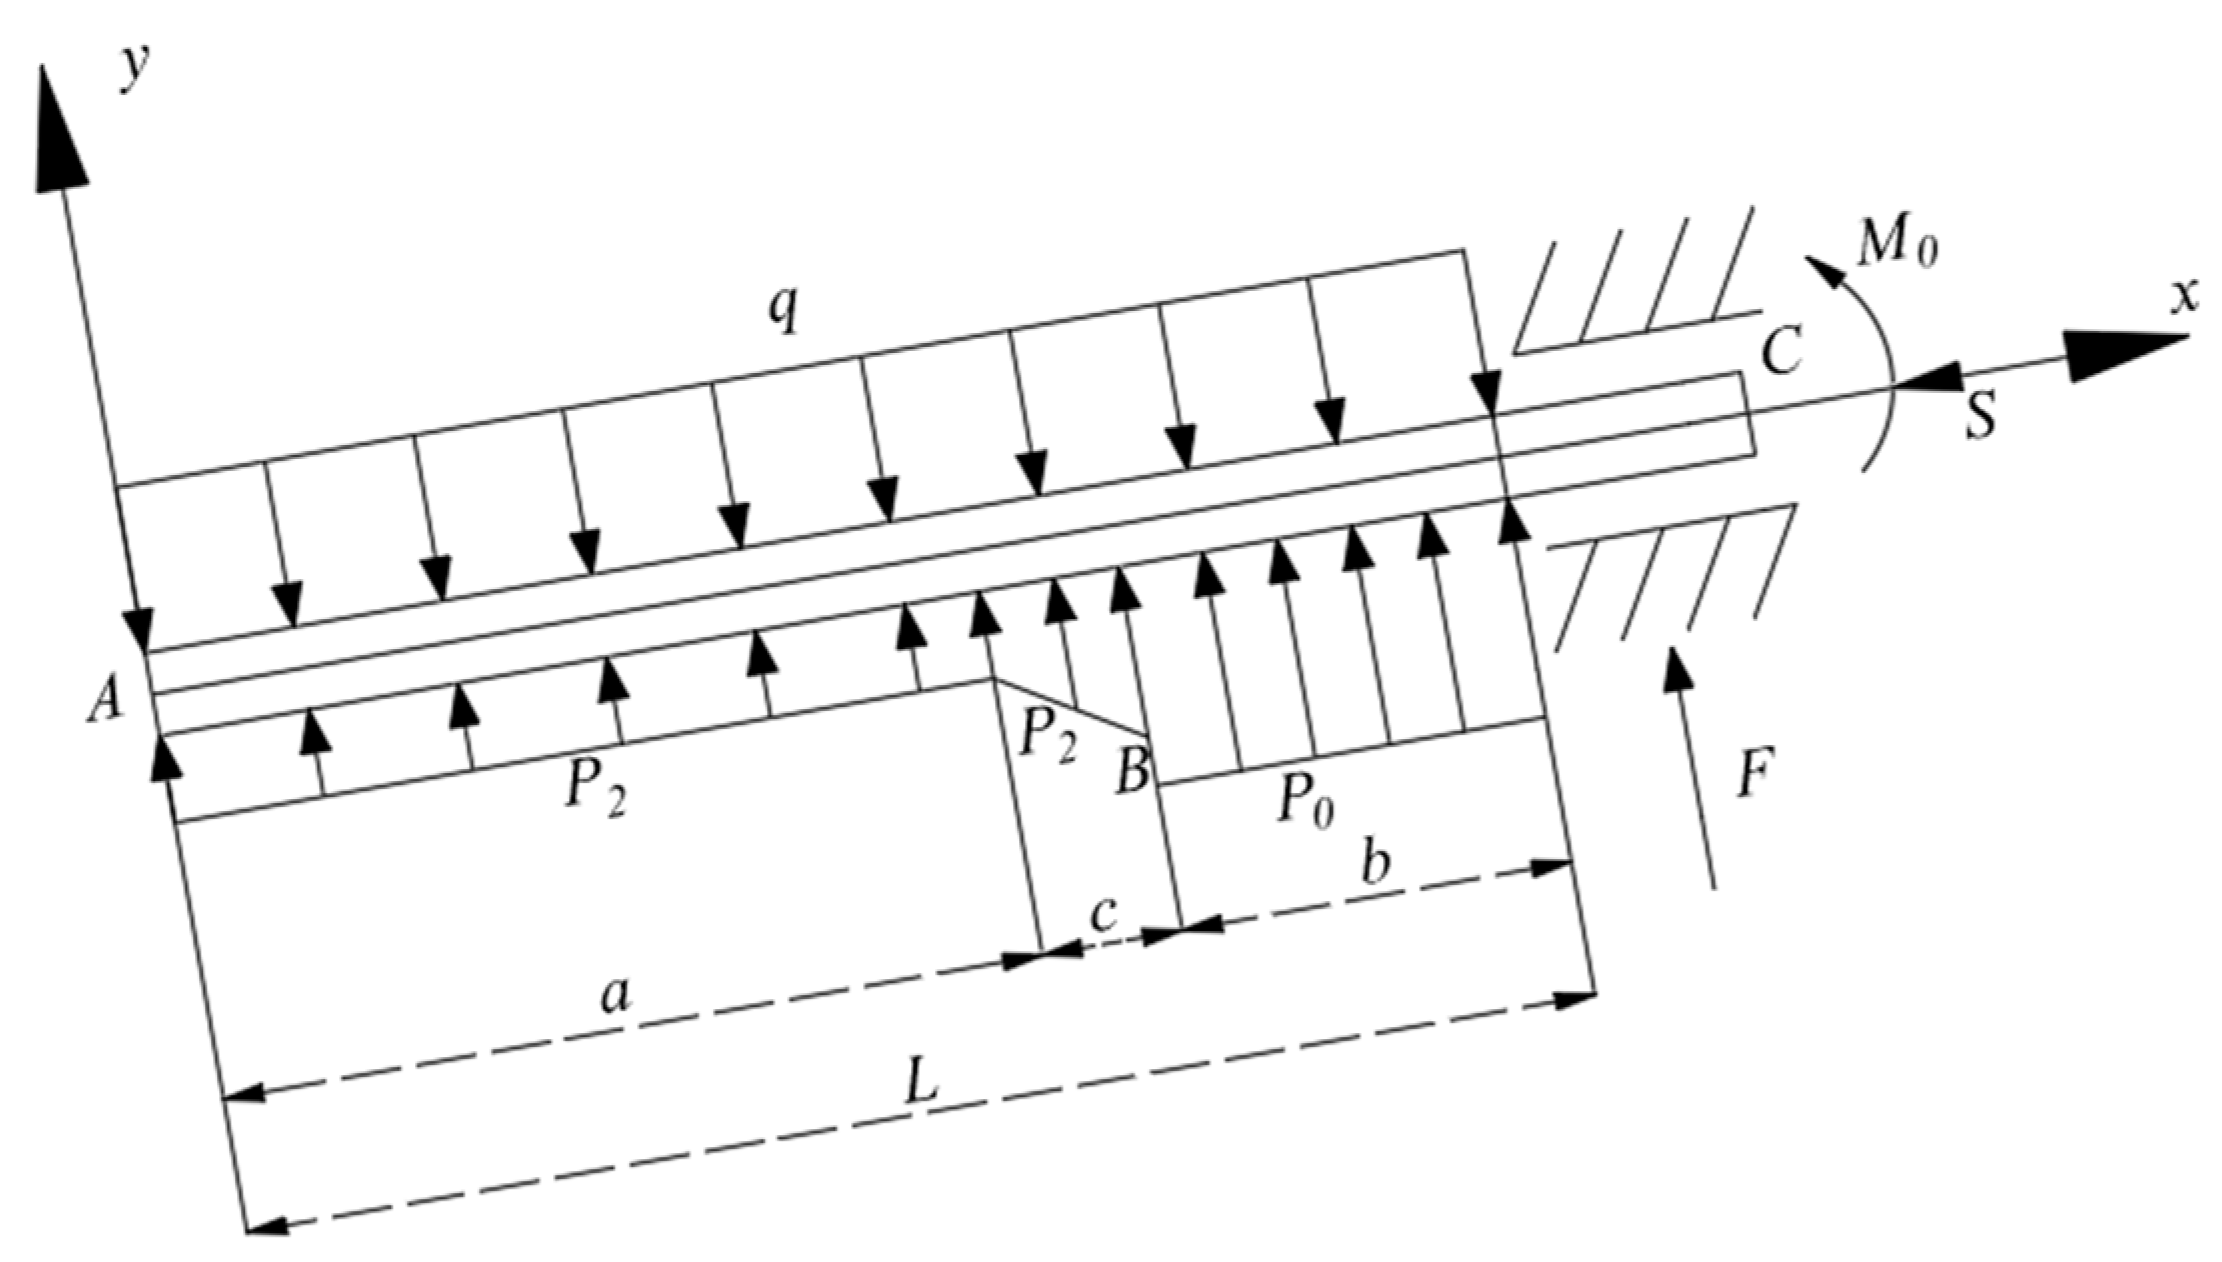
3.1. Establishment of the Mechanical Model of the Roof Beam

Based on the stress patterns exhibited by the roof at the terminus of the FMT-CCF [38,39], a stress analysis was conducted considering a roof beam with unit width along the inclined direction of the face. Subsequently, a mechanical model was constructed to represent this scenario, as depicted in Figure 2. In the figure, the dip angle of the coal seam is denoted as α. The length of the working face is represented by L. The thickness of the roof is indicated as H. The elastic modulus of the materials involved is designated as E, the inertia moment of the coal body is represented by I, and its unit weight is denoted as γ. Furthermore, the burial depth of the coal seam is specified as Ya. Regarding the fallen gangue, its filling width is designated as a, and the filling width behind the transition support located at the right end of the working face is designated as b. In this context, the filling body situated on one side of the working face serves as the primary focus of our investigation. Point A is designated as the origin of the coordinate system, with the inclination direction of the working face representing the x-axis and the upward direction perpendicular to the roof serving as the y-axis. Consequently, an A-xy right-angle coordinate system is established, as illustrated in Figure 2.
It is assumed that the load acting on the overlying strata is a uniformly distributed load, q = Y a γ , and that the gangue is filled in the working face behind the span, P 2 ( x ) = k 1 q cos α , with 0 ≤ x < a, where k1 is the coefficient of the compaction rate. During the filling process, a portion of the filling slurry flows into the goaf, mingling with the fallen gangue to form a mixed filler mass. This mixed mass effectively supports the roof, thereby enhancing the supporting capacity of the gangue originally present in the goaf. For the sake of simplicity and convenience in the calculation process, it is assumed that the load exerted by the mixed filler mass meets triangular distribution characteristics, that is, P 2 ( x ) = k 1 q c x c cos α , and ax < a + c.
Therefore, the load of the gangue falling from the overall goaf is as follows:
P 2 ( x ) = k 1 q cos α       0 x < a k 1 q c x c cos α     a x < a + c
Assume that the load distribution of the filling body located behind the transition support is uniform, that is, P 0 = k 2 q , where k2 is the infill rate coefficient, and that the tangential load of the coal body at the coal rib on one side of the working face S = Y a γ sin α H . Drawing upon the mechanical model depicted in Figure 2, the bending moment theory from material mechanics reveals the following.
The differentiated formula of the AB flexibility curve of the roof rock beam is as follows:
y A B ( x ) = M 0 E I + F E I ( L x ) S E I y A B ( x ) q 2 E I ( L x ) 2 + P 0 2 E I b 2 + x a P 2 ( ξ ) ( ξ x ) d ξ
where 0 x < a .
The differential equation of the BC deflection curve of the roof rock beam can be expressed as follows:
y B C ( x ) = M 0 E I + F E I ( L x ) S E I y B C ( x ) q 2 E I ( L x ) 2 + P 0 2 E I b 2
where a x < L .
In the formula, F, S, and M0 represent the binding force and bending moment at the coal wall C on one side of the working face. Based on the stress characteristics and constraints of AB and BC, their respective boundary conditions are as follows:
y A B ( 0 ) = 0 y B C ( L ) = 0    θ A B ( 0 ) = 0 θ B C ( L ) = 0    y A B ( a ) = y B C ( a ) θ A B ( a ) = θ B C ( a )
Then, the equations representing the deflection curves of section AB and section BC of the roof rock beam are as follows:
y A B = C 1 cos S x E I + C 2 sin S x E I + 1 6 a S 2 ( 6 a E I q + 6 a F L S + 6 a M 0 S +              3 a b 2 P S 3 a L 2 q S 6 a F S x + 6 a L q S x 2 3 a q S x 2 6 a E I P 0 +              6 E I x P 0 3 a 2 S x P 0 + 3 a S x 2 S x 3 P 0 )
y B C ( x ) = 1 2 S 2 ( E I P + 2 E I q + 2 F L S + 2 M 0 S + L 2 P S L 2 q S 2 F S x                    2 L P S x + 2 L q S X + P S x 2 q S x 2 ) + C 3 cos S x E I + C 4 sin S x E I
Then, the equations describing the bending moments of section AB and section BC of the roof rock beam are as follows:
M A B = E I S C 1 cos S x E I E I S C 2 sin S x E I E I + 6 a q S + 6 a S P 0 6 S x P 0 6 a S 2
M B C = E I 2 P S 2 q S 2 S 2 S C 3 cos S x E I E I S C 4 sin S x E I E I
The equations that govern the angular characteristics of sections AB and BC of the roof rock beam are as follows:
θ A B = S C 2 cos S x E I E I S C 1 sin S x E I E I + 1 6 a S 2 ( 6 a F S + 6 a L q S 6 a q S x + 6 E I P 0 3 a 2 S x P 0 3 S x 2 P 0 )
θ B C = 2 F S 2 L P S + 2 L q S + 2 P S x 2 q S x 2 S 2 + S C 4 cos S x E I E I S C 3 sin S x E I E I
Using the aforementioned formulas, the deflection curve, bending moment, and rotation angle equations for sections AB and BC of the roof can be derived. The parameters involved in these equations are defined as follows: A represents the coal inclination angle. L denotes half the length of the working face. b stands for the filling width after scaffolding. a refers to the width of the goaf-caving gangue. H represents the thickness of the roof panel. E is the elastic modulus. I represents the moment of inertia of the coal body. γ denotes the unit weight. q represents the equivalent uniform load of the overlying rock stratum. P2(x) represents the load of the goaf-caving gangue. P represents the load of the post-scaffolding filling. S represents the concentrated load of the coal rib at the right end of the working face.
As a theoretical exploratory study, the model’s construction incorporates parameters derived from geological data and theoretical calculations specific to the coal mine. These parameters include α, L, H, E, I, k1, γ, Ya, q, P2(x), P0, and S. However, it is noteworthy that the infill rate k2 and the length b of the filler mass located behind the transition support remain as undetermined parameters.

3.2. The Main Filling Structural Factors Affecting the Filling Effect

During the application of the caving method for managing the goaf of the FMT-CCF, the roof rock stratum undergoes bending due to the combined pressure exerted by its own weight and the overlying rock stratum, subsequent to coal excavation [40,41]. As the working surface progressively advances, the mining space expands, resulting in a continuous increase in the area of the direct roof overhang. Once the immediate roof attains its maximum span, it begins to collapse [42,43,44,45,46]. As the working face advances, the undrawn top coal and the backward rock mass accumulate in the goaf. Consequently, the basic roof loses its support from the direct roof, undergoing gradual deformation until it fractures. This repetitive process occurs as the mining operation progresses. It is evident from the preceding analysis that the existence of exposed voids triggers the movement of roof rock strata. Following the adoption of partial-filling mining, an unequal-strength-bearing structure is established, comprising the “coal wall-filling body width-fallen gangue”, which sustains the overlying strata. This process modifies the original geometry of the goaf, decreasing the exposed space and limiting the roof’s flexural displacement capacity. Consequently, it reduces the scope and severity of damage when the roof rock fractures.

3.2.1. Filling Rate

In filling mining operations, an increase in the filling rate leads to a decrease in the available space for roof and wall rock movements within the goaf [47]. Simultaneously, a high filling rate mitigates the extent and severity of roof damage as well as the appearance of ground pressure on the working face. Therefore, it is crucial to maintain a high filling rate to effectively control the wall rock. The filling effect of the filling slurry must be monitored in a timely manner according to national standards or filling purposes.

3.2.2. Width of the Filling Body

After the coal bed is extracted, the pressure of the overlying stratum is primarily supported by the coal pillars flanking the working surface, the filling body positioned at both ends, and the gangue remaining in the goaf. The strength of the filling mass is typically superior to the other two components, enabling it to provide a more effective bearing capacity. Consequently, a wider filling mass results in a better control over the overlying strata. However, due to the limitations of FMT-CCF, its length cannot fully cover the goaf. Additionally, extending the length of transition support without coal caving results in increased coal resource waste. Taking into account factors like mine production capacity, the challenges in acquiring paste filling materials, and filling capacity, it becomes imperative to determine an optimal end filling width.

3.2.3. Strength of the Filling Body

For paste filling, its strength is a crucial factor that determines the shape and stability of the filling mass under pressure [48]. The paste filling slurry begins to set after a certain period of time once it enters the goaf, eventually forming a filler mass with considerable strength to support the overlying strata. The higher the strength of this filler mass, the less deformation it will undergo under the pressure of the overlying strata. Consequently, the displacement deformation caused by the overburden is also minimized. The factors that affect the strength of paste filling primarily include the particle size grading of the gangue aggregate, material ratio, additives, as well as other factors. Adjusting the material ratio, introducing an early strength agent, and employing other techniques can effectively enhance the strength of the filler mass. This not only mitigates the displacement and deformation of the wall rock but also contributes to a more effective filling outcome.
Based on the preceding analysis, a numerical modeling approach was employed to comprehensively assess the stress distribution and migration patterns of the overlying strata under varying filling rates, end filling widths, and filling strengths. This method aimed to delineate the influence characteristics of key filling structural factors on the overall filling effect. The aim was to implement a rational filling structure that effectively regulates the stress distribution and minimizes deformation damage to the confined rock in the combined mining caving coal working face.

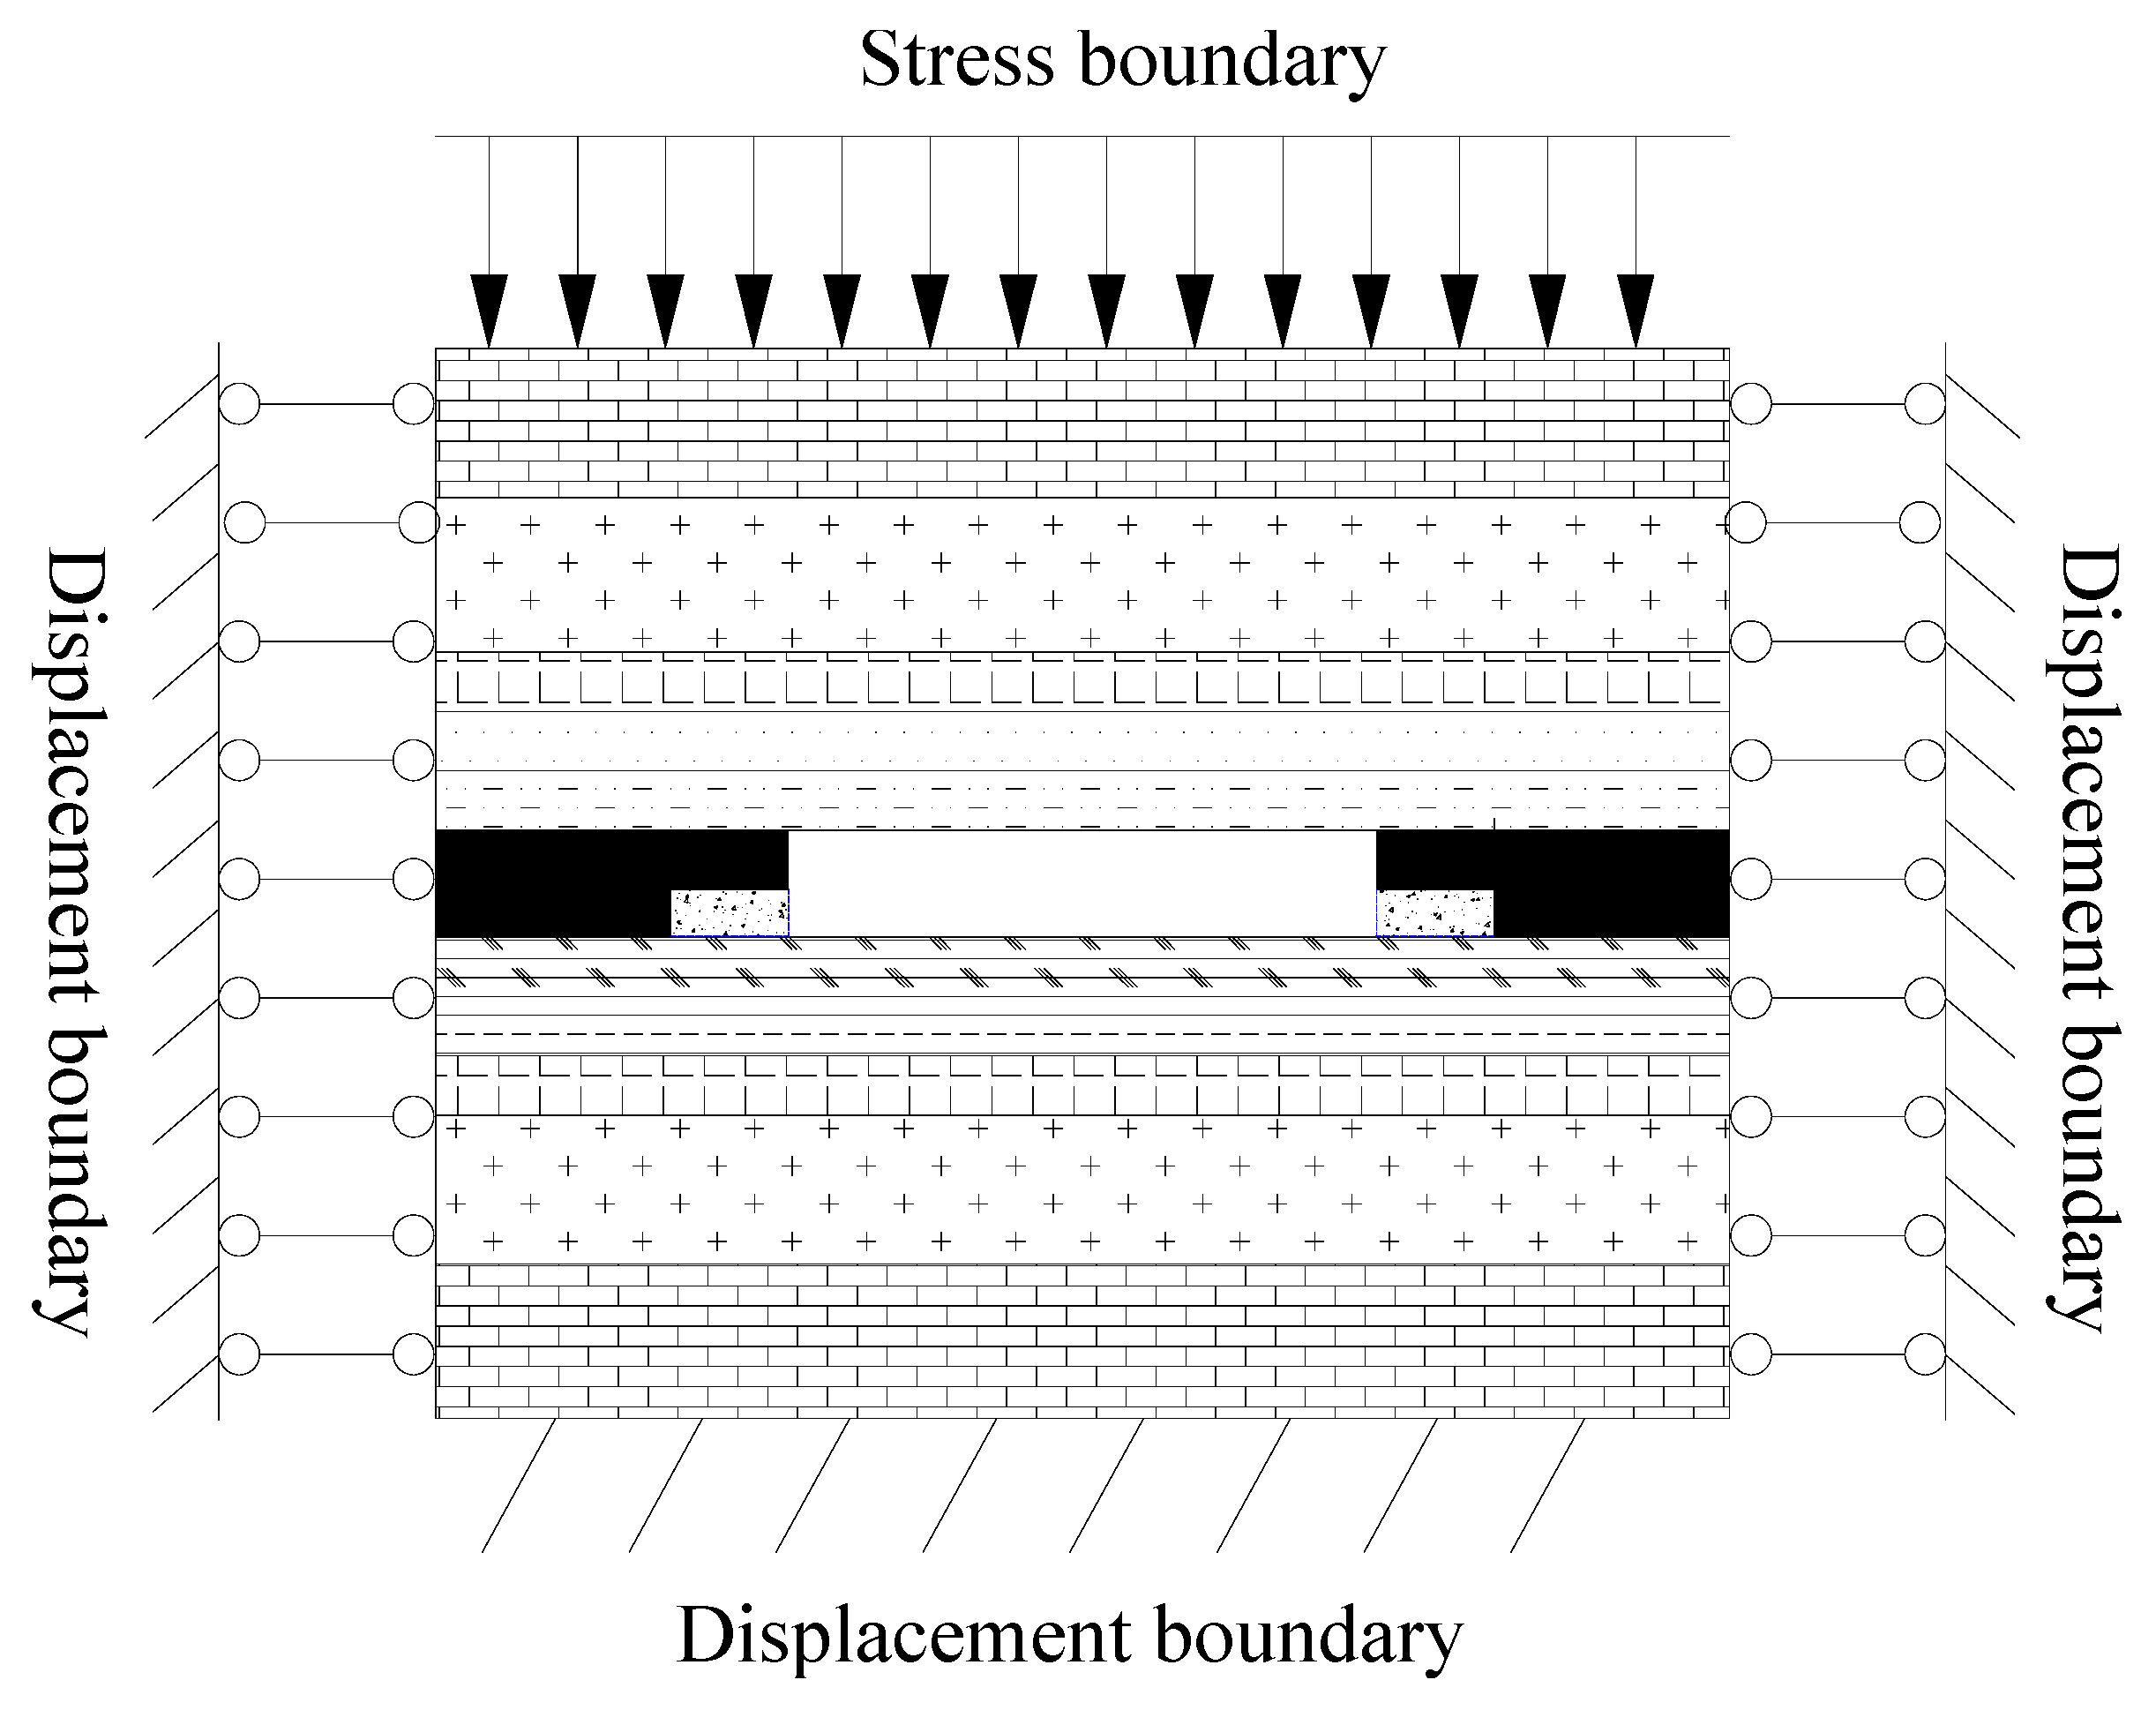
4. Establishment of Models in Numerical Simulation

In our previous study, we conducted a theoretical analysis of partial-filling mining techniques used in the transition support area of fully mechanized top-coal caving operations. This analysis revealed that the infill rate, along with the width and intensity of the filler mass, are the primary factors that significantly impact the overall filling effect. To delve deeper into the mechanics of overburden movement as it responds to varying infill factors, a comprehensive analysis of the infill effect on the 42,105 working surface was conducted using numerical modeling.
Based on the actual geological data of the 42,105 working surface, a numerical model was constructed. To eliminate any potential influence of the model boundary size on coal extraction, additional boundaries have been added around the perimeter of the model.
The model exhibits limited horizontal degrees of freedom, and there are constraints on both horizontal and vertical degrees of freedom at the base. The upper surface of the model represents a free surface, allowing for unrestrained movement in that direction. To simulate the equivalent load arising from the actual burial depth, a vertical stress of 12 MPa is applied. As shown in Figure 3, the model measures 220 m in length, 200 m in width, and 180 m in depth. The working surface extends for 120 m, while a safety coal column of 40 m is maintained on both sides to mitigate any potential boundary effects that could influence the simulation results. To accurately replicate the coal seam excavation process and ensure that the excavated coal body remains excavated, preventing its restoration and triggering the movement of the overlying strata, the constitutive model utilizes the Mohr–Coulomb model in conjunction with the large deformation mode strain mode. The brick element is employed to meticulously simulate both the coal-series strata and the working face. This discretization approach, with a total of 98,560 units and 105,165 nodes, ensures a comprehensive and detailed representation of the geological features and excavation processes. The coal rock mass parameters are presented in Table 1.
Once the model is established, the specific parameters of each layer are assigned to accurately reflect the varying properties of different coal strata encountered in actual mining operations. Following the parameter assignment, the initial equilibrium of the model is calculated. After the initial equilibrium calculation, the original rock pressure within the coal bed in the model is determined by recording the normal pressure at the grid nodes of the coal rake. The original rock pressure is approximately 16 MPa. To further elaborate on the mining and filling process within the numerical model, Figure 4 presents a detailed depiction of the model.
In the numerical model calculation and analysis process, the simulation of coal mining and subsequent filling is a crucial aspect. A null command is employed to simulate the mining of coal at the working surface. This command effectively removes the coal rake from the model, representing the excavation process and resulting in the formation of an exhausted area, commonly known as a goaf. To simulate the filling process that follows mining, the Mohr command is utilized. This command assigns specific parameters to the empty spaces created by mining, simulating the supportive role of the filler mass. By varying these assignments, the model can simulate different strengths and properties of the filler mass, allowing for a comprehensive analysis of its impact on the surrounding geological structures. The specific process involves several steps. Step 1 is the excavation of areas 1 + 2 as depicted in the drawing, indicating the advancement of the working face by one unit. Area 2 corresponds to the region within the transition support where no coal extraction occurs, while area 1 serves as the designated coal extraction zone. Secondly, step 2 is the filling of areas 2 and 3 in the figure. Area 2, denoted by the green shade, represents the space behind the transition support. Area 3, indicated by the yellow color, represents the abandoned roadway spaces flanking the advanced working face. Thirdly, in step 3, upon completion of filling areas 2 and 3, the excavation of areas 4 + 5 proceeds, signifying the second working face. Finally, step 4 involves filling areas 4 and 5 in the figure, specifically the shaded regions flanking area 4. This process is iteratively repeated until the exploitation of the entire working surface is completed.

5. Results and Discussion

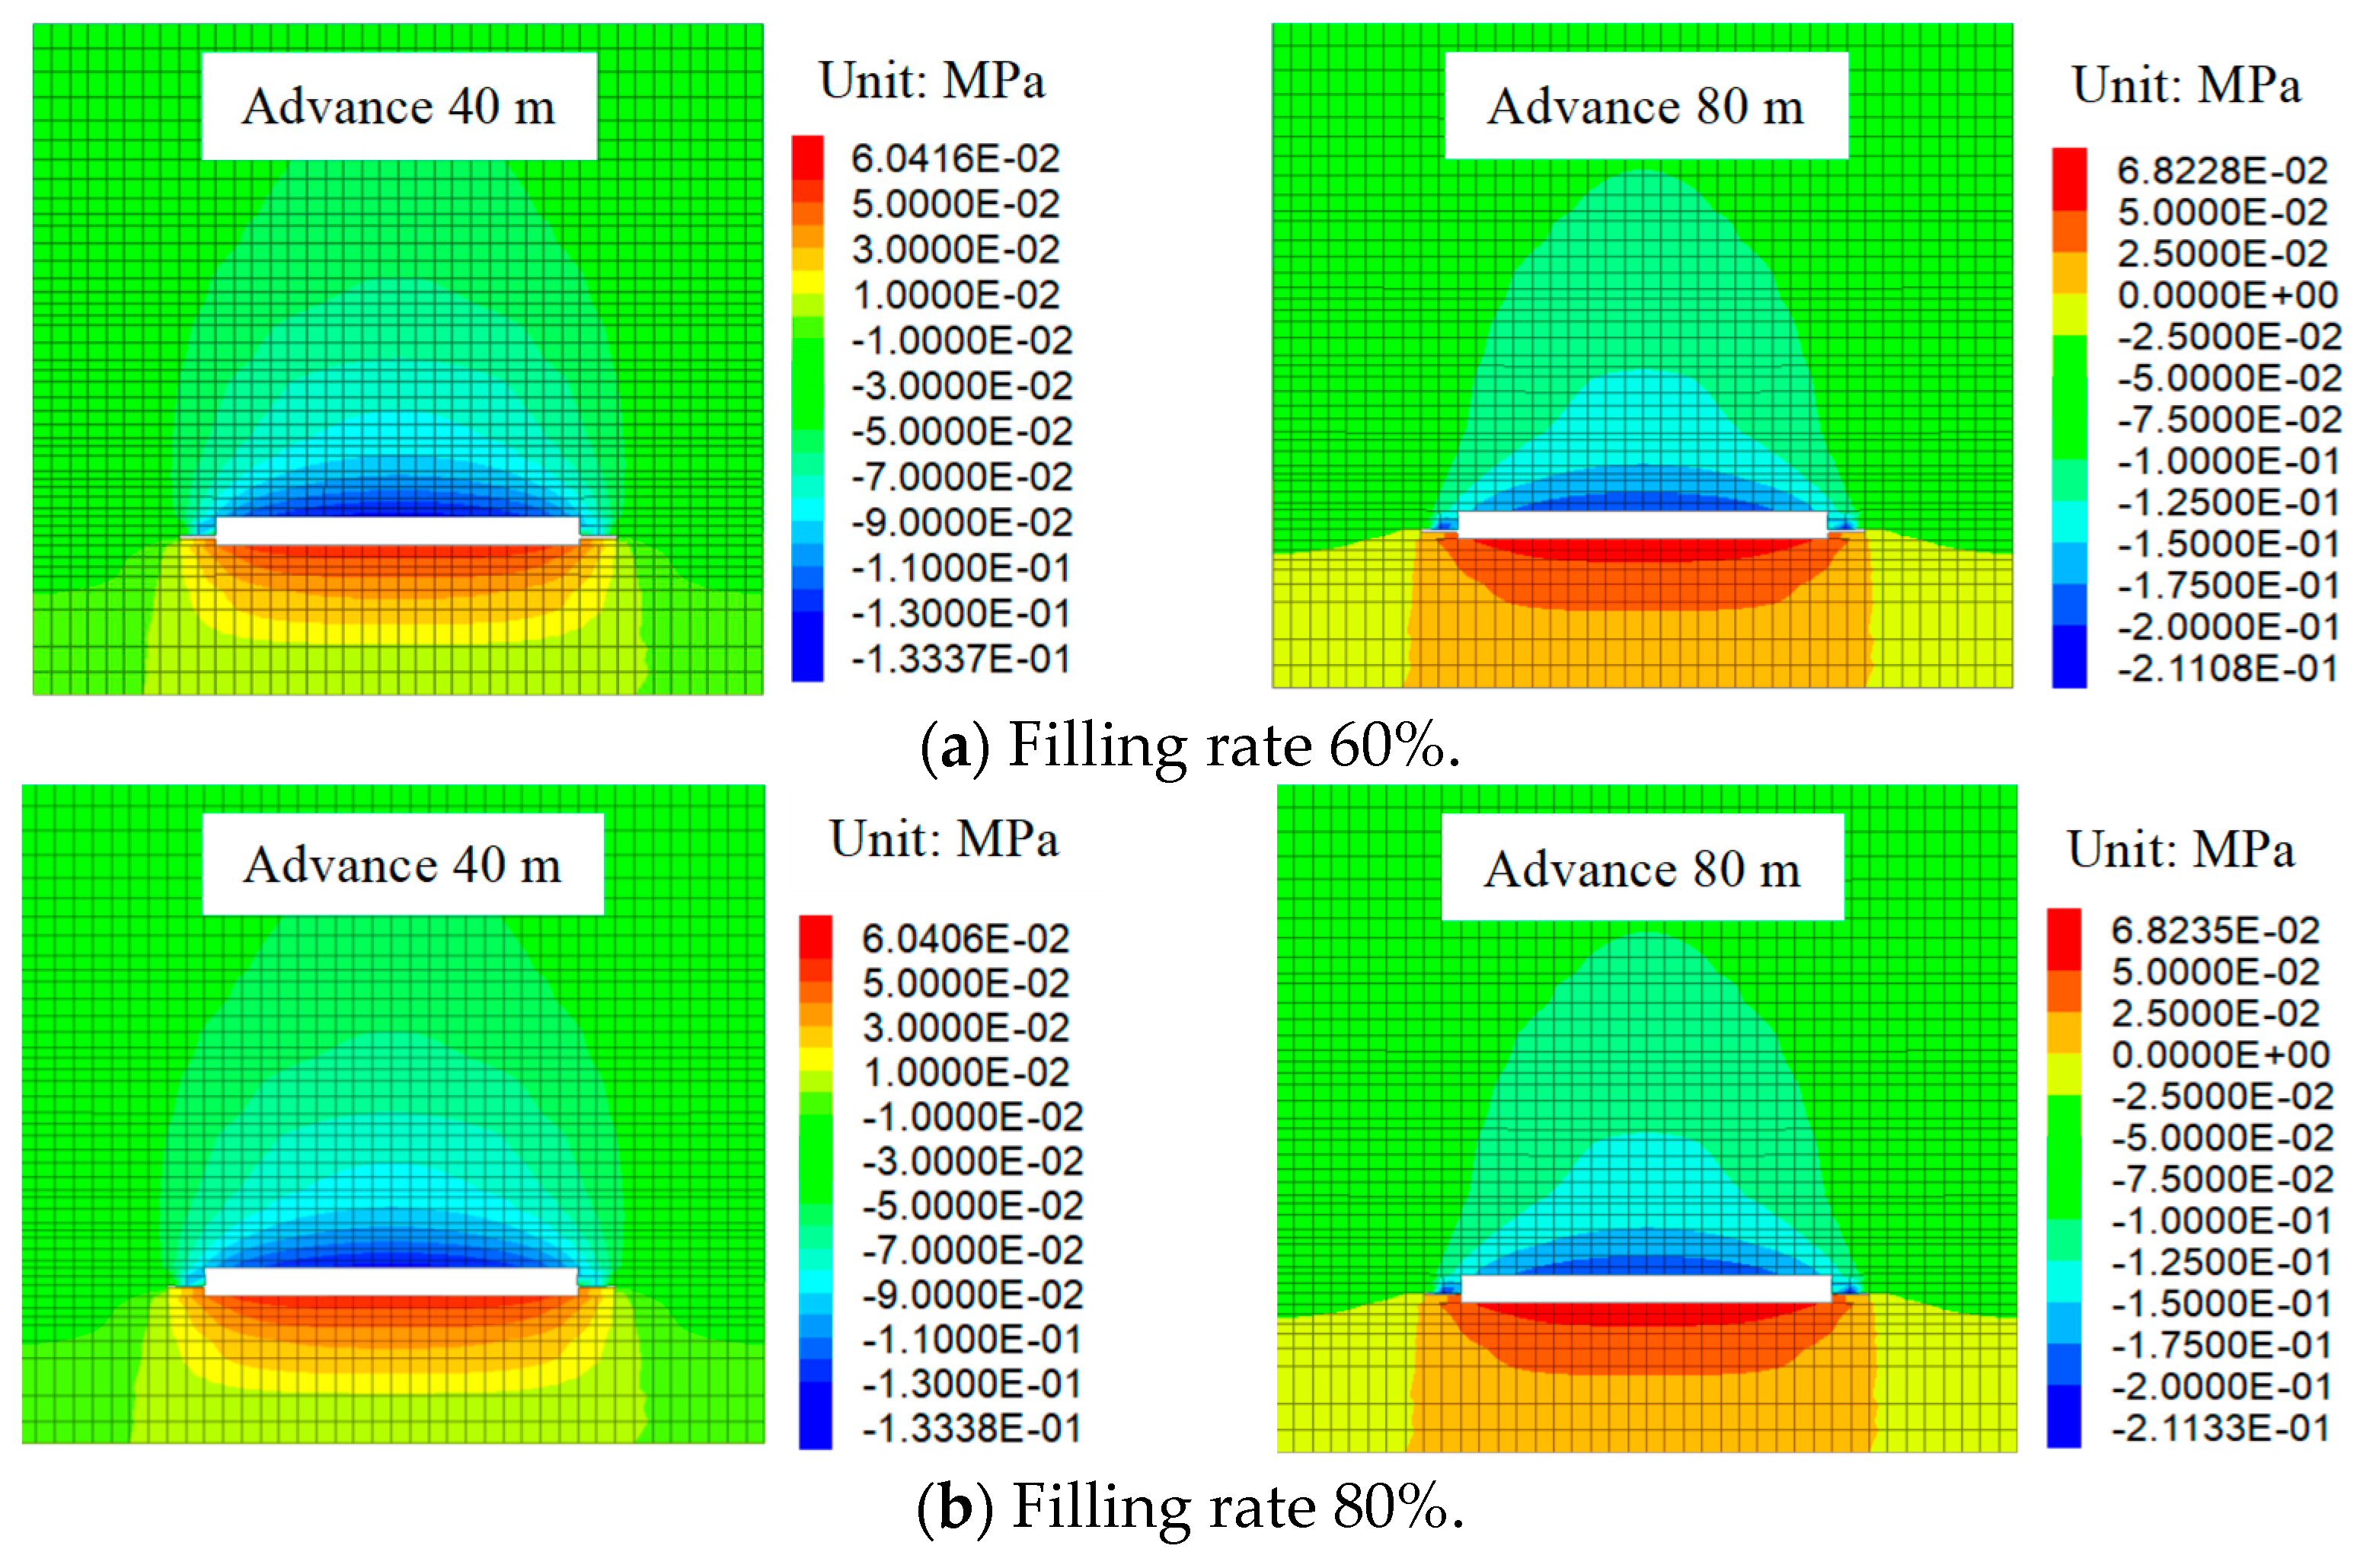
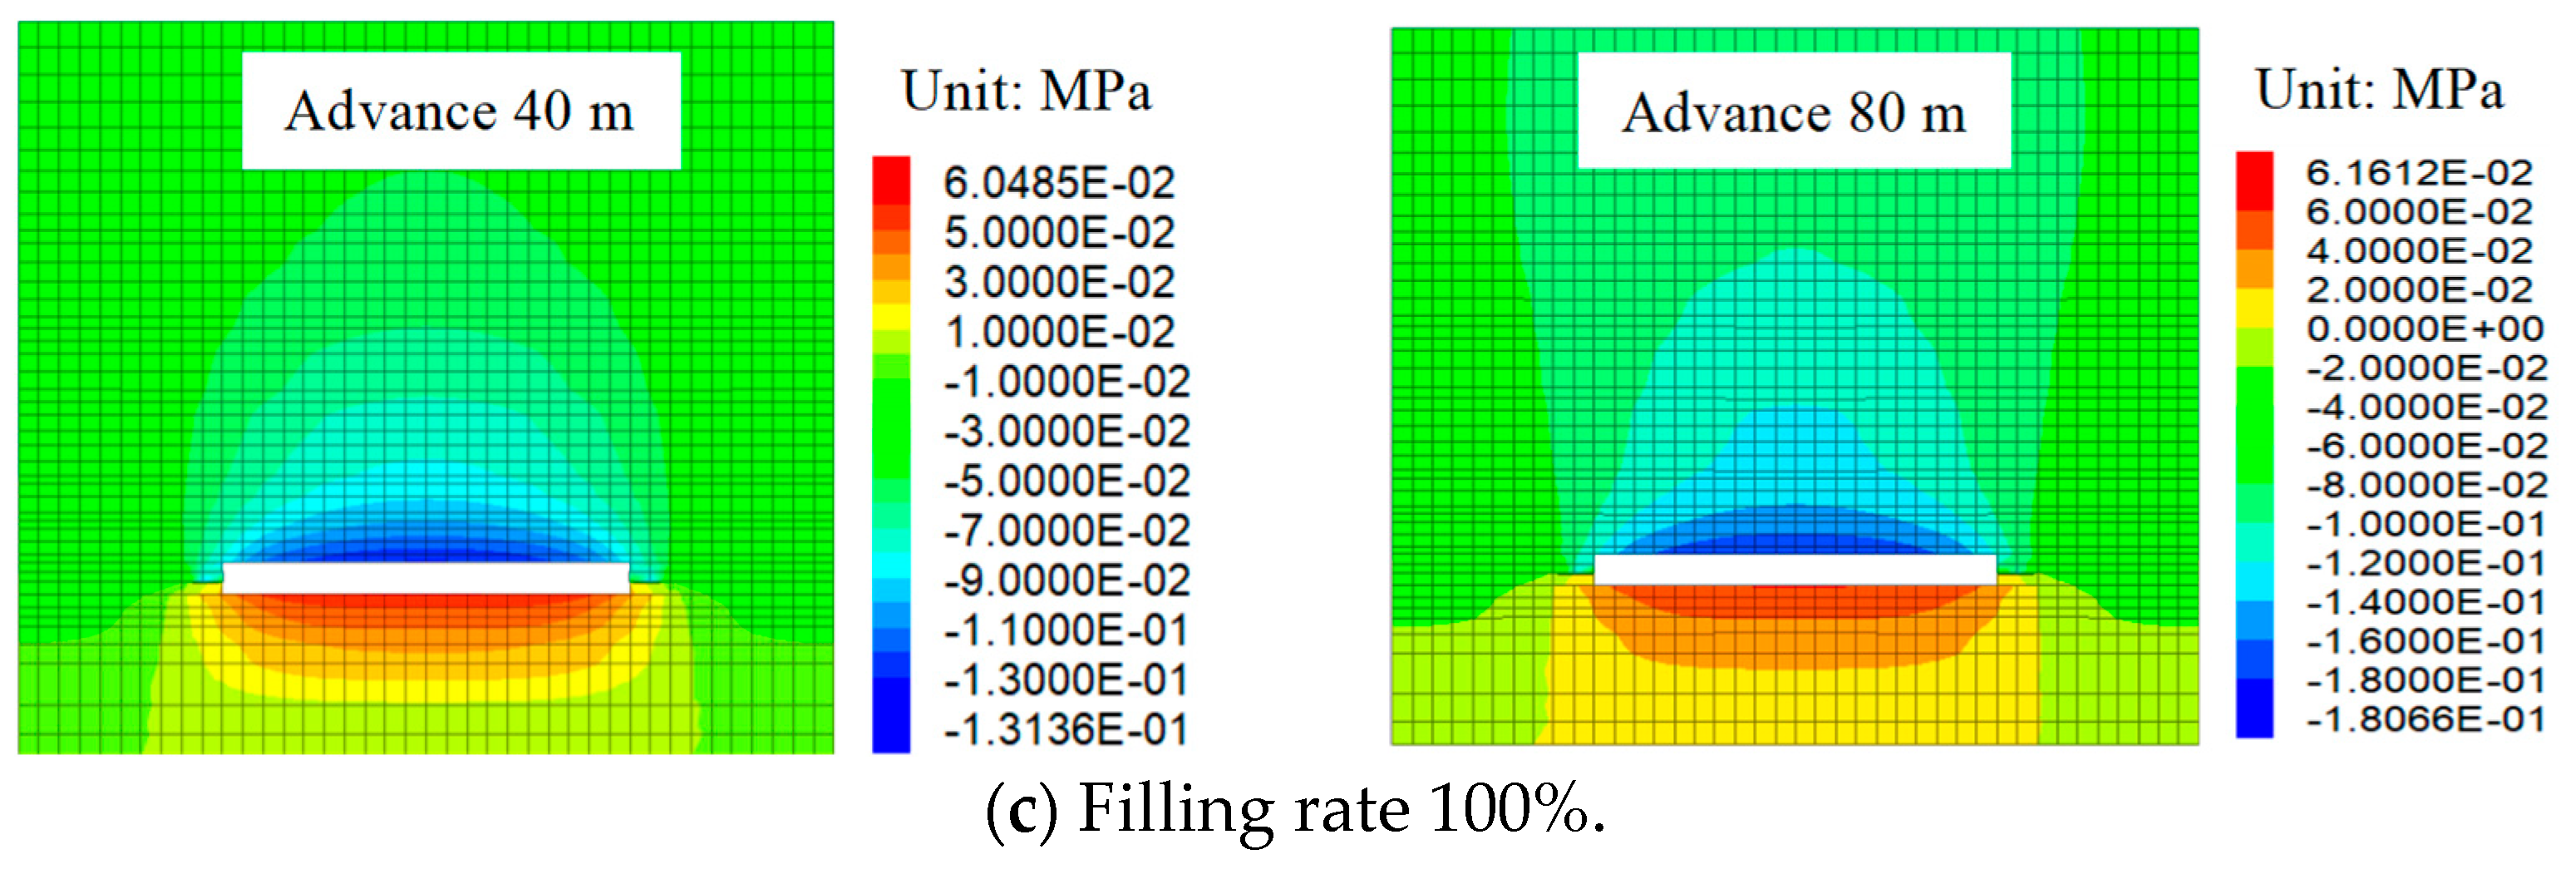
5.1. Study on the Law of Overburden Movement under Different Filling Rates

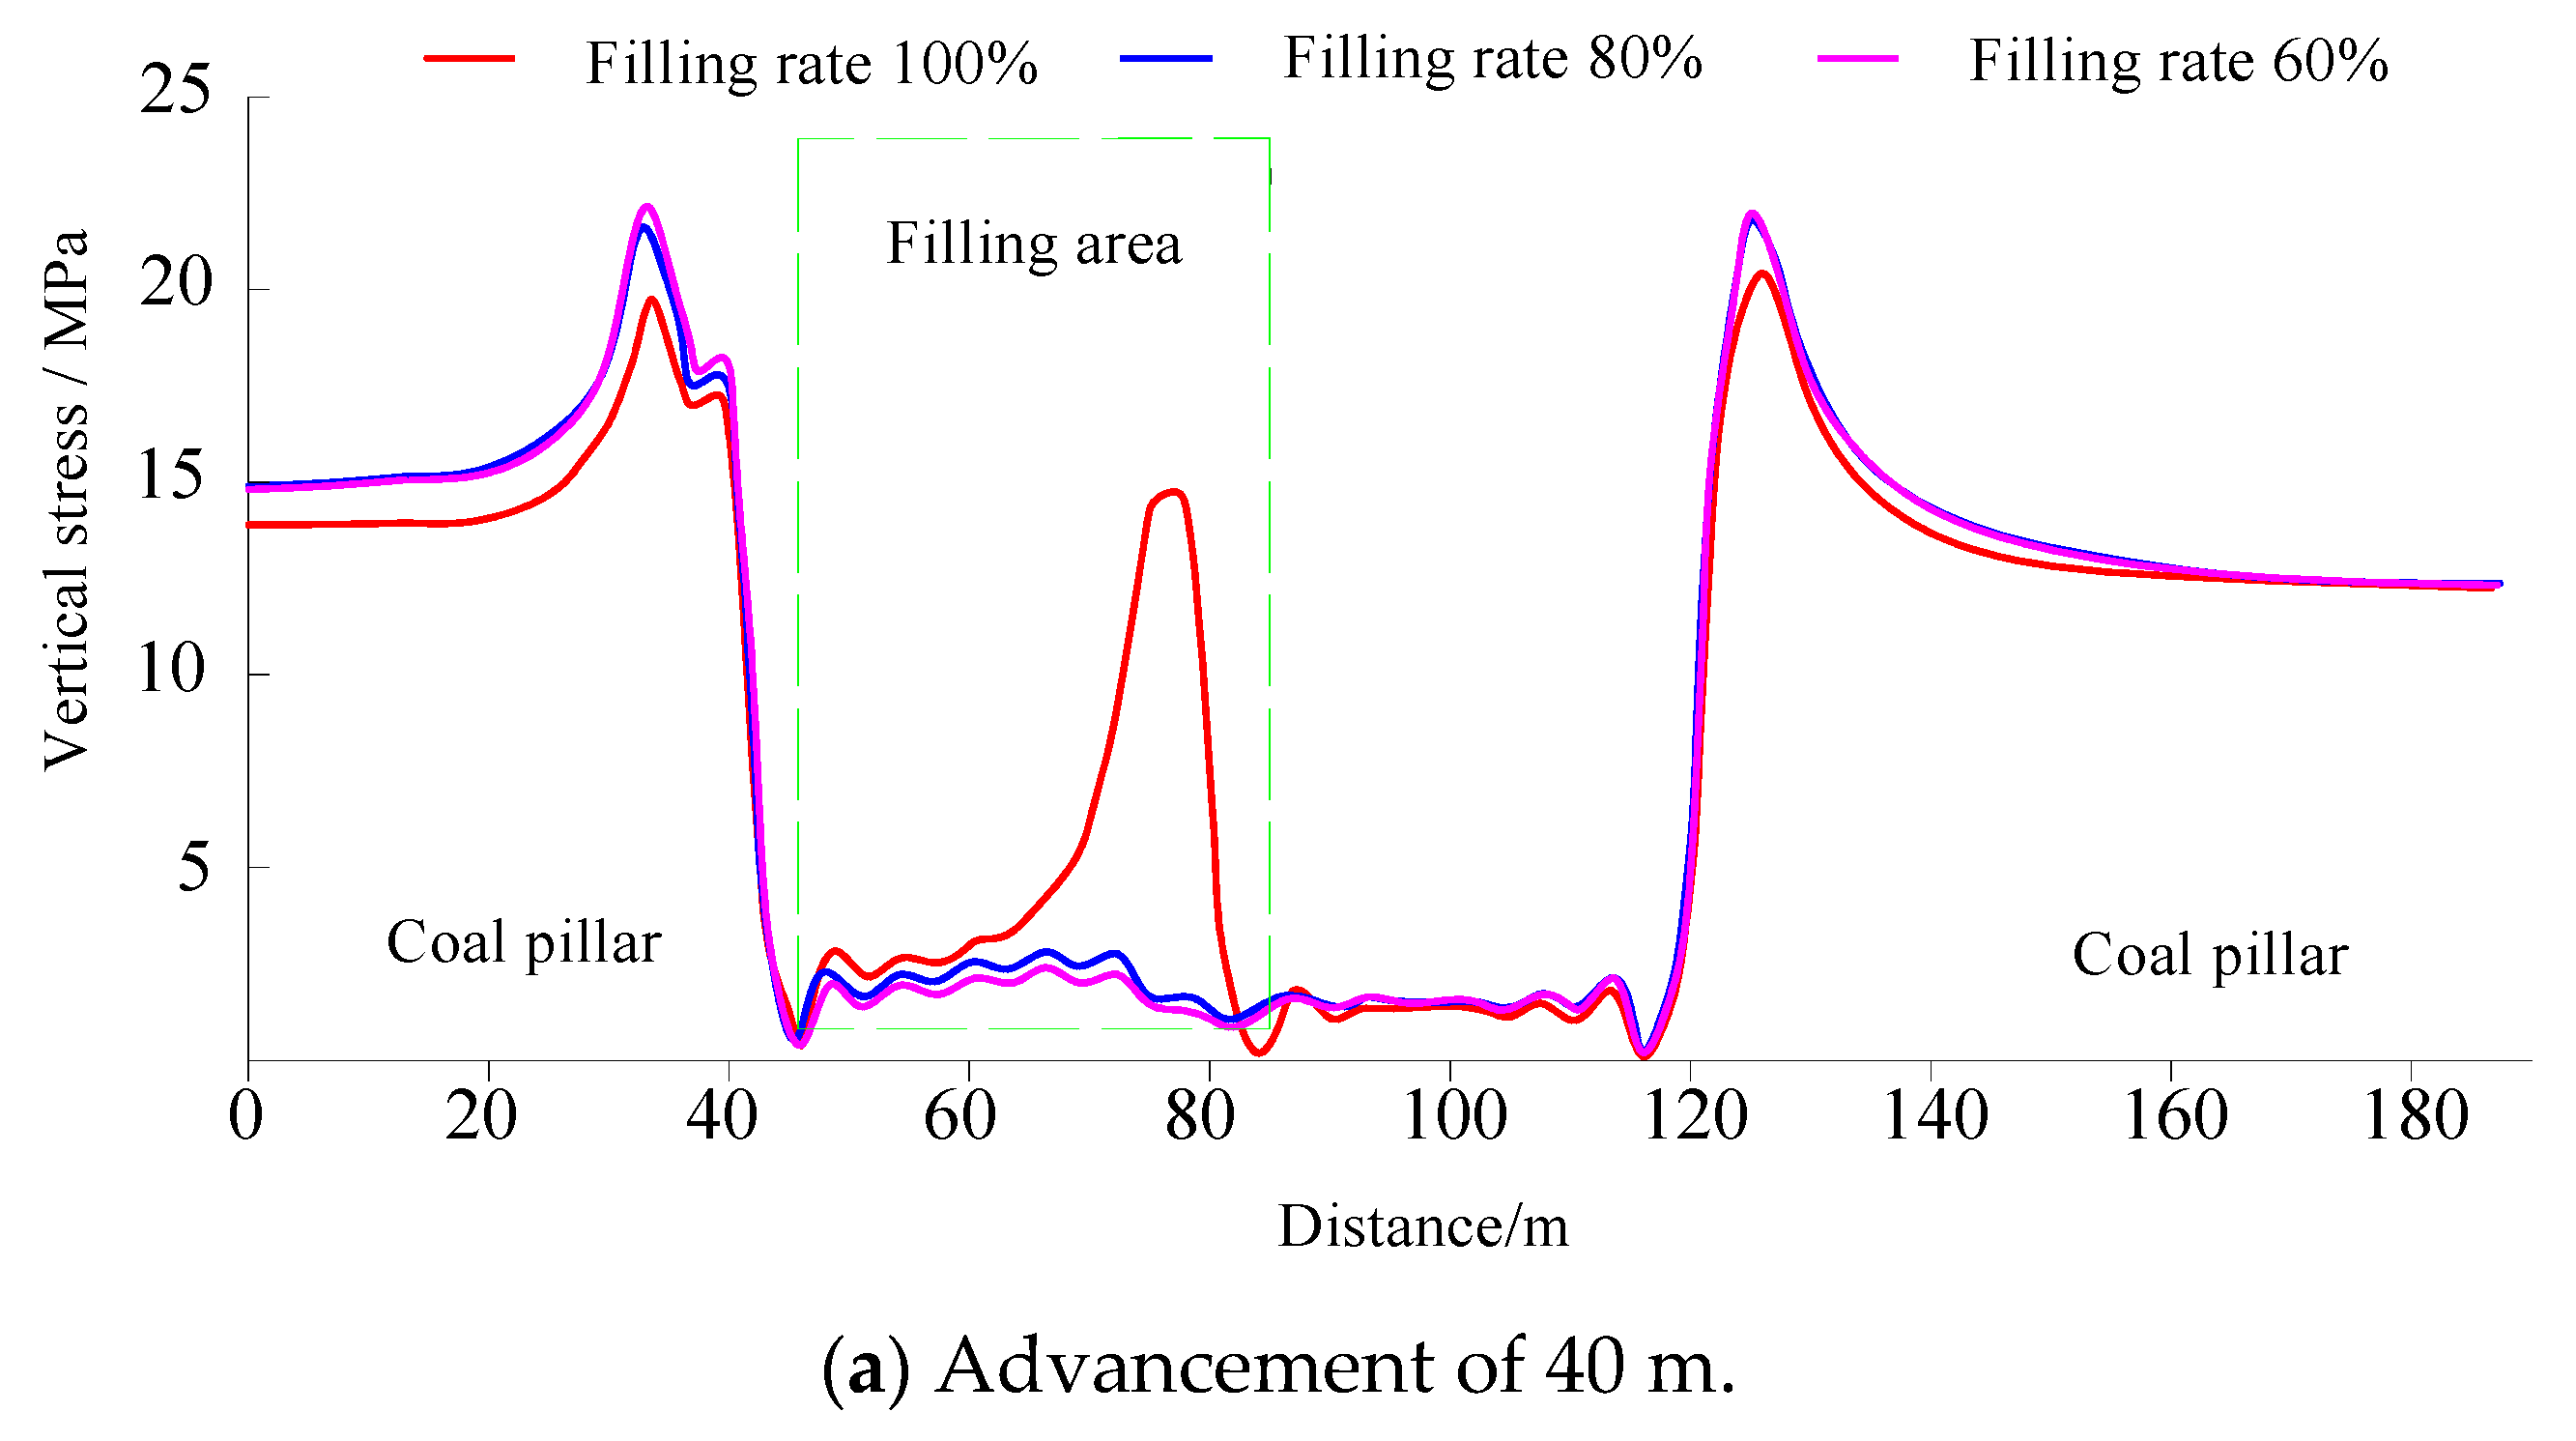
5.1.1. Stress Distribution Characteristics of Overburden under Different Filling Rates

Figure 5 illustrates the correlation between the superstratum stress along the dip of the working surface and the mining distance, considering various filling volumes of 60%, 80%, and 100%.
From the analysis of the diagram, it is evident that, when the filling rate is the sole varying factor, the stress distribution within the overlying stratum undergoes changes as the working surface continues to advance. The specific performance demonstrates that as the working surface advances, the influence range of stress is continuously reinforced, resulting in a corresponding increase in the stress values. Furthermore, the stress distribution exhibits a symmetrical pattern. The analysis of the diagram indicates that stress is primarily concentrated within the range of the roof and foundation slab. Specifically, there are distinct areas of stress intensity located at the coal walls on both ends of the mining area.
When the working surface advances by 80 m, and the filling rate is varied, significant differences in stress distribution and magnitudes are observed. At a 60% filling rate, the largest vertical pressure on the top and bottom plates reaches 1.61 MPa, indicating a relatively high stress level. Concurrently, the stress concentration in the coal walls on both sides is notable, reaching 25.50 MPa. As the filling rate increases to 80%, there is a notable decrease in stress levels. The largest vertical pressure on the top and bottom plates decreases to 1.41 MPa, and the stress concentration in the coal walls also drops to 24.80 MPa. This trend suggests that increasing the filling rate helps to mitigate stress concentrations. Finally, at a complete 100% filling rate, the largest vertical pressure on the top and bottom plates further decreases to 1.15 MPa, representing the lowest stress level observed. Correspondingly, the stress concentration in the coal walls also reaches its lowest point at 23.86 MPa. With the steady increase in the filling rate, the scope of the roof stress damage area gradually decreases. Moreover, the scope of the stress intensity area at the two flanks of the coal wall diminishes as the filling rate rises. The most significant improvements are observed when the filling rate reaches 100%. At this point, the activity space of the overlying strata within the range of the filler mass is minimized. This means that the filler mass is able to effectively support the upper roof, thereby mitigating the transmission of load from the overlying stratum in the goaf to the coal pillars on both sides.
Figure 6 clearly illustrates the relationship between the filling rate and support pressure in a mining environment. As the working surface advances, the support pressure experienced by the mine structures increases. When the working surface is pushed forward by 40 m, the strike support pressure measures 20 MPa. As the working surface further advances to 80 m, the support pressure rises to approximately 25 MPa. During this continuous advancement, the strain relief of the roof and floor plates shifts towards the coal ribs. This transfer of strain relief causes the support pressure at the coal ribs to gradually increase, leading to stress concentration in these areas. At a filling rate of 60%, the peak support pressure at the front and rear coal walls is 23.42 MPa. As the filling rate rises to 80%, the peak support pressure slightly decreases to 23.03 MPa. When the filling rate achieves 100%, the peak support pressure at the coal walls drops to 21.32 MPa. While the decrease in support pressure with increasing filling rate is not dramatic, it is noteworthy that when the filling rate reaches 100%, there is a significant augmentation in the abutment pressure of the filler mass.

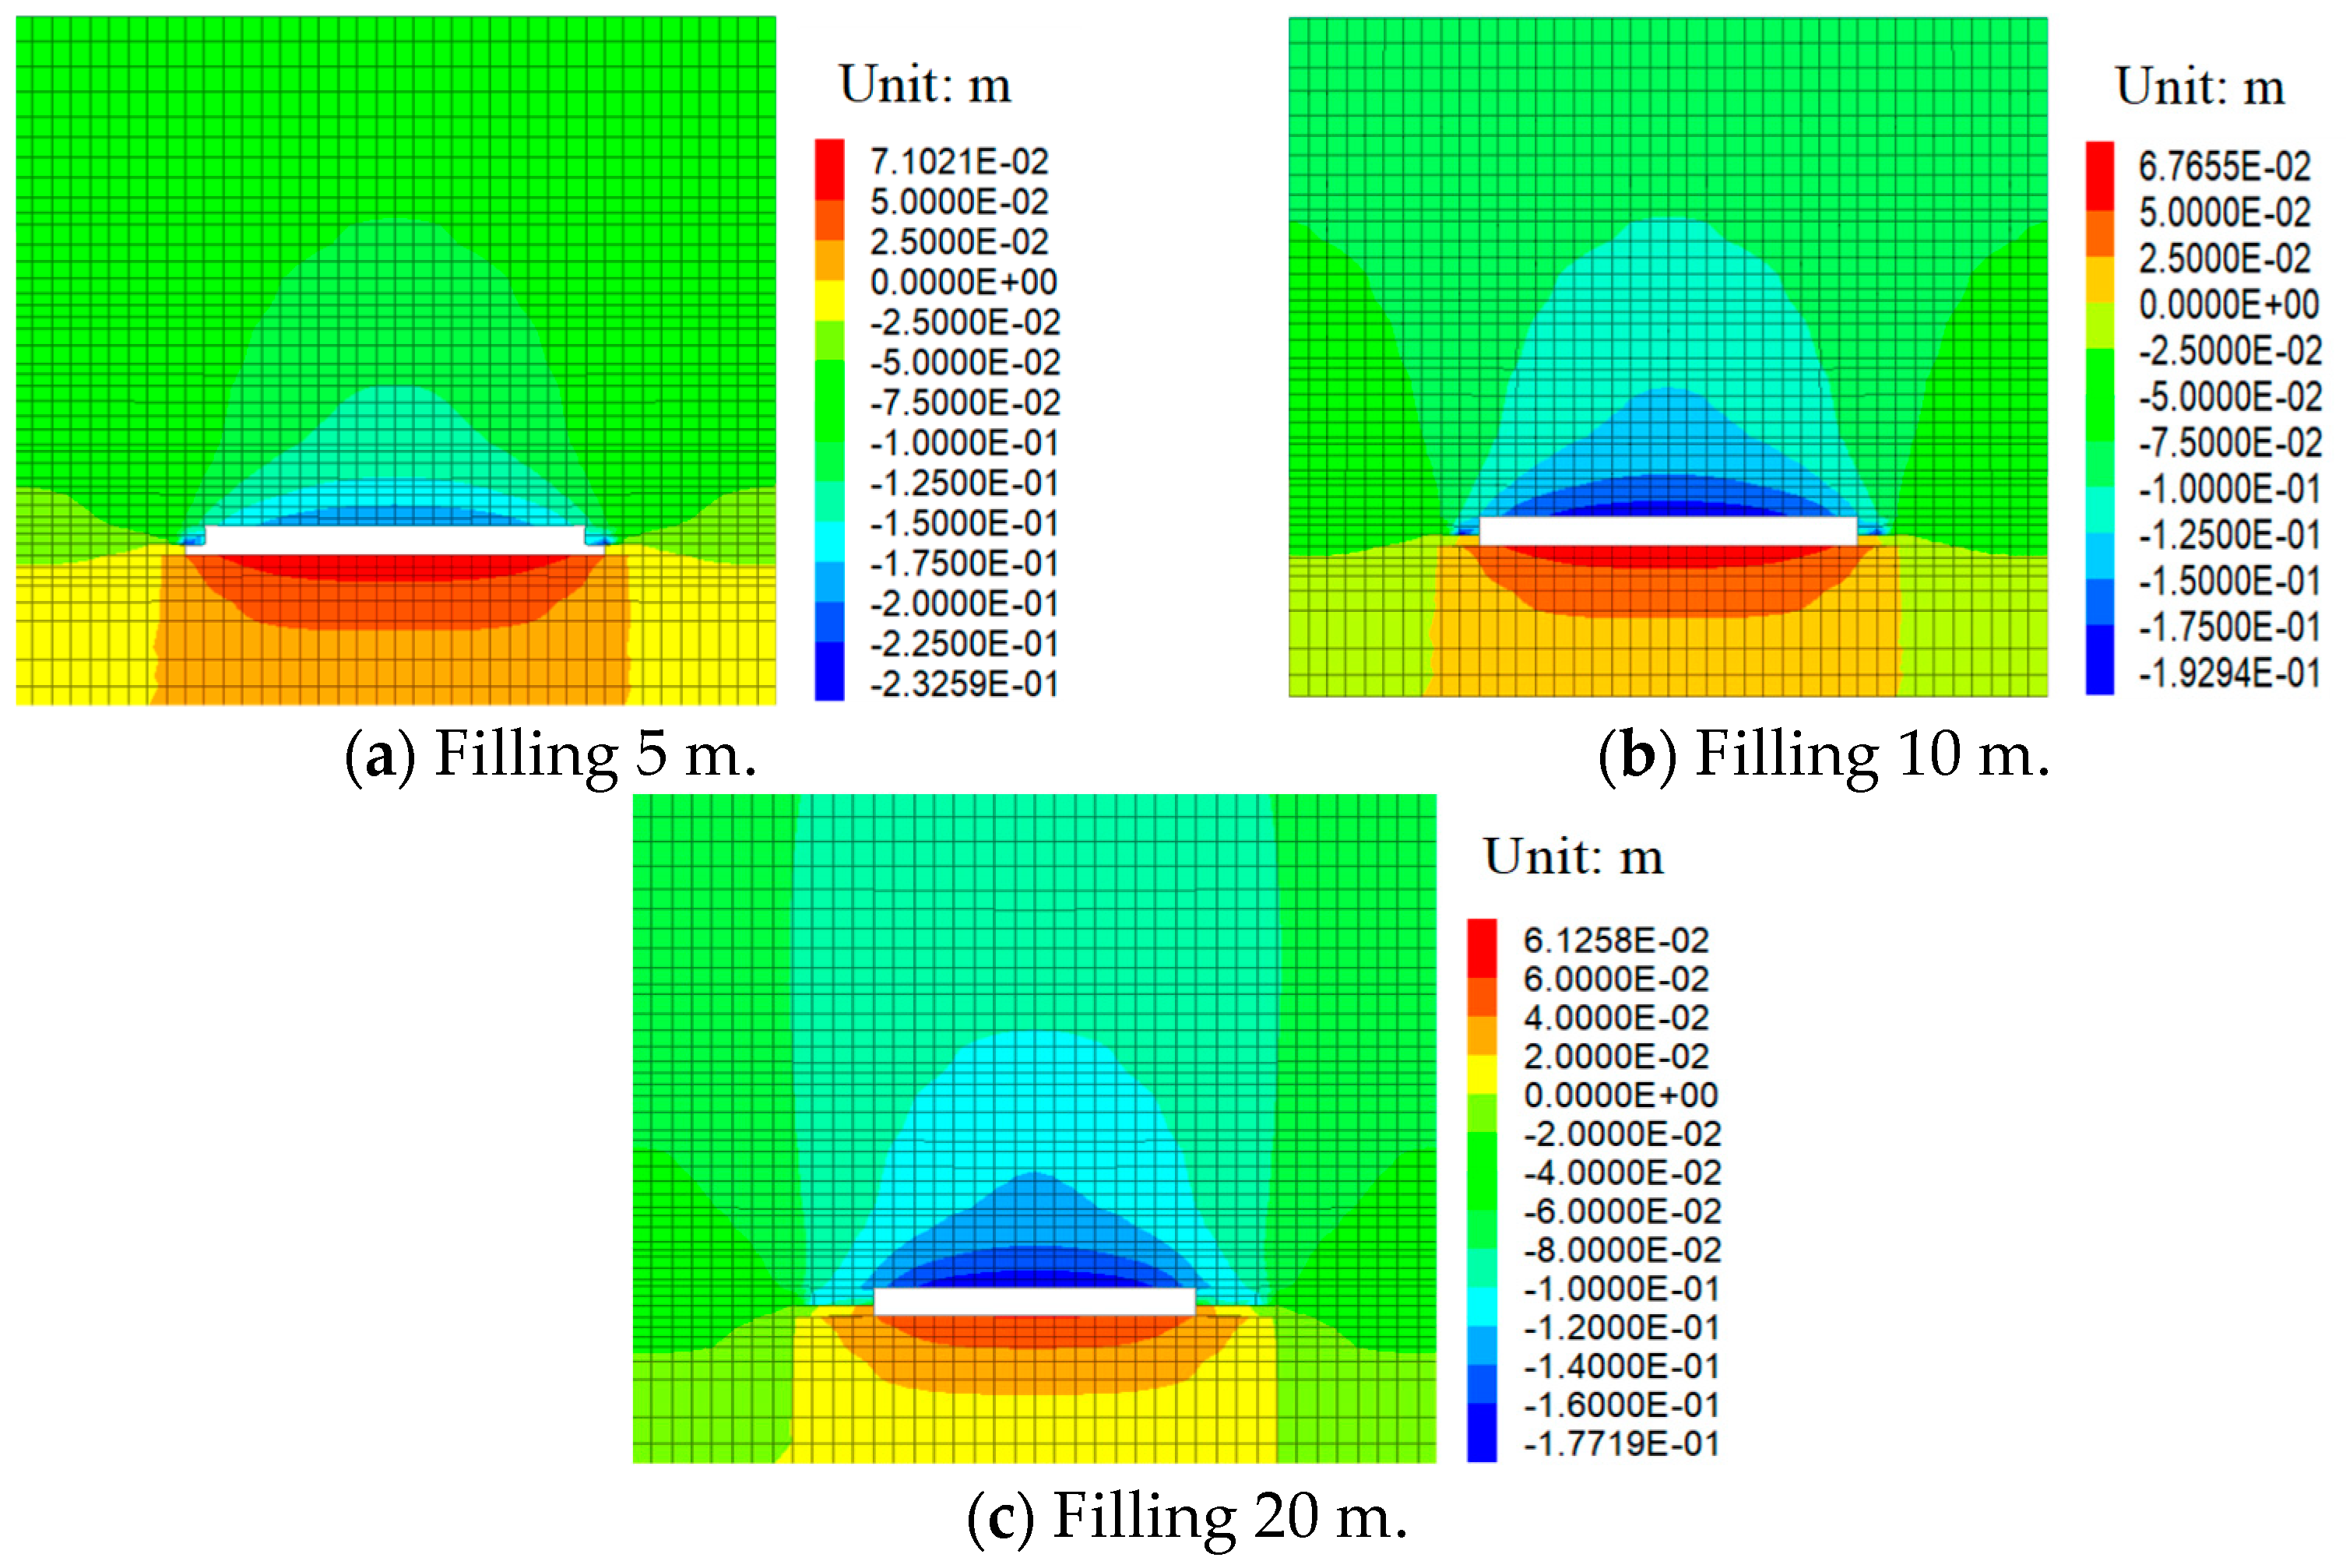
5.1.2. Distribution Characteristics of Overburden Displacement under Different Filling Rates

As depicted in Figure 7, the continuous advancement of the working surface results in dynamic changes within the surrounding rock mass. It is evident that as the working surface is pushed forward, the damage to the rock mass becomes more pronounced. Specifically, comparing the instances when the working surface is advanced by 40 m and 80 m, respectively, it is clear that the level of rock damage is significantly higher in the latter scenario. As the working surface advances by 80 m, the maximum displacement values of the stope roof increase, along with an expansion in the affected range. At a filling rate of 60%, the maximum vertical displacement of the coal-bed roof reaches 21.11 cm, while the displacement of the coal seam floor measures 6.82 cm. Increasing the filling rate to 80% results in minor changes, with the maximum roof displacement increasing slightly to 21.13 cm and the floor displacement rising to 6.84 cm. However, when the filling rate reaches 100%, there is a significant reduction in both roof and floor displacements. The maximum roof displacement decreases to 18.07 cm, and the floor displacement decreases to 6.16 cm. This analysis indicates that while increasing the filling rate from 60% to 80% has a limited impact on reducing displacements, achieving a 100% filling rate results in a notable decrease.

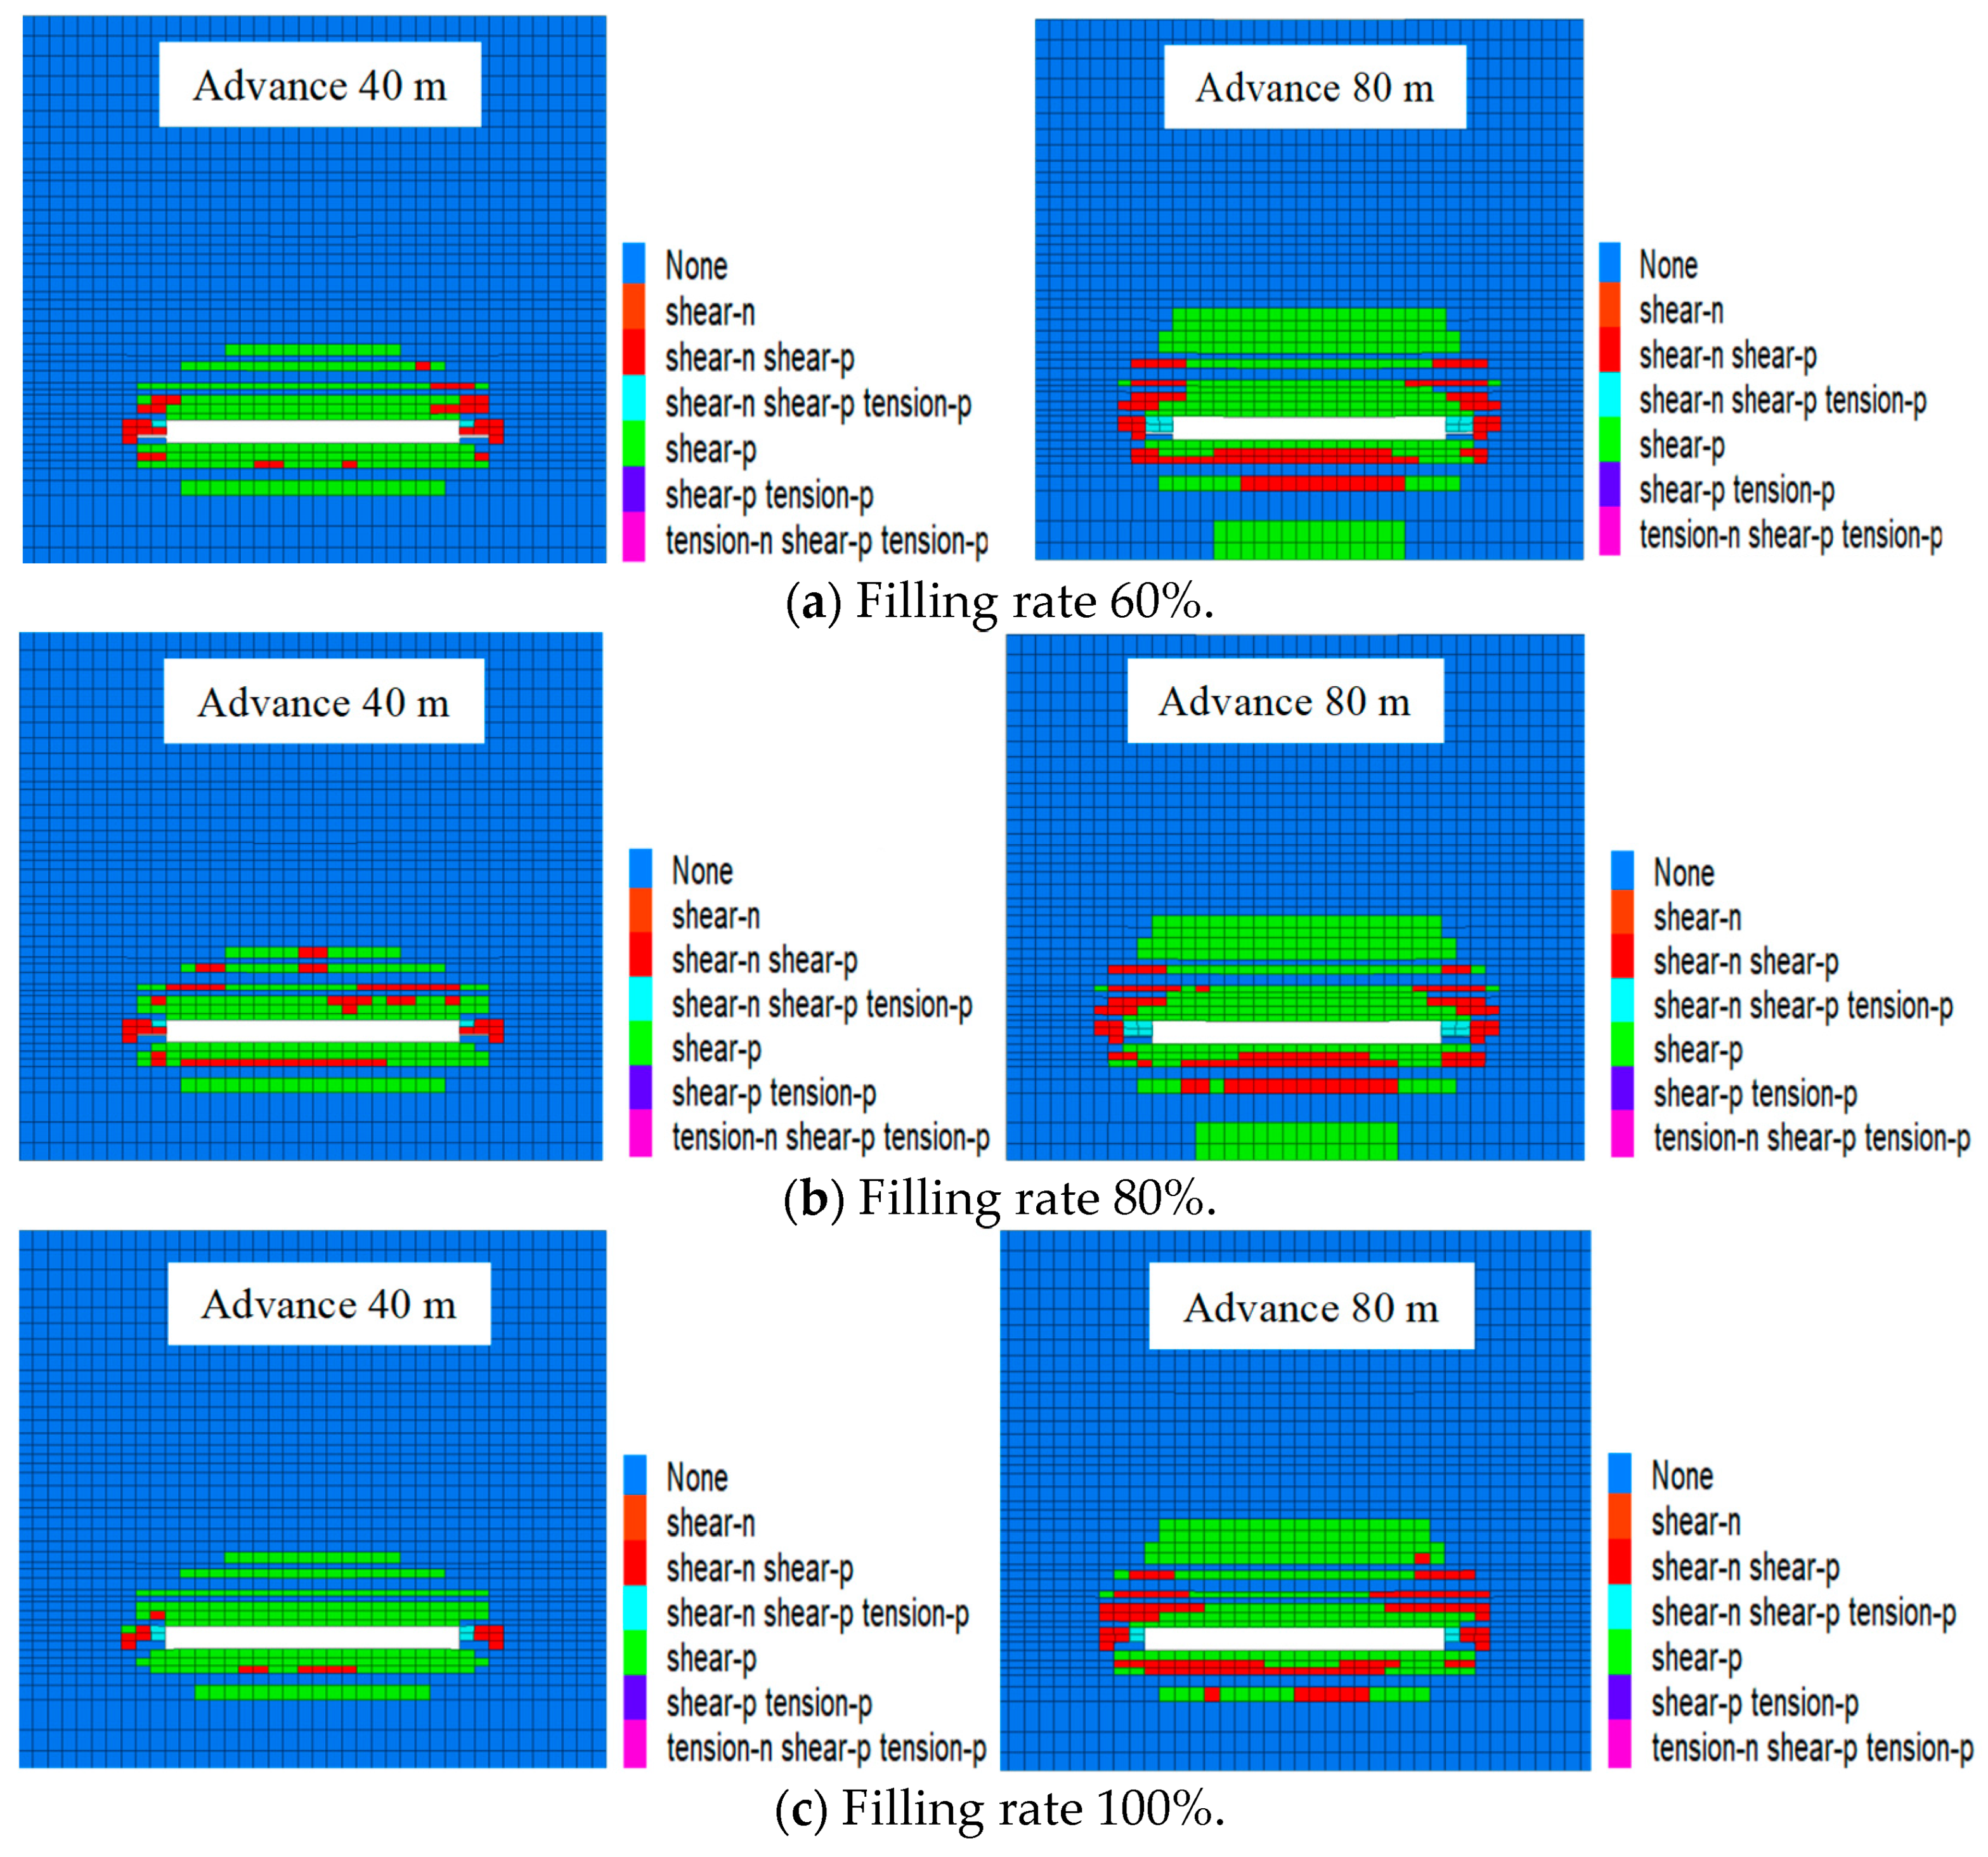
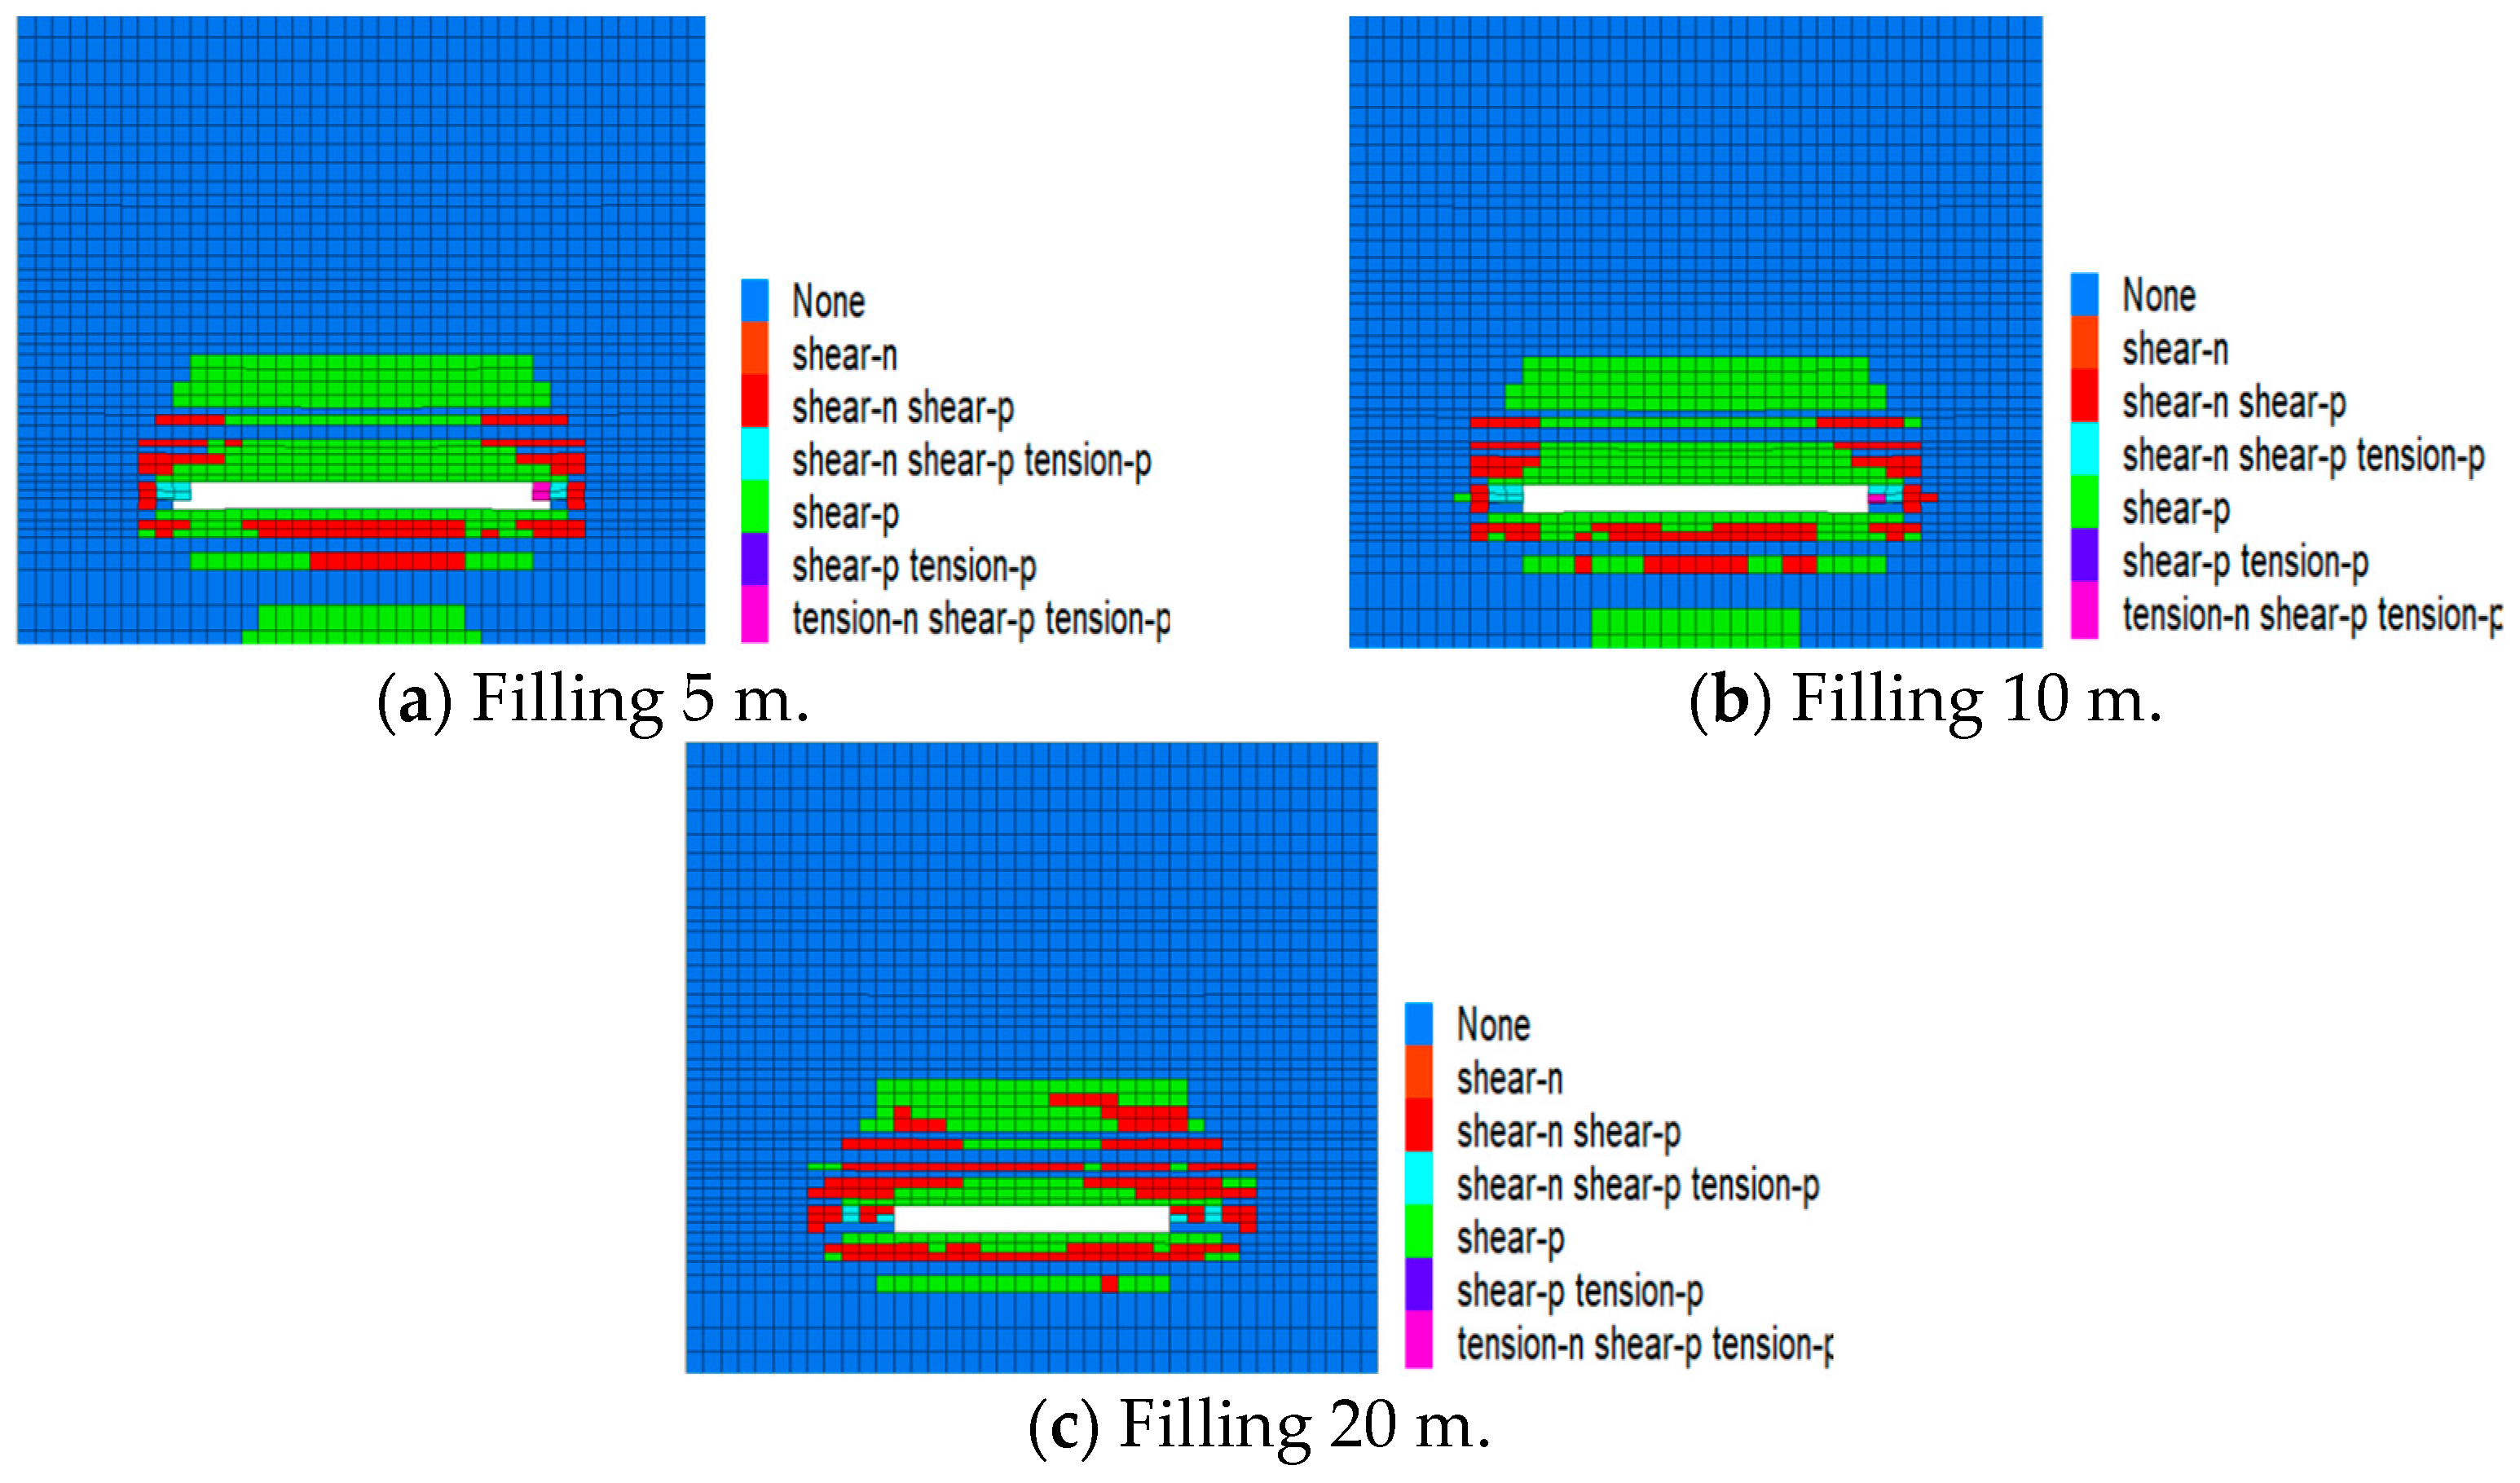
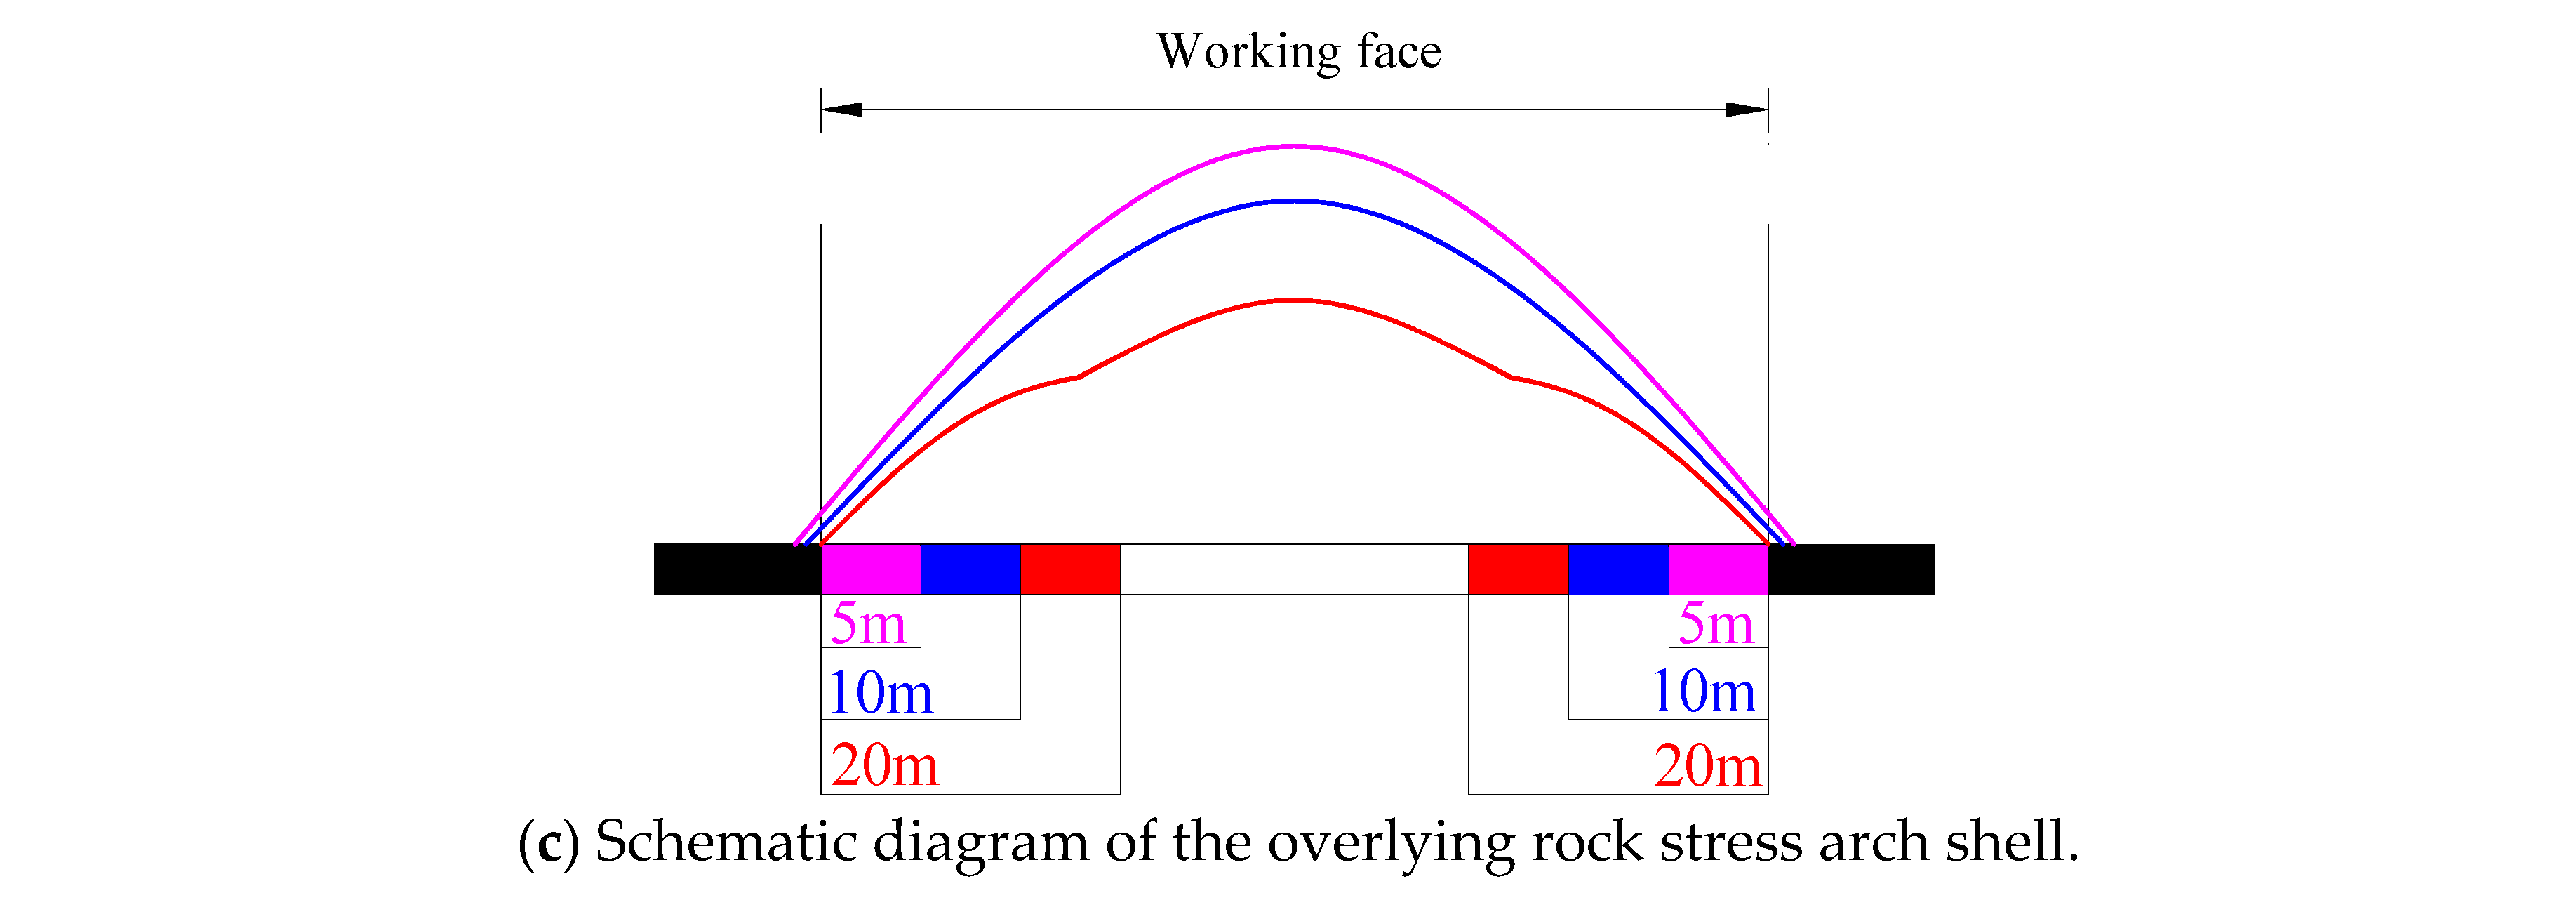
5.1.3. Plastic Failure Characteristics of Overburden under Different Filling Ratios

Figure 8 clearly demonstrates that the variation in the damage characteristics of the plastic region along the working surface direction is minimal as the filling rate increases. This damage pattern is characterized by a higher degree of failure in the central region and relatively lower damage at both ends. As the working surface continues to advance, the overlying strata failure area gradually expands in terms of both its development range and height. When the filling rate reaches 60%, and the working surface is pushed forward by 40 m, the nature of the overburden failure changes. In the filled areas, the primary mode of failure is shear failure. In these filled regions, the failure height is measured to be 11 m. However, in the unfilled areas, the failure height is significantly higher, reaching 24 m. Notably, in some areas, tensile failure also occurs. Tensile failure arises when the rock mass is stretched beyond its tensile strength, often due to the tensile stresses caused by mining-induced movements. In the filling area, the tensile failure height is 18 m, while in the unfilled area, it reaches 36 m. When the filling rate is 80%, and the working surface is advanced by 40 m, the observed damage height within the filled area is 10 m. In contrast, the damage height within the unfilled area is 23 m. As the working surface is further advanced by 80 m at the same 80% filling rate, the damage height in the filled area increases to 17 m, while in the unfilled area, it rises to 35 m. When the filling rate reaches 100%, and the working surface is advanced by 40 m, the damage height in the filled area is 7 m. Comparatively, the damage height in the unfilled area is 20 m. When the working surface is pushed forward by 80 m at a 100% filling rate, the damage height in the filled area increases to 11 m, while in the unfilled area, it rises to 31 m. The overall trend observed in the data analysis is that the overburden failure height decreases with increasing filling rate. When the filling rate attains 100%, there is a notable decrease in both the extent of damage to the plastic region and the level of its development. Analysis indicates that, at lower filling rates, the coal remaining at the top possesses sufficient space to undergo subsidence. During the process of subsidence, the bottom coal undergoes transformation and fragmentation due to the impact of roof stress, resulting in shear and tensile damage that diminishes its load-bearing capacity. It is unable to establish a stable bearing structure alongside the underlying filler mass, thereby deteriorating the effectiveness of controlling roof subsidence. Only when the filling rate reaches 100% does the unreleased top coal and the underlying filling body coalesce into a cohesive structure, jointly bearing the stress of the overlying stratum. This ensures that the top coal remains resilient to tensile failure, maintaining its bearing capacity and effectively mitigating roof subsidence.
In summary, as the filling rate increases, the stress, displacement, and plastic failure area of the top plate on the working surface gradually decrease, although the overall trend is not particularly pronounced. At a filling rate of 100%, there is a marked transformation in the roof’s stress, displacement, and plastic failure patterns. This change leads to the formation of a composite bearing structure known as the “top coal filling body”, which effectively lowers the height of the overburden stress arch, thereby significantly restraining roof movement. And it also indicates that the filling body has a certain range of influence on the control of surrounding rock, and an improvement in the infill ratio will expand the radius of influence of the filler mass. When the filling rate is 60% and 80%, the change in advancing length will significantly change the structural response characteristics of the overall surrounding rock structure. But when the filling rate is 100%, the structural response state of the surrounding rock does not change much, and the structure is relatively stable.

5.2. Study on the Evolution Law of Overburden under Different Filling Body Widths

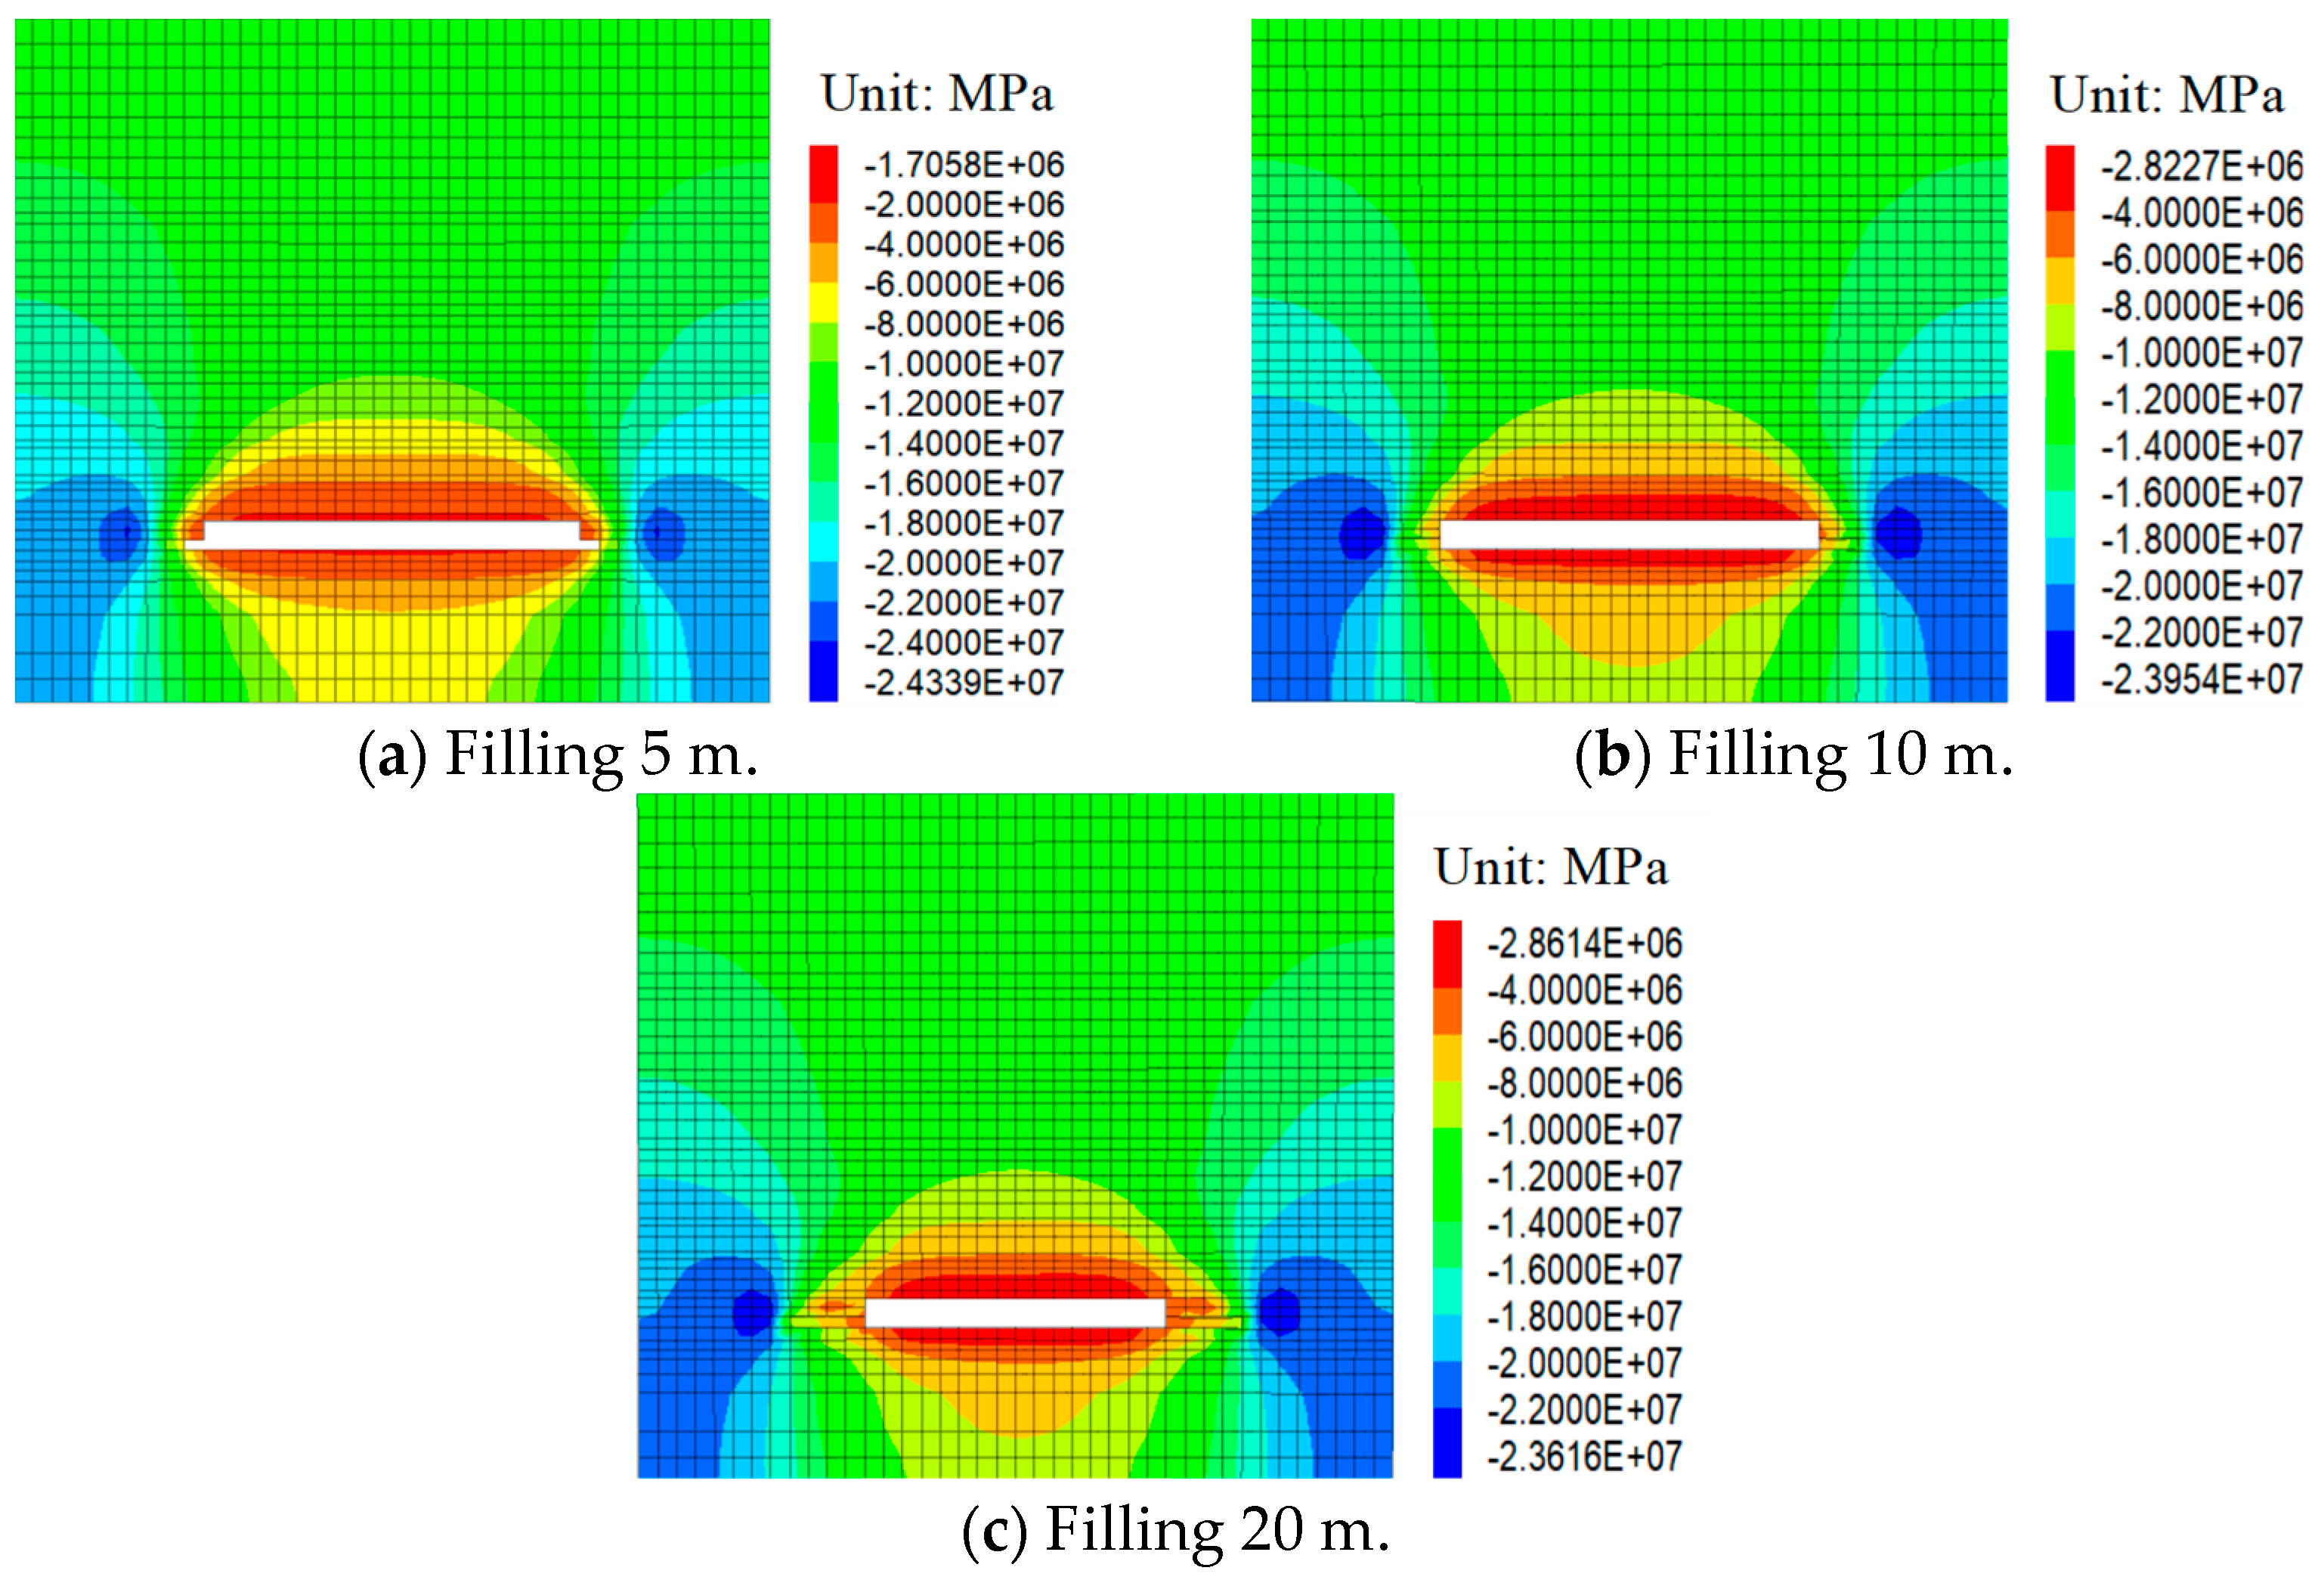
5.2.1. Stress Distribution Characteristics of Overburden under Different Backfill Widths

Figure 9 demonstrates that during partial filling and FMT-CCF operations at the ends of thick coal seams, the confined rock stress field surrounding the working face undergoes significant redistribution as a result of the supportive effects of the filler mass. Specifically, the stress values within the top and bottom boundaries of the filling range measure between 6–10 MPa, creating a distinct stress concentration zone along the coal walls flanking both sides of the working surface. With the increasing width of the backfill area at both ends, the stress concentration area gradually shifts away from the working face. When both ends are filled with 5 m of material, the maximum stress within the overburden reaches 24.34 MPa, while the minimum stress measures 1.71 MPa. Increasing the fill width to 10 m reduces the maximum overburden stress slightly to 23.95 MPa, with a corresponding increase in the minimum stress to 2.82 MPa. Furthermore, when both ends are filled with 20 m of material, the maximum overburden stress decreases to 23.62 MPa, while the minimum stress remains relatively stable at 2.86 MPa. Simultaneously, the internal stress of the filler mass is minimized. It can be observe from the above data analysis that with the continuous increase of the width of the both ends of the filler mass, the proportion of the backfill area in the total length of the working surface also increases, and the largest pressure of the overburden decreases, with a small reduction. This occurs because, after manual filling of the head space at both ends, the combined effect of the filler mass and the remaining top coal creates a larger pressure-bearing area. This enlarged support structure effectively inhibits roof subsidence within the filled region, thereby reducing the extent and scope of strain relief within the overlying stratum. Consequently, the stress state of the working face is significantly improved.

5.2.2. Displacement Distribution Characteristics of Overburden under Different Filling Body Widths

Figure 10 demonstrates that the displacement and stress distribution patterns surrounding the working face exhibit similar regional characteristics. Specifically, the vertical displacement of the roof rock stratum is notably greater than that of the coal–rock stratum adjacent to the filling body, while the floor rock stratum experiences the least vertical displacement. As the filling width at both ends increases to 5 m, 10 m, and 20 m, the respective maximum vertical displacements of the surrounding rock decrease, measuring 23.26 cm, 19.29 cm, and 17.72 cm. As the filling width increases at both ends, the maximum vertical position area of the surrounding rock gradually shifts towards the center of the working face, accompanied by a decrease in its extent and magnitude. The reason is that the fully mechanized top-coal caving face is approximately regarded as a beam structure with fixed supports at both ends. Through calculation, it can be concluded that the bending deformation in the middle of the roof rock beam is the largest. Based on the analysis of displacement distribution characteristics, it can be seen that when the filling body width at both ends increases, the maximum deflection deformation of the roof decreases. This can improve the stress condition of the original fixed support beam, thus improving its deformation characteristics and controlling the roof structure damage.

5.2.3. Failure Characteristics of the Overburden under Different Backfill Widths

Based on the analysis of the distribution characteristics of the overburden plastic area along the direction parallel to the working face, considering various widths of the end filling bodies depicted in Figure 11, it can be concluded that the roof and floor in the unfilled area of the working face are seriously damaged. This is evident from the extensive scope of the damage and the diverse and complex nature of the failure modes observed. Conversely, the coal and rock masses adjacent to the filling bodies at both ends of the working face exhibit a relatively limited failure range, with the primary mode of failure being shear failure. When the filling range at each end is 5 m, 10 m, and 20 m, the maximum damage heights of the roof overburden are 55 m, 52 m, and 46 m, respectively, and the maximum failure depths of the floor rock mass are 34 m, 30 m, and 22 m. It can be seen from the above analysis of the roof and floor failure range data that with the continuous increase in the width of the end filling body, the scope of the roof and floor failure area continues to decrease, and the roof and floor failure form within the filling range is relatively simple: mainly shear failure. However, the roof in the unfilled area is subject to shear failure and tensile failure at the same time, and the failure mode is relatively complex.
Based on the analysis of the distribution feature of the overburden plasticity zone in the direction parallel to the working face under the different end filling body widths in Figure 11, it can be concluded that the top plate and base plate of the unfilled area of the working surface are seriously damaged. This is mainly shown by the large scope of damage and the complex and diverse forms of damage. However, the failure range of the coal–rock body near the filling body at the two terminals of the working surface is small, with shear failure as its main mode. When each end’s filling range is 5 m, 10 m, and 20 m, respectively, maximum damage heights for roof overburden are observed at 55 m, 52 m, and 46 m, while maximum failure depths for the floor rock mass are seen at 34 m, 30 m, and 22 m. The analysis indicates that with continuous enlargement in width of the end filler mass, there is a decrease in scope for both roof and floor failure areas within filled ranges, which exhibit relatively simple shear failures. However, in unfilled areas on roofs, there exist simultaneous shear breakdowns alongside tensile breakdowns, leading to relatively complex modes of failure.
In conclusion, by analyzing the distribution of overburden stress, displacement, and plastic area under different filling body widths, it is evident that the spatial shape and pressure distribution of the overburden rock on the working surface form closed loops due to the presence of the filling body at the two terminals of the working surface and the top coal above it. A designated “stable area” is incorporated in the upper part of the filling zone of the working surface to provide relative stability to the roof, supported by both top coal and filler mass. Conversely, an “unstable area” is observed in the unfilled zone of the working surface, where sloughing occurs, and high pressure magnitude is present. The joint action between these two areas results in a new “arch shell” structural form for overburden rock. Based on roof stress-distribution maps with filling widths of 5 m, 10 m, and 20 m at both ends, maximum arch heights were determined as 52.23 m, 46.47 m, and 32.42 m, respectively, in parallel direction to working surface. Additionally, a curve diagram depicting smooth curve direction illustrates the evolutionary changes in the surrounding rock stress arch shell for FMT-CCF with local filling at the end (see Figure 12).
Figure 12 illustrates that the stress arch shell characteristics of FMT-CCF with local filling at the end are as follows: (1) As the extent of the end filler mass continues to increase, the influence area of the “stable zone” becomes increasingly larger, and the stress arch shell caused by the filling body becomes increasingly larger. Simultaneously, the stress arch extends outward, with its footing gradually shifting deeper into the coal wall. (2) With a growing filling area, the “unstable area” or collapse zone gradually shrinks. Correspondingly, the stress arch shell within this “unstable area” tends to decrease. (3) When the end filler has a small width, its proportion in the total longueur of the working surface is small, and the influence scope of the “stable zone” stress arch shell formed is small. The stress arch shell of the working face is mainly dominated by the “unstable zone”. Therefore, the difference between the stress arch shell and the caving mining method is small, and the development height is high. (4) As the end fill width continues to increase, the proportion of the longueur of the working surface is increasing, and the influence scope of the “stable zone” of the stress arch shell is expanding. The coupling effect of the “stable zone” and the “unstable zone” jointly affects the stress arch shell of the covering stratum of the working surface. Notably, when the filling width at each end transitions from 10 m to 20 m, the altitude of the stress arch shell in the overlying stratum decreases significantly by approximately 14 m. Additionally, the shape of the arch shell changes, losing its smooth characteristics.

5.3. Study on the Migration Law of Overburden under Different Backfill Strengths

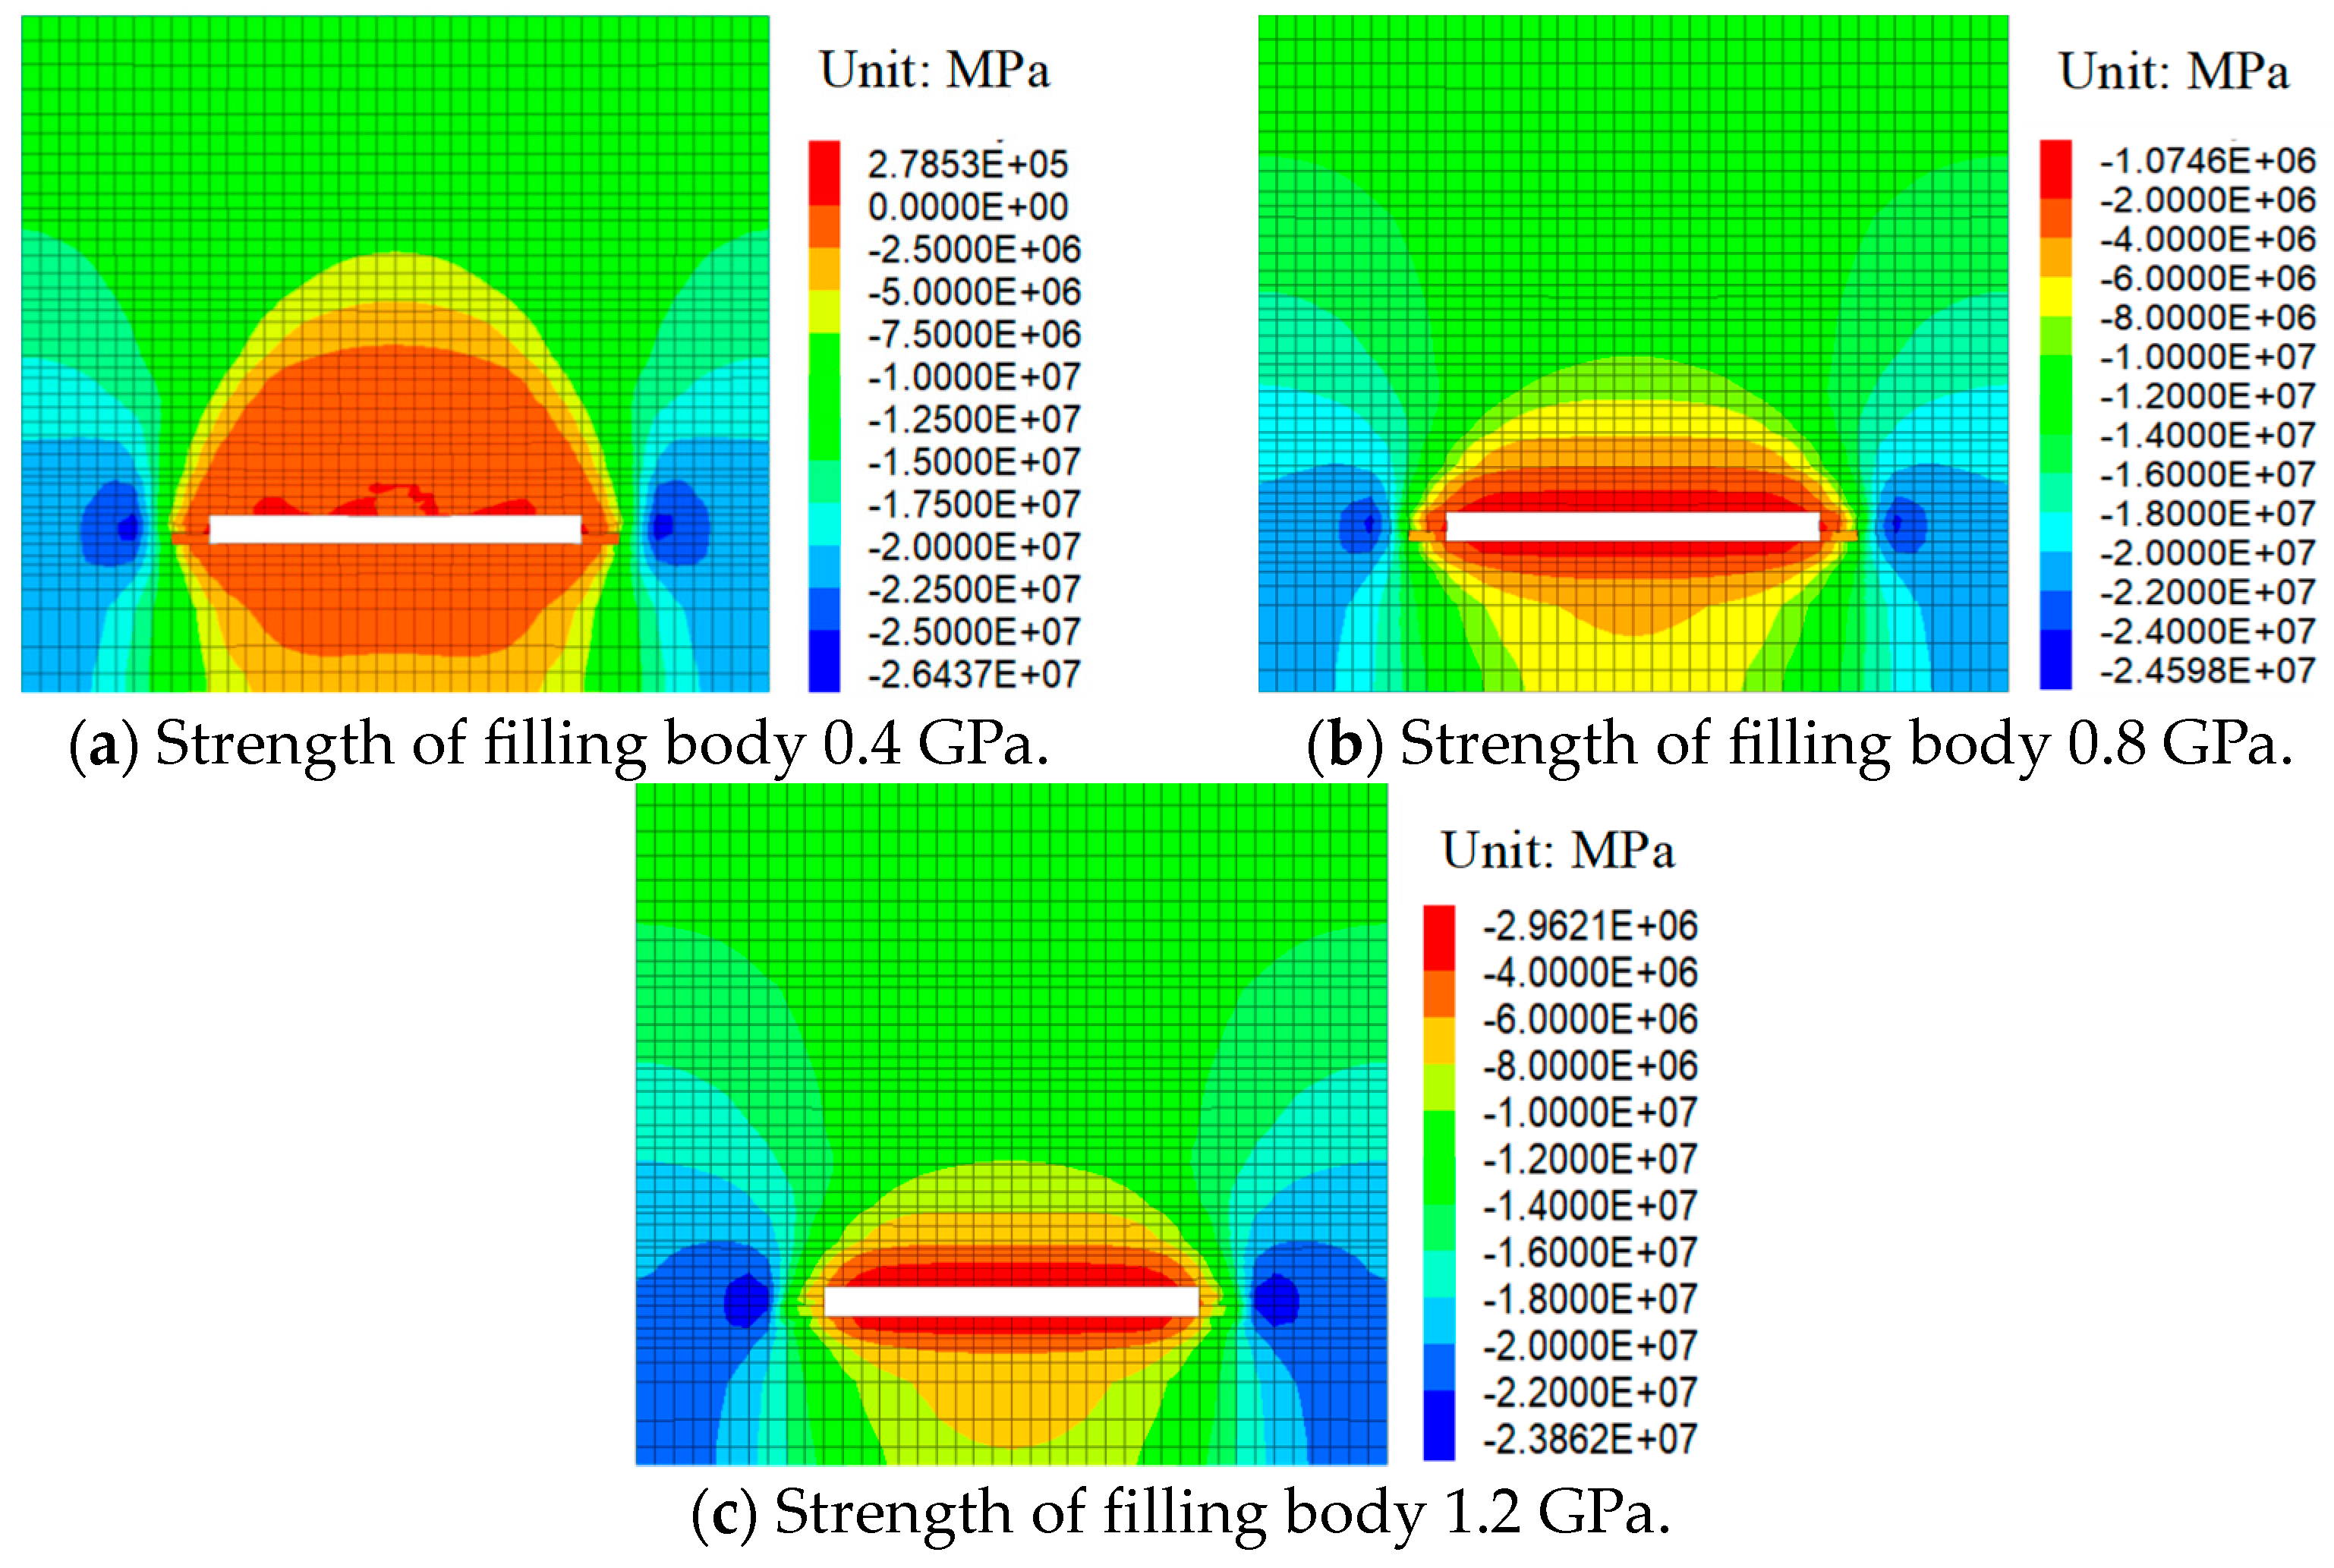
5.3.1. Stress Distribution Characteristics of Overburden under Different Backfill Strengths

Based on the observations from Figure 13, it is evident that the pressure distribution within the confined rock mass of the working surface undergoes significant changes as the range of the artificial filling working surface varies. Specifically, the wall rock at the end filling position experiences pressure-induced damage, leading to stress concentration on the coal walls flanking both sides of the working face. This stress concentration is a direct result of the overlying strata’s pressure. When the filling body strength (elastic modulus) is 0.4 GPa, a portion of the roof begins to collapse, and the pressure within the pressure intensity concentration zone at the coal wall peaks at 26.44 MPa. As the filling body strength increases to 0.8 GPa, the maximum stress value within the pressure intensity concentration area at the coal wall decreases to 24.60 MPa. Furthermore, when the filling body strength reaches 1.2 GPa, the maximum stress value at the coal wall’s pressure intensity concentration area drops to 23.86 MPa. It can be observed from the above data analysis that with the increment of the intensity of the filler mass, the maximum stress concentration of the coal wall continues to decrease. When the intensity of the filler mass increases from 0.4 GPa to 0.8 GPa, the maximum value of pressure intensity concentration at the coal rib decreases significantly, and the radius of stress influence decreases significantly. However, the maximum pressure intensity concentration value at the coal rib does not decrease significantly after the filling strength increases from 0.8 GPa to 1.2 GPa.

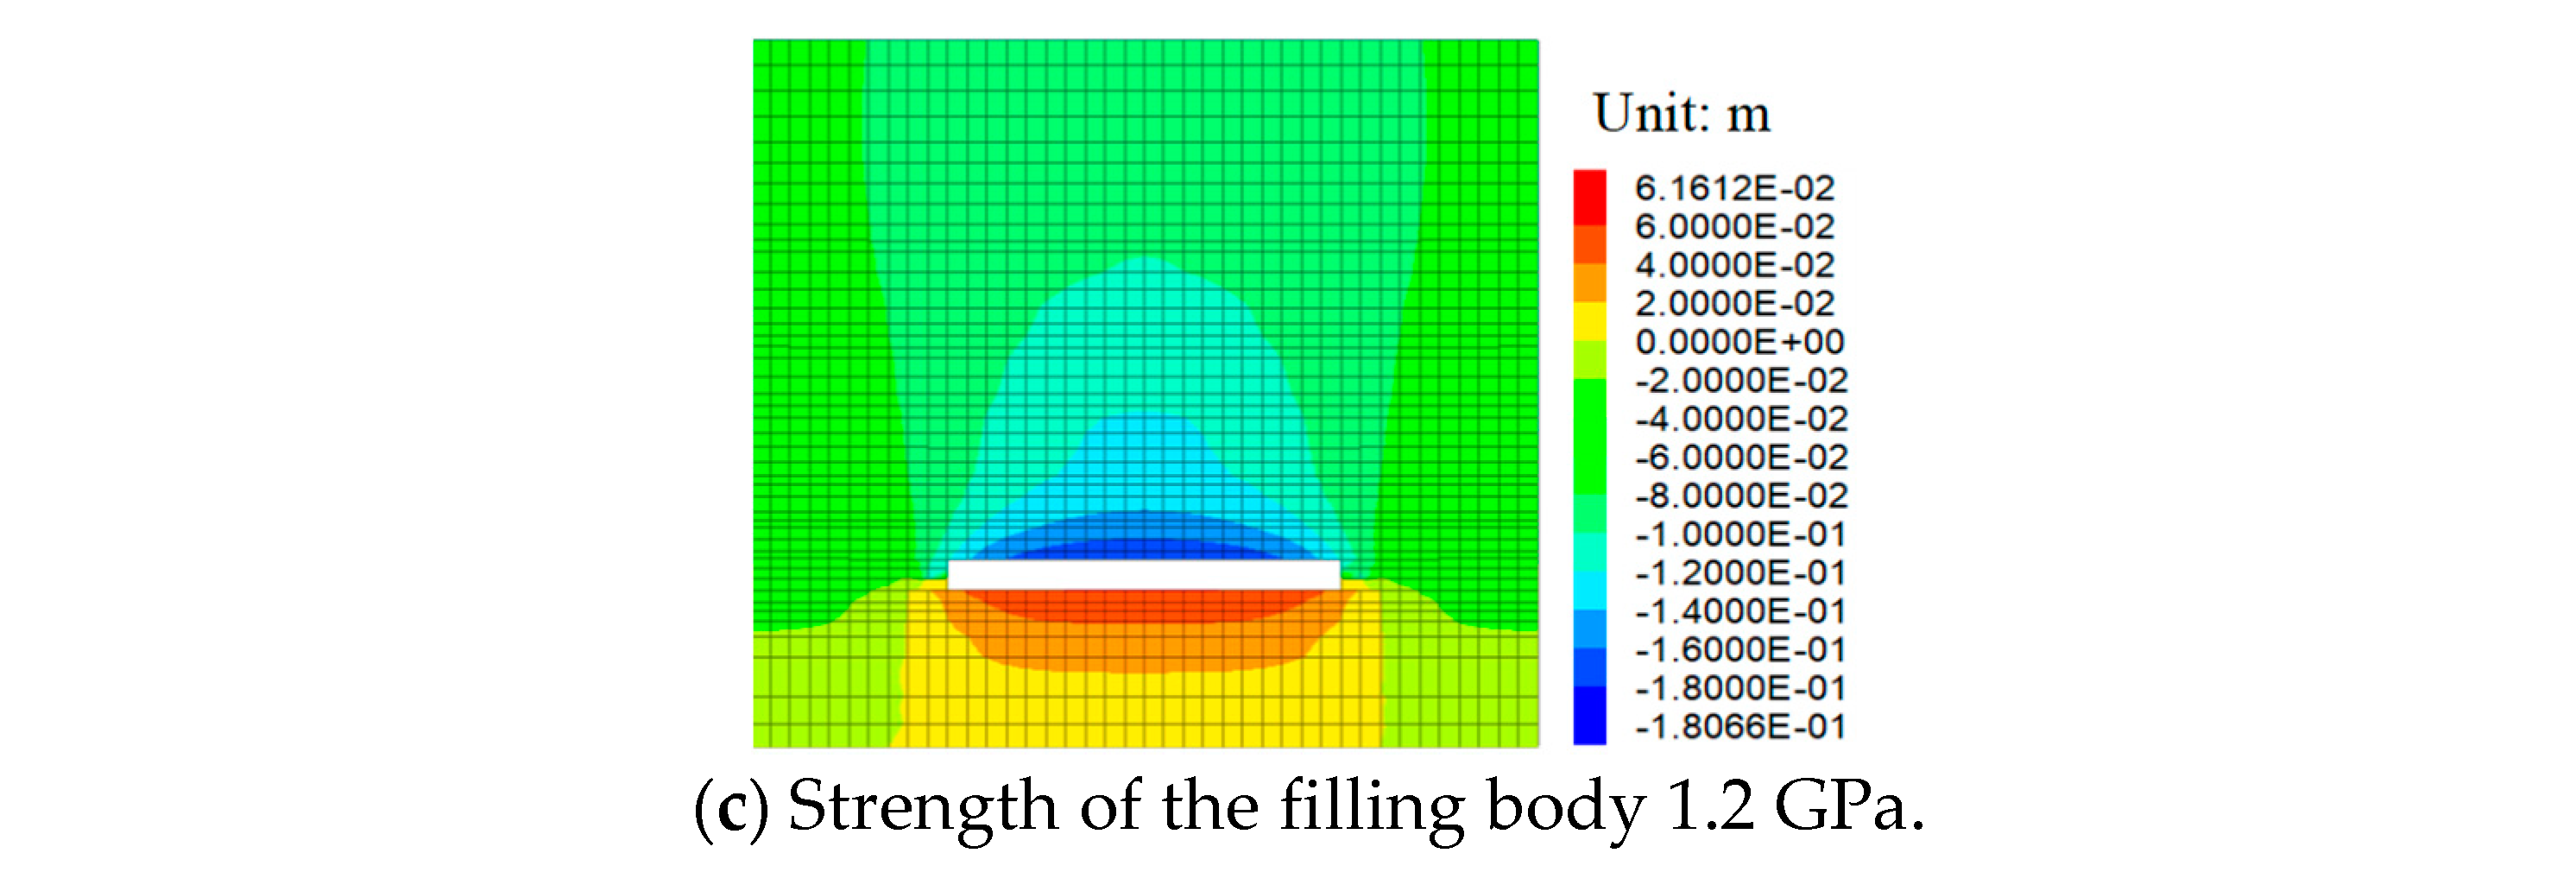
5.3.2. Displacement Distribution Characteristics of Overburden under Different Backfill Strengths

Figure 14 clearly illustrates that along the direction of the parallel working face at the two ends of the artificial filling working surface, the vertical displacement of the roof is the largest, while the floor displacement remains relatively small. When the filling body strength is 0.4 GPa, 0.8 GPa, and 1.2 GPa, the maximum vertical displacements of the roof are 40.00 cm, 19.78 cm, and 18.06 cm, respectively. Based on the above data analysis, the largest normal motion of the working surface roof gradually decreases with the increasing intensity of the filler mass. However, when the strength of the filler mass increases from 0.4 GPa to 0.8 GPa, the largest normal motion of the roof decreases significantly by 20.22 cm. It is much larger than the 1.72 cm decrease when the filling strength increases from 0.8 GPa to 1.2 GPa. Additionally, when the backfill strength is 0.4 GPa, the largest normal motion of the roof is observed at the top coal above the filling body, measuring 43.25 cm. When the backfill strength is 0.8 GPa and 1.2 GPa, the displacement distribution characteristics impacted by the support of the filler mass are similar to the stress distribution, and the arch height decreases, while the damage scope decreases.

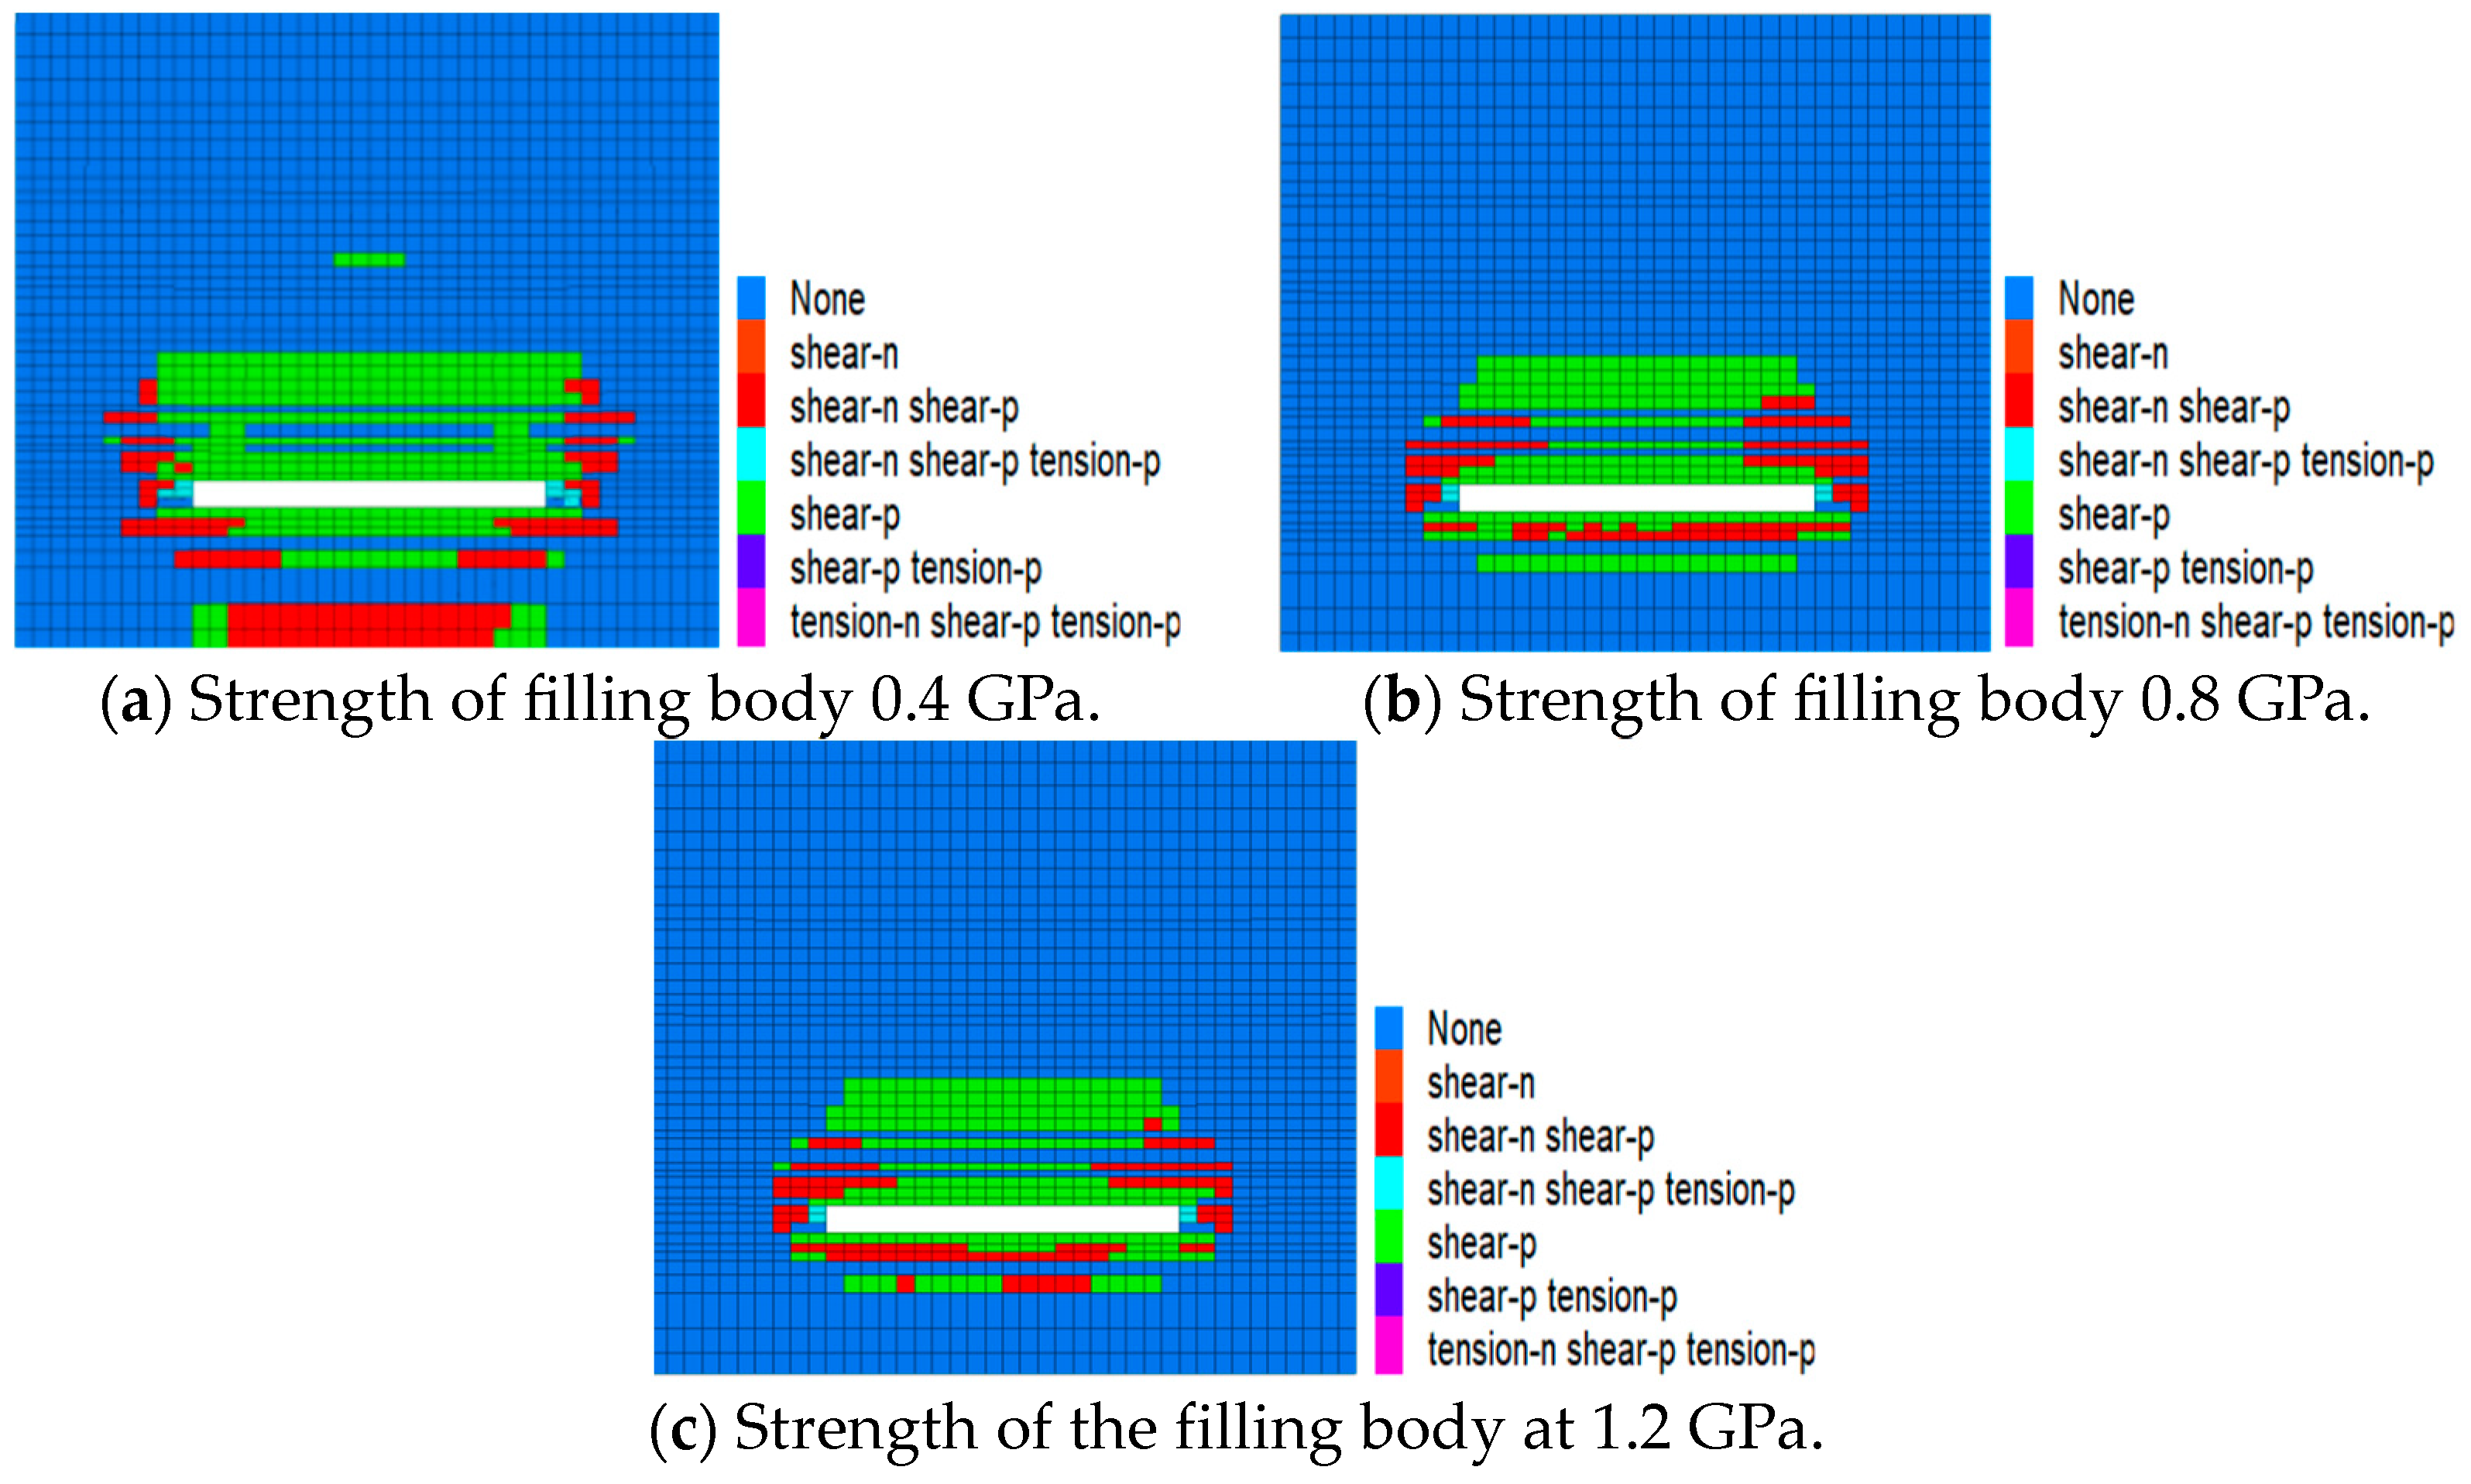
5.3.3. Failure Characteristics of Overburden under Different Backfill Strengths

As illustrated in Figure 15, when the filler mass strength is 0.4 GPa, the maximum height of the roof plastic damage zone reaches 58 m, while the deepest extent of the base plate plastic damage zone measures 40 m. When the filling body strength is 0.8 GPa, the maximum height of the roof plastic failure zone is 36 m, and the greatest deepness of the base plate plastic invalid domain is 18 m. Furthermore, with a strength of 1.2 GPa, the roof plastic failure zone’s maximum height narrows to 32 m, and the floor plastic failure zone’s maximum depth contracts to 14 m. Based on this data analysis, it is evident that when the filling body strength is set at 0.8 GPa and 1.2 GPa, the failure patterns within the filling area are relatively straightforward, primarily manifesting as shear failure. Conversely, the unfilled areas exhibit more complex and diverse failure characteristics, encompassing both shear and tensile failures as well as a combination of both. While an increase in filling strength does result in a reduction of the plastic failure zone’s scope, this reduction is not particularly significant. However, a notable difference emerges when the fill-mass strength is set at 0.4 GPa. Under these conditions, the wall rock exhibits a wide range of failure characteristics. Specifically, both the maximum invalid height and depth of the roof and base-plate-confined rock within the working surface are significantly greater. The failure range expands, and the failure forms become more complex and diverse, regardless of whether they occur within the filling area. Additionally, tensile failure is observed in the filling body at the end of the working surface. This indicates that a strength of 0.4 GPa is insufficient to effectively support and stabilize the wall rock, leading to a higher risk of various types of failure.
In summary, the analysis of the numerical modeling outcomes pertaining to the overburden stress, displacement, and plastic zone behavior under varying filler mass strengths reveals a consistent trend. As the strength of the filler mass is incrementally enhanced, there is a marked decrease in pressure intensity concentration at the coal rib, the maximum normal displacement of the wall rock, and the extent of plastic zone damage. This observation is attributed to the enhanced capacity of the filler mass and top coal to support the wall rock, effectively absorbing and redirecting stress, thereby significantly altering the distribution patterns of pressure and displacement within the workspace. Notably, a significant reduction in stress and maximum normal displacement values is observed when the fill-mass strength transitions from 0.4 GPa to 0.8 GPa, indicating a critical threshold. Furthermore, at a filler mass strength of 0.4 GPa, the plastic zone damage in the top and bottom plates is considerably more extensive compared to higher strengths of 0.8 GPa and 1.2 GPa. Concurrently, roof collapse and tensile damage are evident in the filler mass at the workface end, indicating that the strength at 0.4 GPa is insufficient to meet the minimum requirements for effective local filling. Under the influence of overburden pressure, the filler mass undergoes structural strength damage and instability, resulting in partial or complete loss of bearing capacity and uneven stress distribution throughout the structure.

6. Conclusions

To address the challenge of inadequate goaf filling in FMT-CCF, this paper introduces a filling technique tailored for this purpose. Furthermore, theoretical calculations and numerical simulations were employed to ascertain the pertinent parameters for local backfill mining.
(1) Based on the problem of a small filling space in an FMT-CCF, we propose the use of partial stopping-and-filling technology. This approach involves adopting support technology to reserve transition support and roadway space, followed by carrying out paste backfill for the reserved space. The aim is to achieve partial filling of the FMT-CCF and thereby extend the service life of the mine;
(2) The mechanistic modeling of the roof beam for the partial-filling method at both ends of the FMT-CCF was established. Additionally, three primary factors that affect the backfill effect were determined: the infill ratio, the extent of the end filler mass, and the strength of the filler mass;
(3) The filling rate exhibits an inverse proportionality to the pressure, displacement, and plastic invalid domain within the overburden. Upon achieving a 100% infill rate, the altitude of the stress arching within the covering stratum undergoes a significant reduction. This condition favorably contributes to the establishment of a stable bearing structure;
(4) When the width of the backfill expands from 10 m to 20 m, the overburden stress arch diminishes by approximately 14 m. Additionally, as the backfill strength rises from 0.4 GPa to 0.8 GPa, the peak height of the overburden plastic failure zone decreases by 22 m, and the extent of the failure zone undergoes a significant contraction.

Author Contributions

Conceptualization, Z.D. and D.C.; methodology, X.L.; software, Y.J.; validation, W.Z., D.Z. and Y.T.; formal analysis, D.C.; investigation, X.L.; resources, D.Z.; data curation, Z.D.; writing—original draft preparation, Z.D.; writing—review and editing, X.L.; visualization, W.Z.; supervision, Y.T.; project administration, Y.J.; funding acquisition, X.L. All authors have read and agreed to the published version of the manuscript.

Funding

This work was supported by the National Natural Science Foundation of China (52204141, 52104204), Taishan Scholars Project (tsqnz20221140) and Natural Science Foundation of Shandong Province (ZR2021QE170).

Institutional Review Board Statement

Not applicable.

Informed Consent Statement

Not applicable.

Data Availability Statement

Data are contained within the article.

Conflicts of Interest

Author Weizhao Zhang was employed by the company Shandong Energy Group XiBei Mining Co., LID; Author Dingding Zhang was employed by the company Shandong Energy Group Xibei Mining Co., LID; Author Yongfeng Tian was employed by the company Shandong Energy Group Dispatching Command Center. They do not have conflict of interest. The remaining authors declare that the research was conducted in the absence of any commercial or financial relationships that could be construed as a potential conflict of interest.

References

  1. Sun, Y.; Zuo, J.; Karakus, M.; Liu, L.; Zhou, H.; Yu, M. A new theoretical method to predict strata movement and surface subsidence due to inclined coal seam mining. Rock Mech. Rock Eng. 2021, 54, 2723–2740. [Google Scholar] [CrossRef]
  2. Chen, S.; Liu, J.; Wang, F.; Zhou, J.; Tang, P.; Gao, Z. Hydrochemical analysis of groundwater in coastal coal mining areas—A case study of the liangjia coal mine, north China. Mine Water Environ. 2022, 41, 415–427. [Google Scholar] [CrossRef]
  3. Bai, E.; Guo, W.; Zhang, H.; Tan, Y.; Ma, Z.; Wu, D.; Guo, M.; Wen, P. Coal mining method with near-zero impact on the ecological environment in a high-intensity mining area of Northwest China. Bull. Eng. Geol. Environ. 2022, 81, 80. [Google Scholar] [CrossRef]
  4. Deng, L.; Li, X.; Wu, Y.; Li, F.; Huang, Z.; Ji, Y.; Zou, C.; Liu, Z. Influence of cooling speed on the physical and mechanical properties of granite in geothermal-related engineering. Deep Undergr. Sci. Eng. 2022, 1, 40–57. [Google Scholar] [CrossRef]
  5. Huang, L.; Fang, Y.; Hou, Z.; Xie, Y.; Wu, L.; Lou, J.; Wang, Q.; Guo, Y.; Sun, W. A preliminary site selection system for underground hydrogen storage in salt caverns and its application in Pingdingshan, China. Deep Undergr. Sci. Eng. 2023, 3, 117–128. [Google Scholar] [CrossRef]
  6. Wang, X.; Guan, K.; Yang, T.; Liu, X. Instability mechanism of pillar burst in asymmetric mining based on cusp catastrophe model. Rock Mech. Rock Eng. 2021, 54, 1463–1479. [Google Scholar] [CrossRef]
  7. Li, M.; Zhang, J.; Guo, Y.; Pu, H.; Peng, Y. Influence of particle size distribution on fractal characteristics of waste rock backfill materials under compression. J. Mater. Res. Technol. 2022, 20, 2977–2989. [Google Scholar] [CrossRef]
  8. Yin, S.; Li, Z.; Wang, E.; Niu, Y.; Tian, H.; Li, X.; Li, H.; Yang, C. The infrared thermal effect of coal failure with different impact types and its relationship with bursting liability. Infrared Phys. Technol 2024, 134, 105263. [Google Scholar] [CrossRef]
  9. Wu, A.; Wang, Y.; Xiao, B.; Wang, J.; Wang, L. Key theory and technology of cemented paste backfill for green mining of metal mines. Green Smart Min. Eng. 2024, 1, 27–39. [Google Scholar] [CrossRef]
  10. Wu, S.; Zhang, J.; Song, Z.; Fan, W.; Zhang, Y.; Dong, X.; Zhang, Y.; Kan, B.; Chen, Z.; Zhang, J.; et al. Review of the development status of rock burst disaster prevention system in China. J. Cent. South Univ. 2023, 30, 3763–3789. [Google Scholar] [CrossRef]
  11. Chen, F.; Liu, J.; Zhang, X.; Wang, J.; Jiao, H.; Yu, J. Review on the art of roof contacting in cemented waste backfill technology in a metal mine. Minerals 2022, 12, 721. [Google Scholar] [CrossRef]
  12. Xiao, Z.Q.; Zhang, W.C. Review of allanite: Properties, occurrence and mineral processing technologies. Green Smart Min Eng. 2024, 1, 40–52. [Google Scholar] [CrossRef]
  13. Skrzypkowski, K. 3D numerical modelling of the application of cemented paste backfill on displacements around strip excavations. Energies 2021, 14, 7750. [Google Scholar] [CrossRef]
  14. Xue, Z.; Gan, D.; Zhang, Y.; Liu, Z. Rheological behavior of ultrafine-tailings cemented paste backfill in high-temperature mining conditions. Constr. Build. Mater. 2020, 253, 119212. [Google Scholar] [CrossRef]
  15. Li, H.; Zhang, B.; Bai, H.; Wu, J.; Meng, Q.; Xiao, N.; Li, F.; Wu, G. Surface water resource protection in a mining process under varying strata thickness—A case study of buliangou coal mine, China. Sustainability 2019, 10, 4634. [Google Scholar] [CrossRef]
  16. Xue, Y.-C.; Xu, T.; Wasantha, P.L.P.; Yang, T.-H.; Fu, T.-F. Dynamic disaster control of backfill mining under thick magmatic rock in one side goaf: A case study. J. Cent. South Univ. 2020, 27, 3103–3117. [Google Scholar] [CrossRef]
  17. Li, X.; Chen, D.; Fu, J.; Liu, S.; Geng, X. Construction and application of fuzzy comprehensive evaluation model for rockburst based on microseismic monitoring. Appl. Sci. 2023, 13, 12013. [Google Scholar] [CrossRef]
  18. Xu, J.; Xuan, D.; Zhu, W.; Wang, X.; Wang, B.; Teng, H. Study and application of coal mining with partial backfilling. J. China Coal Soc. 2015, 40, 1303–1312. [Google Scholar] [CrossRef]
  19. Deng, X.J.; Zhang, J.X.; Zhou, N.; De Wit, B.; Wang, C.T. Upward slicing longwall-roadway cemented backfilling technology for mining an extra-thick coal seam located under aquifers: A case study. Environ. Earth Sci. 2017, 76, 789. [Google Scholar] [CrossRef]
  20. Cao, W.; Wang, X.; Li, P.; Zhang, D.; Sun, C.; Qin, D. Wide strip backfill mining for surface subsidence control and its application in critical mining conditions of a coal mine. Sustainability 2018, 10, 700. [Google Scholar] [CrossRef]
  21. Lu, B.; Zhang, X.; Li, F.; Zhang, B.; Pang, Z. Study and application of short-wall gangue cemented backfilling technology. J. China Coal Soc. 2017, 42, 7–15. [Google Scholar] [CrossRef]
  22. Liu, J.; Sui, W.; Zhao, Q. Environmentally sustainable mining: A case study of intermittent cut-and-fill mining un-der sand aquifers. Environ. Earth Sci. 2017, 76, 562. [Google Scholar] [CrossRef]
  23. Li, H.; Li, X.; Fu, J.; Zhu, N.; Chen, D.; Wang, Y.; Ding, S. Experimental study on compressive behavior and failure characteristics of imitation steel fiber concrete under uniaxial load imitation steel fiber concrete under uniaxial load. Constr. Build. Mater. 2023, 399, 132599. [Google Scholar] [CrossRef]
  24. Li, H.; Li, X.; Fu, J.; Gao, Z.; Chen, P.; Zhang, Z. Research on acoustic emission multi-parameter characteristics in the failure process of imitation steel fiber reinforced concrete. Phys. Fluids 2023, 35, 107109. [Google Scholar] [CrossRef]
  25. Fu, J.; Chen, D.; Li, X.; Li, X.; Li, H.; Liu, S.; Li, C.; Zhang, J. Research on the technology of gob-side entry retaining by pouring support beside the roadway in three soft coal seam A case study. Phys. Fluids 2024, 36, 017123. [Google Scholar] [CrossRef]
  26. Liu, H.; Li, X.; Yu, Z.; Tan, Y.; Ding, Y.; Chen, D.; Wang, T. Influence of hole diameter on mechanical properties and stability of granite rock surrounding tunnels. Phys. Fluids 2023, 35, 064121. [Google Scholar] [CrossRef]
  27. Zhao, T.; Zhang, P.; Guo, W.; Gong, X.; Wang, C.; Chen, Y. Controlling roof with potential rock burst risk through different pre-crack length: Mechanism and effect research. J. Cent. South Univ. 2022, 29, 3706–3719. [Google Scholar] [CrossRef]
  28. Zou, Q.; Chen, Z.; Zhan, J.; Chen, C.; Gao, S.; Kong, F.; Xia, X. Morphological evolution and flow conduction charac-teristics of fracture channels in fractured sandstone under cyclic loading and unloading. Int. J. Min. Sci. Technol. 2023, 33, 1527–1540. [Google Scholar] [CrossRef]
  29. Li, M.; Peng, Y.; Zhang, J.; Zhu, C.; Ma, D.; Huang, P. Effects of compressive deformation of backfill materials on strata movement and stress evolution in deep gangue backfill mining. Bull. Eng. Geol. Environ. 2022, 81, 361. [Google Scholar] [CrossRef]
  30. Du, Z.; Sheng, S.; Guo, J. Effect of composite activators on mechanical properties, hydration activity and microstructure of red mud-based geopolymer. J. Mater. Res. Technol. 2023, 24, 8077–8085. [Google Scholar] [CrossRef]
  31. Huang, Y.; Li, J.; Song, T.; Kong, G.; Li, M. Analysis on filling ratio and shield supporting pressure for overburden movement control in coal mining with compacted backfilling. Energies 2017, 10, 31. [Google Scholar] [CrossRef]
  32. Zhou, N.; Jiang, H.Q.; Zhang, J.X. Application of solid backfill mining techniques for coal mine under embankment dam. Min. Technol. 2013, 122, 228–234. [Google Scholar] [CrossRef]
  33. Ma, C.; Li, H.; Zhang, P. Subsidence prediction method of solid backfilling mining with different filling ratios under thick unconsolidated layers. Arab. J. Geosci. 2017, 10, 511. [Google Scholar] [CrossRef]
  34. Sun, W.B.; Wang, Y.; Qiu, H.F.; Ding, Z.W. Numerical simulation study of strip filling for water-preserved coal mining. Environ. Sci. Pollut. Res. 2020, 27, 12899–12907. [Google Scholar] [CrossRef] [PubMed]
  35. Chen, S.; Du, Z.; Zhang, Z.; Zhang, H.; Xia, Z.; Feng, F. Effects of chloride on the early mechanical properties and microstructure of gangue-cemented paste backfill. Constr. Build. Mater. 2020, 235, 117504. [Google Scholar] [CrossRef]
  36. Chen, S.; Du, Z.; Zhang, Z.; Yin, D.; Feng, F.; Ma, J. Effects of red mud additions on gangue-cemented paste backfill properties. Powder Technol. 2020, 367, 833–840. [Google Scholar] [CrossRef]
  37. Liu, Y.; Lu, Y.; Wang, C.; Cui, B.; Guo, H.; Li, H.; Guo, Y. Effect of sulfate mine water on the durability of filling paste. Int. J. Green Energy 2018, 15, 864–873. [Google Scholar] [CrossRef]
  38. Wang, J.; Liu, Y.; Li, F.; Wang, C. Force chains in top coal caving mining. Int. J. Rock Mech. Min. Sci. 2020, 12, 104218. [Google Scholar] [CrossRef]
  39. Cheng, Z.; Yang, S.; Li, L.; Zhang, L. Support working resistance determined on top-coal caving face based on coal-rock combined body. Geomech. Eng. 2019, 19, 255–268. [Google Scholar] [CrossRef]
  40. Zhao, Y.; Yang, Y.; Li, X.; Wang, Z. Overlying strata movement and abutment pressure evolution process of fully mechanized top coal caving mining in extra thick coal seam. Geofluids 2021, 2021, 7839888. [Google Scholar] [CrossRef]
  41. Zhang, B.; Yang, Z.; Ji, C.; Guo, Z.; Li, H. Research on the influence of the key stratum position on the support working resistance during large mining height top-coal caving mining. Adv. Civ. Eng. 2021, 2021, 6690280. [Google Scholar] [CrossRef]
  42. Zhu, Z.; Zhang, H.; Nemcik, J.; Lan, T.; Han, J.; Chen, Y. Overburden movement characteristics of top-coal caving mining in multi-seam areas. Q. J. Eng. Geol. Hydrogeol. 2018, 51, 276–286. [Google Scholar] [CrossRef]
  43. Zhou, Y.; Yu, X. Study of the evolution of water-conducting fracture zones in overlying rock of a fully mechanized caving face in gently inclined extra-thick coal seams. Appl. Sci. 2022, 12, 9057. [Google Scholar] [CrossRef]
  44. Zhang, G.; Wang, Z.; Guo, G.; Wei, W.; Wang, F.; Zhong, L.; Gong, Y. Study on regional strata movement during deep mining of erdos coal field and its control. Int. J. Environ. Res. Public Health 2022, 19, 14902. [Google Scholar] [CrossRef]
  45. Wang, Q.; Wang, C.; Liu, Y.; Xu, J.; Wang, T.; Li, Y.; Liu, Q. Exploration and improvement of fuzzy evaluation model for rockburst. Min. Metall. Explor. 2024, 41, 559–587. [Google Scholar] [CrossRef]
  46. Fan, D.; Liu, X.; Tan, Y.; Li, X.; Lkhamsuren, P. Instability energy mechanism of super-large section crossing chambers in deep coal mines. Int. J. Min. Sci. Technol. 2022, 32, 1075–1086. [Google Scholar] [CrossRef]
  47. Xue, Y. Study on the movement and deformation law of overlying strata in filling working face under different filling rates. Eng. Adv. 2023, 3, 52–55. [Google Scholar] [CrossRef]
  48. Xu, B.; Yang, R.; Li, Y.; Lu, B.; Luo, H.; Li, C. Three measurement relalionship and conlrol principle of overburden movement in cemenled filling. J. China Coal Soc. 2022, 47, 49–60. [Google Scholar] [CrossRef]
Figure 1. Filling space support diagram. 1, transportation roadway; 2, transition hydraulic support; 3, filling retaining wall; 4, metal mesh; 5, filling body; 6, single hydraulic prop; 7, filling pipeline; 8, top-coal caving hydraulic support; L, cyclic filling step.
Sustainability 16 04393 g001
Figure 2. Mechanical model along the inclined roof beam.
Sustainability 16 04393 g002
Figure 3. Numerical calculation model diagram.
Sustainability 16 04393 g003
Figure 4. Model excavation-filling process diagram.
Sustainability 16 04393 g004
Figure 5. Propensity stress distribution characteristics under different filling rates.
Sustainability 16 04393 g005
Figure 6. Supporting pressure distribution curve under different filling conditions.
Sustainability 16 04393 g006aSustainability 16 04393 g006b
Figure 7. Propensity displacement distribution characteristics under different filling rates.
Sustainability 16 04393 g007aSustainability 16 04393 g007b
Figure 8. The distribution of the plasticity of overlying strata under different filling rates.
Sustainability 16 04393 g008
Figure 9. Propensity stress distribution characteristics under different tip-filling widths.
Sustainability 16 04393 g009
Figure 10. Propensity displacement distribution characteristics under different tip-filling widths.
Sustainability 16 04393 g010
Figure 11. The distribution of the plasticity of overlying strata under different tip-filling widths.
Sustainability 16 04393 g011
Figure 12. Schematic diagram of overburden stress arch evolution in local filling of tip.
Sustainability 16 04393 g012aSustainability 16 04393 g012b
Figure 13. Propensity stress distribution characteristics under different backfill strengths.
Sustainability 16 04393 g013
Figure 14. Propensity displacement distribution characteristics under different backfill strengths.
Sustainability 16 04393 g014aSustainability 16 04393 g014b
Figure 15. The distribution of the plasticity of overlying strata under different backfill strengths.
Sustainability 16 04393 g015
Table 1. Mechanical parameters of the coal and intact rock.
No.NameUnit Weight (kg/m3)Elastic Modulus (GPa)Poisson’s RatioTensile Strength (MPa)Cohesive Force
(MPa)
Internal Friction Angle
(°)
1Coarse sandstone2500250.272.43.229.5
2Fine sandstone26807.50.331.71.924
3Siltstone2550110.342.11.226
4Medium-grained sandstone2160150.312.42.128
5Coal13501.10.3211.523
6Carbonaceous mudstone258080.381.51.225.5
7Mudstone246190.261.21,330
8Siltstone2550110.342.11.226
9Coarse sandstone2500250.272.43.229.5
10Backfill24501.20.321.83.323
Disclaimer/Publisher’s Note: The statements, opinions and data contained in all publications are solely those of the individual author(s) and contributor(s) and not of MDPI and/or the editor(s). MDPI and/or the editor(s) disclaim responsibility for any injury to people or property resulting from any ideas, methods, instructions or products referred to in the content.

