


Composting of Biowaste Generated in University Canteens and Rural Households: Converting Waste into a Valuable Product


Abstract
1. Introduction
2. Materials and Methods
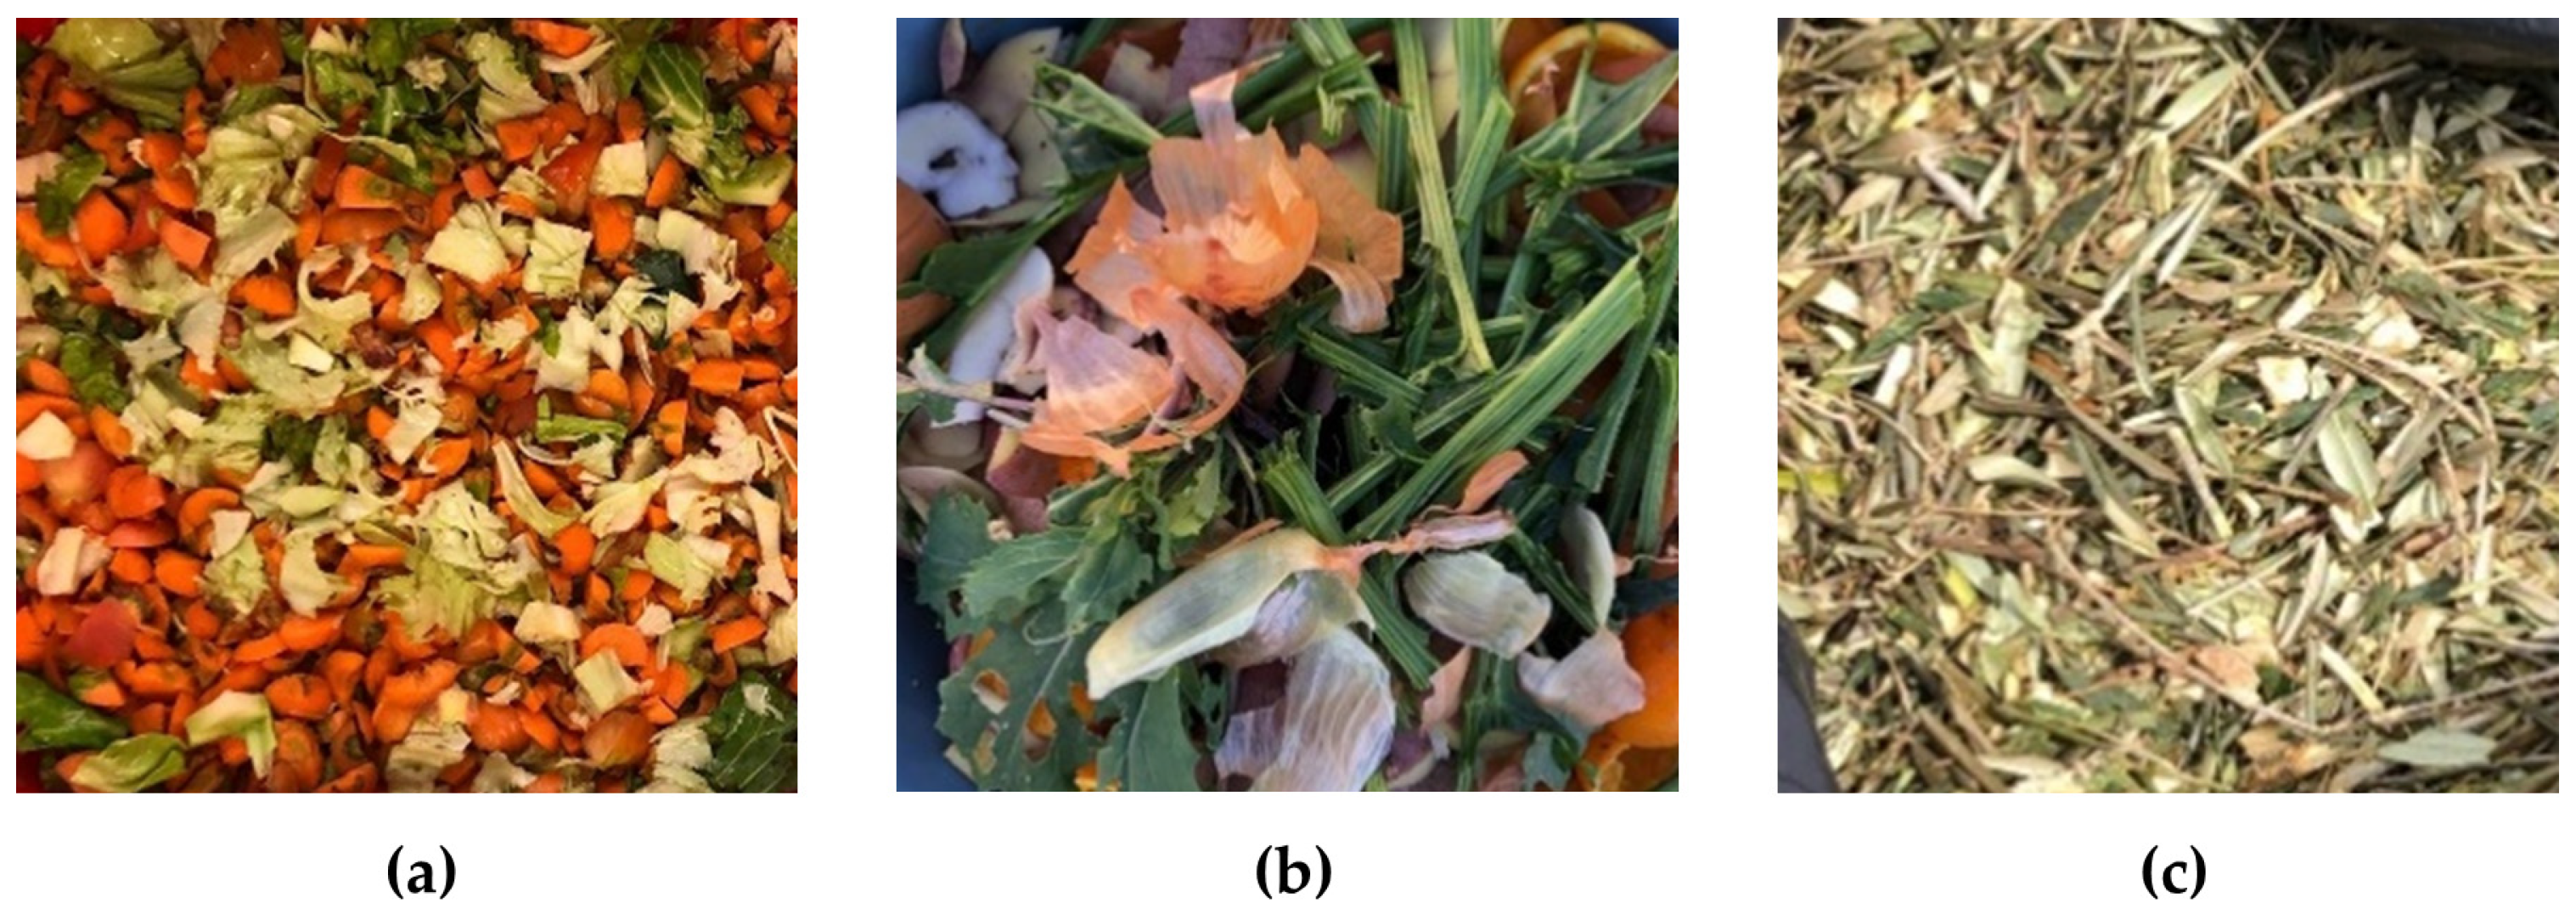
2.1. Materials
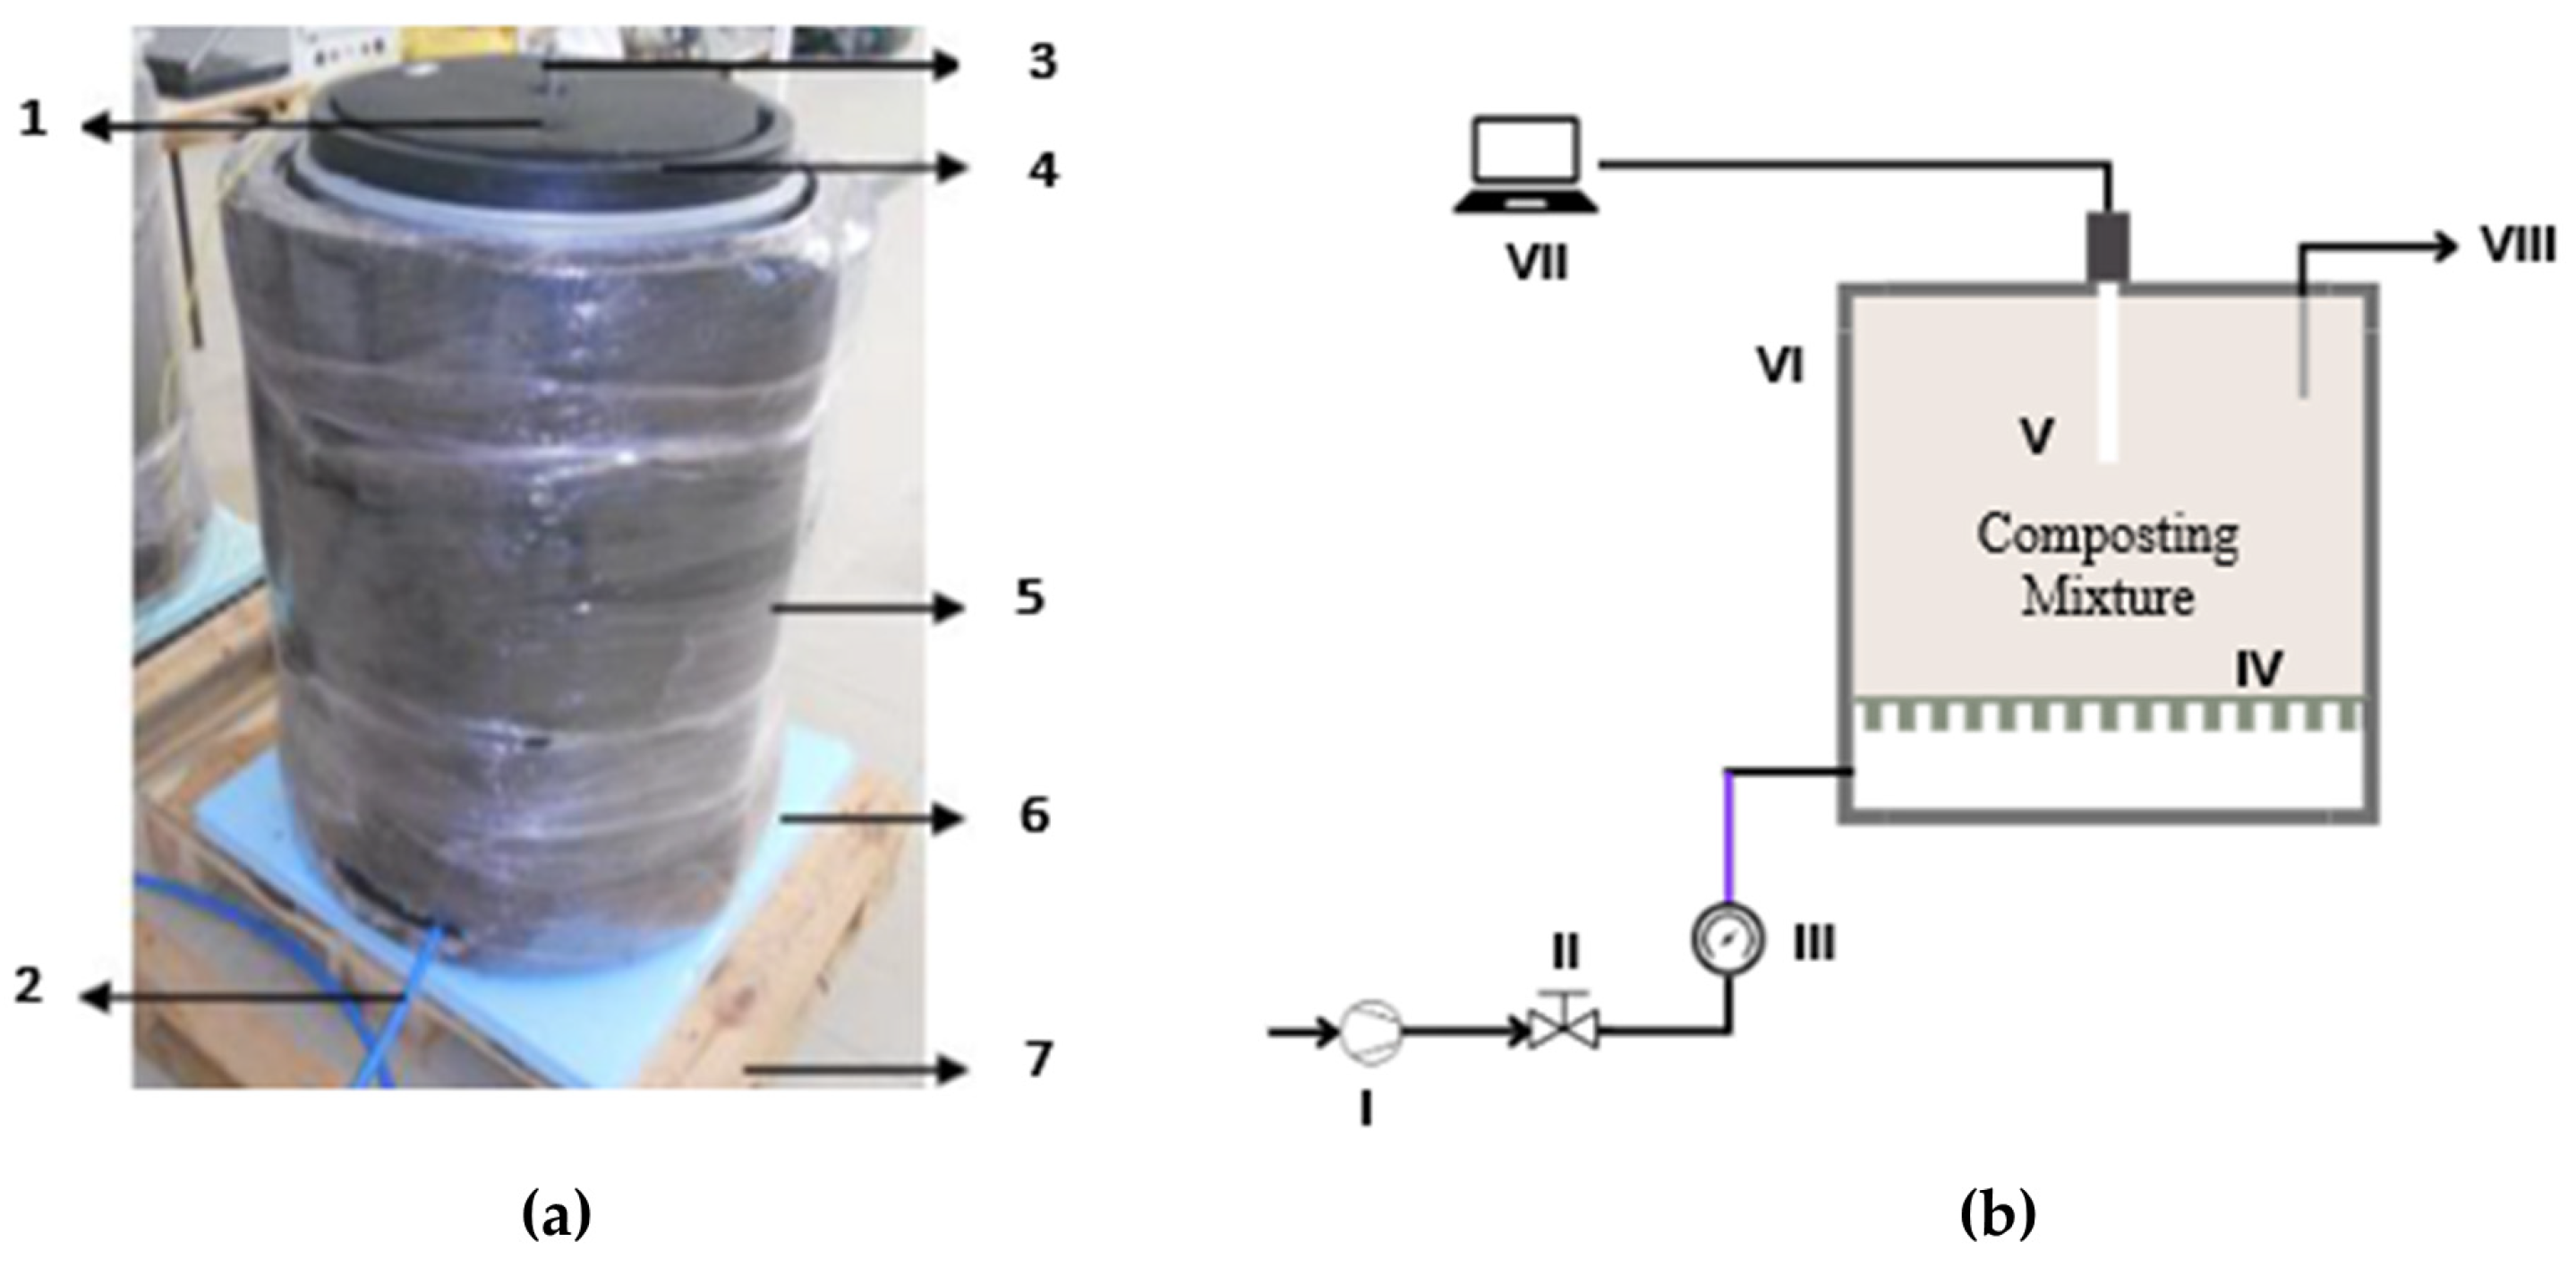
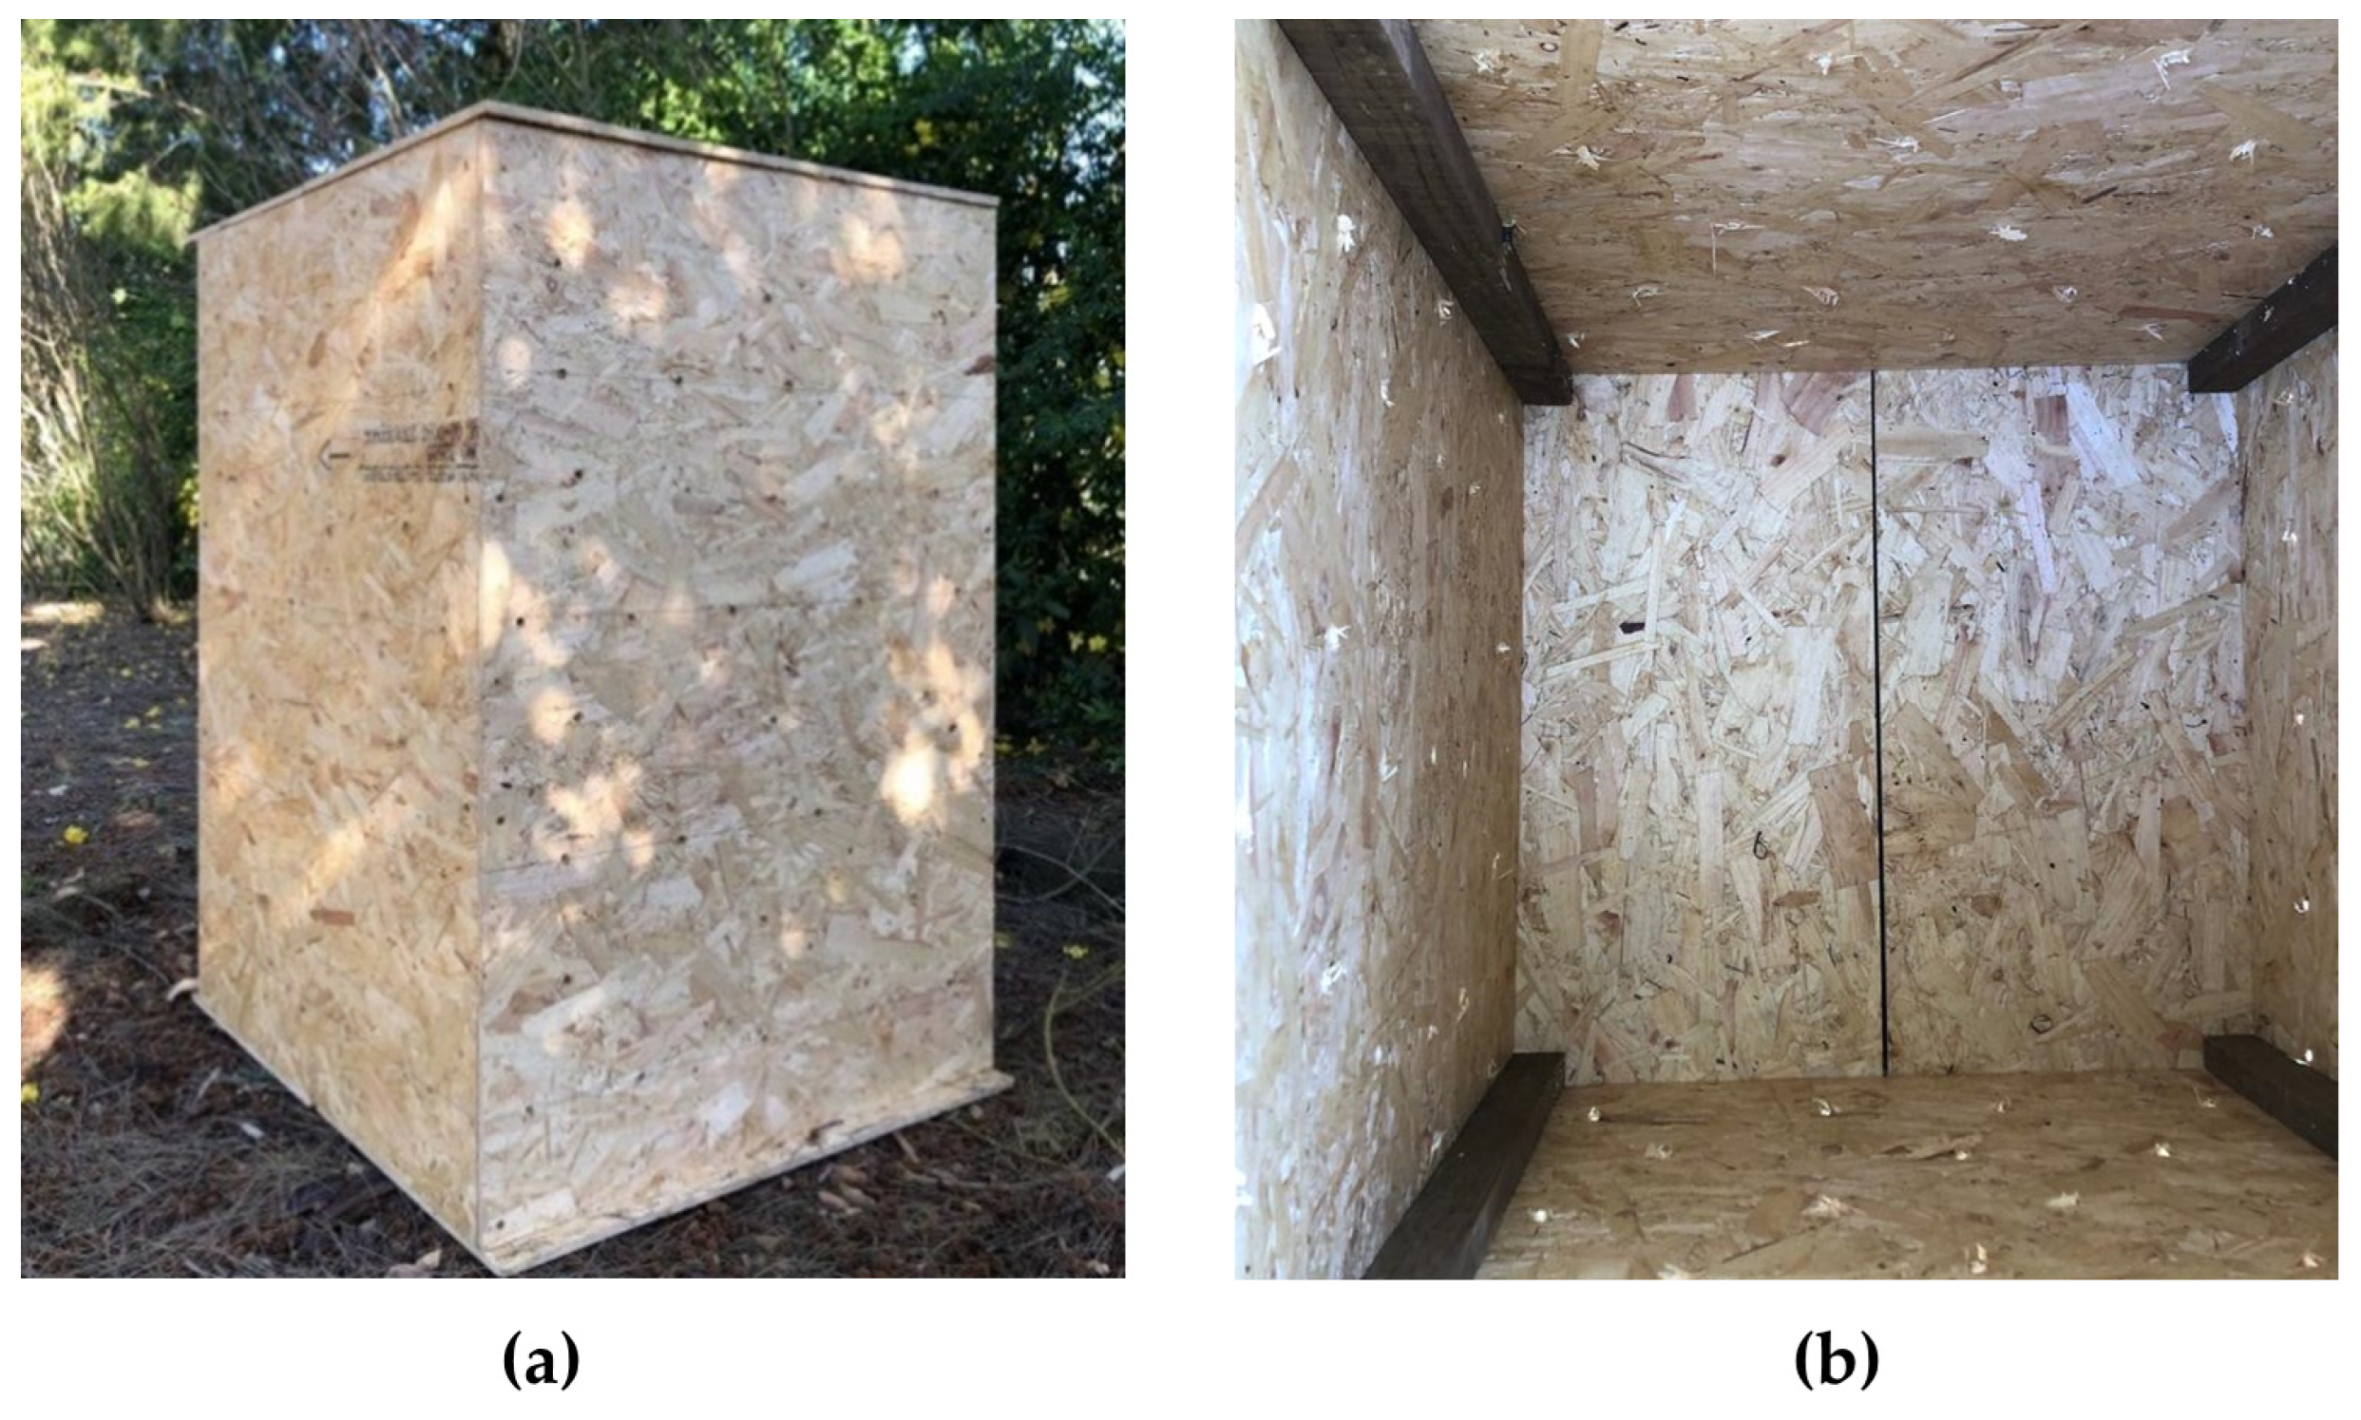
2.2. Composting Experiments
2.3. Analytical Methods
3. Results and Discussion
3.1. Characterization of Mixtures
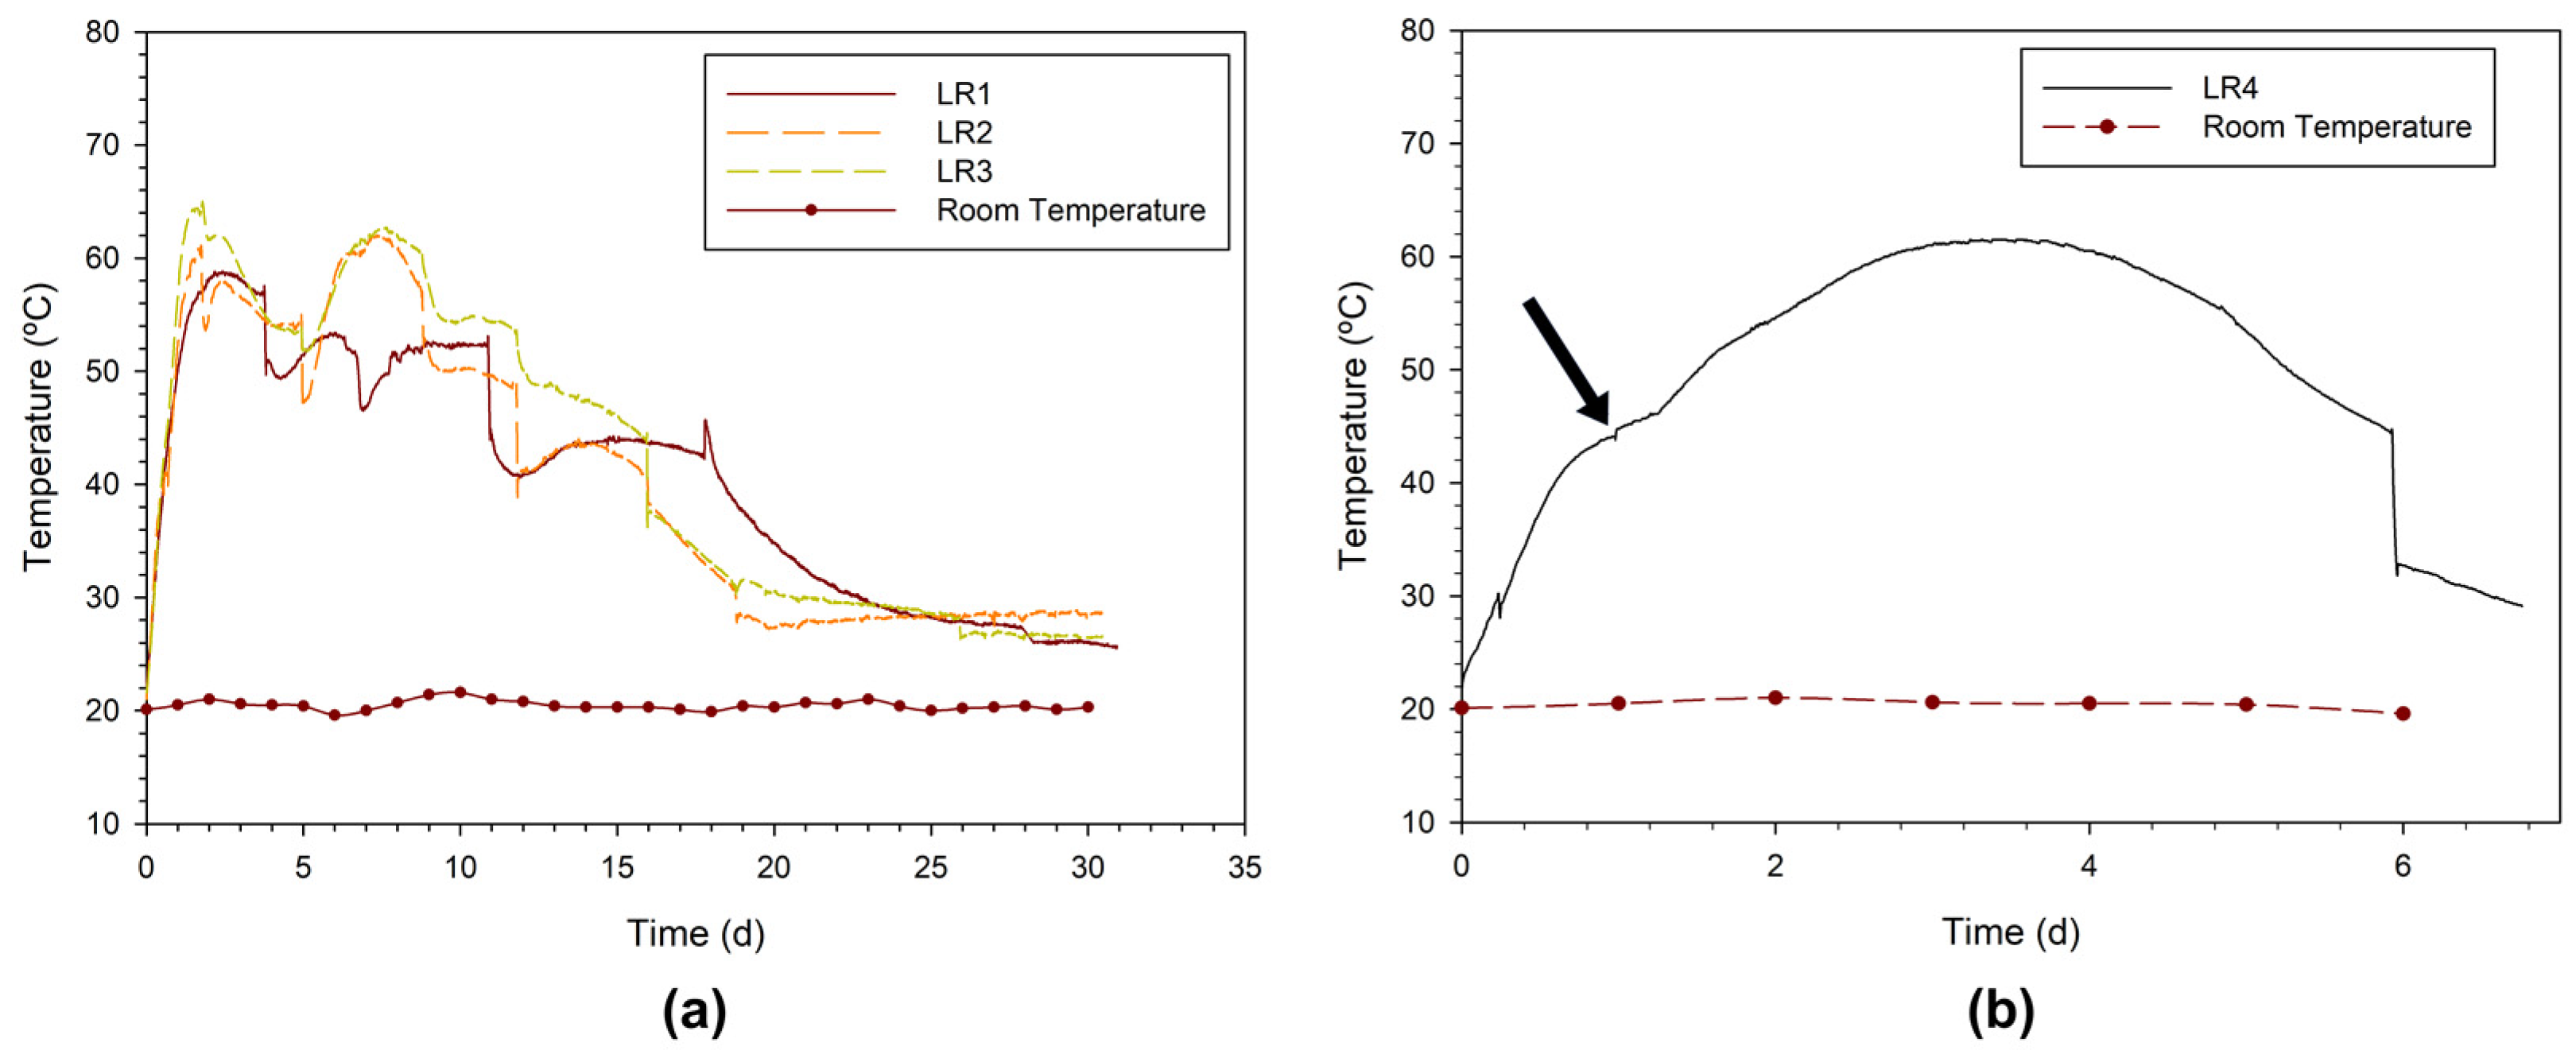
3.2. Lab-Scale Composting
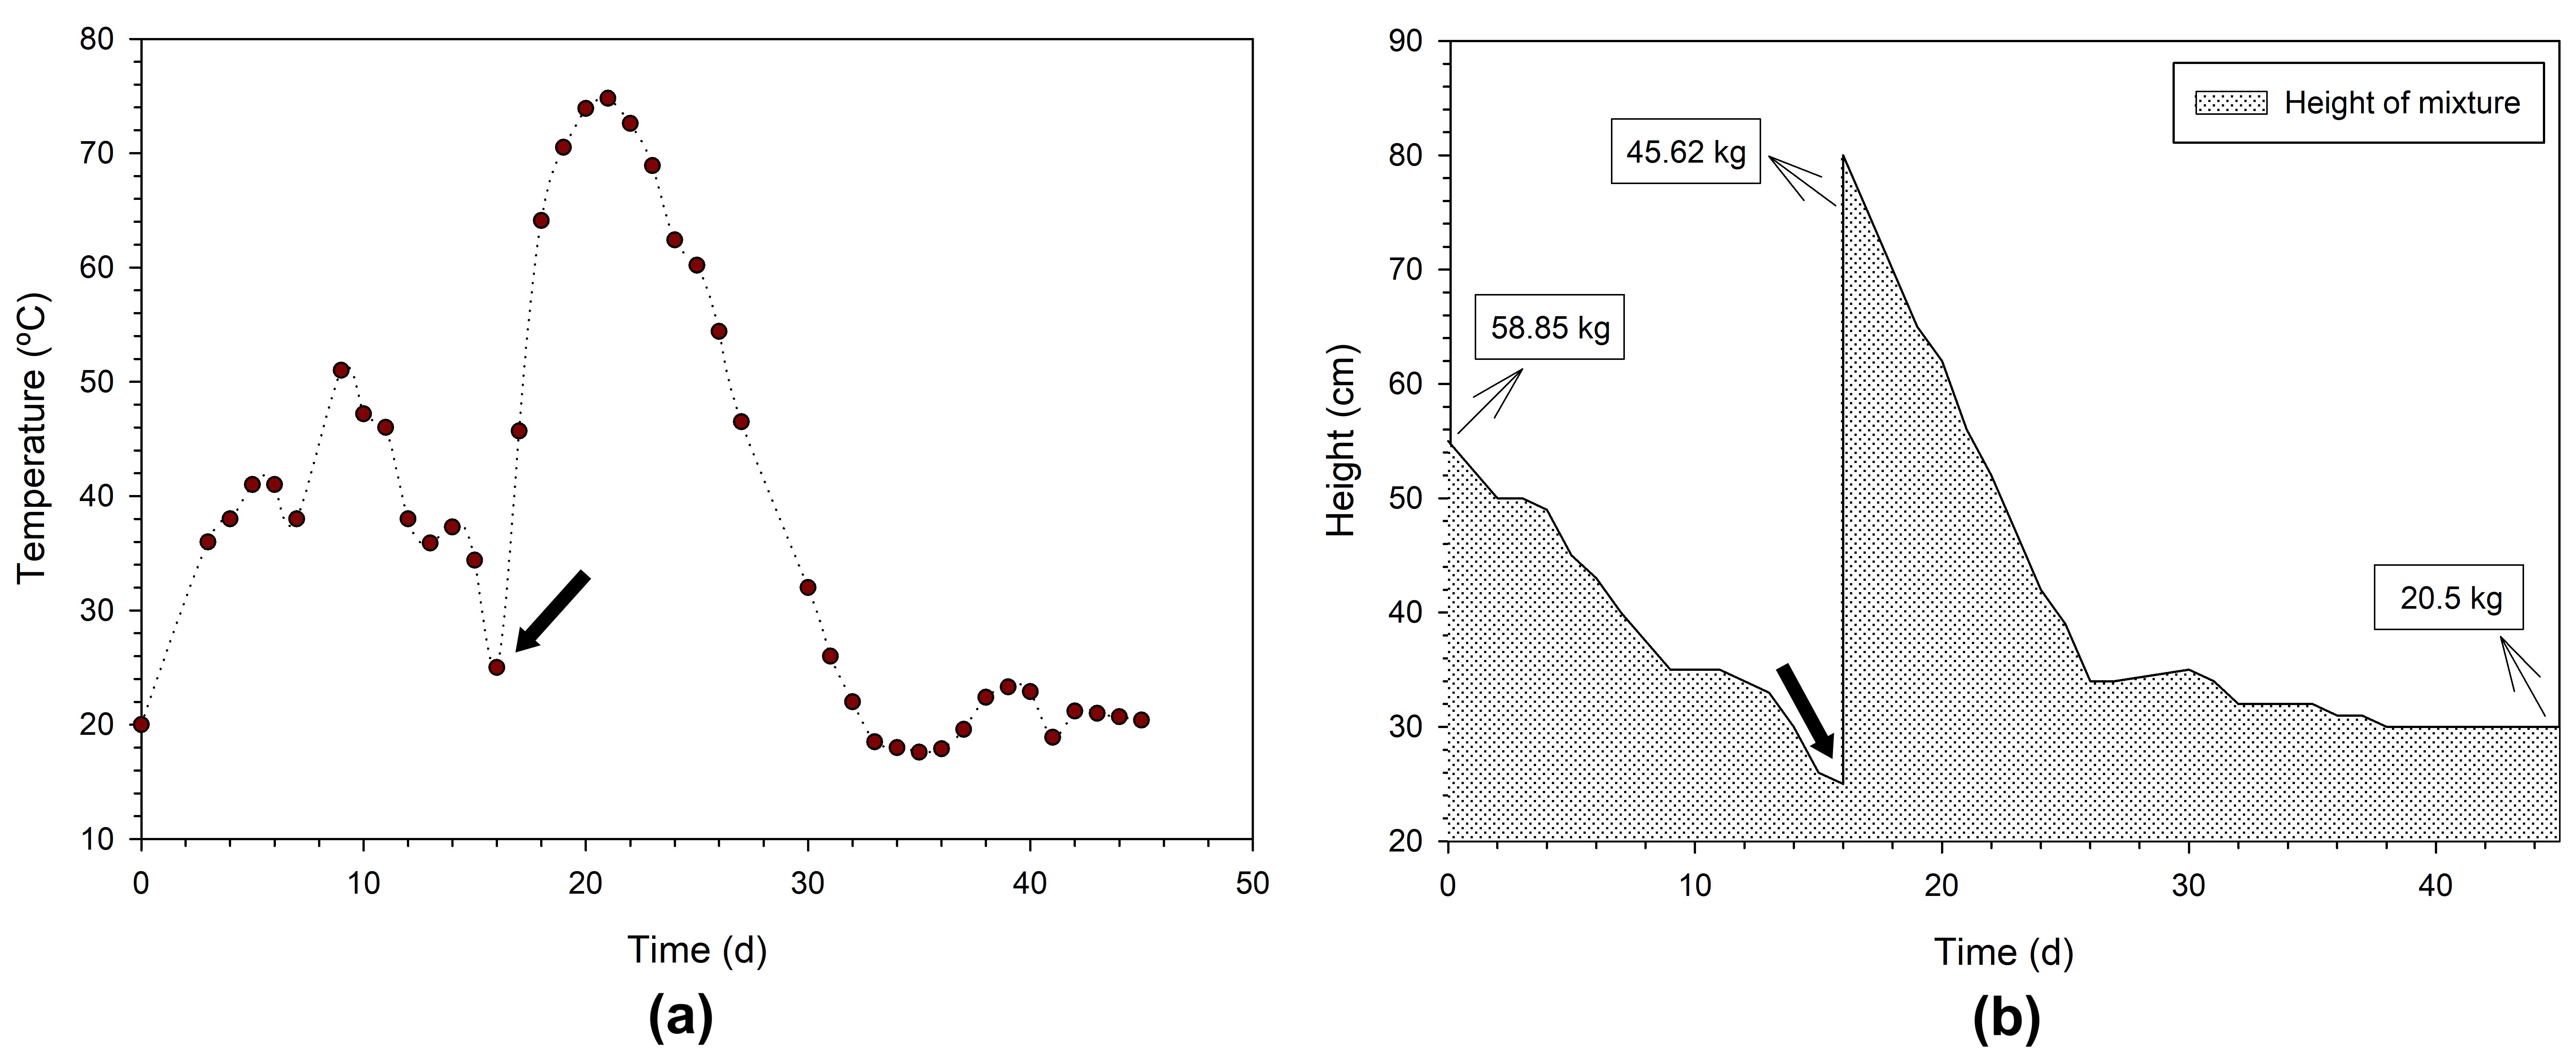
3.3. Domestic Composting
3.4. Compost Quality
4. Conclusions
Supplementary Materials
Author Contributions
Funding
Institutional Review Board Statement
Informed Consent Statement
Data Availability Statement
Acknowledgments
Conflicts of Interest
References
- Eurostat. Waste Statistics: Statistics Explained. 2023. Available online: https://ec.europa.eu/eurostat/statistics-explained/SEPDF/cache/1183.pdf (accessed on 24 October 2023).
- Triassi, M.; Simone, B.; Montuori, P.; Russo, I.; Rosa, E.; Duca, F.; Crivaro, C.; Cerullo, V.; Pontillo, P.; Díez, S. Determination of Residual Municipal Solid Waste Composition from Rural and Urban Areas: A Step toward the Optimization of a Waste Management System for Efficient Material Recovery. Sustainability 2023, 15, 13378. [Google Scholar] [CrossRef]
- Interreg Europe. The Biowaste Management Challenge: A Policy Brief from the Policy Learning Platform on Environment and Resource Efficiency. 2021. Interreg Europe Report. Available online: https://www.interregeurope.eu/sites/default/files/2022-04/Biowaste%20challenge.pdf (accessed on 19 October 2023).
- Wanderley, T.; McQuibban, J.; Mörsen, T. Como Fazer uma Melhor Recolha de Biorresíduos. 2022. Zero Waste Europe Report. Available online: https://zerowastecities.eu/wp-content/uploads/2022/11/Biowaste-Guide_PT.pdf (accessed on 25 October 2023).
- Jones, P.; Wynn, M.; Hillier, D.; Comfort, D. The Sustainable Development Goals and Information and Communication Technologies. Indones. J. Sustain. Account. Manag. 2017, 1, 1–15. [Google Scholar] [CrossRef]
- GAIA. Zero Waste to Zero Emissions—How Reducing Waste Is a Climate Gamechanger. 2022. GAIA Report. Available online: https://www.no-burn.org/resources/zero-waste-to-zero-emissions-how-reducing-waste-is-a-climate-gamechanger/ (accessed on 18 October 2023).
- Confalonieri, A. ECN Position Paper ECN Position Paper on the Role of Organic Waste derived Soil Improvers and Organic Fertilizers within Carbon Farming Initiative. 2022. Available online: https://www.compostnetwork.info/download/the-role-of-organic-waste-derived-soil-improvers-and-organic-fertilizers-within-carbon-farming-initiative/ (accessed on 20 October 2023).
- EEA. Bio-Waste in Europe—Turning Challenges into Opportunities. 2020. European Environment Agency Report. Available online: https://www.eea.europa.eu/publications/bio-waste-in-europe (accessed on 19 October 2023).
- CML. Guia Prático de Compostagem. 2018. Câmara Municipal de Lisboa Report. Available online: https://lisboaacompostar.cm-lisboa.pt/pls/OKUL/r/wks_dmhu/178/files/static/v157/guia_lc.pdf (accessed on 26 October 2023).
- Chattopadhyay, S.; Singha, R. Bio-Waste: An Introduction to its Management. Agric. Food E-Newsl. 2022, 4, 379–381. Available online: https://www.researchgate.net/publication/365210713 (accessed on 19 October 2023).
- Wesseler, J. The EU’s farm-to-fork strategy: An assessment from the perspective of agricultural economics. Appl. Econ. Perspect. Policy 2022, 44, 1826–1843. [Google Scholar] [CrossRef]
- EC. Farm to Fork Strategy: For a Fair, Healthy and Environmentally-Friendly Food System. 2020. European Commission Report. Available online: https://food.ec.europa.eu/system/files/2020-05/f2f_action-plan_2020_strategy-info_en.pdf (accessed on 19 October 2023).
- Bhatia, S.K.; Otari, S.V.; Jeon, J.M.; Gurav, R.; Choi, Y.K.; Bhatia, R.K.; Pugazhendhi, A.; Kumar, V.; Rajesh Banu, J.; Yoon, J.J.; et al. Biowaste-to-bioplastic (polyhydroxyalkanoates): Conversion technologies, strategies, challenges, and perspective. Bioresour Technol. 2021, 326, 124733. [Google Scholar] [CrossRef] [PubMed]
- Pavlas, M.; Dvořáček, J.; Pitschke, T.; Peche, R. Biowaste Treatment and Waste-to-Energy—Environmental Benefits. Energies 2020, 13, 1994. [Google Scholar] [CrossRef]
- Arancon, R.A.D.; Lin, C.S.K.; Chan, K.M.; Kwan, T.H.; Luque, R. Advances on waste valorization: New horizons for a more sustainable society. Energy Sci. Eng. 2013, 1, 53–71. [Google Scholar] [CrossRef]
- Roy, P.; Mohanty, A.K.; Dick, P.; Misra, M. A review on the challenges and choices for food waste valorization: Environmental and economic impacts. ACS Environ. Au 2023, 3, 58–75. [Google Scholar] [CrossRef] [PubMed]
- Li, J.; Li, W.; Wang, L.; Jin, B. Environmental and Cost Impacts of Food Waste in University Canteen from a Life Cycle Perspective. Energies 2021, 14, 5907. [Google Scholar] [CrossRef]
- Azim, K.; Soudi, B.; Boukhari, S.; Perissol, C.; Roussos, S.; Thami Alami, I. Composting parameters and compost quality: A literature review. Org. Agric. 2018, 8, 141–158. [Google Scholar] [CrossRef]
- Soares, M.A.R.; Quina, M.J.; Quinta-Ferreira, R. Prediction of free air space in initial composting mixtures by a statistical design approach. J. Environ. Manag. 2013, 128, 75–82. [Google Scholar] [CrossRef] [PubMed]
- Soares, M.A.R.; Andrade, S.R.; Martins, R.C.; Quina, M.J.; Quinta-Ferreira, R.M. Organic biowastes blend selection for composting industrial eggshell by-product: Experimental and statistical mixture design. Water Sci. Technol. 2012, 65, 1939–1945. [Google Scholar] [CrossRef] [PubMed]
- Lin, C.; Cheruiyot, N.K.; Bui, X.T.; Ngo, H.H. Composting and its application in bioremediation of organic contaminants. Bioengineered 2022, 13, 1073–1089. [Google Scholar] [CrossRef] [PubMed]
- Kopaei, H.R.; Nooripoor, M.; Karami, A.; Petrescu-Mag, R.M.; Petrescu, D.C. Drivers of residents’ home composting intention: Integrating the theory of planned behavior, the norm activation model, and the moderating role of composting knowledge. Sustainability 2021, 13, 6826. [Google Scholar] [CrossRef]
- Quina, M.J.; Soares, M.A.R.; Ribeiro, A.A.; Marques, A.P.; Costa, I.H.; Magalhães, M.C. Feasibility study on windrow co-composting to recycle industrial eggshell waste. Waste Biomass Valorization 2014, 5, 87–95. [Google Scholar] [CrossRef]
- Kranz, C.N.; McLaughlin, R.A.; Johnson, A.; Miller, G.; Heitman, J.L. The effects of compost incorporation on soil physical properties in urban soils—A concise review. J. Environ. Manag. 2020, 261, 110209. [Google Scholar] [CrossRef] [PubMed]
- Cahyono, P.; Loekito, S.; Wiharso, D.; Rahmat, A.; Nishimura, N.; Senge, M. Effects of compost on soil properties and yield of pineapple (Ananas comusus L. Merr.) on red acid soil, Lampung, Indonesia. Int. J. GEOMATE 2020, 19, 33–39. [Google Scholar] [CrossRef]
- Barrena, R.; Sánchez, A. Home Composting: A Review of Scientific Advances. Eng. Proc. 2022, 19, 35. [Google Scholar] [CrossRef]
- Soares, M.A.R.; Quina, M.M.J.; Quinta-Ferreira, R.M. Co-composting of eggshell waste in self-heating reactors: Monitoring and end product quality. Bioresour. Technol. 2013, 148, 293–301. [Google Scholar] [CrossRef] [PubMed]
- Soares, M.R.; Quina, M.J.; Quinta-Ferreira, R. Influence of N-rich material in valorization of industrial eggshell by co-composting. Environ. Technol. 2016, 37, 2773–2785. [Google Scholar] [CrossRef] [PubMed]
- Torrijos, V.; Calvo Dopico, D.; Soto, M. Integration of food waste composting and vegetable gardens in a university campus. J. Clean. Prod. 2021, 315, 128175. [Google Scholar] [CrossRef]
- Tatàno, F.; Pagliaro, G.; Giovanni, P.; Floriani, E.; Mangani, F. Biowaste home composting: Experimental process monitoring and quality control. Waste Manag. 2015, 38, 72–85. [Google Scholar] [CrossRef] [PubMed]
- Soares, M.A.R.; Quina, M.J.; Reis, M.S.; Quinta-Ferreira, R. Assessment of co-composting process with high load of an inorganic industrial waste. Waste Manag. 2017, 59, 80–89. [Google Scholar] [CrossRef] [PubMed]
- Lakhdar, A.; Scelza, R.; Scotti, R.; Rao, M.A.; Jedidi, N.; Gianfreda, L.; Abdelly, C. The effect of compost and sewage sludge on soil biologic activities in salt affected soil. Rev. Cienc. Suelo Nutr. Veg. 2010, 10, 40–47. [Google Scholar] [CrossRef]
- Santos, A.F.; Alvarenga, P.; Gando-Ferreira, L.M.; Quina, M.J. Agronomic valorization of sewage sludge: The potential of thermal drying to achieve sanitation and biological stability. Sustain. Chem. Pharm. 2022, 27, 100646. [Google Scholar] [CrossRef]
- Trautmann, N.M.; Krasny, M.E. Composting in the Classroom: Scientific Inquiry for High School Students. 1997. Available online: https://www.researchgate.net/publication/237413430 (accessed on 11 October 2023).
- Batista, J.G.F.; Batista, E.R.B. Compostagem—Utilização de Compostos em Horticultura; Universidade dos Açores: Angra do Heroísmo, Açores, 2017; p. 252. [Google Scholar]
- Rodrigues, M.S.; Silva, F.C.; Barreira, L.P.; Kovacs, A. Compostagem: Reciclagem de resíduos sólidos orgânicos. In Gestão de Resíduos na Agricultura e Agroindústria; Spadotto, C.A., Ribeiro, W., Eds.; FEPAF: Botucatu, Brazil, 2006; pp. 63–94. [Google Scholar]
- Nakasaki, K.; Ohtaki, A.; Takano, H. Biodegradable plastic reduces ammonia emission during composting. Polym. Degrad. Stab. 2000, 70, 185–188. [Google Scholar] [CrossRef]
- Azis, F.A.; Choo, M.; Suhaimi, H.; Abas, P.E. The Effect of Initial Carbon to Nitrogen Ratio on Kitchen Waste Composting Maturity. Sustainability 2023, 15, 6191. [Google Scholar] [CrossRef]
- Berticelli, R.; Decesaro, A.; Magro, F.; Colla, L.M. Compostagem como alternativa de biorremediação de áreas contaminadas. CIATEC—UPF 2016, 8, 12–28. [Google Scholar] [CrossRef]
- Neves, L.; Ferreira, V.; Oliveira, R. Co-composting cow manure with food waste: The influence of lipids content. World Acad. Sci. Eng. Technol. 2009, 58, 986–991. [Google Scholar]
- Parihar, P.; Sharma, S. Composting: A Better Alternative of Chemical Fertilizer. IOP Conf. Ser. Earth Environ. Sci. 2021, 795, 012038. [Google Scholar] [CrossRef]
- Tiquia, S.M. Microbiological parameters as indicators of compost maturity. J. Appl. Microbiol. 2005, 99, 816–828. [Google Scholar] [CrossRef] [PubMed]
- Puyuelo, B.; Gea, T.; Sánchez, A. A new control strategy for the composting process based on the oxygen uptake rate. Chem. Eng. J. 2010, 165, 161–169. [Google Scholar] [CrossRef]
- Ho, T.T.K.; Tra, V.T.; Le, T.H.; Nguyen, N.K.Q.; Tran, C.S.; Nguyen, P.T.; Vo, T.D.H.; Thai, V.N.; Bui, X.T. Compost to improve sustainable soil cultivation and crop productivity. Case Stud. Chem. Environ. Eng. 2022, 6, 100211. [Google Scholar] [CrossRef]
- Szanto, G.L.; Hamelers, H.V.M.; Rulkens, W.H.; Veeken, A.H.M. NH3, N2O and CH4 emissions during passively aerated composting of straw-rich pig manure. Bioresour. Technol. 2007, 98, 2659–2670. [Google Scholar] [CrossRef] [PubMed]
- Gea, T.; Barrena, R.; Artola, A.; Sánchez, A. Monitoring the biological activity of the composting process: Oxygen uptake rate (OUR), respirometric index (RI), and respiratory quotient (RQ). Biotechnol. Bioeng. 2004, 88, 520–527. [Google Scholar] [CrossRef]
- Jiménez, E.I.; Garcia, V.P. Evaluation of City Refuse Compost Maturity: A Review. Biol. Wastes 1989, 27, 115–142. [Google Scholar] [CrossRef]
- Irvan; Husaini, T.; Trisakti, B.; Batubara, F.; Daimon, H. Composting of empty fruit bunches in the tower composter—Effect of air intake holes. IOP Conf. Ser. Mater. Sci. Eng. 2018, 309, 012066. [Google Scholar] [CrossRef]
- Amery, F.; Vandaele, E.; Körner, I.; Loades, K.; Viaene, J.; Vandecasteele, B.; Willekens, K. SOILCOM Report Number 5.1. Compost Quality Indicators. 2020, pp. 1–23. Available online: https://northsearegion.eu/media/15220/soilcom-report-1-compost-quality-indicators.pdf (accessed on 5 November 2023).
- Nolan, T.; Troy, S.M.; Healy, M.G.; Kwapinski, W.; Leahy, J.J.; Lawlor, P.G. Characterization of compost produced from separated pig manure and a variety of bulking agents at low initial C/N ratios. Bioresour. Technol. 2011, 102, 7131–7138. [Google Scholar] [CrossRef]


| Materials | |||
|---|---|---|---|
| Parameter | CFW | DFW | OWC |
| MC (%) | 92.93 ± 0.29 | 94.16 ± 0.58 | 37.97 ± 0.71 |
| OM (%TS) | 89.01 ± 0.14 | 90.27 ± 0.74 | 95.84 ± 0.21 |
| pH | 4.29 ± 0.00 | 4.70 ±0.02 | 5.54 ± 0.03 |
| EC (mS/cm) | 6.56 ± 0.27 | 6.56 ± 0.20 | 0.98 ± 0.03 |
| C (%TS) | 45.00 ± 0.21 | 45.15 ± 0.46 | 47.96 ± 0.13 |
| N (%TS) | 2.50 ± 0.05 | 2.56 ± 0.04 | 1.45 ± 0.10 |
| C/N ratio | 18.0 ± 0.7 | 17.6 ±0.6 | 33.1 ± 0.7 |
| Reactors | CFW (wt. %) | OWC (wt. %) | CFW Mass (kg) | OWC Mass (kg) | Total Mass in SHR (kg) |
|---|---|---|---|---|---|
| LR1 | 40 | 60 | 11.08 | 16.62 | 27.7 |
| LR2 | 60 | 40 | 17.82 | 11.88 | 29.7 |
| LR3 | 60 | 40 | 17.76 | 11.84 | 29.6 |
| LR4 | 100 | 0 | 47.71 | 0.00 | 47.7 |
| GI (%) | Classification of the Material |
|---|---|
| >100 | The material promotes plant germination and root growth |
| 80–100 | Non-phytotoxic, mature compost |
| 60–80 | Moderately phytotoxic |
| 30–60 | Phytotoxic |
| <30 | Very phytotoxic |
| Parameters | LR1 | LR2 and LR3 | LR4 | DR |
|---|---|---|---|---|
| MC (%) | 65.42 ± 2.43 | 72.53 ± 4.74 | 92.93 ± 0.29 | 68.29 ± 2.23 |
| OM (%TS) | 92.79 ± 0.60 | 92.21 ± 0.93 | 89.01 ± 0.14 | 92.51 ± 0.23 |
| pH | 5.31 ± 0.03 | 5.29 ± 0.04 | 4.29 ± 0.01 | 5.61 ± 0.04 |
| EC (mS/cm) | 2.39 ± 0.18 | 2.94 ± 0.57 | 6.56 ± 0.27 | 3.49 ± 0.90 |
| C (%TS) | 48.35 ± 0.14 | 43.59 ± 0.19 | 45.00 ± 0.21 | 44.41 ± 0.65 |
| N (%TS) | 2.04 ± 0.07 | 1.93 ± 0.07 | 2.50 ± 0.05 | 2.28 ± 0.02 |
| C/N ratio | 23.7 ± 0.8 | 22.6 ± 0.9 | 18.0 ±0.7 | 19.5 ± 0.46 |
| Parameters | Values Obtained | Limit | |||
|---|---|---|---|---|---|
| LC1 | LC2 | LC3 | DC | ||
| MC (%) | 32.60 ± 1.56 | 38.45 ± 3.75 | 36.50 ± 2.99 | 27.60 ± 1.20 | <40 |
| OM (%TS) | 90.50 ± 0.63 | 84.48 ± 1.93 | 86.20 ± 0.85 | 86.40 ± 0.32 | >30 |
| pH | 8.13 ± 0.03 | 8.50 ± 0.04 | 8.65 ±0.01 | 8.11 ± 0.04 | 5.5–9 |
| C/N ratio | 16.02 ± 0.14 | 12.45 ± 0.20 | 13.55 ± 0.40 | 10.64 ± 0.60 | <25 |
| GI (%) | 86.2 ± 7.1 | 81.9 ± 7.0 | 89.6 ± 14.2 | 90.4 ± 8.6 | >80 |
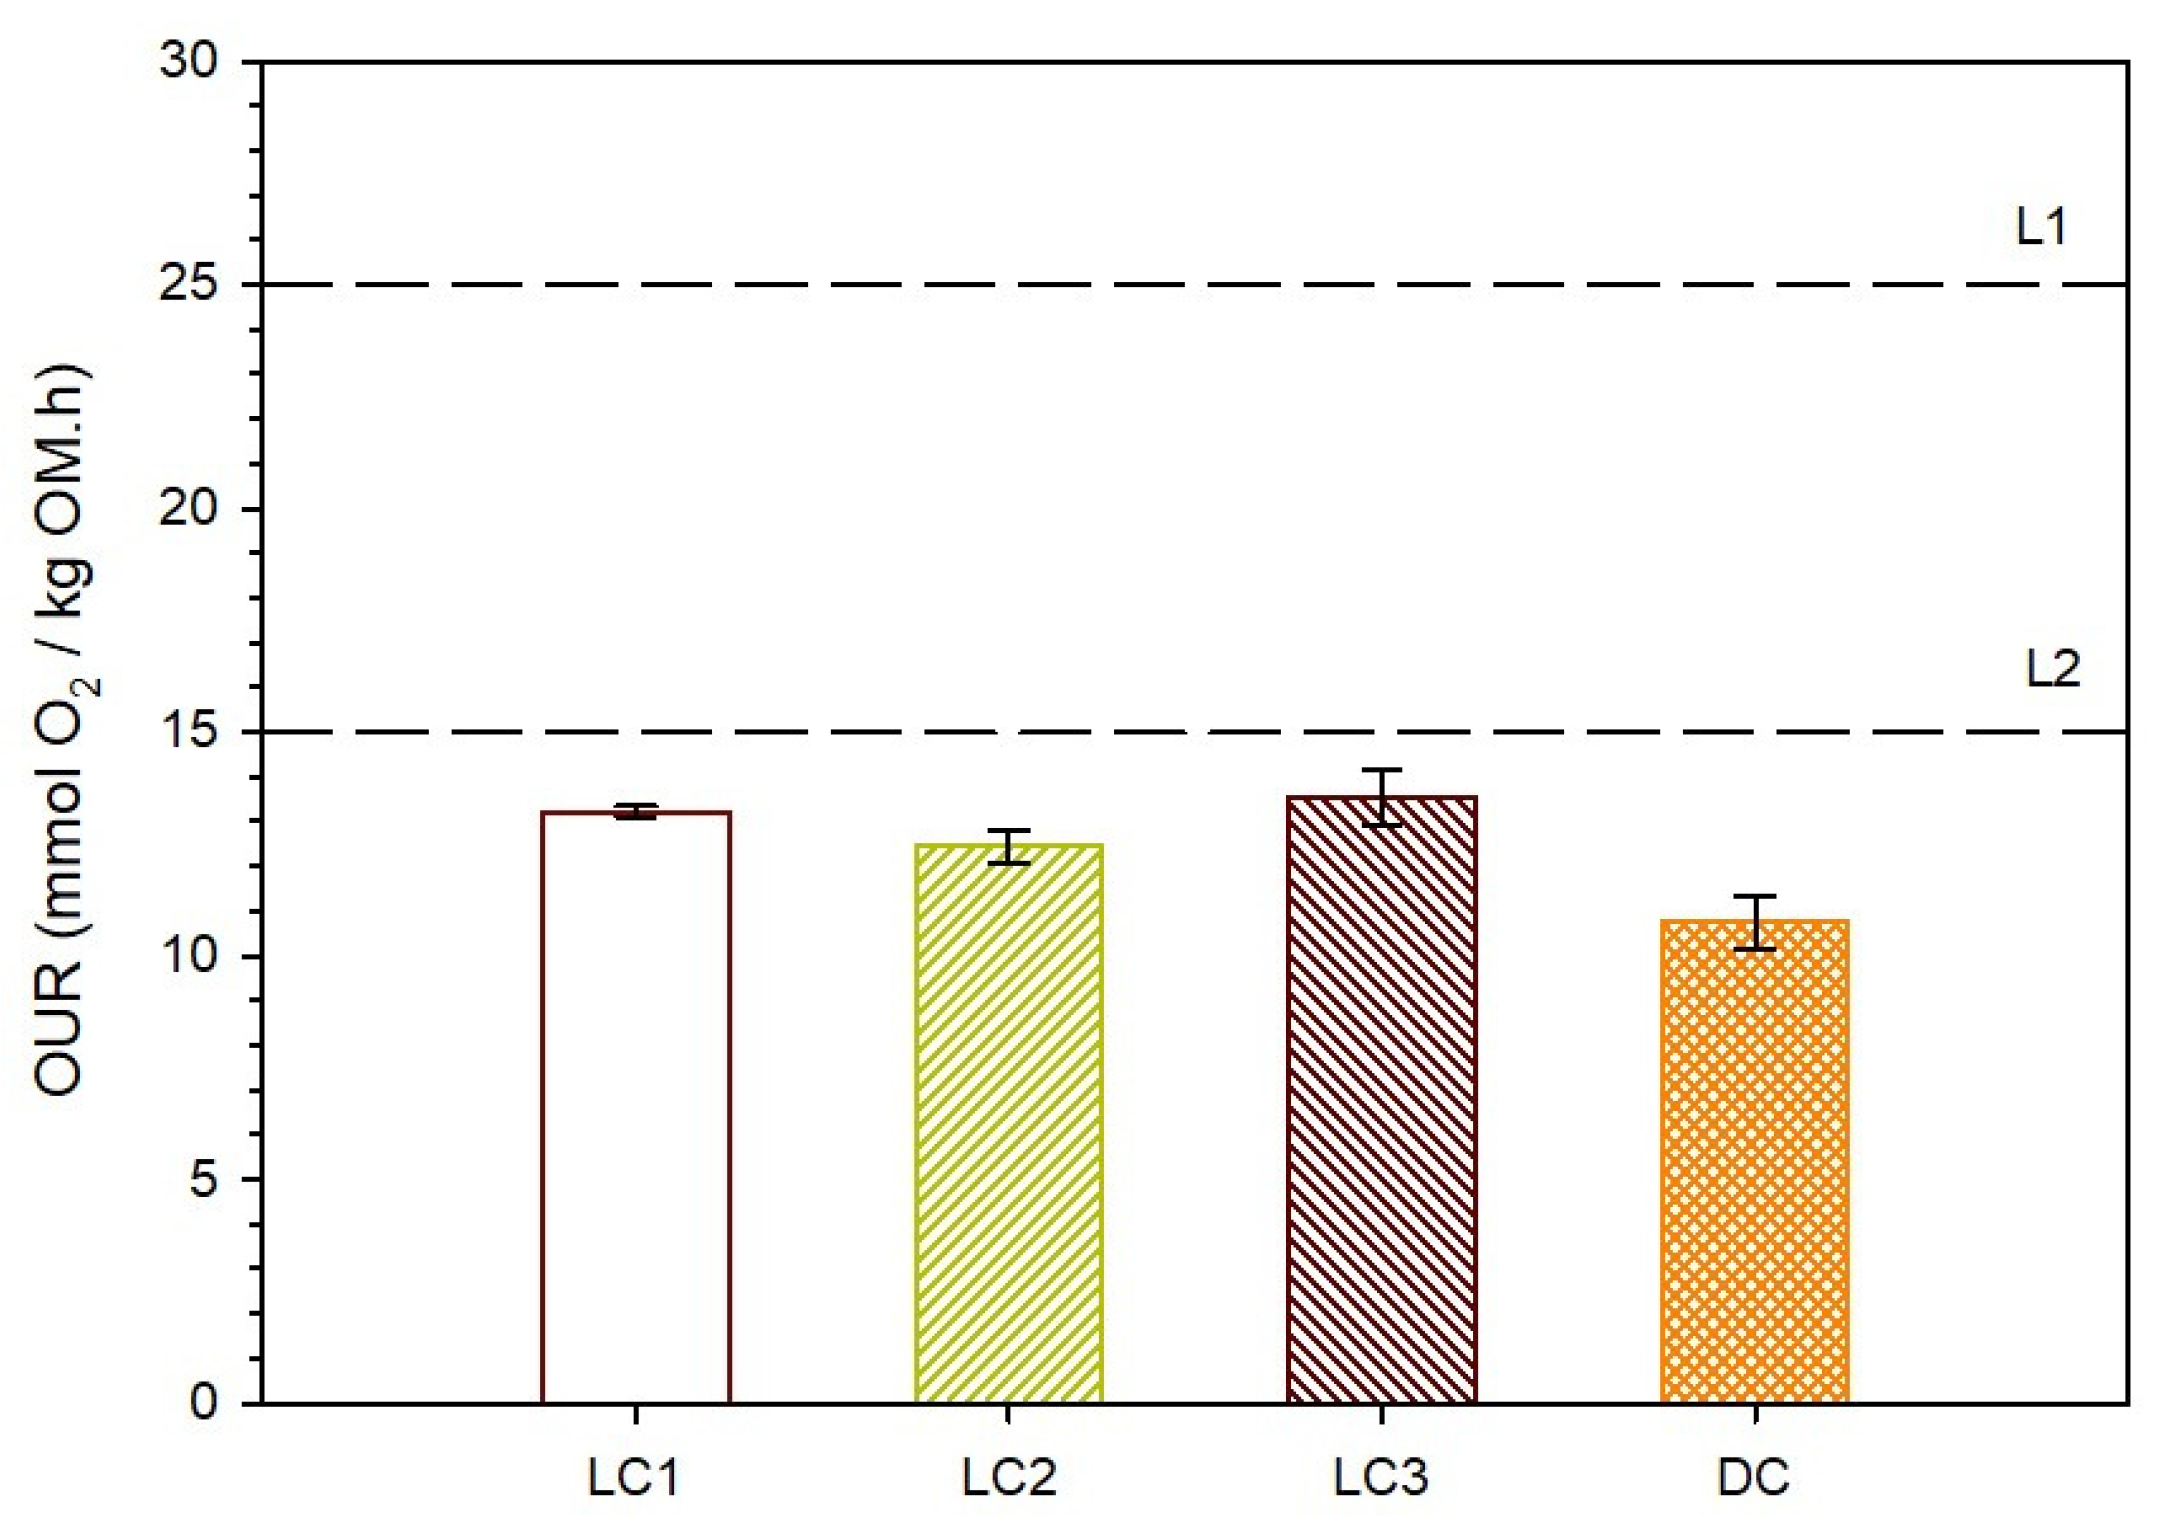
| OUR (mmolO2/kgOM.h) | 13.22 ± 0.12 | 12.44 ± 0.35 | 13.54 ±0.63 | 10.74 ± 0.60 | <25 |
| FCretained (%TS) | 71.43 | 48.80 | 57.11 | 40.45 | - |
Disclaimer/Publisher’s Note: The statements, opinions and data contained in all publications are solely those of the individual author(s) and contributor(s) and not of MDPI and/or the editor(s). MDPI and/or the editor(s) disclaim responsibility for any injury to people or property resulting from any ideas, methods, instructions or products referred to in the content. |
© 2024 by the authors. Licensee MDPI, Basel, Switzerland. This article is an open access article distributed under the terms and conditions of the Creative Commons Attribution (CC BY) license (https://creativecommons.org/licenses/by/4.0/).
Share and Cite
Baptista, C.F.T.; Rodrigues, R.P.; Quina, M.J. Composting of Biowaste Generated in University Canteens and Rural Households: Converting Waste into a Valuable Product. Sustainability 2024, 16, 4368. https://doi.org/10.3390/su16114368
Baptista CFT, Rodrigues RP, Quina MJ. Composting of Biowaste Generated in University Canteens and Rural Households: Converting Waste into a Valuable Product. Sustainability. 2024; 16(11):4368. https://doi.org/10.3390/su16114368
Chicago/Turabian StyleBaptista, Carolina F. T., Rafaela P. Rodrigues, and Margarida J. Quina. 2024. "Composting of Biowaste Generated in University Canteens and Rural Households: Converting Waste into a Valuable Product" Sustainability 16, no. 11: 4368. https://doi.org/10.3390/su16114368
APA StyleBaptista, C. F. T., Rodrigues, R. P., & Quina, M. J. (2024). Composting of Biowaste Generated in University Canteens and Rural Households: Converting Waste into a Valuable Product. Sustainability, 16(11), 4368. https://doi.org/10.3390/su16114368