1. Introduction
According to the International Energy Agency (IEA), the overall energy consumption in Africa is expected to increase by 60% between 2019 and 2040, while the demand for residential buildings has increased by 70% since 2010 [
1]. South Africa has the highest energy consumption in Sub-Saharan Africa [
1]. South Africa’s electricity generation mix is dominated by coal-fired power stations, which account for approximately 85% of the total generation capacity. The remaining 15% comprises nuclear, hydroelectric, solar, and wind power stations. This balance highlights the country’s reliance on coal for electricity generation, which has implications for sustainability and the need for accurate energy consumption forecasting. As reported by the South African Statistical Service, residential and commercial buildings constitute the largest sector of primary energy consumption [
2]. The availability of electricity has consistently served as a fundamental pillar of modern society, providing the foundation for economic growth, technological progress, and overall improvements in the quality of life [
3]. The management and provision of electricity encounter ongoing challenges, particularly in Africa, where load shedding has become a significant issue in many regions. South Africa currently faces a significant challenge in the form of recurring load shedding. This crisis has a detrimental impact on residential buildings, causing disruptions to daily routines and prompting concerns regarding the long-term viability of energy supply. In this context, the importance of accurate energy consumption forecasting cannot be overstated. This holds significant potential for mitigating the negative effects of load shedding and facilitating well-informed decision-making.
Load shedding in South Africa is a multifaceted issue that goes beyond interruptions to the electricity supply. It encompasses economic ramifications [
4], security concerns [
5], and the potential for a total loss of livelihood in any small- and medium-scale businesses affected [
6]. According to [
4], load shedding is expected to have a greater impact on economic growth (2.3%) than that initially predicted by banks (0.6%). Therefore, innovative approaches are needed to ensure the resilience of residential buildings as consumers and businesses navigate the uncertainty of electricity access. Electricity consumption forecasting, supported by advanced machine learning models, presents a promising approach for enhancing the ability of individuals and institutions to accurately predict energy consumption.
Although there has been an increase in interest in using machine learning to reduce energy consumption in residential buildings over the past few years, there are still a number of difficulties associated with its application, including the quantity and quality of the data collected (missing data, outliers, etc.), low prediction accuracy, and the choice of the machine learning model. While substantial advancements have been made, the methodologies employed exhibit a high degree of diversity, and the complexities inherent in the problems pose formidable challenges, thereby consistently capturing the attention of researchers.
This study adopts a well-established methodology for predicting the energy consumption of residential buildings in South Africa. This study aims to improve the accuracy of energy consumption predictions by adopting machine learning models such as Random Forest (RF), Decision Tree (DT), Extreme Gradient Boosting (XGBoost), and Adaptive Boosting (AdaBoost) models, which are widely used in the energy forecasting literature. These regression models have varying prediction performances and interpretability. In general, it is expected that boosted regression trees, which have high interpretability, will also perform well (high prediction accuracy).
The primary objective of this study is to bridge the divide between load shedding management and residential adaptability. This study aims to equip households, businesses, and policymakers with actionable insights to mitigate the effects of load shedding by facilitating more accurate and granular forecasts of energy consumption. This study contributes to the ongoing discourse surrounding sustainable energy management by combining advanced machine learning models with real-world energy challenges.
The remainder of this paper is organized as follows.
Section 2 presents an overview of related work on predictive machine learning models of energy consumption in residential buildings.
Section 3 presents the proposed approach, including the dataset characterization, methodological framework, machine learning models, and performance evaluation criteria.
Section 4 presents and discusses the results.
Section 5 concludes the study, with directions for future research. By revealing the potential for accurate energy consumption forecasting, this research contributes to the search for a more resilient and adaptive energy landscape in the face of complex and evolving energy challenges.
2. Related Work
Researchers have proposed different predictive machine learning models for energy consumption, and potential applications of these predictive models in optimizing energy consumption in residential buildings. For instance, Wahid et al. [
7] used Multi-Layer Perceptron (MLP) and Random Forest (RF) for the classification of residential buildings in terms of energy consumption and reported that MLP outperformed RF in terms of prediction accuracy. Priyadarshini et al. [
8] presented a machine learning-based ensemble model for predicting energy consumption in smart homes using DT, RF, and XGBoost; while the authors provided a useful contribution to the field of energy consumption prediction, they did not discuss the quality of the data.
Mhlanga [
9] highlighted the potential of Artificial Intelligence (AI) and Machine Learning (ML) to transform the energy sector in developing countries, and provided insights into the opportunities and challenges that need to be addressed to realize this potential. Bohlmann and Iglesi-Lotz [
10] investigated the energy characteristics of the South African residential sector to enable future improvements in electricity accessibility.
Cao et al. [
11] reported that buildings, whether residential or commercial, consume more energy than any other major industry, such as manufacturing or transportation. Olu-Ajayi et al. [
12] explored various ML models that could be used to forecast potential building energy consumption during the early design phase; although they found that Deep Neural Network (DNN) outperformed Artificial Neural Network (ANN), Gradient Boosting (GB), Support Vector Machine (SVM), Random Forest (RF), K-Nearest Neighbors (KNN), Decision Tree (DT), Stacking, and Logistic Regression (LR), it is time-consuming for training.
Rahman et al. [
13] proposed a machine learning-based ensemble model based on the Mahalanobis distance to predict the energy consumption of a smart home using a combination of Autoregressive Integrated Moving Average (ARIMA), Recurrent Neural Network (RNN), and multivariate and univariate linear regression models. They reported that the ensemble model performed well compared to individual prediction models. However, since the authors used data collected from a single smart home system, the generalizability of these findings to other smart home systems is limited. Moreover, the authors did not report the quality of their data. Compared to the traditional approach, which relies solely on time-series methods to forecast the maximum demand consumption trend without considering other electrical parameters [
14], machine learning models are more appropriate for developing predictive models as they can consider other electrical parameters, which leads to an improvement in the overall accuracy of the model [
15,
16].
Shapi et al. [
17] developed a predictive model for the energy consumption of a commercial building in Malaysia using SVM, ANN, and KNN. Entezari et al. [
18] conducted a comprehensive review of the AI and ML usage in the energy sector. Their findings revealed that predictive analysis and IoT have emerged as prominent trends, attracting significant interest within this domain.
Elbeltagi and Wefki [
19] developed an ANN model to improve the accuracy of energy consumption predictions during the initial design phases of residential buildings by employing parametric modeling techniques. Furthermore, they introduced an automated platform that enables the analysis, modeling, and simulation of building energy consumption with accuracy and performance.
Hosseini and Farad [
20] analyzed residential energy consumption with the objective of forecasting the various factors that influence energy usage the most in buildings, including the overall height, roof area, surface area, and relative compactness. To achieve this prediction, they employed DT, RF, and KNN. Their findings showed that RF was the best model compared with the DT and KNN models in terms of prediction accuracy.
Shi et al. [
21] explored the utilization of machine learning models in building energy management based on studies published between 1998 and 2020. They presented an integrated framework and highlighted the development trends in machine learning–building energy management, making a valuable contribution to the existing knowledge in this field. Konhäuser et al. [
22] implemented 12 machine learning models, including standalone models, as well as both homogeneous and heterogeneous ensemble learning models, with the aim of increasing the accuracy of predicting building energy consumption in the residential sector.
The authors in [
23] offered a novel deep learning approach to predict hourly energy consumption in residential buildings based on occupancy rates. Their study stands out for its detailed multi-criteria analysis and the use of synthetically generated data to train an eight-layer-deep neural network. The study achieved a high coefficient of determination and low root mean square error, indicating excellent model performance.
In contrast, the study in [
24] focused on the prediction of energy consumption across multiple buildings. This research uses machine learning to enhance energy efficiency and sustainability, implying a broader scope beyond just residential buildings. It also emphasizes the applicability of machine learning in diverse building types for improved energy practices.
Dinmohammadi et al. [
25] investigated several machine learning models for residential buildings’ energy prediction, including KNN, Neural Networks (NN), LightGBM, RF, CatBoost, XGBoost, and the Stacking model. The study found that the stacking model outperformed other models in terms of accuracy. Although the study provides valuable insights into the use of machine learning for residential buildings’ energy consumption prediction, the authors did not explore various feature selection and dimensionality reduction algorithms. Furthermore, the dataset used in the study did not contain geographical information. This could potentially affect the generalizability of the findings, as factors like climate can influence energy consumption.
Mathumitha et al. [
26] explored various deep learning methods used for predicting buildings’ energy usage and found that the DNN model performed better.
Compared to other works, this study concentrates on the predictive modeling of energy consumption in South African residential buildings using RF, DT, XGBoost, and AdaBoost models with real-world data. While the authors in [
23,
24,
25,
26] proposed different techniques for predicting the energy consumption of residential buildings, this study investigates whether or not the models we propose outperform their models in terms of prediction accuracy. This will include a detailed analysis of the performance criteria (MSE, MAE, MAPE, and R
2) and a discussion on how our findings align with or differ from previous studies. This comparison will provide a broader context for our results and will highlight the contributions of our study to the existing literature on energy consumption forecasting.
Our study contributes uniquely by leveraging various regression techniques and feature engineering, emphasizing historical patterns and temporal details like seasonal variation. We aim to determine the most effective models for predicting next-hour consumption, filling a niche in the current research landscape by applying these methods to a specific geographical region with its own set of energy challenges.
In summary, researchers have proposed several machine learning models to predict energy consumption in residential buildings. However, to the best of our knowledge, no study has proposed a predictive model of energy consumption for residential buildings in South Africa.
Table 1 presents some of the recent literature on machine learning-based predictive energy consumption, with strengths and gap analysis.
This study distinguishes itself by incorporating temporal trends within the dataset, such as features like the day of the week, hour, month, day of the year, month quarter, and year of consumption. This approach allows us to capture essential temporal details, including seasonal variations and rolling averages, which are crucial for the predictive accuracy of our ML models.
Moreover, we enhanced our machine learning models’ predictive capabilities through rigorous feature-engineering methods. This enhancement is a key differentiator of our study, as it allows our models to achieve higher accuracy in predicting residential buildings’ energy consumption compared to previous studies. Specifically, our models, particularly Random Forest (RF) and Decision Tree (DT), demonstrated exceptional accuracy, with metrics like mean squared error (MSE), mean absolute error (MAE), and mean absolute percentage error (MAPE) very close to zero. This study contributes to the ongoing discourse on sustainable energy management by leveraging advanced machine learning models to address real-world energy challenges in South Africa.
3. Proposed Approach
3.1. Dataset Characterization
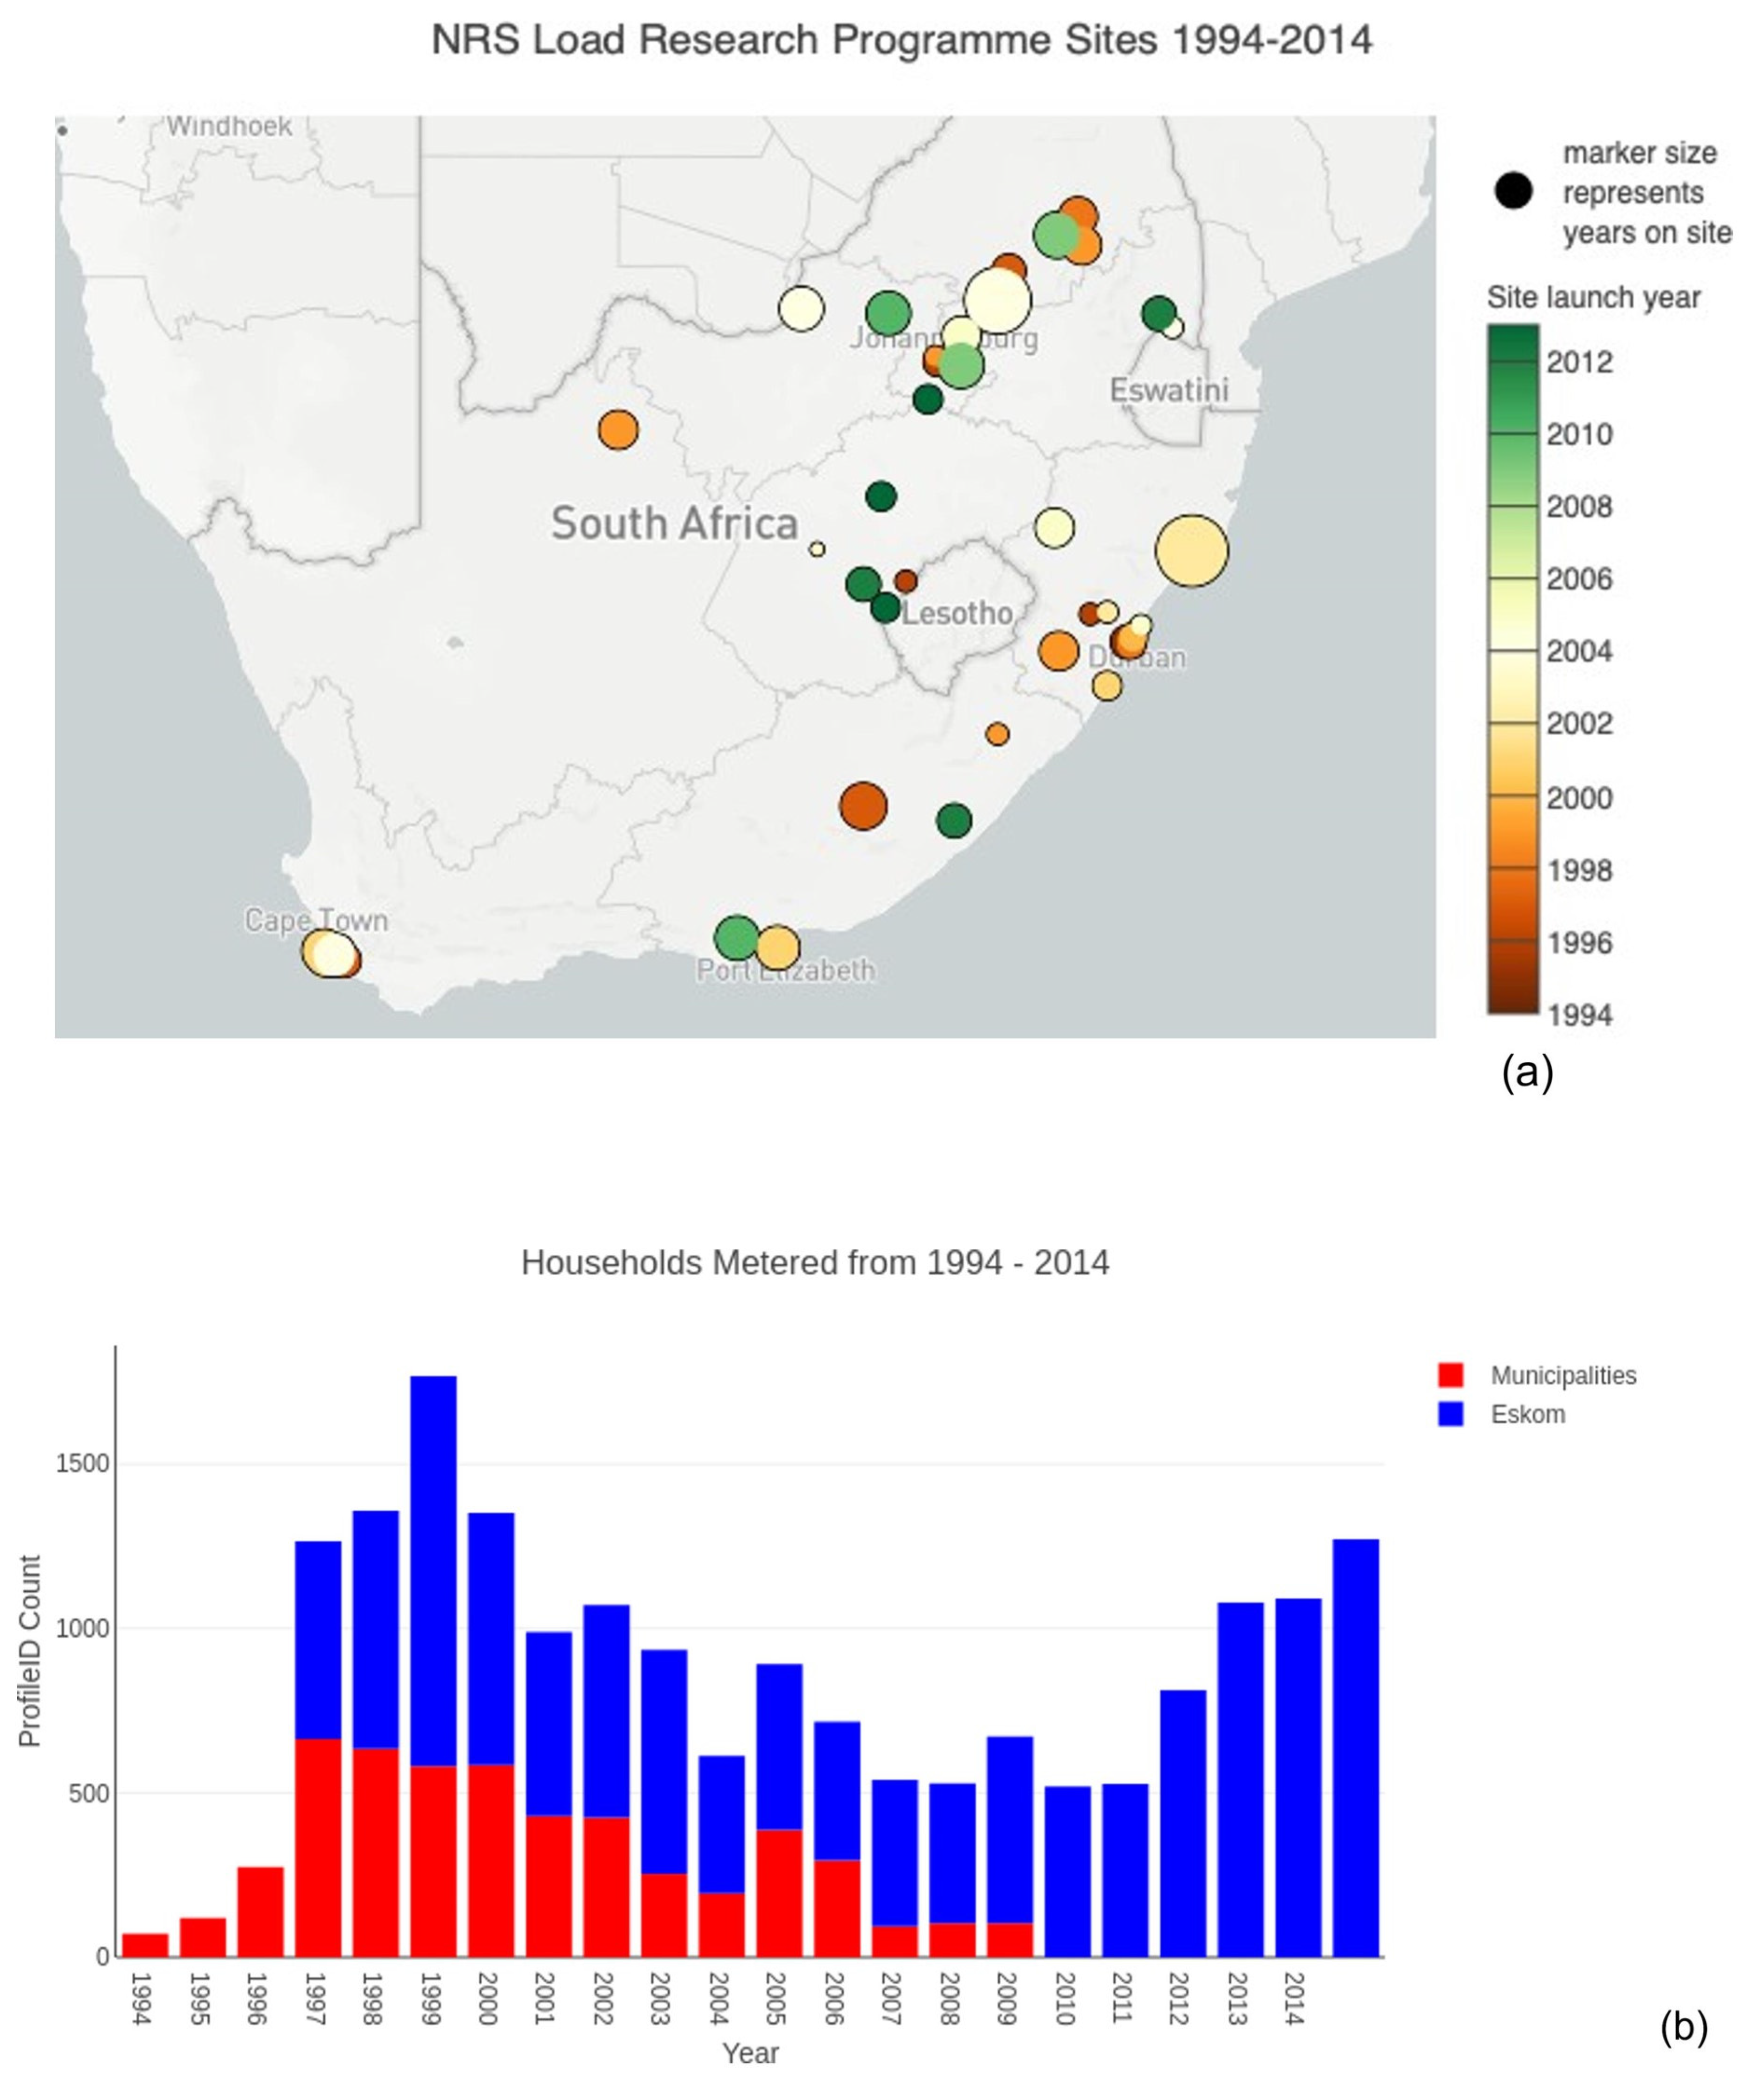
We used the Domestic Electrical Load (DEL) dataset, which is recognized as the largest and most extensive study on residential energy consumption in Africa and covers diverse geographic regions, climatic zones, income groups, and dwelling structures in South Africa and Namibia, providing a representative sample for analysis. The DEL dataset covers a diverse range of urban, informal (township), and rural environments, as well as various climatic zones and income groups. The DEL dataset was curated to ensure its representativeness and accuracy at a national level [
27,
28]. The diversity of residential buildings, environments, climatic zones, and socio-economic groups covered [
27,
28], combined with the long-term temporal coverage, make this dataset a valuable resource for understanding and modelling energy consumption patterns in South African residential buildings.
Using the DEL study dataset for South Africa [
27,
28], this study tested four different machine learning models to predict hourly consumption in residential buildings. A multi-party joint academic–public–private collaborative effort on the National Rationalised Specification (NRS) load research program, the dataset contains metered household electricity consumption data and socio-demographic survey data for a diverse sample population spanning urban, informal and rural environments, five climatic zones, a large spectrum of income groups, newly to long-term electrified households, and different dwelling structures in South Africa and Namibia [
27,
28].
During data collection and preprocessing, we encountered challenges such as missing data and outliers. These were addressed by implementing a rigorous data processing regime that removed invalid readings and missing values (approximately 11 million records were deleted). Additionally, the dataset was aggregated to hourly values, which helped in reducing noise and improving data integrity. The diverse nature of the residential buildings and energy usage patterns was accounted for by including features such as the type of dwelling, geographic location, and socio-economic status, ensuring that the model captures the variations in energy consumption accurately.
This study considers the DEL metering hourly data (where the consumption current data are aggregated to one hour), as this comprehensive 20-year dataset has undergone several validations and testing following an annual data collection cycle to ensure its reliability [
27]. The DEL dataset stands as by far the largest and longest study of residential energy consumption in Africa and provides a unique insight into energy consumption, spanning a diversity of demographic and climate zones across Southern Africa.
Figure 1 presents the map view of DEL study data collection sites and the number of households metered per year from 1994 to 2014.
The dataset is a subset of the 5 min interval electricity metering containing all current (Amps) observations aggregated to hourly values [
27]. This study focuses on hourly consumption; thus, the granularity at the 5 min interval will not necessarily be relevant. Furthermore, rather than considering the whole dataset, only data from 2004 to 2014 were extracted because in May 2004, the president of the Fédération Internationale de Football Association (FIFA) announced that South Africa would host the 2010 men’s football world cup. This sparked economic interest in South Africa, which led to an increase in demand for electricity across the country. This increase in demand did not match the supply from the national grid. The timeframe was chosen because it represents a period of significant economic activity in South Africa, including the preparation and hosting of the 2010 FIFA World Cup. This period also includes substantial variations in electricity demand and supply, making it ideal for developing and testing predictive models. Whereas no newer data are currently available, the chosen period provides a comprehensive dataset for robust analysis and model validation.
3.2. Methodological Framework
The aggregation of the dataset followed a well-structured data processing regime to remove all invalid readings and missing values [
27,
28]. Furthermore, the aggregation model outlined in [
27] provided various column fields in the dataset that ensured the consistency of the converted integer and decimal temporal and observation values. Missing row values were removed. For example, when dealing with invalid readings, 0 and 1 represent invalid and valid data, respectively. The mean valid values are set to 0 unless it 1 was in the aggregation regime (i.e., if at least one reading in an hour was marked as invalid, the mean valid value would be less than 1, and the validity for that hour would thus be marked as invalid) [
27]. We considered converting the current reading (A) to energy values using the formula
, which provides an approximate energy consumption and not an actual measured value.
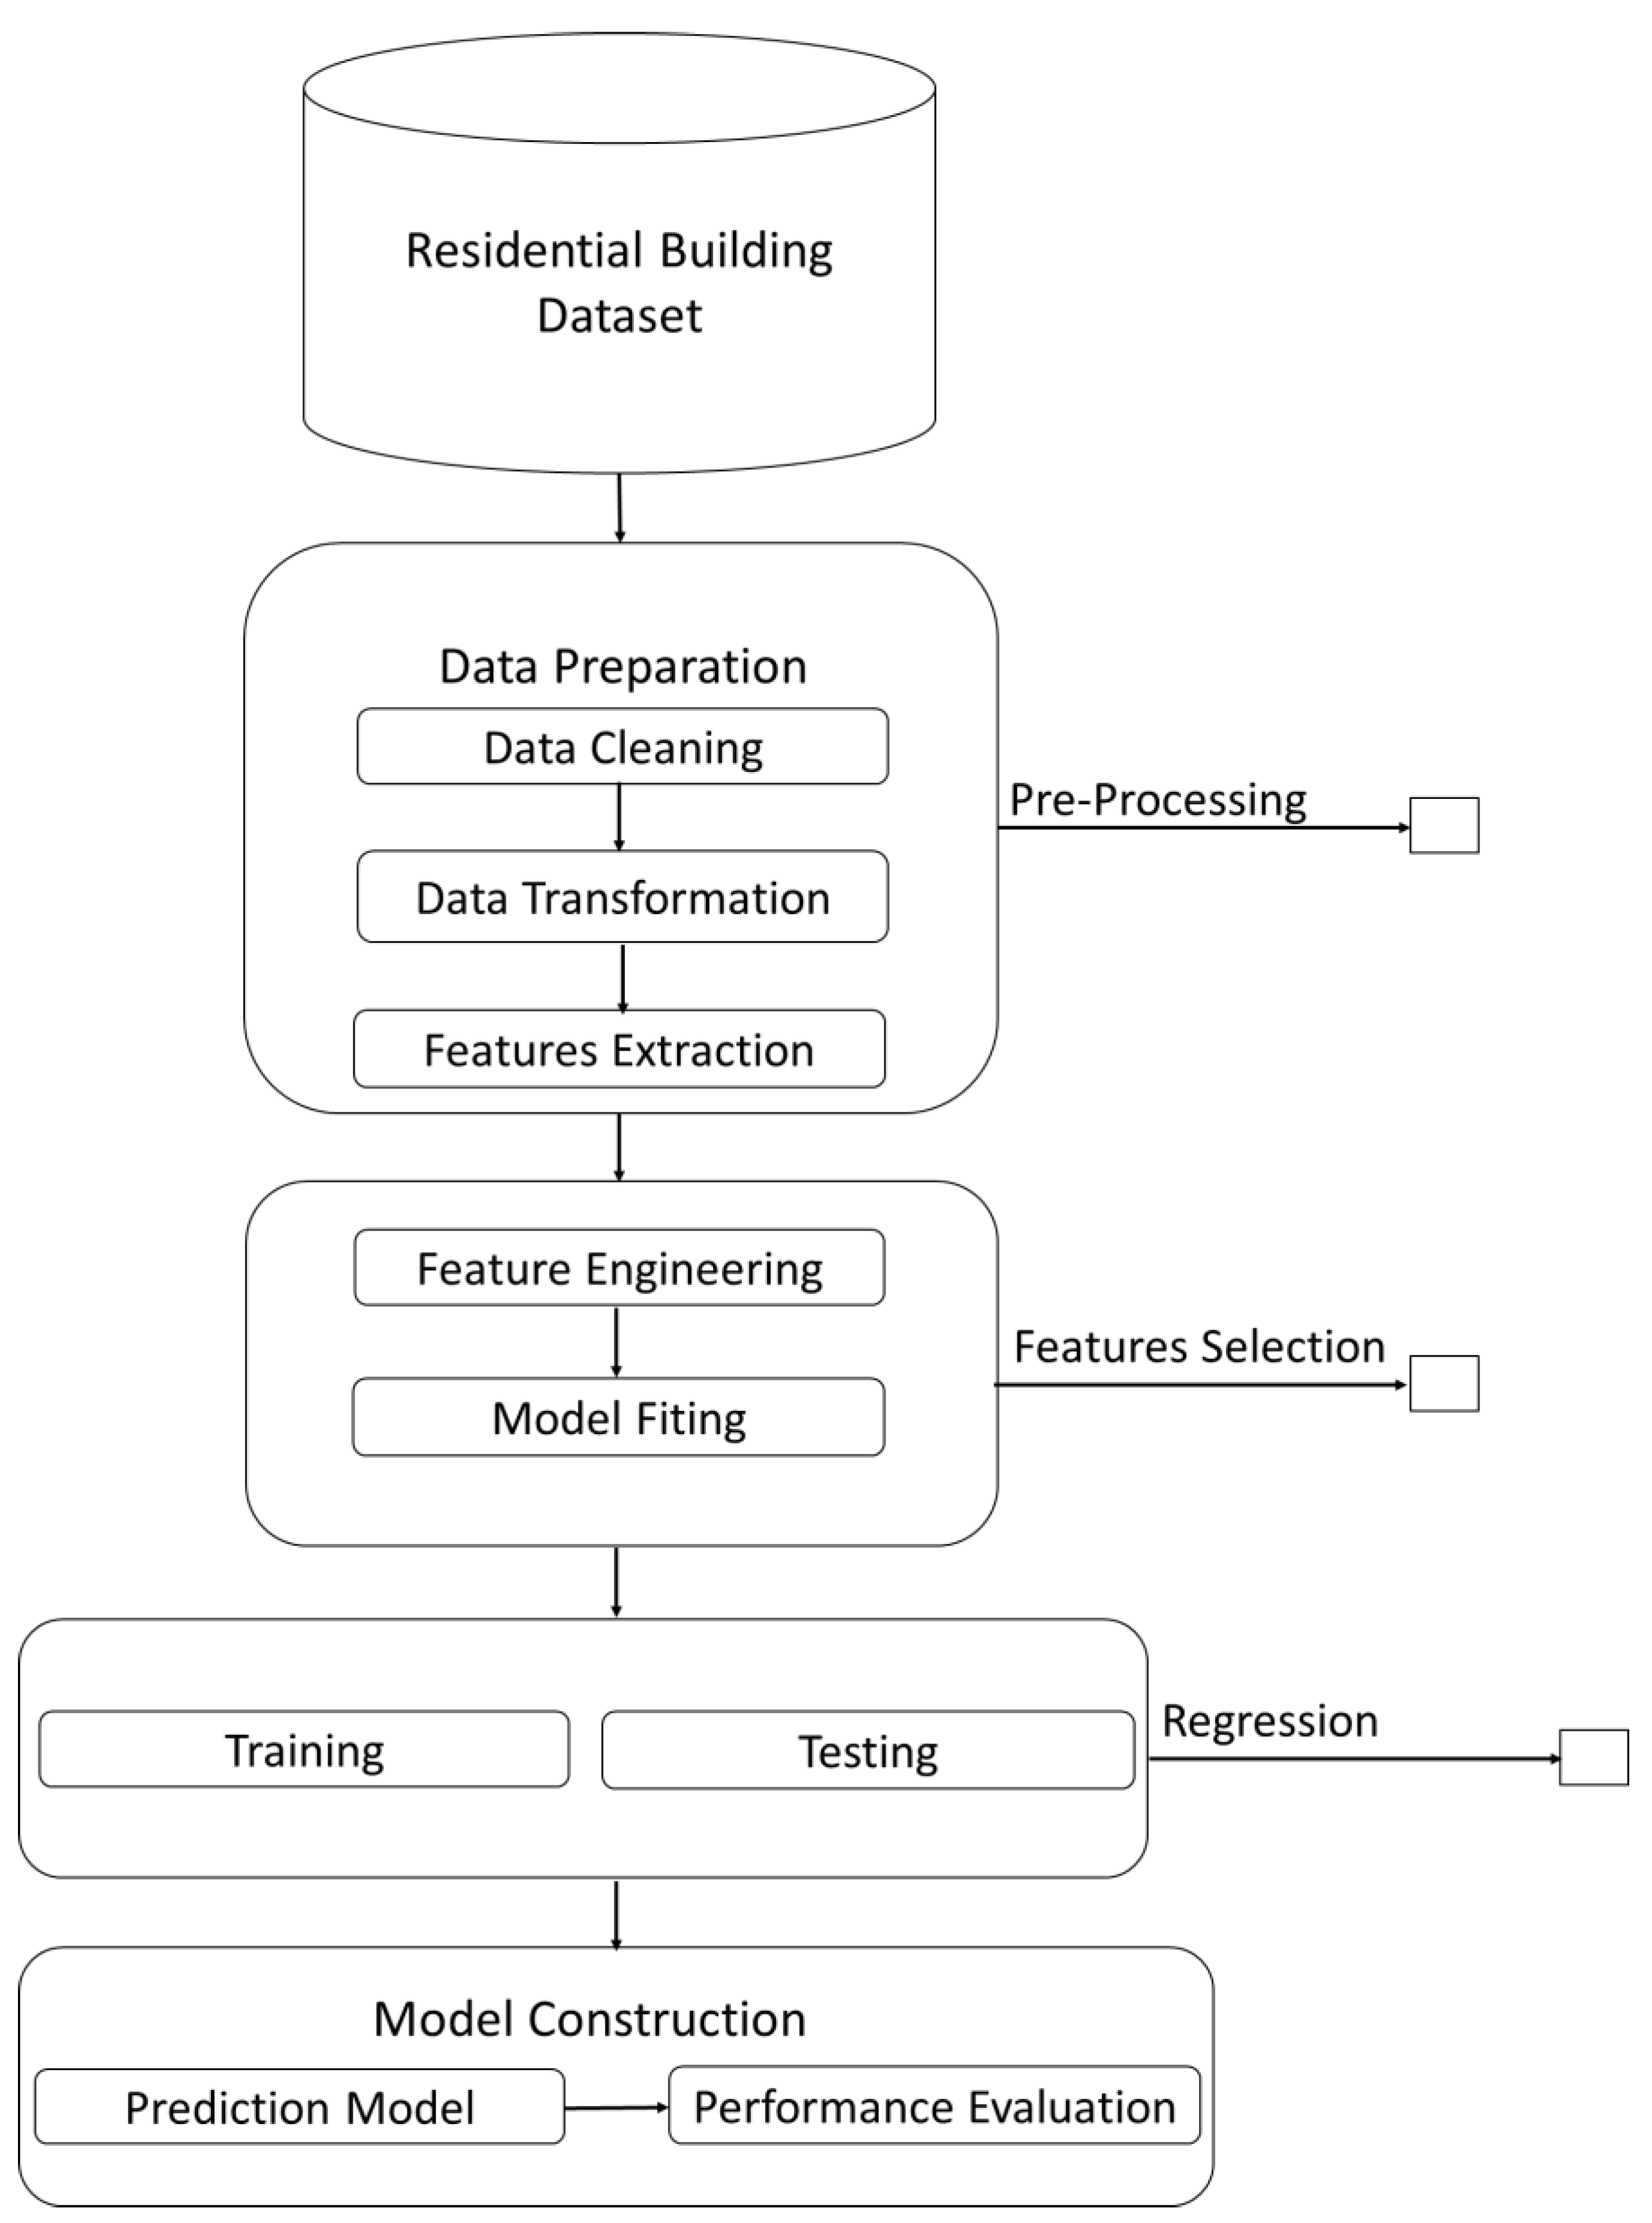
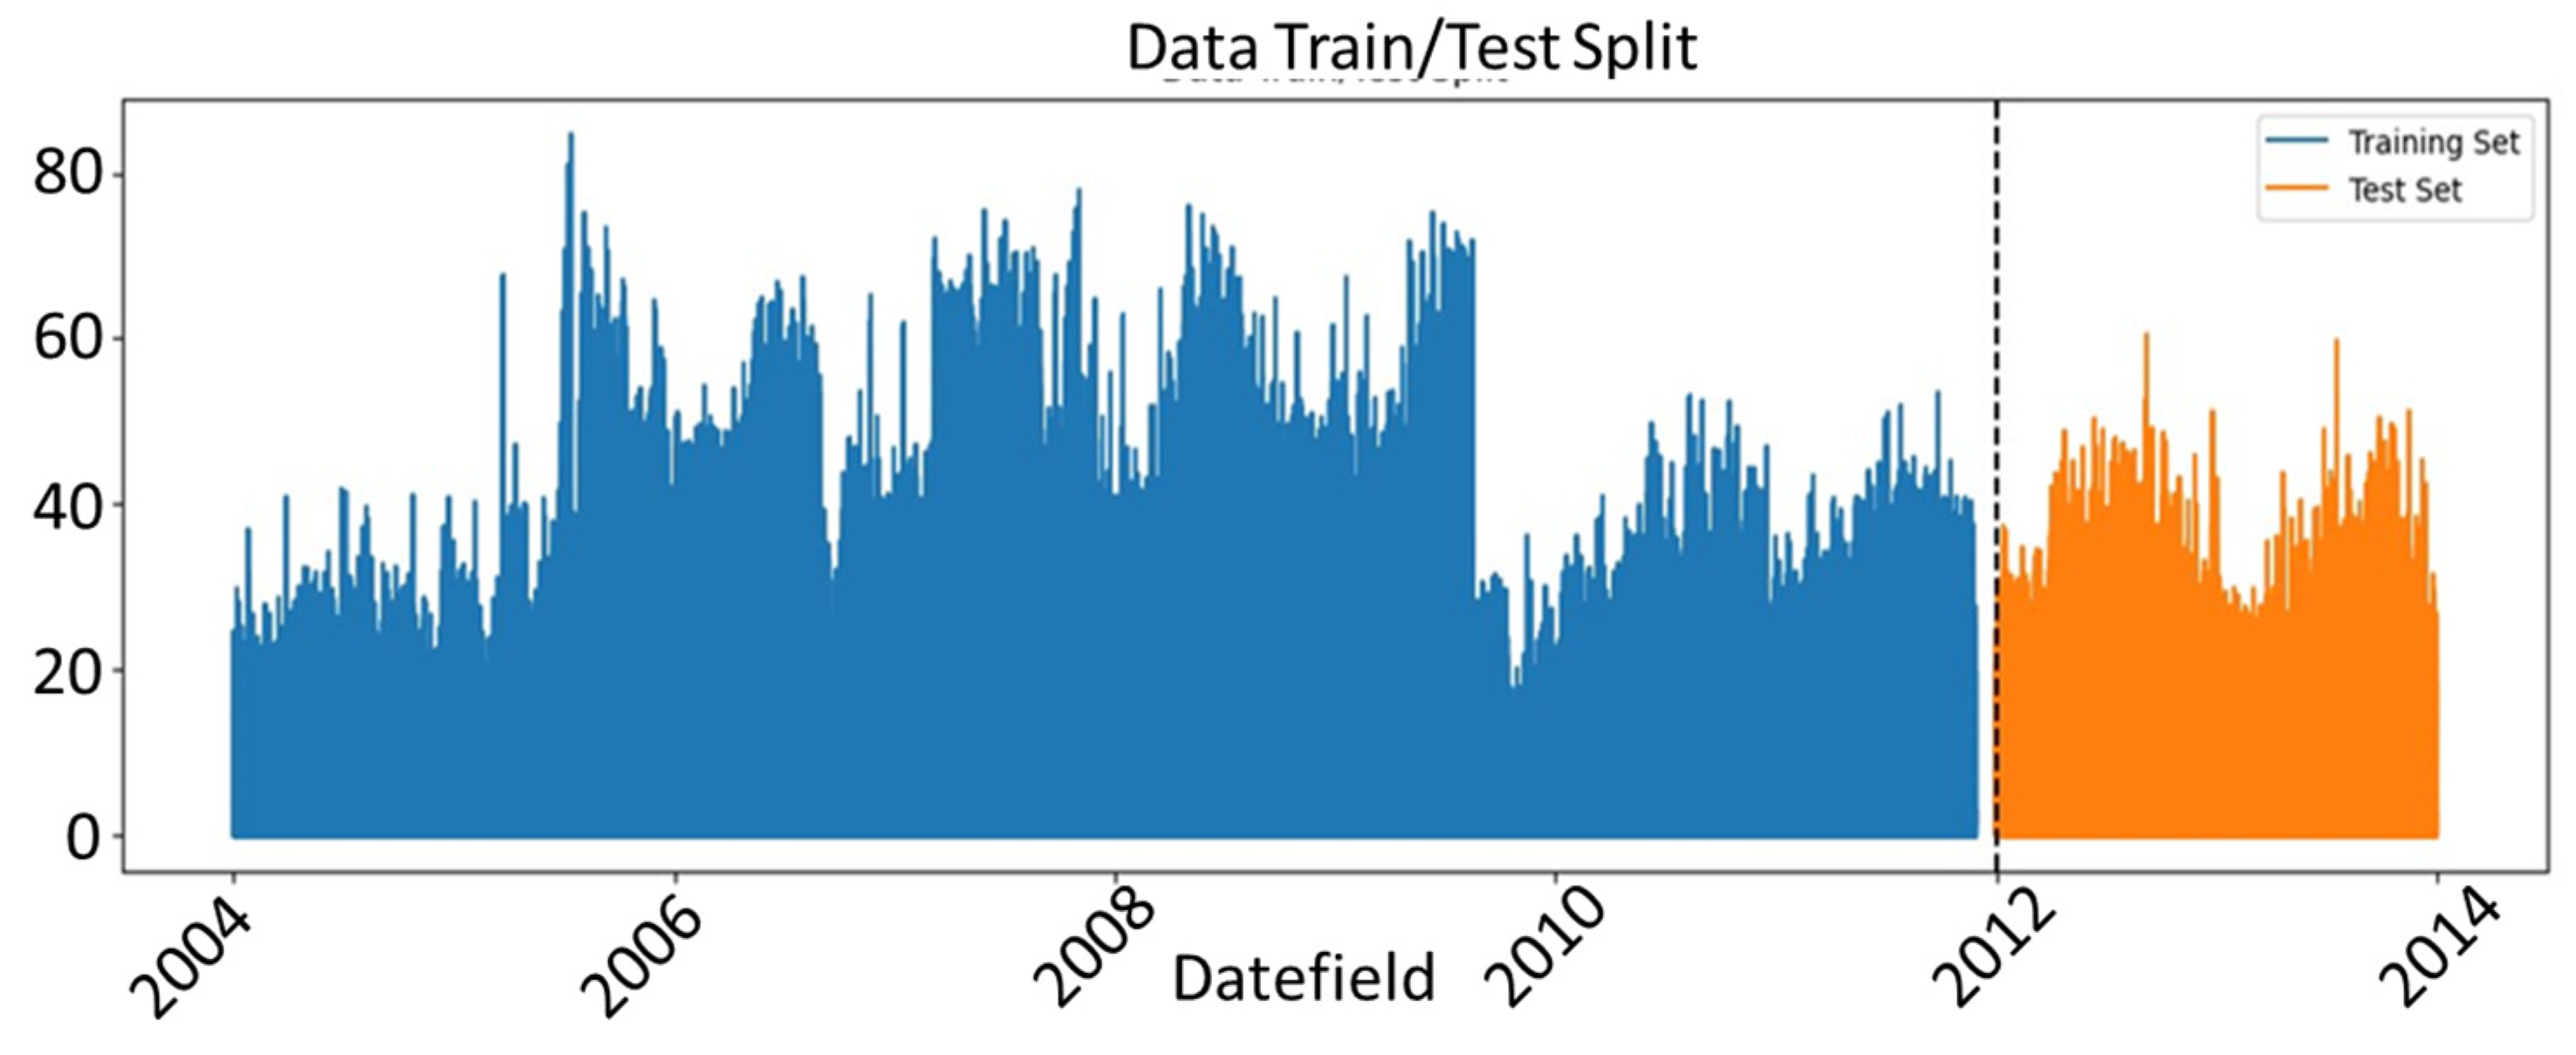
Figure 2 shows the schematic outline of this research. For the purpose of training a prediction model, the initial 80% of the data was chosen as the training dataset, while the remaining 20% was used to assess the accuracy and effectiveness of the model.
Feature Extraction and Engineering
Whilst the authors in [
27] performed a lot of work on data pre-processing, we transformed the data to suit our needs by combining the various years (2004–2014) together and extracting the required features. The DEL dataset contains 48.3 million rows and five columns. The first column indicates the ID of the recorder used, that is, RecorderID, and the second column shows the profile of the recorder, that is, ProfileID. The third to final columns give a date and time (Datefield), indicate units read (Unitsread), and indicate whether the details captured are valid (Valid), respectively. After pre-processing, we reduced the number of rows to approximately 37 million. Pre-processing was performed to further denoise the data before training the models. For the purposes of our study, we extracted two columns: Datefield and Unitsread.
To understand the temporal dependencies within the data, we feature-engineered lag1 and lag2 values. Using the features lag1 and lag2 as predictors allows the model to consider the recent history of the time series when making predictions [
7]. Engineering these features is important because information such as weather conditions, which are essential for predicting electricity consumption, is not captured in the data. As predictors, lag1 and lag2 are known to track hidden temporal dependencies, which further enhances the overall model performance.
Furthermore, we introduced a rolling mean feature and normalized all features in the test and train split data. Normalizing these features can help maintain consistency and facilitate the interpretation of feature importance, thus improving the overall model performance. Because of brevity, we do not indicate the feature importance in this paper.
Table 2 provides a summary of the dataset indicating the spread and count of Unitsread and ProfileID.
We considered the temporal trends within the dataset, such as features like the day of the week, hour, month, day of the year and month, quarter, and year of consumption. The training and testing of the models were carried out with these features.
We extracted temporal features like the day of the week, hour, month, day of the year, month quarter, and year of consumption from the dataset. Including these temporal features as predictors allowed the models to capture essential temporal details and seasonal variations in energy consumption patterns. Temporal dynamics, including seasonal variations and rolling averages, were captured by engineering features such as lag values (lag1 and lag2) and rolling mean features. These features allow the models to consider the recent history of the time series when making predictions, capturing essential temporal details.
We also observed that, after training, testing and validation, the predictions were not as accurate: we thus employed feature engineering techniques to enhance the model prediction. As mentioned in the study, lag features involved the inclusion of past values of the target variable as features. In the code, the lag features “lag_1” and “lag_2” were created by shifting the electricity consumption, Unitsread, by one time step. We further considered moving average to capture trends and seasonality in the data that the initial feature importance may not have captured. In the code, a rolling mean feature was calculated to smooth out fluctuations in consumption over time. These engineered features after the validation aim to improve the models’ predictions results.
3.3. Machine Learning Models
As mentioned earlier, we tested the residential dataset using four machine learning models. These models are briefly outlined as follows: Decision Trees (DT), Random Forests (RF), Extreme Gradient Boosting (XGB), and Adaptive Boosting (AdaBoost).
3.3.1. Decision Trees (DT)
A Decision Tree (DT) for regression, often referred to as a Regression Tree, is a supervised machine learning algorithm used for predicting continuous target variables. Unlike classification trees that partition data into classes, regression trees split data into subsets and assign a continuous value (usually the mean or median) as the prediction for each subset. The tree was constructed by recursively splitting the data into subsets based on feature values to minimize the mean squared error (MSE) of the predictions.
Figure 3 shows an example of a DT trained for house price prediction which reaches a prediction decision by evaluating the value of certain predictor variables at each split.
3.3.2. Random Forest (RF)
Random Forest (RF) is a learning model that builds multiple decision trees and combines their predictions to improve the accuracy and reduce overfitting. Each tree was constructed using a random subset of the training data (bagging) and a random subset of features (feature bagging). The final prediction was made by averaging or taking a majority vote among the predictions of individual trees.
3.3.3. Extreme Gradient Boosting (XGBoost)
The XGBoost is a gradient boosting framework that has gained popularity because of its exceptional predictive performance. It essentially combines hundreds of decision trees sequentially, where each tree is trained to correct the errors made by previous ones [
29]. The model minimizes the loss function using gradient descent and incorporates regularization techniques to prevent overfitting.
3.3.4. Adaptive Boosting (AdaBoost)
The AdaBoost model combines the predictions of multiple weak learners to create a strong learner. The AdaBoost algorithm is based on either weighted majority voting or weighted averaging of the individual predictions. The weight
assigned to the prediction of the weak learner at iteration
t was calculated as follows:
where
is the weighted error for the weak learner at iteration
t. Furthermore, the final prediction (F(x)) for a new input
x is a weighted combination of the weak learners’ predictions, given by
where
T is the total number of weak learners and
ht(
x) is the prediction of the weak learner.
Feature engineering methods included the creation of lag features (lag1 and lag2) and rolling mean features to capture temporal dependencies and trends. These methods help in preventing overfitting by smoothing out fluctuations and capturing essential patterns. Additionally, the data were normalized, and only relevant features were selected for training, reducing the risk of overfitting. Cross-validation techniques were also employed to ensure that the models generalize well to unseen data, addressing potential issues of underfitting.
3.4. Performance Evaluation Criteria
This section presents the four evaluation criteria recommended by Conte et al. [
30] to check the performance of the chosen models: the mean squared error (MSE), mean absolute error (MAE), mean absolute percentage error (MAPE), and coefficient of determination (R
2). The Mean Absolute Error (MAE) is widely used in machine learning to measure the average absolute deviation between the predicted and actual values, and it gives all errors an equal weighting. The MSE measures the average scale of the squared differences between the predicted and actual values. It penalizes larger errors more heavily than smaller ones (see Equations (3) and (4)).
Furthermore, the MAPE estimates the average absolute percentage difference between the predicted and actual values. This measure is particularly valuable when errors are expressed as a proportion of actual values. The R
2 score measures the proportion of variance in the dependent variable that is explained by the independent variables. It provides a value between 0 and 1, where 1 indicates a perfect fit (see Equations (5) and (6), respectively).
where
is the actual measurement,
is the predicted value,
the mean of the actual target values, and
the number of measurements.
The relevance and limitations of MSE, MAE, MAPE, and R2 in this context are presented next:
Relevance:
MSE and MAE both capture the difference between predicted and actual energy consumption. Lower values indicate better prediction. MSE penalizes larger errors more heavily, while MAE focuses on the average magnitude of errors.
MAPE is useful when dealing with data containing significant fluctuations, as it expresses errors as a percentage of actual consumption. This allows for fairer comparisons across different consumption levels.
R2 indicates how well the predicted values align with the actual trend. A higher R2 suggests a strong correlation between predicted and actual values.
Limitations:
MSE is sensitive to outliers. A single large error can significantly inflate MSE, potentially masking an otherwise good prediction.
MAE does not consider the direction of the error. An underestimation by the same amount as an overestimation will have the same MAE, which might not be ideal.
MAPE not suitable for cases where actual consumption values are close to zero, as it can lead to division-by-zero errors.
A high R2 can occur even with consistent under- or overestimation by the model. It only reflects the strength of the linear relationship.
4. Results and Discussion
This section presents the results of the predictive models. Due to the size of the data, we ran the algorithms for each model on the University of South Africa (UNISA) high performance computing (HPC) system. Our consideration is mainly based on the fact that the chosen models are widely used in the energy forecasting literature.
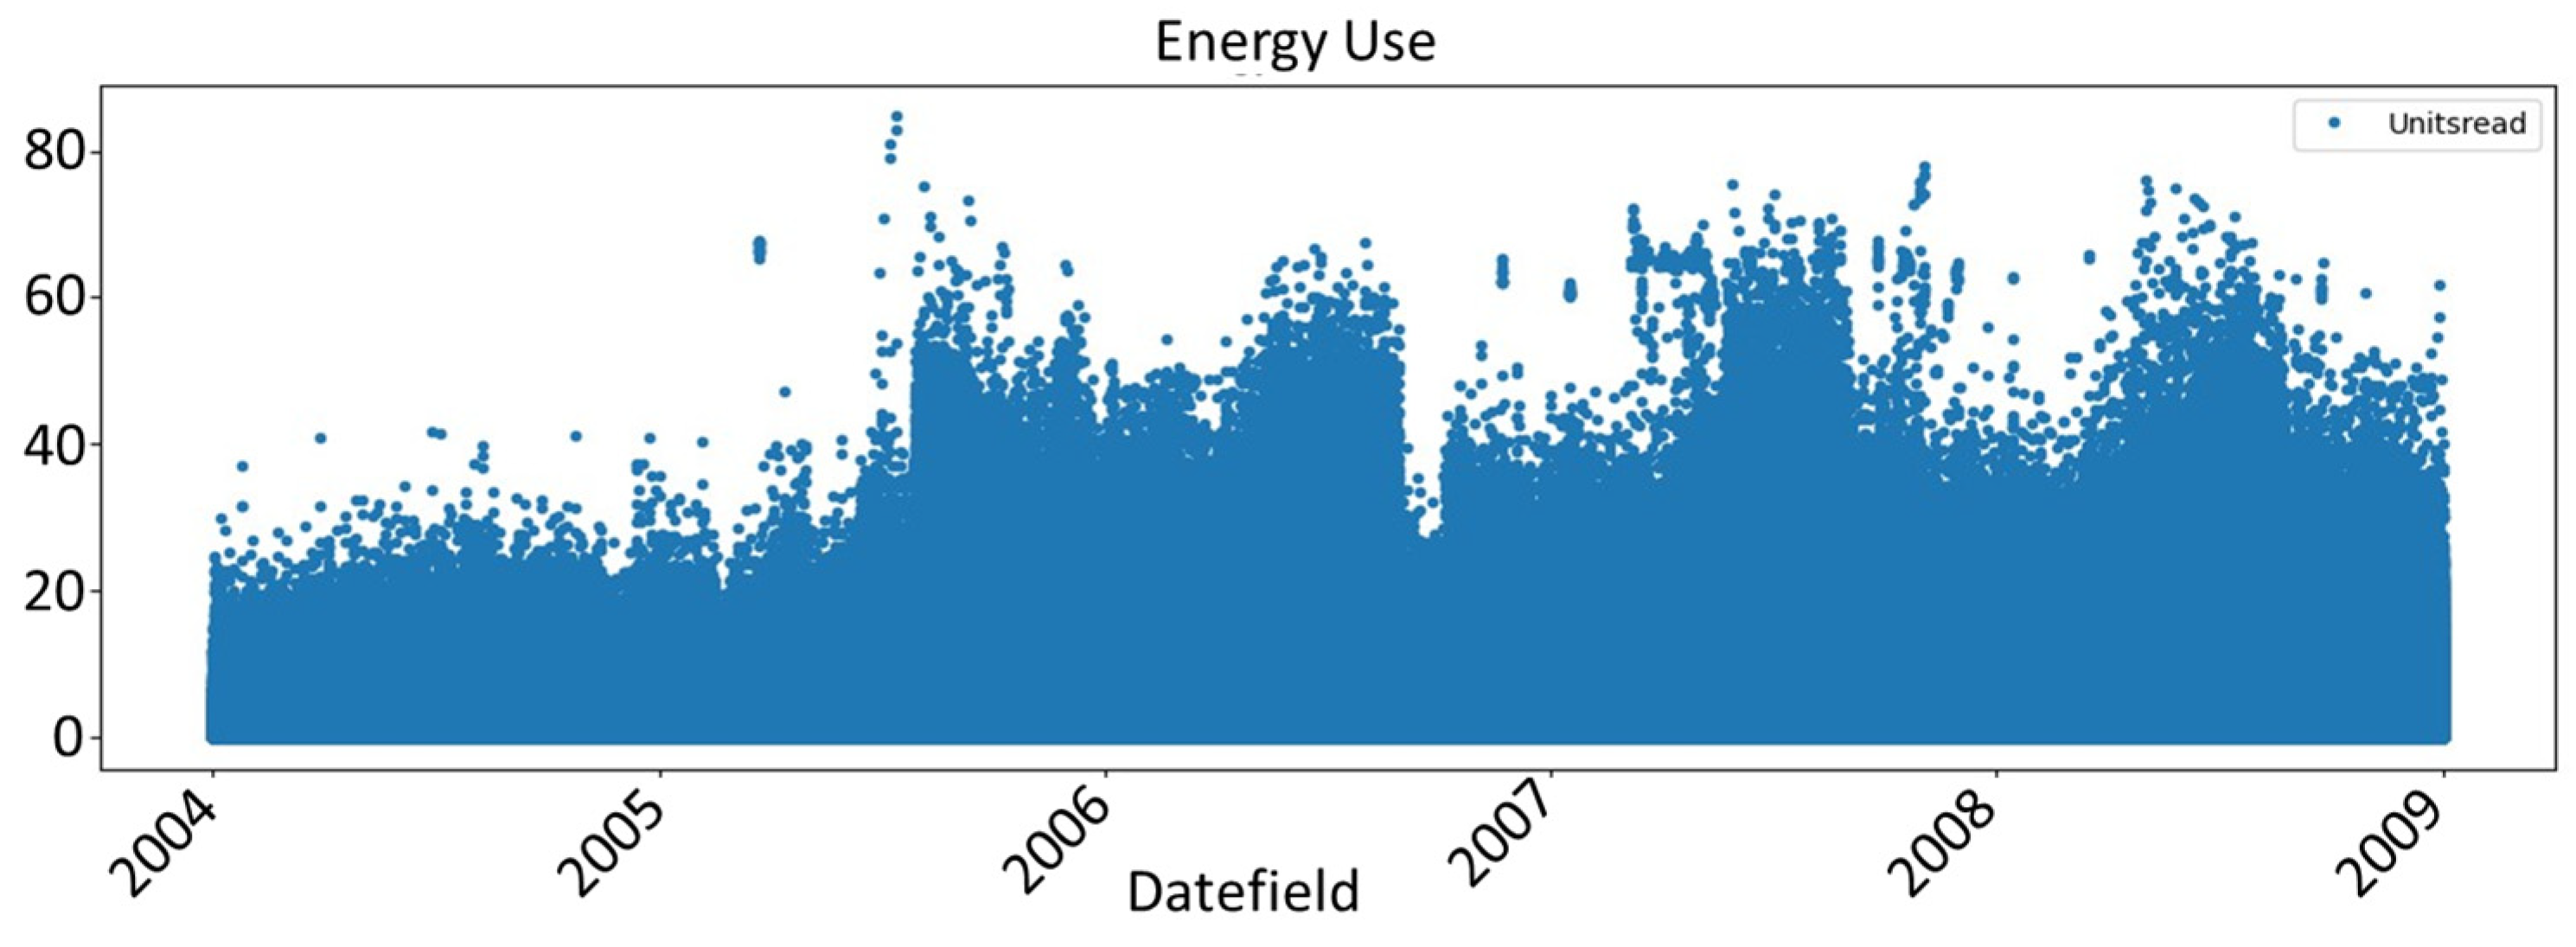
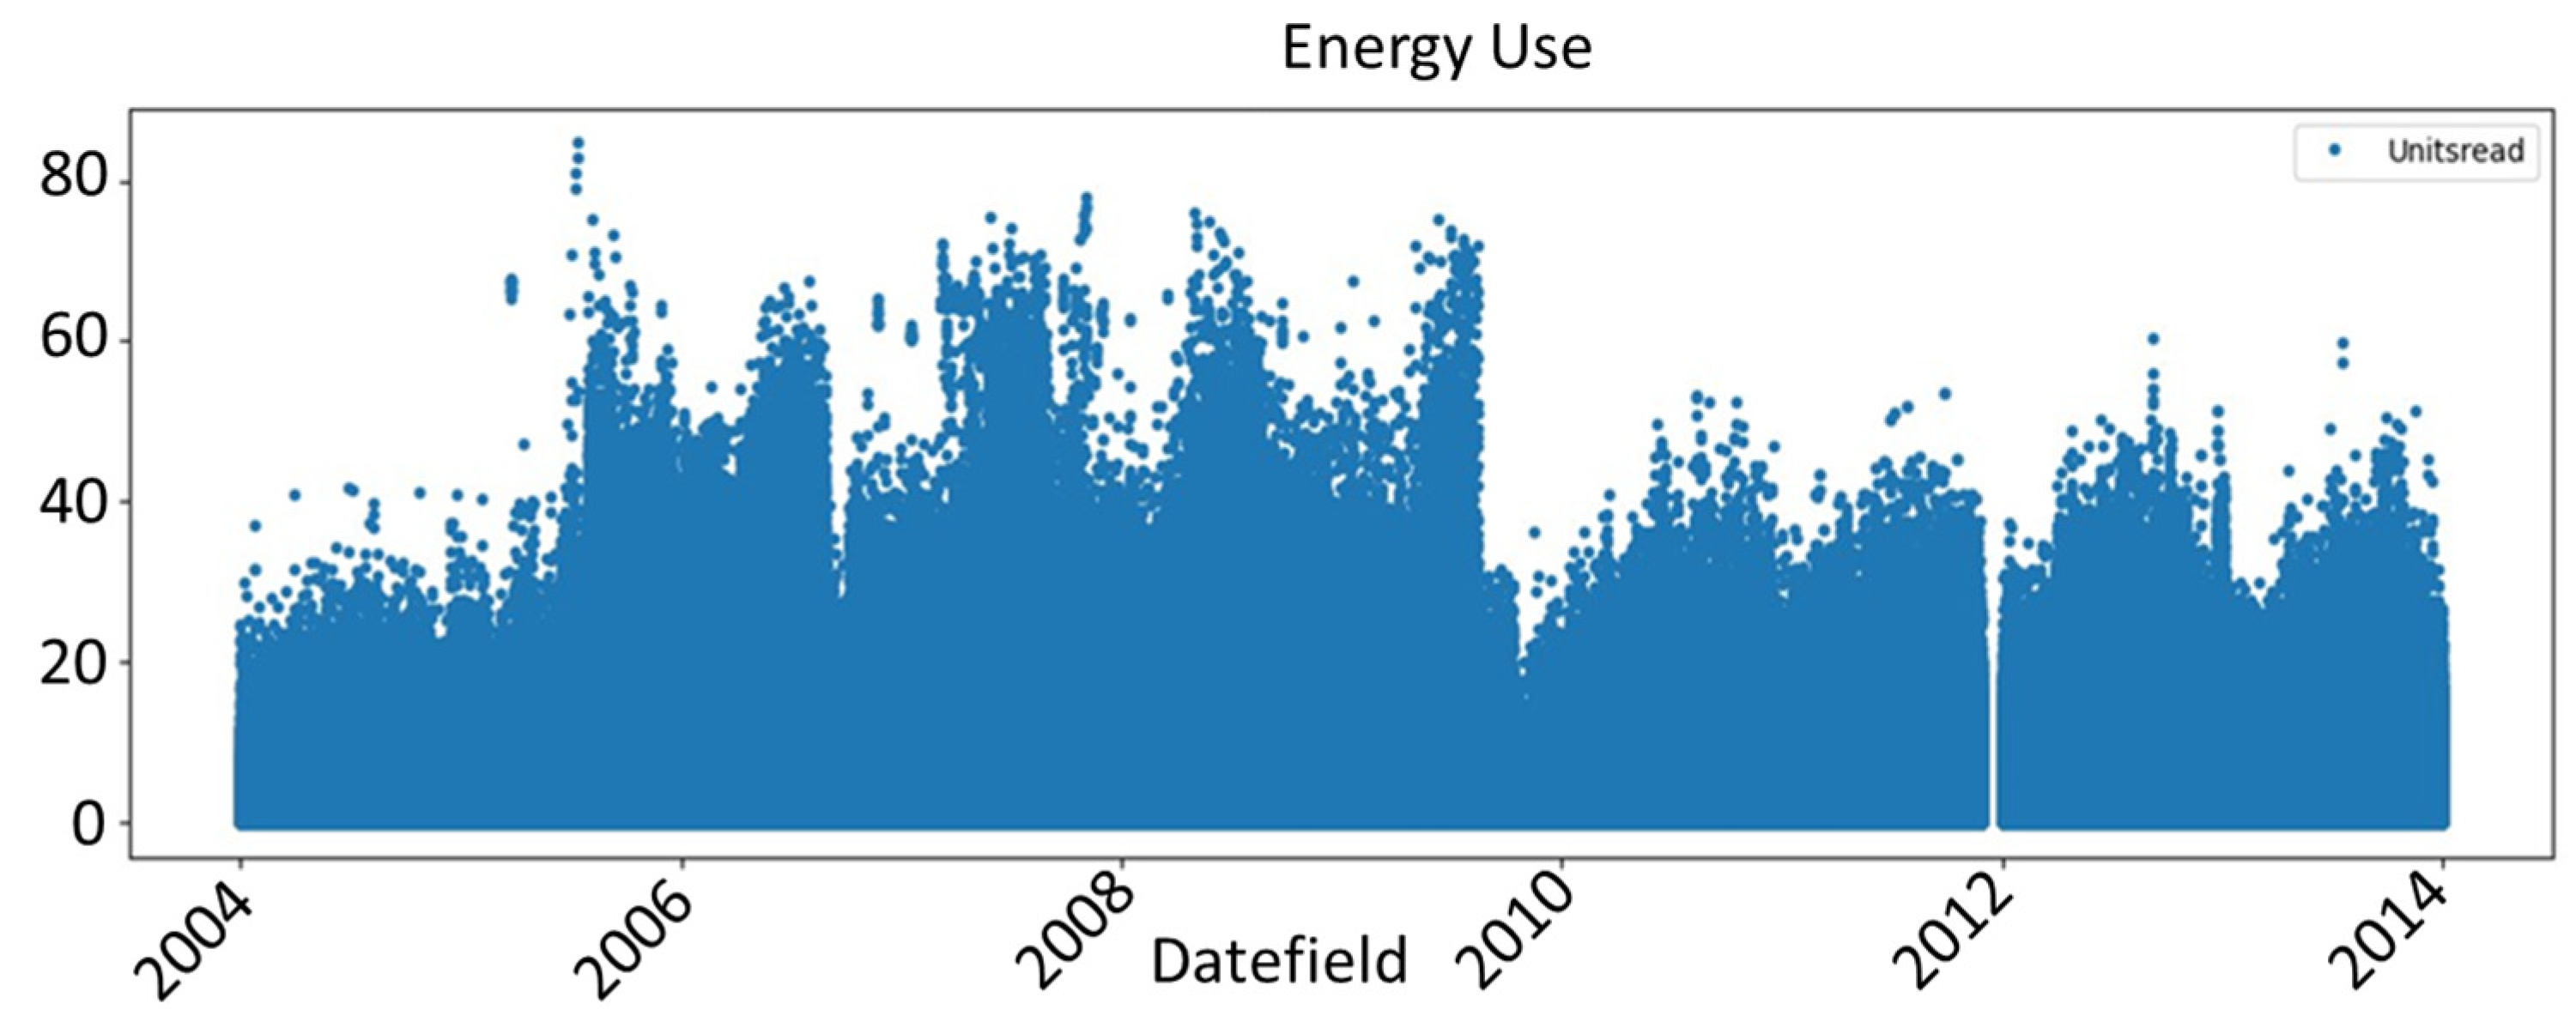
We chose to run the models for three, five, and eleven years of consumption data, that is, 2004–2006, 2004–2008, and 2004–2014, respectively. Figures below present the energy consumption data for the selected years.
Figure 4 and
Figure 5 present the data for the 2004−2006 and 2004−2008 periods.
Figure 6 presents the full dataset from 2004 to 2014, and
Figure 7 presents the training and testing splits. In
Figure 8 and
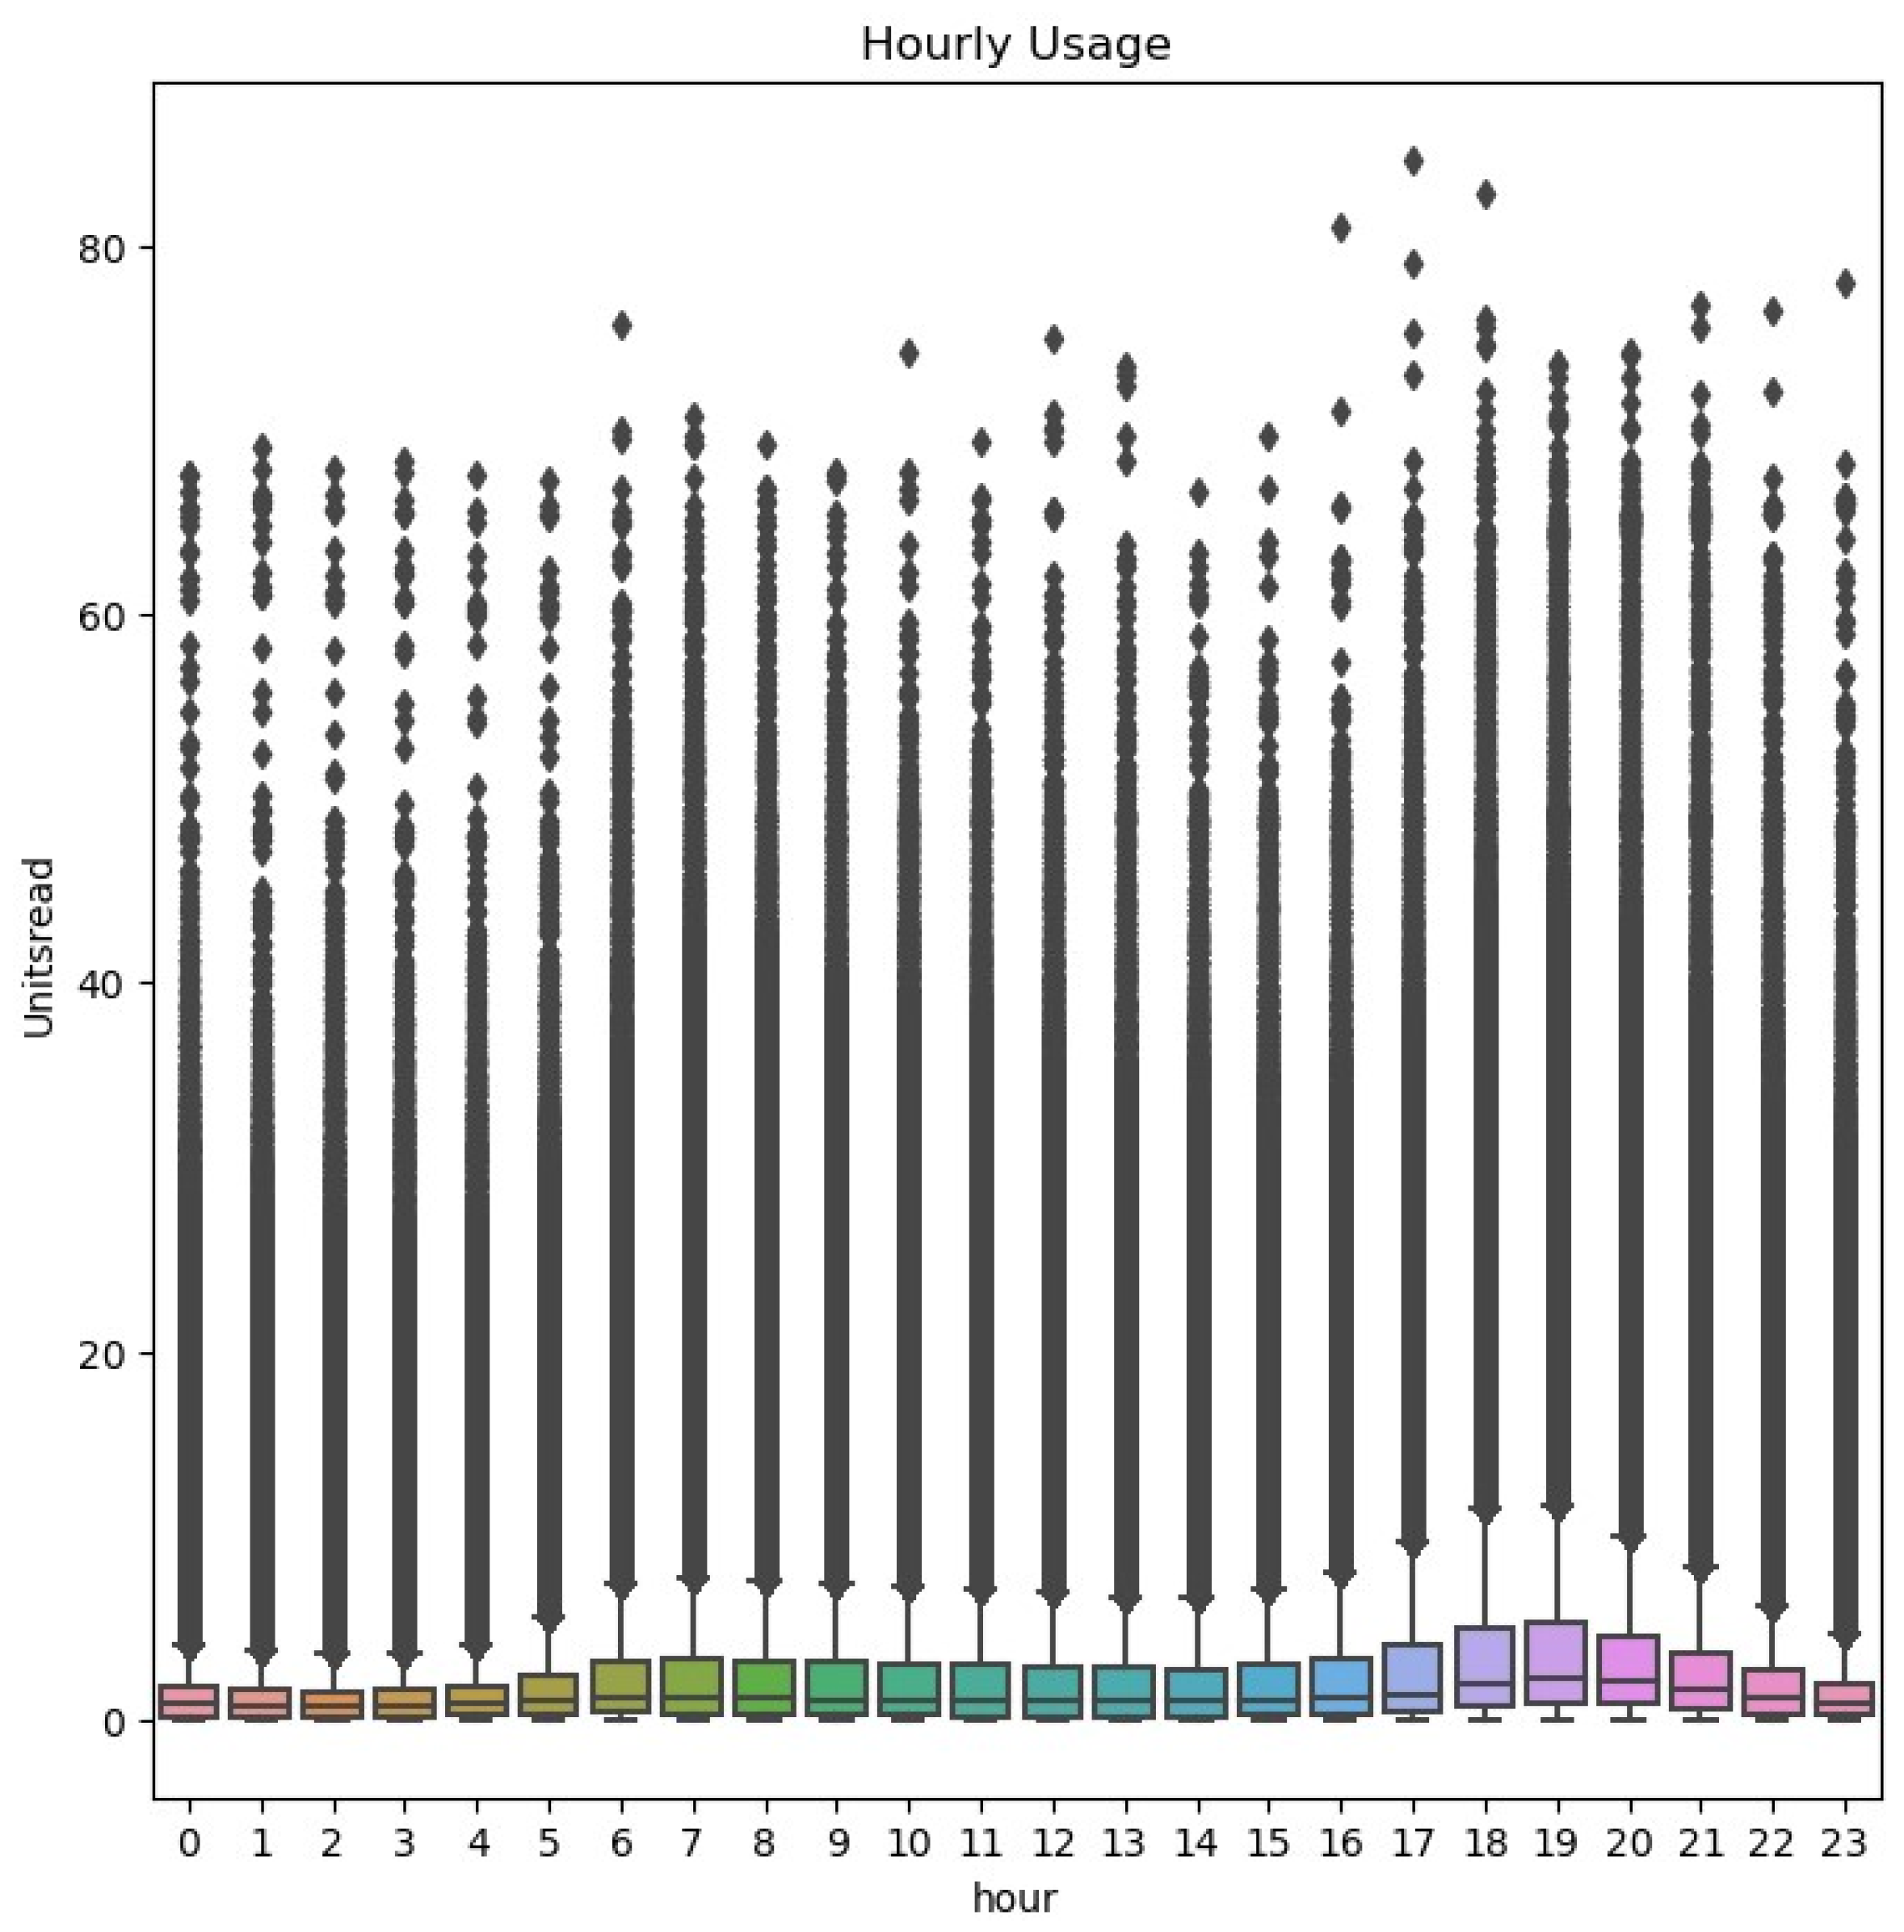
Figure 9, we present the weekly and hourly consumption data for 2004.
Table 3,
Table 4 and
Table 5 present the prediction performance (for hourly data) for the four models presented in
Section 3.4. Each table shows the performance for each model in relation to the four criteria, MSE, MAE, MAPE, and R
2, and the best score is marked in bold text.
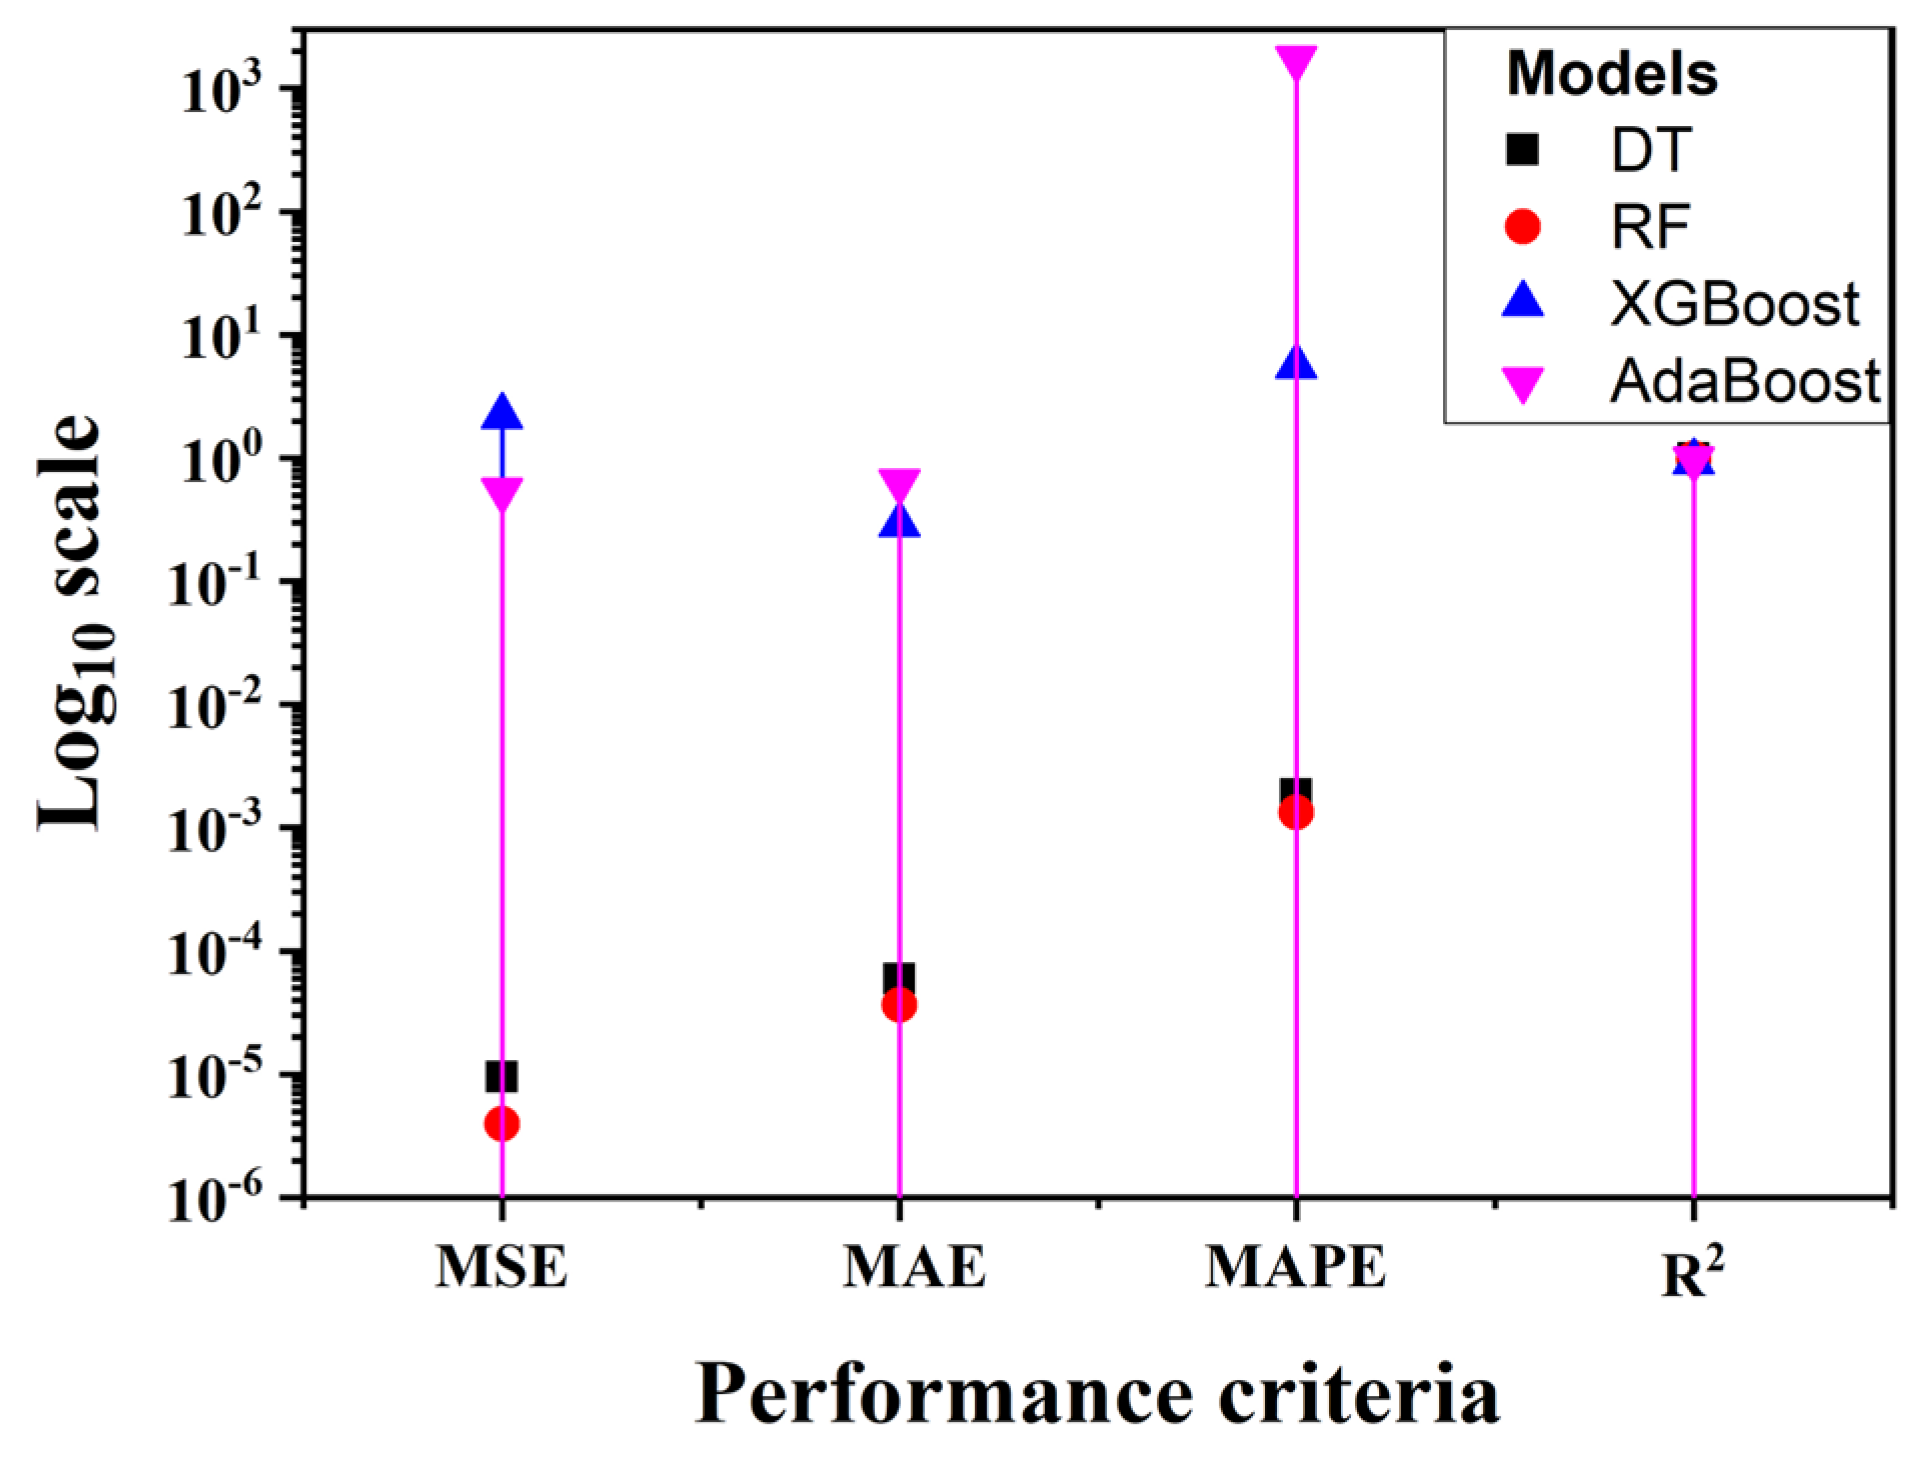
Table 3 presents the performance for three years of data, that is, from 2004 to 2006. From
Table 3, RF outperforms all the other three models in predicting the energy consumption under all three criteria (MSE, MAE, and MAPE). The R
2, of course, shows how well the model fits to the data. We can observe that the values of MSE, MAE, and MAPE for DT and RF are so small (exponent 10
−4 to 10
−7) as to be close to 0; this indicates that the models perform well (very high prediction accuracy).
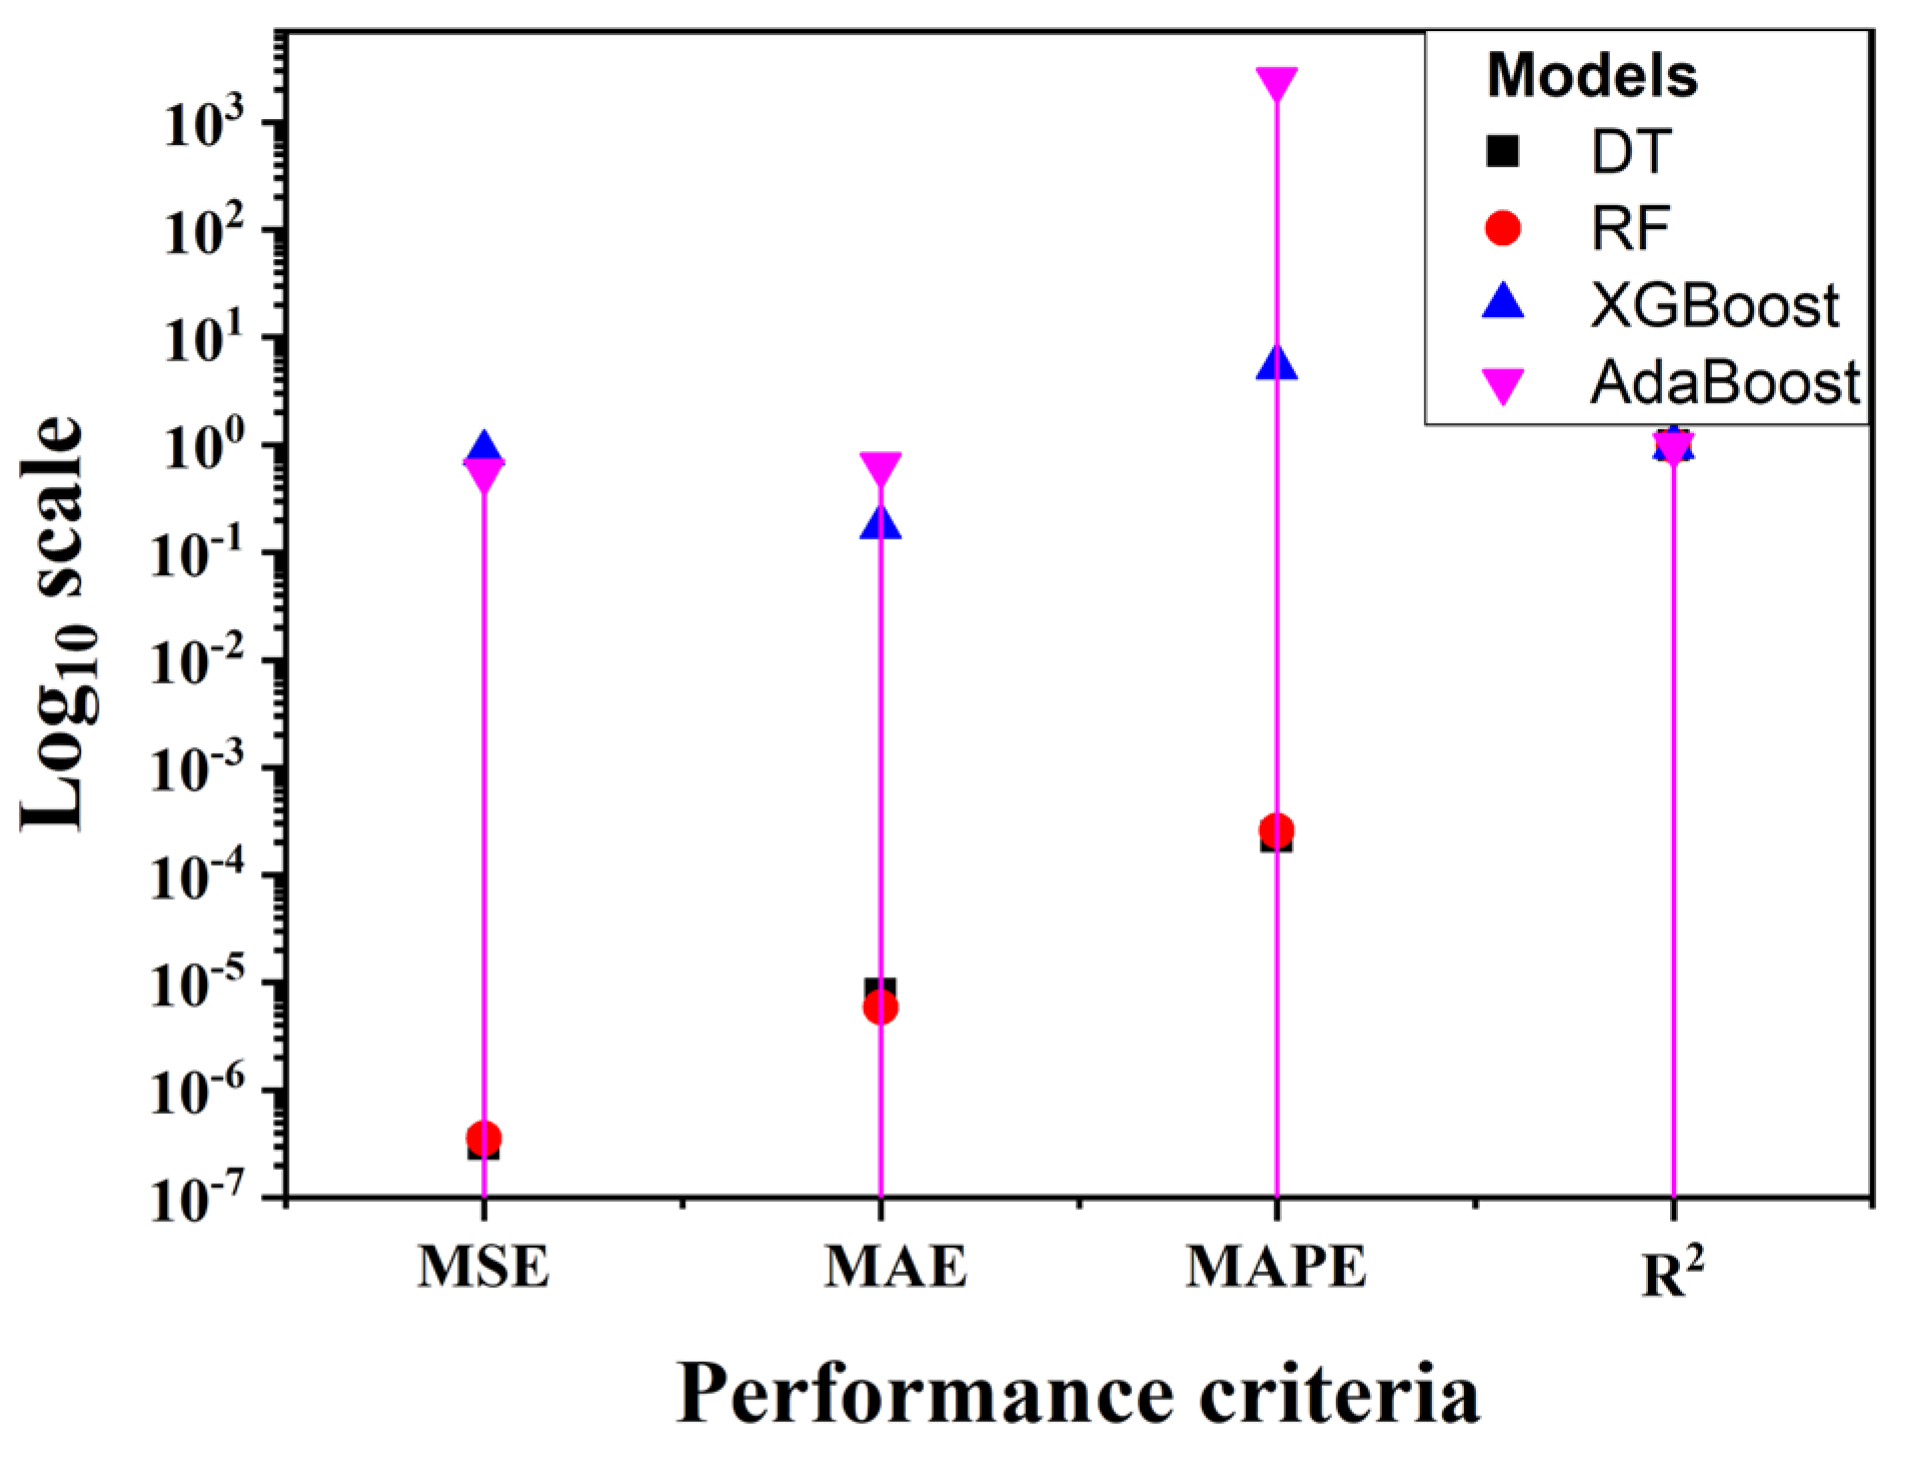
In
Table 4, DT slightly outperforms RF with regard to MSE and MAPE. However, the MAE of RF is better than that of DT, which shows how well RF performs as an ensemble model. In general, the tree models outperform the boosted models for predicting energy consumption. However, in
Table 3,
Table 4 and
Table 5, there is a gradual improvement in the performance of XGBoost. The model is known to perform well with increasing amounts of data.
Figure 10,
Figure 11 and
Figure 12 present the graphical representations for
Table 3,
Table 4 and
Table 5. These figures provide a clearer visualization of disparities and variations in the data, making it easier for readers to interpret the results.
The superior performance of Random Forest (RF) and Decision Tree (DT) models can be attributed to their ability to handle the high dimensionality and complexity of the dataset effectively. These models are known for their robustness to overfitting and their capability to capture non-linear relationships within the data. The interpretability of RF and DT models, along with feature importance measures, allowed for the better understanding and optimization of the models. On the other hand, boosting models like XGBoost and AdaBoost, while powerful, may require more fine-tuning and larger datasets to achieve a similar performance.
Limitations of the Study
The main assumptions of the predictive models developed include that:
- (1)
The historical data used are representative of future consumption patterns.
- (2)
The features used in the models sufficiently capture the factors influencing electricity consumption.
- (3)
The models assume no significant changes in the energy infrastructure or major policy shifts during the prediction period.
Although the proposed models showed promising results in predicting residential energy consumption with the DEL dataset, there are some important limitations to consider regarding the representativeness of this dataset and potential biases. The representativeness of the DEL dataset of the entire South African population should be examined. The DEL dataset covers a diverse range of urban, informal (township), and rural environments, as well as various climatic zones and income groups. However, the specific sampling methodology and the extent to which different demographic groups are represented in the dataset are not clearly delineated. If certain regions or socioeconomic segments of the population are underrepresented or overrepresented, the predictive models may exhibit biases and fail to capture the consumption patterns accurately for those groups.
5. Conclusions and Future Work
This study investigated several machine learning models to predict the energy consumption of residential buildings in South Africa. We applied RF, DT, XGBoost, and AdaBoost models to help predict the consumption, and found that RF and DT models outperformed the boosting models (XGBoost and AdaBoost). A reason behind DT and RF models outperforming boosting models (XGBoost and AdaBoost) could be related to the interpretability of DT and RF after feature engineering in the dataset. In this case, given that the predictor variables and thresholds became directly observable in the splits, DT and RF outperformed the boost tree models, which are known to be less interpretable.
The predicted hourly national consumption can equip households, businesses, and policymakers with actionable insights, including on national and local consumption and peak identification, by facilitating more accurate and granular energy consumption forecasts. This study contributes to the ongoing discourse surrounding sustainable energy management by combining advanced machine learning techniques with real-world energy challenges.
The practical implications of this research are significant. By accurately predicting residential energy consumption patterns, stakeholders such as energy providers, policymakers, and households can make informed decisions to optimize energy usage and mitigate issues like load shedding. Accurate predictions enable energy providers to better manage supply and demand, reducing the risk of grid failures and prolonged power outages. Furthermore, households can leverage these predictions to implement energy-saving measures during peak demand periods, potentially leading to cost savings and contributing to a more sustainable energy landscape. Policymakers can also use these insights to develop targeted initiatives and incentives for promoting energy efficiency in the residential sector, aligning with national goals for energy security and environmental sustainability.
To leverage the strengths of individual models, mitigate their inherent limitations, and provide enhanced predictive accuracy, we plan to implement ensemble learning models including AdaBoost, Averaging, Stacking, and Voting models, with the aim of increasing the accuracy of predicting building energy consumption in the residential sector. By combining the best features of individual ML models, ensemble models reduce the drawbacks of each model and improve prediction accuracy.
Further comparisons based on other attributes (features), such as appliance usage, features related to buildings (square footage, floors per building, etc.), weather conditions, occupancy patterns, and energy tariffs will be added as part of the details of future work.
Furthermore, in future work, we also plan to analyze data related to load shedding by identifying the type of data needed to take load shedding into account, including the national energy capacity to meet national and local consumption, peak identification, analysis at load shedding time, and causes of load shedding. By analyzing historical load shedding data, we can gain insights into how residents react to reduced power availability. This knowledge can be incorporated into forecasting models to better predict how consumption patterns might shift during peak demand periods or potential outages. Analyzing historical load shedding data provides valuable insights into how electricity consumption patterns change during periods of reduced power availability. This information can inform the development of more robust and adaptive forecasting models by incorporating load shedding events as features in the models. Understanding consumption patterns during peak demand periods or potential outages allows for better demand response strategies and optimization of energy distribution, ultimately leading to improved resilience of the electricity grid.
Machine learning algorithms can also be used to predict electricity consumption in real-time. The real-time prediction of electricity consumption is essential for various applications, including energy management, demand response, grid optimization, and renewable energy integration. The models presented in our study can assist in analyzing the historical consumption data, time-of-day patterns, and other relevant factors to make accurate predictions of future electricity demand as well as efficient usage. There are several factors that would contribute to the feasibility of real-time prediction, including data availability, the latency of models, and advanced feature engineering. The real-time model will work as an integration into IoT systems and power stations, acting as a source of real-time data collection. Integrating real-time prediction models into existing infrastructure and systems is feasible but requires several challenges to be addressed. Data availability is crucial; thus, real-time data collection mechanisms need to be established. Model latency must be minimized to ensure timely predictions, which can be achieved by optimizing the computational efficiency of the models. Advanced feature engineering techniques, such as real-time normalization and the handling of missing data, are necessary to maintain model accuracy. Potential challenges include ensuring data privacy, managing the computational load, and integrating with legacy systems. Solutions involve deploying scalable cloud-based infrastructures and developing robust data-handling protocols. In future work, we plan to investigate whether or not this indeed works well.
We also plan to develop software based on the proposed predictive model. The model can be implemented as part of an energy management system, providing real-time predictions and insights to users. The software could include features such as real-time data visualization, alert systems for peak demand periods, and recommendations for optimizing energy usage.
An aspect of the DEL dataset that was not considered in the work is the appliances each household had and how this impacted consumption. By using forecasting techniques based on these data, residents can optimize resource utilization, prioritize critical activities, and improve energy consumption within their homes. In addition, policymakers and utility providers can utilize more accurate forecasts to coordinate load shedding schedules that minimize users’ inconvenience while simultaneously maximizing energy conservation efforts.


