1. Introduction
Tillage is one of the major soil handling operations which guzzles most of the energy and cost expenditure during the crop production cycle [
1,
2,
3,
4]. Tillage tools direct the energy into the soil to cause desired effects such as cutting, breaking, inversion, and movement of soil. Soil is thus transferred from a rigid, bulkier, and compacted condition to a desired pulverized condition by this process. Therefore, tillage is an important operation in achieving the UN Sustainable Development Goals, i.e., Zero Hunger (SDG-2), Responsible consumption and production (SDG-12), Life of Land (SDG-15), and Climate action (SDG-13) during sustainable crop production [
5,
6]. It was also reported that the depth of tillage operation was a more critical factor than the speed of operation [
7]. The depth of tillage is also an important factor for well-tilled seedbed preparation and higher incorporation, which reduces the dependence on herbicides in the next crop production cycle [
8]. Rotary tillers (Rotavators) are popular machines for tillage as they only require one pass for tillage operation. The use of rotavators in northwestern India is very common for primary tillage operations, which are mostly available in the size of 1.20–1.80 m working width and suitable for tractors of 45 hp and above power ranges [
9]. However, the rotary tillers consume more energy than conventional tillage implements as well as smear the soil beneath the tilled layer, which leads to soil compaction.
Excessive compaction has damaging consequences for agricultural ecosystems [
10]. The risk of soil compaction increased due to the remarkable increase in the weight of agricultural machinery, significantly in modern farming that compacts the soil with each passage and reduces its production capacity [
11,
12]. All farming operations, starting with seedbed preparation, fertilizer applications, pest control and interculture operations, and lastly harvesting, increase the risk of decline in agricultural soil through unnatural compaction [
13]. Water percolation and storage, volume of soil, and growth seek by roots and crop outputs are reduced due to extreme soil compaction, which is due to lack of nitrogen, potassium availability, and reduced root respiration due to less soil aeration under wet conditions [
12,
14,
15,
16]. In order to mitigate the problem of soil compaction caused by the use of rotavators in northwestern Indian conditions, there was a strong need for a better alternative to this tillage machinery.
The spading machine is PTO-powered tillage machinery which performs spading action; it effectively loosens the soil throughout the bed, and its motion does not compact or rub the soil at the bottom of cuts. The working principle is the same as digging by hand with the help of a spade; the blades of the spading act alternately into the soil and throw the clods backward for further fragmentation due to the impact of clods on the back plate. This back plate is also leveled off the surface by the action of a bar or rake. Due to the motion of the spades, it destroys the hard pan, which leads to improving soil respiration. It is expected to be a better option for tillage with reduced energy requirements and an increase in soil pulverization [
17]. Its action also includes the elimination of leaching and erosion as well as the ability to incorporate organic material (crop residue, straw, compost, or green manure) in soil. Spading machines could be an alternative tillage tool [
18]. Because it is a negative draft machine, it can carry out the same amount of work by consuming comparatively less power than that by conventional tillage implements [
19]. Also, the success of no-till is highly dependent on weather conditions. There was a substantial loss in yields observed under extreme environmental periods, either wet or dry, after planting/sowing. Many farmers are unwilling to take the risk of lower yield and look for alternative conservation tillage [
20]. While the spading machine consists of many advantages over other existing primary tillage tools, it fails to attract researchers and farmers. It is due to a lack of scientific awareness of spading machines. In the present study, the spading machine is evaluated at different tillage depths and compared with other primary tillage tools for its adaptability as a primary tillage tool.
2. Materials and Methods
2.1. Location of Study
The study was conducted at research farms of the Department of Farm Machinery & Power Engineering and the Department of Vegetable Sciences, Punjab Agricultural University, Ludhiana, Punjab, India. The location of all three soil types was as follows: sandy loam (S1), sandy clay loam (S2), and loamy sand soil (S3). The soil properties, location, and pH are expressed in
Table 1. The climate of the location can be categorized as hot and semi-arid. The summer season starts from mid-March and lasts up to the end of June. The southwest monsoon starts at the end of summer and lasts up to September and contributes about 78% of annual rainfall, whereas the remaining 22% of rainfall is received mainly during the winter season due to western disturbances from November to March [
21].
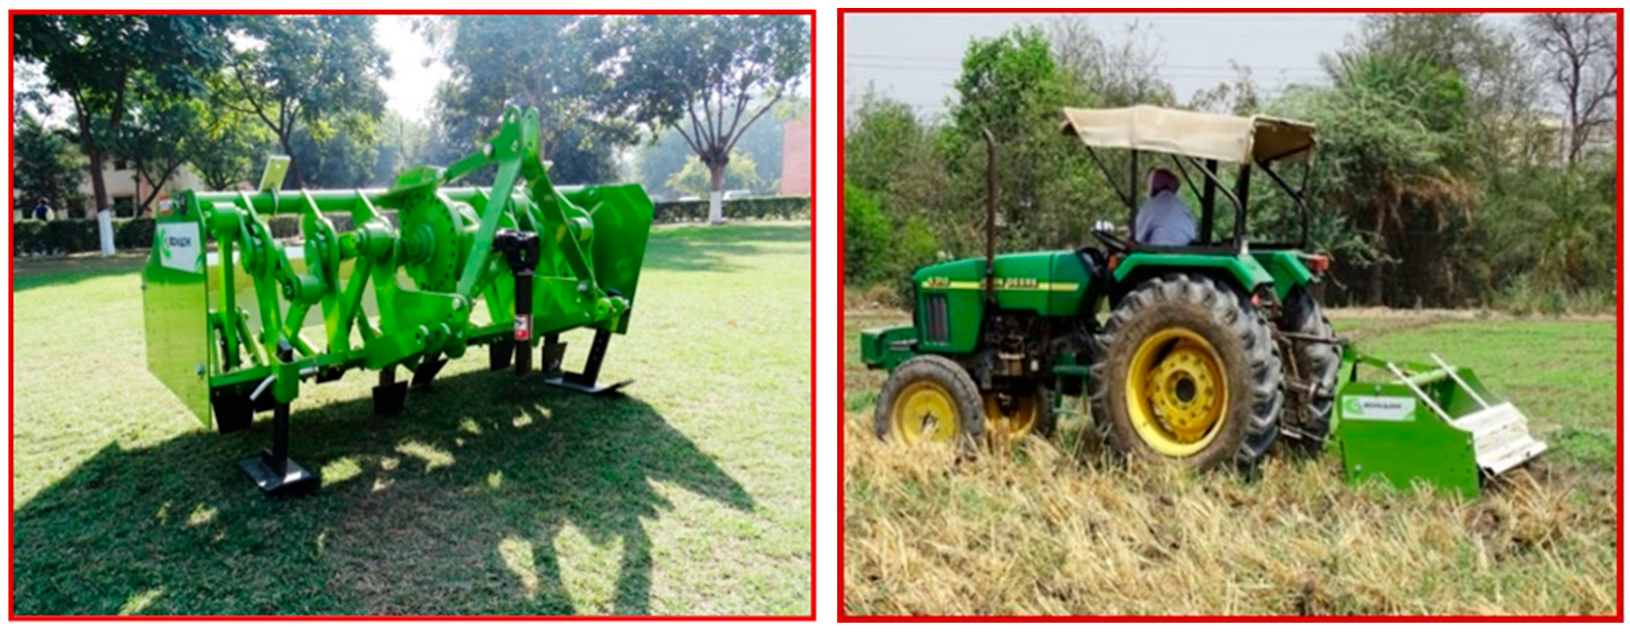
2.2. Brief Description of the Spading Machine
The spading machine is PTO-driven and hitched to a tractor using the standard three-point linkage. This machine can be operated by a 55 hp or above tractor equipped with Category-I/II three-point hitch pins. The machine consists of a mainframe, gearbox, eight spades, two adjustable slats, and a trailing board. The spades are attached to the support of the main frame by arms of equal length. The position of the arms attached to the main frame is such that it works like a crankshaft, whereby spades dig the soil one by one. The power from the tractor PTO is transmitted to spades through a gearbox mounted on the main frame. The speed reduction at the gearbox is 9:31, i.e., strokes of spade are 167 per minute at 540 PTO rpm. The depth of operation can be varied from 100 to 300 mm to loosen compacted subsoil and break up hard pans [
20]. The stationary and operational views of spading machines in different soils are displayed in
Figure 1.
2.3. Evaluation Procedure
2.3.1. Independent Parameters
The spading machine was evaluated on two independent parameters, i.e., depth of cut (3 levels) (D1—100 mm, D2—150 mm, and D3—200 mm) and soil type (3 levels) (S1—sandy loam soil, S2—sandy clay loam soil, and S3—sandy soil). The forward speed of 2.36 km/h was selected for tillage operation.
2.3.2. Dependent Parameters
The different dependent parameters recorded during field evaluation were bulk density of soil, soil strength, torque requirement, mean clod size, fuel consumption, and cost of operation.
2.3.3. Experimental Layout
Three different fields were selected having dimensions 31.5 m × 40 m (0.13 ha) on all three locations (soil type), as mentioned in
Table 1. For each replication, three continuous passes were made by the spading machine. A random number generator was used for the allotment of field position; each replication was assigned with a serial number which was used in the allotment procedure for each location. Four samples of bulk density were collected randomly before and after operation from each replicated trial. Similarly, four readings of soil strength were recorded randomly before and after the operation for each replication. Also, four samples of mean clod size were collected randomly after the operation for each replication. The fuel consumption was recorded for each replication, and the cost of operation was calculated. The following methods were used for recording the observation of dependent parameters.
Bulk Density of Soil
Soil bulk density was determined before and after tillage operation using the Core-cutter Method. The core sampler with a diameter of 7.0 cm and a height of 30 cm was used in the study. The samples were weighed using a digital electronic weighing balance and placed in a hot dry air oven at 105 °C for 24 h; after, these samples were re-weighed and we calculated the bulk density as per Equation (1) [
22,
23].
The percent reduction in bulk density was computed using Equation (2) [
24]:
where:
= bulk density before the operation;
= bulk density after operation.
Soil Strength
Soil strength (cone index) was determined to measure the penetration resistance of the soil before and after the tillage operation at various depths of soil. A hand-held digital cone penetrometer (Make: RFM Australia Pty Ltd., South Wentworthville, Australia, and Model: Rimik CP40II) was used to measure soil resistance to vertical penetration of the cone. The cone index was expressed in kPa. Cone index values up to 5600 kPa (75 kg) can be measured up to depths of 750 mm by using an ASAE (American Society of Agricultural Engineers, St. Joseph, MI, USA) cone of 130 mm
2 with a resolution of 0.03 kg. The hand lever of the cone penetrometer was operated at a uniform rate of soil penetration during the experiment. The soil strength values of each insertion were displayed graphically on the display panel of a digital cone penetrometer. These were saved in the device itself for each insertion for later retrieval by connecting the device with the PC having the relevant software for the cone penetrometer. The measured values are recorded by the device and saved in an Excel 2007 spreadsheet for further processing [
24,
25].
Torque Requirement
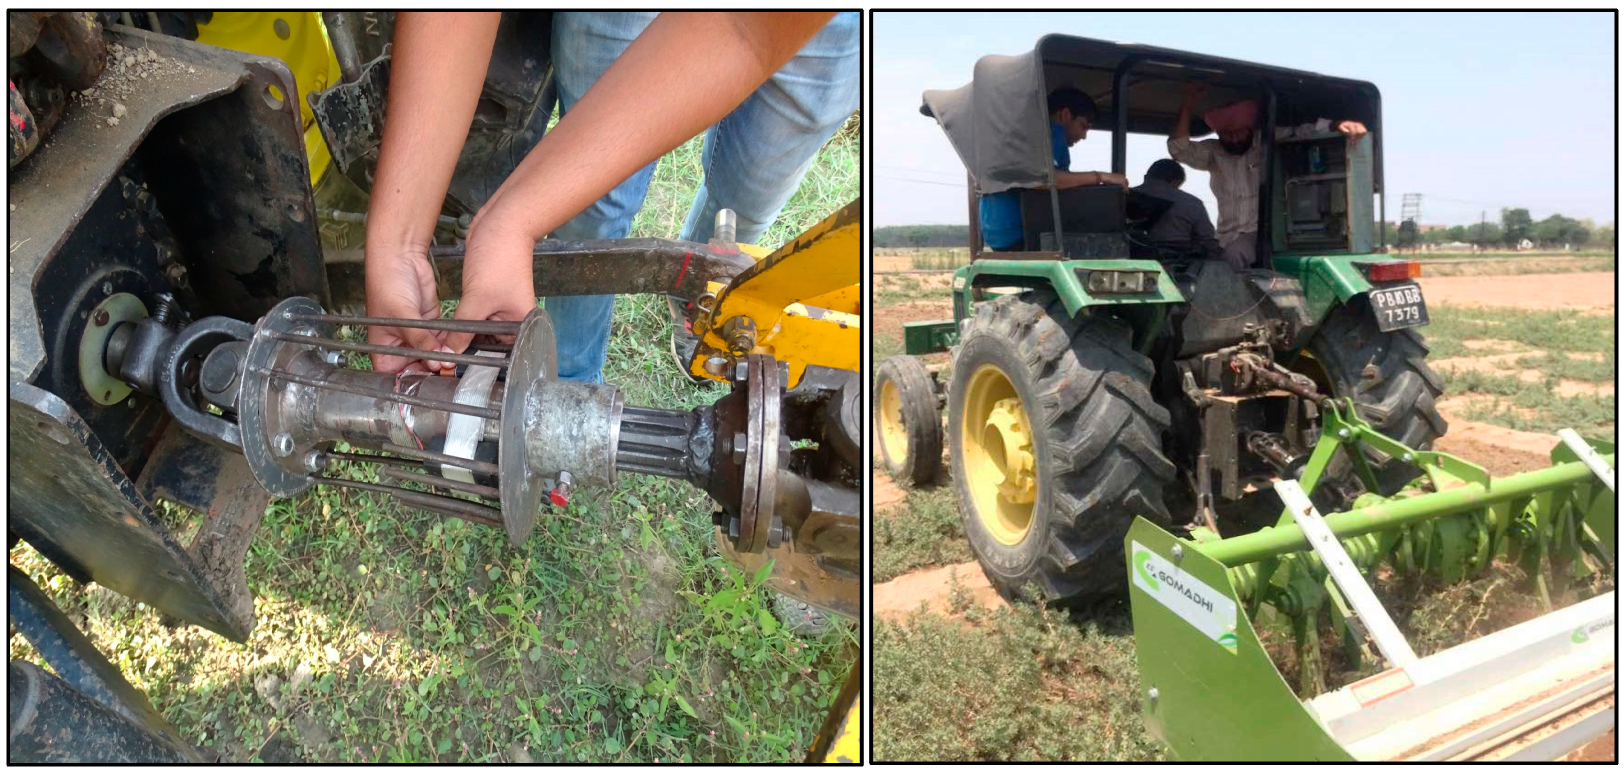
A wireless strain gauge-type torque transducer (Make: Binsfeld Engineering Inc., Maple City, MI, USA, and Model: TT10K-S) mounted on the intermediate shaft of the PTO was used to measure the torque requirement (
Figure 2). The torque sensor (strain gauge of least count of ±500 µε) was pasted on the intermediate shaft powering the spading machine. A transmitter along with an antenna was strapped on the same shaft, which was powered by a 9-volt battery. Another receiving antenna (magnetic mount) was positioned near the transmitter within six meters. The data in tabular form along with the graphical representation were available on the monitor of a computer and were recorded [
25].
Mean Clod Size
The clod size distribution was indicated in terms of mean mass diameter. The procedure for rotary tillers (Part 2) [
26] is given below:
where MMD is the mean mass diameter of soil clods; d1, d2, d3, …, dn is the representative diameter of soil clods retained on a particular sieve; A, B, C, …, N is the mass of soil retained on a particular sieve; W is the total mass of soil sample. A set of sieves for sieve analysis included 100, 63, 40, 20, 10, 4.75, 2, 1, 0.600, 0.425, 0.212, 0.150, and 0.075 mm sizes. Samples were drawn from each test plot on which the machine was operated for MMD.
Fuel Consumption
A set of two fuel meters were used in the measurement of fuel consumption. The first fuel meter was installed in between the fuel tank and the fuel pump, and the second fuel meter was installed on the return fuel line. The readings from both fuel meters were recorded during each operation, and corrected fuel consumption was determined using Equation (4). The time of operation was recorded by using a stopwatch of the least count of 0.01 s during the operation.
where:
Fcc = Corrected fuel consumption;
Fi = Fuel consumption recorded on the intake fuel line;
Fr = Return fuel recorded on the return fuel line.
Cost of Operation
The overall cost incurred in the operation of the spading machine while operating in different levels of depth and soil type was comparatively evaluated. The life of the tractor was assumed to be 15 years, and that of the tractor-operated spading machine was considered 10 years. Average annual usage was represented by the number of hours for tractor-operated spading machine operation (200 h). INR 8,00,000/– (USD 10,388.72) and INR 1,20,000/– (USD 1558.31) were taken for a 55 hp (41 kW) tractor and spading machine. The assumed average annual usage for the tractor and spading machine was 700 h and 250 h, respectively. The cost of operation was determined as per BIS (Bureau of Indian Standards) code IS (Indian Standards) 9164 [
27]. The cost of operation was estimated after incorporating fixed and variable costs of individual steps. Cost analyses were carried out using the straight-line method of depreciation (Equations (5) and (6)) [
28,
29].
where:
D = average annual depreciation, Rs/h;
P = purchase price, Rs.;
S = salvage value, taken as 10% the purchase price;
L = life of machine, years;
H = annual use of machine, hour.
where:
I = annual interest charge, Rs./year;
P = purchase price, Rs.;
S = salvage value, Rs.;
i = interest rate, per cent.
2.3.4. Statistical Analysis
The effect of independent parameters: soil types and depth of cut on various dependent parameters were analyzed using Factorial RCBD at a 5% level of significance in statistical analysis software (SAS on-demand software Version 3.0 for Academics). The probability (p-value) was assumed for its significance at p < 0.05. At p ≤ 0.05, the variation was considered significant. Tukey’s post hoc test was used to determine the relationship within and between groups.
3. Results and Discussion
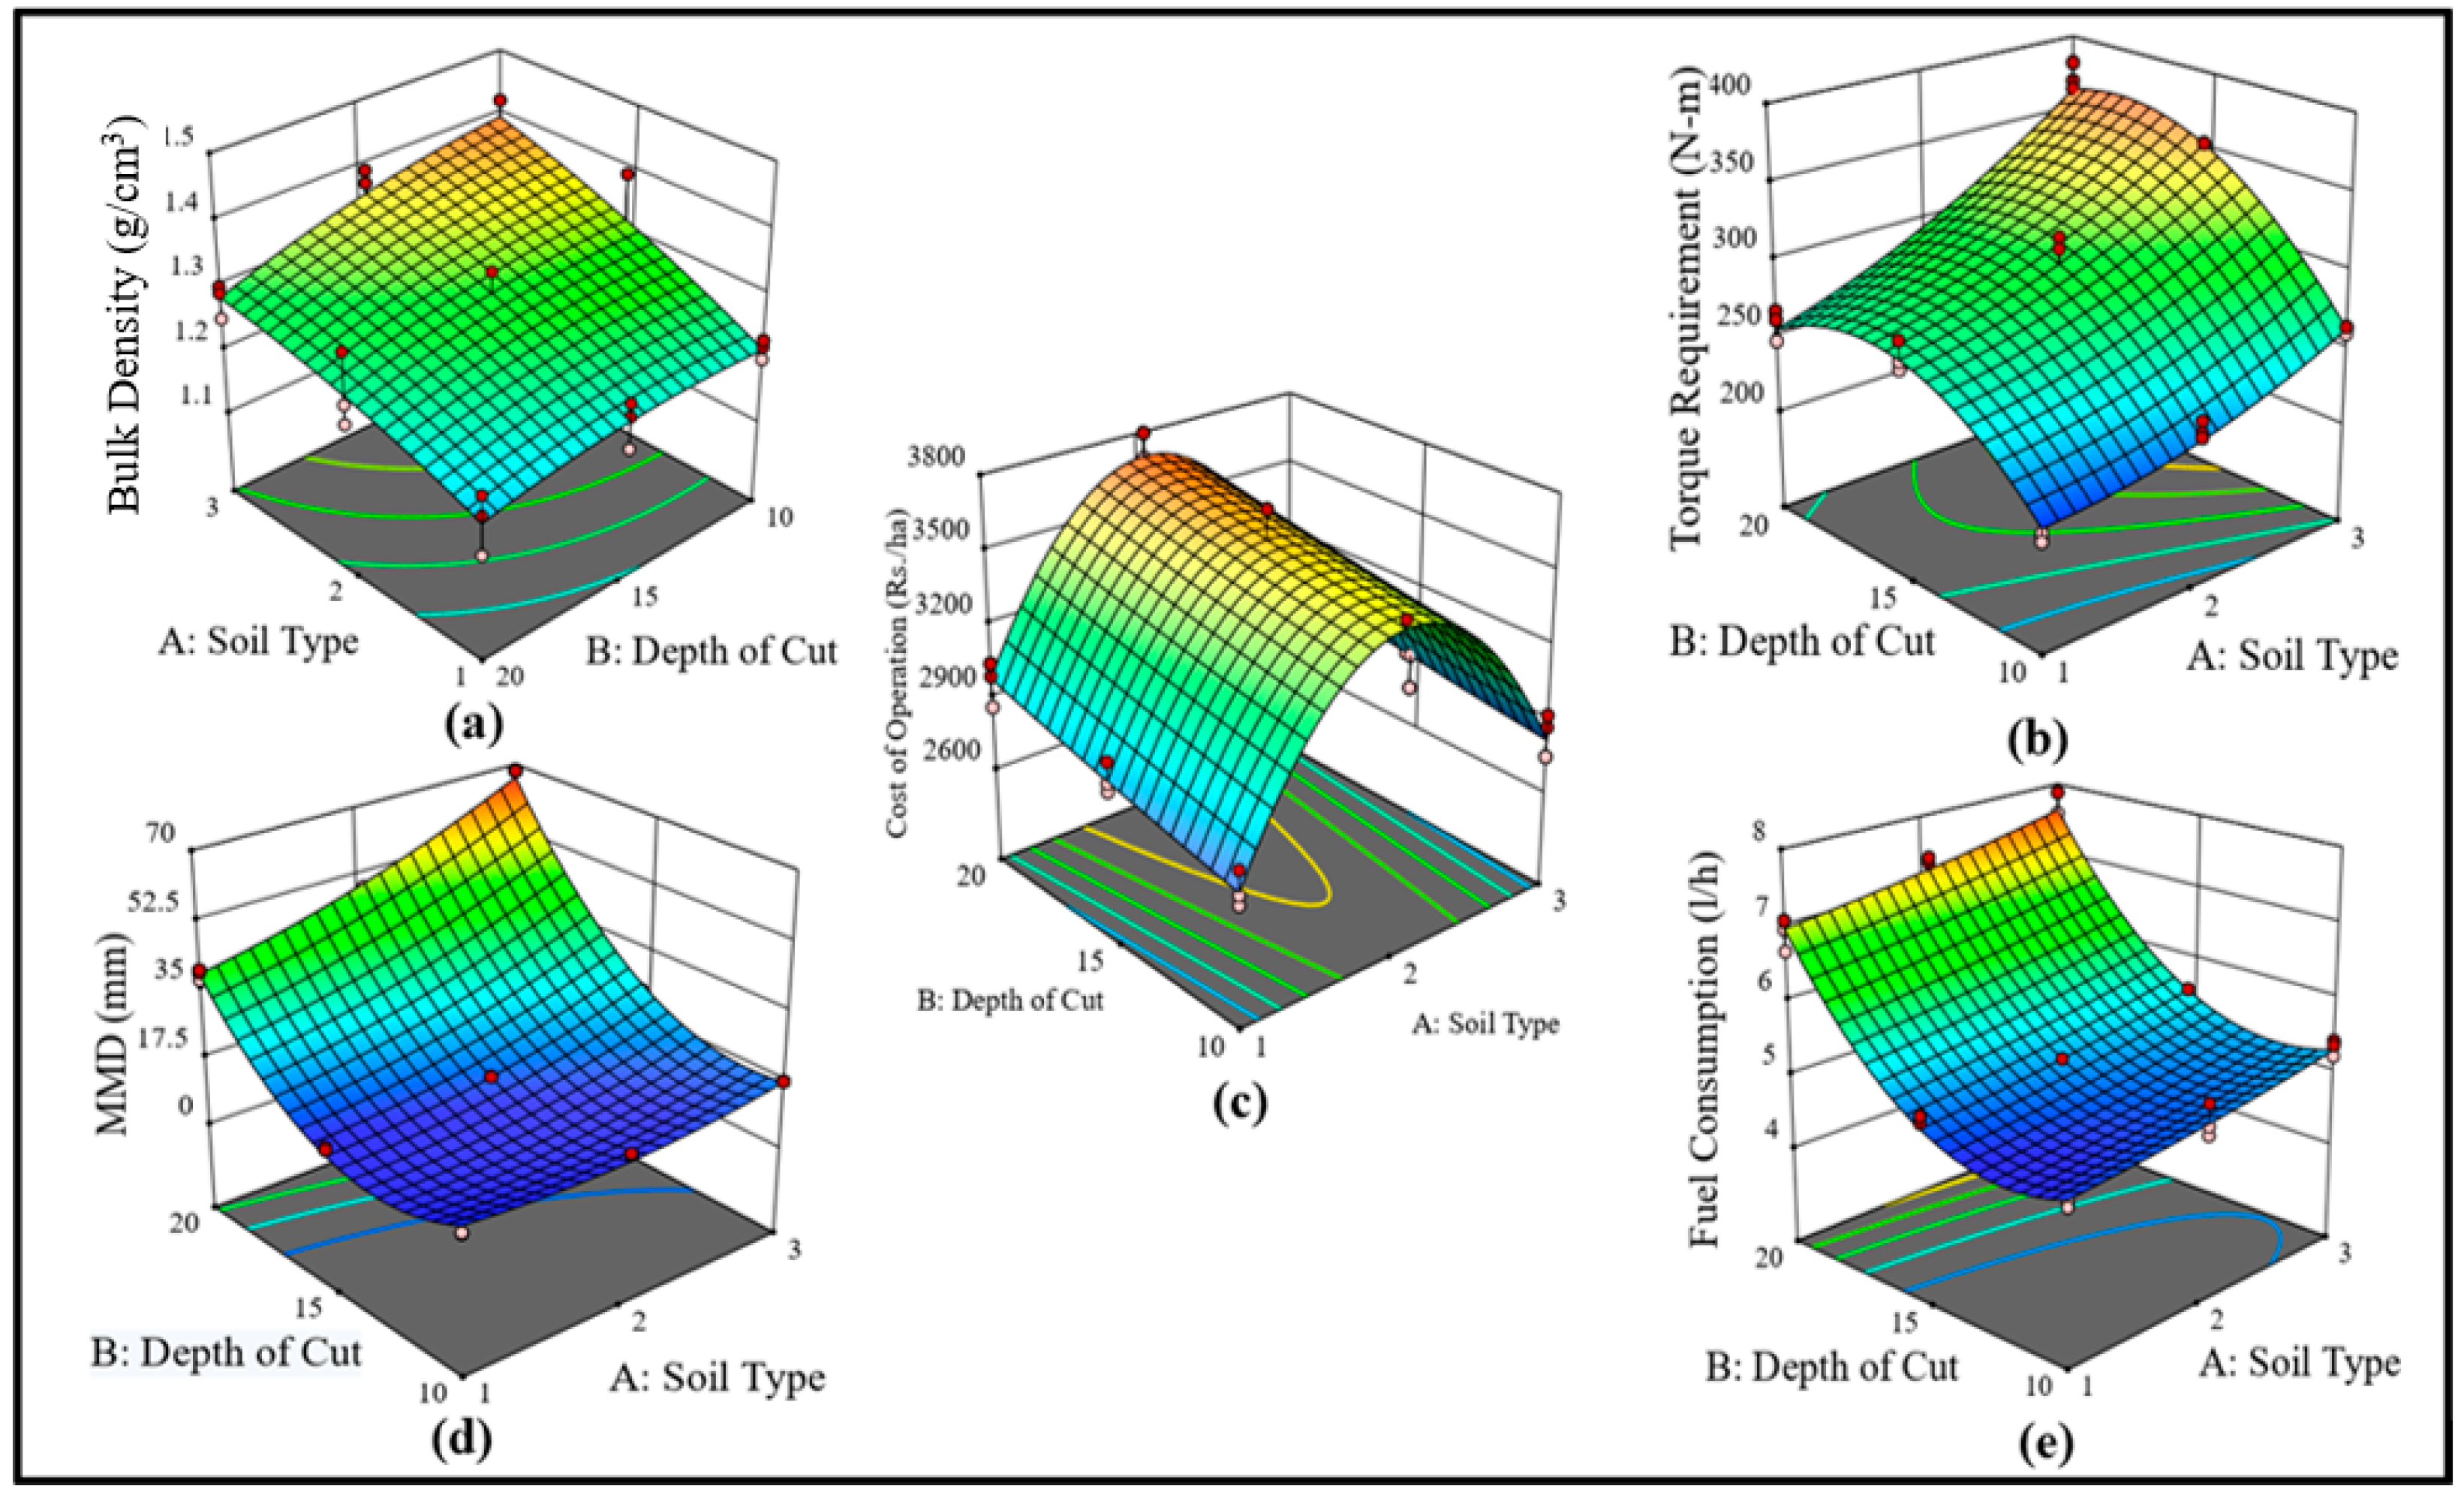
3.1. Effect of Tillage Operation on Bulk Density of Soil
The measured bulk density of soil before the operation was 1.62, 1.40, and 1.35 g/cm
3 for sandy loam soil (S1), sandy clay loam soil (S2), and loamy sand soil (S3), respectively. After the tillage operation, it was observed that there was a reduction in the bulk density of soil which ranged from 1.18 g/cm
3 (S2D1) to 1.39 g/cm
3 (S1D3). It was revealed by the statistical analysis that soil type and depth of cut had a significant effect (
p < 0.05) on the bulk density of soil before and after operation (
Table 2).
Figure 3a indicates that an increase in depth of cut increases the bulk density in all the combinations with soil types, which was also reported by Steyn et al. [
30]. This is due to the rise in depth of cut resulting in bigger clods as compared to lower depth of cuts, which results in higher bulk density [
31]. The dry bulk density of soil was inversely proportional to porosity [
32]. The observed percent reduction in bulk density was between 24.75 and 12.6%; it was less as compared to the rotavator whose percent reduction in bulk density was between 27.89% and 20.7%, which was reported by Bhambota et al. [
18].
3.2. Effect of Tillage Operation on Torque Requirement
It was observed that the torque requirement of machinery varied between 206.22 N-m (S3D1) and 344.62 N-m (S1D3). It was also revealed by the statistical analysis that soil type and depth of cut had a significant effect (
p < 0.05) on torque requirement (
Table 2). From
Figure 3b, torque was lower in loamy sand soil (S3) as compared to sandy clay loam soil (S2) and sandy loam Soil (S1) because binding forces between the soil particles in sandy soil were weaker in comparison to sandy clay loam soil and sandy loam soil, as there is weaker van der Waals force between soil particles. Therefore, sandy soil requires less energy for breaking up as compared to other soil types at similar depths and hence requires limited torque [
33]. Torque requirement increased with an increase in depth of cut in all the combinations with soil types [
34,
35]. This is due to the escalation in depth of cut resulting in bigger clods as compared to lower depth of cuts, which causes higher energy required for breaking up of the soil as compared to lower depth of cuts [
36]. The torque requirement of 400 N-m was recorded for the rotavator [
37], which was higher compared to that of the spading machine recorded during this study.
3.3. Effect of Tillage Operation on Mean Mass Diameter
Mean mass diameter was based on mean clod size determined by sieve analysis of soil. A better pulverization can be achieved with a lower mean clod size. The minimum mean clod size of 22.72 mm was recorded in the case of S2D1, while the maximum clod size value of 48.37 mm was recorded in S3D3. It is evident from
Figure 3d that mean clod size increased with an increase in the depth of cut. The statistical analysis shows that soil type and depth of cut had a significant effect (
p < 0.05) on mean mass diameter (
Table 2). The mean clod size was lower in loamy sand soil (S3) than in sandy loam soil (S1) and sandy clay loam soil (S2) because of less binding forces between the soil particles in sandy soil, whereas sandy clay loam soil has more binding forces and does not get pulverized easily, hence resulting in bigger clods [
33]. Mean clod size increased with an increase in depth of cut due to bigger clod size as compared to lower depth of cuts for all three soil types [
38]. The higher degree of pulverization from 8.57 mm to 15.36 mm was recorded in the rotavator [
39], as compared to the spading machine. Moreover, they reported that there was no significant difference observed in plant growth and dry grain weight for clod size less than 40 mm. This was due to higher working RPM as well as smaller clod sizes in the case of the rotavator. This results in over-pulverization by the rotavator, which disturbs the soil ecosystem by damaging soil-friendly organisms like earthworms, etc. [
40], whereas in spading machines, due to the F movement of spades in soil, less damage is caused to the soil ecosystem.
3.4. Effect of Tillage Operation on Soil Strength
Soil strength is based on the cone index of soil, which indicates the vertical penetration in soil. From
Figure 4, it is revealed that the minimum soil strength of 662.5 kPa was recorded and a maximum of 4714.5 kPa in sandy loam soil before operation. After tillage operation, soil strength was reduced and varied between 417.5 kPa and 3491 kPa in sandy loam soil. Similarly, it ranged from 459 kPa to 4291 kPa in sandy clay loam soil before operation, which was further reduced after tillage operation, where the minimum soil strength of 336 kPa and maximum of 3327 kPa in sandy clay loam soil was recorded. In the same way, the minimum soil strength of 578 kPa and a maximum of 2570 kPa were recorded in loamy sandy soil before operation. After tillage operation, soil strength was reduced and varied between 69 kPa and 2228 kPa in sandy loam soil.
Figure 4 majorly reveals three distinct zones, the first ranged from 0 to 17.5 cm distance of insertion, in which low soil strength was observed, due to over-pulverization by other rotary tillage tools [
39], and in the second and third zones, their spike in soil strength was observed. These zones lie in between the ranges of 17.5–25 cm and 50–65 cm distance of insertion. The presence of the hard pan occurring at 17.5 to 25 cm was due to repeated shallow cultivation by secondary tillage implements like cultivators and disc harrow, which only till up to 20–25 cm of topsoil and hard pan at 50 to 60 cm; this is all due to the heavier weight of farm machinery movement, which was also reported by Reddy [
15].
3.5. Effect of Tillage Operation on Fuel Consumption
Fuel consumption is based on a fuel flow meter which was installed in between the supply line and engine, which indicates the economics of a spading machine. It was observed that the fuel consumption of machinery varied between 13.60 l/ha (S1D1) and 21.83 l/ha (S3D3).
Figure 3e shows that the maximum fuel consumption was recorded for sandy clay loam (S2) soil and the minimum for sandy loam (S1) soil. It is also observed that fuel consumption was lower at a low depth of cut (D1) as compared to a higher depth of cut (D2 and D3) because at higher depths, the soil resistance was high. To overcome the resistance offered by soil, additional power was required, which resulted in higher fuel consumption. Karparvarfard and Koushkaki [
41] also reported that fuel consumption increases with an increase in the depth of cut during tillage operation. Loamy sand soil offers the least soil resistance but shows higher fuel consumption in comparison with sandy loam soil. This may be due to wheel slippage and lower field efficiency observed during the experiment, and the same result was also reported by Oduma [
42]. This leads to higher slippage in tires, which requires more energy for doing the same amount of work as compared to in sandy loam soil [
43]. The statistical analysis shows that the individual effect of soil type and depth of cut had a significant effect (
p < 0.05) on fuel consumption (
Table 2), whereas no significant difference was found between the rotavator which was reported by [
44] and the present study.
3.6. Effect of Tillage Operation on Cost of Operation
The cost of operation varies with changes in soil type and depth of cut. The minimum cost of operation of 2670.37 INR/ha (34.71 USD/ha) was recorded in the case of S1D1 and a maximum of 3635.87 INR/ha (47.27 USD/ha) for S2D3.
Figure 3c shows that the maximum cost of operation was recorded for sandy clay loam soil and the minimum for sandy loam soil for all three depths. The cost of operation was lower at a low depth of cut (D1) as compared to a higher depth of cut (D2 and D3). However, no significant variation was observed in the operational cost of the spading machine (
Table 3).
3.7. Comparison between Spading Machine and Various Primary Tillage Tools
The outcome of the above study was compared with other popular tillage tools, i.e., a mouldboard plough, disc plough, and rotary tillage tool (Rotavator). The bulk density, power requirement, mean clod size, fuel consumption, and cost of operation were compared in
Table 3. As compared to the spading machine, bulk density of soil was 16.3%, 13.8%, and 13% higher in the disc plough, rotary tillage tool, and mouldboard plough, respectively. Similarly, more fuel consumption (l/ha) was reported for the mouldboard plough (36%), disc plough (37.7%), and rotary tillage tool (1.27%) than the spading machine. Higher mean clod size (mm) was reported for the mouldboard plough (48%) and disc plough (15.7%), whereas a lower mean clod size was reported for the rotary tillage tool (60.5%) than that observed for the spading machine. A similar trend was also observed for the cost of operation, where a higher cost of operation was recorded for the mouldboard plough (60.5%), disc plough (54.6%), and less for the rotary tillage tool (14.8%) than that for the spading machine.
4. Conclusions
The bulk density, mean clod size, soil strength, torque requirement, fuel consumption, and cost of operation varied from 1.18 to 1.39 g/cm3, 22.72 to 27.37 mm, 417.5 to 4714.5 kPa, 258.24 to 317.59 N-m, 4.76 to 5.33 l/h, and 2747.64 (35.72) to 2964.31 (38.54) INR/ha (USD/ha), respectively, in sandy loam soil. In sandy clay loam soil, bulk density, mean clod size, soil strength, PTO torque fuel consumption, and cost of operation ranged from 1.18 to 1.27 g/cm3, 29.22 to 48.37 mm, 336 to 4291 kPa, 274.13 to 344.62 N-m, 6.89 to 7.64 l/h, and 3450.72 (44.86) to 3714.03 (48.28) INR/ha (USD/ha), respectively. The bulk density, mean clod size, soil strength, PTO torque fuel consumption, and cost of operation varied from 1.21 to 1.28 g/cm3, 22.86 to 29.91 mm, 69 to 2570 kPa, 206 to 261.84 N-m, 5.09 to 5.48 l/h, and 2845.41 (36.99) to 3004.33 (39.06) INR/ha (USD/ha), respectively, in sandy soil. The bulk density, mean clod size, torque requirement, and fuel consumption increase with increases in depth of cut for all soil types. However, there is no significant difference in the cost of operation due to both depths of cuts and soil types. The rotavator shows a higher degree of pulverization as compared to spading machines due to higher working RPM as well as smaller clod sizes. This results in over-pulverization by rotavators, which disturbs the soil ecosystem by damaging the soil-friendly organisms like earthworms, etc., whereas spading machines, due to the movement of spades in soil, cause lesser damage to the soil ecosystem. As the spading machine is a negative draft machine, it consumes comparatively less power than that of conventional tillage implements. From the above study, it was concluded that primary tillage by using a spading machine was found suitable and more economical for all depths of cut. Due to its advantages, it is the most appropriate tool for primary tillage for sustainable agricultural goals.
Author Contributions
Conceptualization, methodology, N.K.S., B.D., G.S.M., D.S.P., A.S. and A.E.; formal analysis, N.K.S. and B.D.; investigation, N.K.S., B.D., G.S.M., D.S.P., A.S. and A.E.; resources, B.D. and G.S.M.; writing—original draft preparation, N.K.S. and B.D., writing—review and editing, B.D., G.S.M., D.S.P., A.S. and A.E.; supervision, G.S.M.; funding acquisition, B.D. and G.S.M. All authors have read and agreed to the published version of the manuscript.
Funding
This research received no external funding.
Institutional Review Board Statement
Not applicable.
Informed Consent Statement
Not applicable.
Data Availability Statement
The datasets used and/or analyzed during the current study are available from the corresponding author upon reasonable request.
Acknowledgments
This research was supported by ICAR, New Delhi, under the Project AICRP on FIM, for prototype feasibility testing of spading machines in Punjab. We are thankful to the Department of Farm Machinery and Power Engineering, PAU, Ludhiana, for providing facilities for conducting the research.
Conflicts of Interest
The authors declare no conflicts of interest.
References
- Kushwaha, R.L.; Shen, J. Finite element analysis of the dynamic interaction between soil and tillage tool. Trans. ASAE 1995, 38, 1315–1319. [Google Scholar] [CrossRef]
- Yang, X.; Zhang, K.; Chang, T.; Shaghaleh, H.; Qi, Z.; Zhang, J.; Ye, H.; Hamoud, Y.A. Interactive Effects of Microbial Fertilizer and Soil Salinity on the Hydraulic Properties of Salt-Affected Soil. Plants 2024, 13, 473. [Google Scholar] [CrossRef] [PubMed]
- Liu, J.; Wang, Y.; Li, Y.; Peñuelas, J.; Zhao, Y.; Sardans, J.; Tetzlaff, D.; Liu, J.; Liu, X.; Yuan, H.; et al. Soil ecological stoichiometry synchronously regulates stream nitrogen and phosphorus concentrations and ratios. CATENA 2023, 231, 107357. [Google Scholar] [CrossRef]
- Yi, J.; Li, H.; Zhao, Y.; Shao, M.; Zhang, H.; Liu, M. Assessing soil water balance to optimize irrigation schedules of flood-irrigated maize fields with different cultivation histories in the arid region. Agric. Water Manag. 2022, 265, 107543. [Google Scholar] [CrossRef]
- Chandan, A.; John, M.; Potdar, V. Achieving UNSDGs in food supply chain using blockchain technology. Sustainability 2023, 15, 2019. [Google Scholar] [CrossRef]
- Kroll, C.; Warchold, A.; Pardhan, P. Sustainble development goals (SDGs): Are we successful in turning trade offs into synergies? Palgrave Commun. 2019, 5, 140. [Google Scholar] [CrossRef]
- Rahman, S.; Chen, Y. Laboratory investigation of cutting forces and soil disturbance resulting from different manure incorporation tools in a loamy sand soil. Soil Tillage Res. 2001, 58, 19–290. [Google Scholar] [CrossRef]
- Kurstjens, D.A.G. Precise tillage systems for enhanced non-chemical weed management. Soil Tillage Res. 2007, 97, 293–305. [Google Scholar] [CrossRef]
- Mahal, J.S.; Manes, G.S.; Prakash, A.; Singh, M.; Dixit, A. Study on Blade Characteristics of Commercially Available Rotavators in Punjab. Agric. Engg. Today 2012, 36, 8–11. [Google Scholar]
- Pereira, J.O.; De’fossez, P.; Richard, G. Soil susceptibility to compaction by wheeling as a function of some properties of a sandy soil as affected by the tillage system. Eur. J. Soil Sci. 2007, 58, 34–44. [Google Scholar] [CrossRef]
- Nicoleta, U.; Valentin, V.; Sorin-Ștefan, B.; Dan, C.; Daniel, I.V.; Neluș-Evelin, G.; Ioan, C. Influence of the number of passes on soil on compaction—A Review. In Proceedings of the 6th International Conference on Thermal Equipment, Renewable Energy and Rural Development (TE-RE-RD), Moieciu de Sus, Romania, 8–10 June 2017; pp. 459–464. [Google Scholar]
- Schneider, F.; Don, A. Root-restricting layers in German agricultural soils. Part I: Extent and cause. Plant Soil 2019, 442, 433–451. [Google Scholar] [CrossRef]
- Nicoleta, U.; Valentin, V.; Sorin-Stefan, B.; Mihai, M. Research in distribution of pressure in soil depth under wheels of different machines. In Proceedings of the 17th International Scientific Conference Engineering for Rural Development, Jelgava, Latvia, 23–25 May 2018; pp. 324–349. [Google Scholar] [CrossRef]
- Sarkar, D. Soil Phosphorus Availability and Its Impact on Surface Water Quality; John Wiley & Sons: Hoboken, NJ, USA, 2005. [Google Scholar] [CrossRef]
- Reddy, P.P. Agricultural Soil Compaction. In Sustainable Intensification of Crop Production; Springer: Singapore, 2016; pp. 41–52. [Google Scholar] [CrossRef]
- Zhu, G.; Yong, L.; Zhao, X.; Liu, Y.; Zhang, Z.; Xu, Y.; Wang, L. Evaporation, infiltration and storage of soil water in different vegetation zones in the Qilian Mountains: A stable isotope perspective. Hydrol. Earth Syst. Sci. 2022, 26, 3771–3784. [Google Scholar] [CrossRef]
- Wasaya, A.; Yasir, T.A.; Ijaz, M.; Ahmad, S. Tillage effects on agronomic crop production. Agron. Crops Vol. 2 Manag. Pract. 2019, 2, 73–99. [Google Scholar]
- Bhambota, S.; Manes, G.S.; Prakash, A.; Dixit, A. Effect of blade shape and rotor speed on pulverization and mixing quality in sandy loam soil. Agric. Res. J. 2017, 54, 394–397. [Google Scholar] [CrossRef]
- Manian, R.; Kathirvel, K. Development and evaluation of an active—Passive tillage machine. Agric. Mech. Asia Afr. Lat. Ame. 2001, 32, 9–18. [Google Scholar]
- McLaughlin, N.B.; Drury, C.F.; Reynolds, W.D.; Yang, X.M.; Li, Y.X.; Welacky, T.W.; Stewart, G. Energy inputs for conservation and conventional primary tillage implements in a clay loam soil. Trans. ASABE 2008, 51, 1153–1163. [Google Scholar] [CrossRef]
- Anonymous. Ground Water Information Booklet Ludhiana District, Punjab; Central Ground Water Board, Ministry of Water Resources, Government of India, North Western Region: Chandigarh, India, 2013. [Google Scholar]
- El-Tarhuny, M.; Fouda, T.; Billaid, A. Effect of reduces tillage systems on Sorghum yield under soil Libyan conditions. Misr. J. Agric. Engg. 2005, 22, 610–623. [Google Scholar]
- Anonymous. 1975 IS 2720-29-Methods of Test for Soils, Part 29: Determination of Dry Density of Soils In-Place by the Core-cutter Method (BIS Testing Codes). Available online: https://ia803000.us.archive.org/32/items/gov.in.is.2720.29.1975/is.2720.29.1975.pdf (accessed on 17 February 2024).
- Ani, O.; Constantine, M. Development of a Digital Cone Penetrometer. J. Agric. Engg. Technol. 2008, 16, 83–92. [Google Scholar]
- Kahlon, M.; Chawla, K. Effect of tillage practices on least limiting water range in Northwest India. Int. Agrophysics 2017, 31, 183–194. [Google Scholar] [CrossRef]
- Anonymous. Technical Series, Regional Network for Agricultural Machinery. 1983, p. 297. Available online: https://eurekamag.com/research/001/241/001241771.php (accessed on 17 February 2024).
- Bureau of Indian Standards (1979) IS 9164: Guide for Estimating Cost of Farm Machinery Operation. Available online: https://archive.org/details/gov.in.is.9164.1979 (accessed on 17 February 2024).
- Hunt, D. Farm Power and Machinery Management; Iowa State University Press: Ames, Iowa, 1977. [Google Scholar]
- Singh, N.K.; Narang, M.K.; Thakur, S.S.; Singh, M.; Singh, S.K.; Prakash, A. Influence of transplanting techniques and age of wash root type seedlings on planting attributes of paddy rice. Cogent Food Agric. 2023, 9, 2176978. [Google Scholar] [CrossRef]
- Steyn, J.; Tolmay, J.P.C.; Human, J.J.; Kilian, W.H. The effects of tillage systems on soil bulk density and penetrometer resistance of a sandy clay loam soil. S. Afr. J. Plant Soil 1995, 12, 86–90. [Google Scholar] [CrossRef]
- Ahmadi, H.; Mollazade, K. Effect of plowing depth and soil moisture content on reduced secondary tillage. Agric. Engg. Int. CIGR E J. 2009, 11, 1–9. [Google Scholar]
- Kokenková, L.; Urík, M. Soil moisture and its effect on bulk density and porosity of intact aggregates of three Mollic soils. Ind. J. Agric. Sci. 2012, 82, 172–176. [Google Scholar]
- Hu, F.; Xu, C.; Li, H.; Li, S.; Yu, Z.; Li, Y.; He, X. Particles interaction forces and their effects on soil aggregates breakdown. Soil Tillage Res. 2015, 47, 1–9. [Google Scholar] [CrossRef]
- Marenya, M.O.; Plessis, H.L.M. Torque Requirements and Forces Generated by a Deep Tilling Down-Cut Rotary Tiller. Ann. ASABE Meet. Present. 2006, 061096. [Google Scholar] [CrossRef]
- Hendrick, J.G.; Gill, W.R. Rotary Tiller Design Parameters Part II-Depth of Tillage. Trans. ASAE 1971, 14, 675–678. [Google Scholar] [CrossRef]
- Johnson, C.E.; Buchele, W.F. Energy in Clod-Size Reduction of Vibratory Tillage. Trans. ASAE 1969, 12, 371–374. [Google Scholar] [CrossRef]
- Vignesh, M.; Muruganandhan, R.; Dasari, N.; Nagarajan, M. Study of Torsional Response on the Rotor Shaft of a Rotavator under Transient Load Conditions. National Conference on Trends in Automotive Parts Systems and Applications (TAPSA-2015) 20–21 March, Coimbatore, India. Int. J. Innov. Res. Sci. Eng. Technol. 2015, 4, 185–190. [Google Scholar]
- Ismail, Z.E. Soil response to tillage treatments. Agric. Mech. Asia Afr. Lat. Ame. 2009, 40, 9–14. [Google Scholar] [CrossRef]
- Bhambota, S.; Manes, G.S.; Prakash, A.; Dixit, A. Effect of Blade Shape and Rotor Speed of Rotavator on Pulverization and Mixing Quality of Soil. Agric. Eng. Today 2014, 38, 25–30. [Google Scholar]
- Blouin, M.; Hodson, M.E.; Delgado, E.A.; Baker, G.; Brussaard, L.; Butt, K.R.; Dai, J.; Dendooven, L.; Peres, G.; Tondoh, J.E.; et al. A review of earthworm impact on soil function and ecosystem services. Eur. J. Soil Sci. 2013, 64, 161–182. [Google Scholar] [CrossRef]
- Karparvarfard, S.H.; Rahmanian-Koushkaki, H. Development of a fuel consumption equation: Test case for a tractor chisel-ploughing in a clay loam soil. Biosys. Eng. 2015, 130, 23–33. [Google Scholar] [CrossRef]
- Oduma, O.; Oluka, S.I.; Eze, P.C. Effect of soil physical properties on performance of Agricultural field machinery in south eastern Nigeria. Agric. Eng. Int. CIGR 2018, 20, 25–31. [Google Scholar]
- Damanauskas, V.; Janulevičius, A.; Pupinis, G. Influence of Extra Weight and Tire Pressure on Fuel Consumption at Normal Tractor Slippage. J. Agric. Sci. 2015, 7, 55–67. [Google Scholar] [CrossRef]
- Prakash, A.; Manes, G.S.; Dixit, A.; Singh, M. Performance Status of Rotavators being manufactured in Punjab. J. Inst. Eng. India Ser. A 2013, 94, 53–58. [Google Scholar] [CrossRef]
- Sarauskis, E.; Buragiene, S.; Romaneckas, K.; Sakalauskas, A.; Jasinskas, A.; Vaiciukevicius, E.; Karayel, D. Working time, fuel consumption and economic analysis of different tillage and sowing systems in Lithuania. Eng. Rural. Dev. 2012, 11, 52–59. [Google Scholar]
- Nassir, A.J. The effect of tillage methods on energy pulverization requirements under various operating conditions in silty loamy soil. Thi.-Qar Univ. J. Agric. Res. 2017, 6, 55–73. [Google Scholar]
- Akanksha, K.; Pateriya, R.N.; Sharma, R.K.; Ashish, C.; Bhattacharya, T.K. A study on torque requirement of rotavator with ADI blades in soil bin condition. Int. J. Basic Appl. Agric. Res. 2017, 15, 179–185. [Google Scholar]
- Parmar, R.P.; Gupta, R.A. Performance Evaluation of Pulverizing Attachment to Tractor drawn Cultivator on Soil Properties. Agric. Eng. Today 2018, 42, 37–41. [Google Scholar]
| Disclaimer/Publisher’s Note: The statements, opinions and data contained in all publications are solely those of the individual author(s) and contributor(s) and not of MDPI and/or the editor(s). MDPI and/or the editor(s) disclaim responsibility for any injury to people or property resulting from any ideas, methods, instructions or products referred to in the content. |
© 2024 by the authors. Licensee MDPI, Basel, Switzerland. This article is an open access article distributed under the terms and conditions of the Creative Commons Attribution (CC BY) license (https://creativecommons.org/licenses/by/4.0/).


 ,
, 


