Article

Analysis of the Impact of U.S. Trade Policy Uncertainty on China’s Grain Trade

1
Research Center for Land Policy, School of Law and Humanities, China University of Mining and Technology-Beijing, Beijing 100083, China
2
State Key Laboratory of Resources and Environmental Information System, Institute of Geographical Sciences and Natural Resources Research, Chinese Academy of Sciences, Beijing 100101, China
*
Author to whom correspondence should be addressed.
Sustainability 2024, 16(11), 4332; https://doi.org/10.3390/su16114332
Submission received: 7 April 2024 / Revised: 16 May 2024 / Accepted: 16 May 2024 / Published: 21 May 2024
(This article belongs to the Special Issue Agri-Food Economics and Rural Sustainable Development)

Abstract

:
U.S. trade protectionism has frequently risen recently, and trade policy fluctuations have become increasingly significant. In this context, examining the impact of U.S. trade policy uncertainty on China’s grain trade is of great significance to China’s response to changes in the international trade situation, guaranteeing national food security and promoting sustainable agricultural development. From the statistical data, the U.S. trade policy uncertainty and China’s grain imports primarily show a reverse trend, and China’s grain exports show a positive trend. To further explore the impact of U.S. trade policy uncertainty on China’s grain trade, this study selects the monthly data from July 2003 to December 2022. It conducts impulse response analysis by constructing a vector autoregressive model with stochastic volatility. It is found that the impact of U.S. trade policy uncertainty on China’s grain trade has prominent time-varying characteristics and point-in-time effects, and the impact on different kinds of grain is heterogeneous. In this regard, China needs to clarify the nature of the trade dispute between China and the United States, reasonably utilize the multilateral coordination mechanism of the WTO, coordinate the international and domestic markets, adjust the short board of grain trade, and safeguard the sustainable development of Chinese agriculture.

1. Introduction

In April 2023, the Agricultural Trade Promotion Center of the Ministry of Agriculture and Rural Development of the People’s Republic of China released the China Agricultural Outlook Report (2023–2032), which suggests that “in the next ten years, food imports will continue to play an important role in optimizing the domestic supply structure and adjusting surplus and deficit”. In the context of the food security strategy for the new period, supplementing domestic food demand through international food trade plays an indispensable role in easing the structural imbalance between food supply and demand in China [1,2]. According to the General Administration of Customs of the People’s Republic of China, China’s grain imports show a fluctuating upward trend from 2011 to 2022, of which from 2011 to 2015, China’s grain imports continuously grew and remained at a high level of more than 14 million tons from 2020 to 2022 [3]. The United States is the world’s largest food exporter [4,5]. With the gradual opening of China’s grain trade market and the continuous expansion of the scale of grain trade, China has gradually become the world’s largest grain importer. In January 2022, the Ministry of Agriculture and Rural Affairs of the People’s Republic of China, on the issuance of the “14th Five-Year Plan” for International Cooperation in Agriculture and Rural Areas, proposed to “promote the resumption of the China-US agricultural dialog and exchange at the appropriate time and as appropriate, and deepen exchanges and cooperation between the two sides in the areas of policy exchanges, personnel exchanges, digital agriculture, agricultural response to climate change, sustainable development, food safety, animal and plant inspection and quarantine, and many other areas of exchanges and cooperation”. According to China’s General Administration of Customs, from 2000 to 2016, the United States was China’s largest net importer of bulk agricultural products, and from 2017 to 2022, the United States steadily ranked among the top two sources of China’s agricultural imports. U.S. imports account for 37.3% of China’s total grain imports in 2021 [3]. According to data from the U.S. Department of Agriculture’s Foreign Agricultural Service, China is firmly in the top two countries of U.S. agricultural export destinations from 2009 to 2021 [6], with soybeans being the main agricultural product exported from the U.S. to China [7]. Therefore, changes in U.S. trade policy are bound to impact China’s agricultural market [8]. Food security is the top priority for the country’s economy and people’s livelihood, and there can be no room for paralysis on this issue [9]. Therefore, in the context of the deepening trade conflicts between China and the United States, the escalating conflict between Russia and Ukraine, and the tense international food supply, re-examining the impact of the uncertainty of U.S. trade policy on China’s food trade is of great practical significance for preventing the economic and political risks of food imports, grasping the scale and rhythm of food imports, promoting the diversification of the pattern of food import channels, grasping the initiative of food security, and keeping the bottom line of food security. Currently, research on the impact of U.S. trade policy uncertainty on China’s grain trade is mainly focused on qualitative and straightforward quantitative analysis, and it cannot quantify U.S. trade policy uncertainty in an index and conduct systematic quantitative research. At the same time, the assumption basis of the existing quantitative research is often based on linearity, lacking empirical analysis based on nonlinear assumptions [10,11]. Since the impact of trade policy uncertainty on agricultural trade markets tends to have different mechanisms of action under different policy states, the conclusions obtained from the examination based on linear assumptions are less persuasive. In contrast, using nonlinear models to portray the market impact of trade policy uncertainty is more persuasive. This paper uses the monthly data of U.S. trade policy uncertainty and China’s primary grain import and export volume from July 2003 to December 2022, constructs Time Varying Parameter-Stochastic Volatility-Vector Auto Regression (TVP-SV-VAR) model, analyzes the stage-by-stage, point-by-point, and differential impacts of the U.S. trade policy uncertainty on China’s grain trade, and puts forward the policy insights to reduce the risk of grain trade, safeguard the security of grain supply, and then safeguard the sustainable development of the economy in conjunction with the empirical results.

2. Literature Review

2.1. Study on Factors Affecting Food Trade

Studies on food trade factors can be broadly categorized into macro and micro. Regarding the macro dimension, academic findings have focused on factors such as economic development, political and policy environment, population size, and spatial distance of the trading parties. In this regard, early and recent studies have similar conclusions. Some early studies introduced the gravity model into international trade, pointing out that the size of bilateral trade flows is inversely proportional to geographic distance and positively proportional to their respective levels of economic development [12]. On this basis, many recent studies on the influencing factors of China’s grain trade have also found that the positive development of both sides of the trade in terms of the level of economic development, the size of the population, the degree of cultural diffusion, and whether or not to join the World Trade Organization (WTO), etc., will cause a significant promotion of bilateral grain trade [13,14]. In contrast, deepening the degree of both sides of the trade in terms of the distance of transportation, the level of difference in per capita income, sudden financial crises, etc., will significantly negatively impact bilateral food trade [15,16], confirming the conclusions of earlier studies. Other scholars have examined the relationship between the RMB exchange rate and food exports, concluding that RMB appreciation and exchange rate fluctuations will lead to an increase in food prices, reduce the international competitiveness of domestic food, and inhibit food exports, while RMB depreciation can improve the international competitiveness of China’s food and promote food exports [17,18]. In addition, with the increasingly complex international political and economic environment, recent studies have paid more attention to the impact of trade policies on food trade. Some scholars have analyzed the risks facing China’s food supply and found that the “food embargo” policy of food-exporting countries will narrow the scope of China’s choice of import source countries, negatively impacting China’s short-term food imports [19]. Existing research mainly examines the factors affecting supply and demand in the micro dimension. Some scholars have analyzed grain trade using the constant market share model (CMS), pointing out that the import gravitational and structural effects are the two main elements affecting grain imports [20,21]. Along this line, Scholars have confirmed that the information available to both sides of the trade, bargaining power, the scale of import demand, the growth rate of supply, labor costs and production costs are important factors affecting the fluctuation of grain trade [22,23].

2.2. Research on U.S. Trade Policy Uncertainty

U.S. trade policy refers to all the actions of the U.S. government to influence the international economy, either as a direct influence or as an adjustment to the international economic environment [24,25]. Uncertainty refers to the unpredictability of a particular thing or situation’s nature, state, and trend, including the uncertainty of economic trends and unknown changes in market demand [26,27]. U.S. trade policy uncertainty refers to a series of related trade policies introduced or introduced by the U.S. to protect its interests, which have uncertainty [26,28]. For example, in January 2017, President Donald Trump announced that he was withdrawing from the Trans-Pacific Partnership (TPP), citing it as “a potential threat to the United States” and stating that he would “begin negotiating fair bilateral trade agreements to bring jobs and industry back to the United States” to replace it. In July 2018, the Trump administration invoked Section 301 (Section 301 of the U.S. Trade Act of 1974) to impose tariffs on Chinese imports in the name of “national security” [29,30]. In 2019, Trump announced another 7.5% tariff on USD 120 billion Chinese goods.
The uncertainty of the trade policy implemented by the United States is mainly affected by its domestic and international political and economic changes. The existing research on U.S. trade policy uncertainty includes theoretical and empirical studies. Regarding theoretical research, it mainly involves the characteristics and effects of changes in U.S. trade policy. Some scholars have analyzed the change in the direction of U.S. trade policy from multilateralism to unilateralism and trade liberalism to trade protectionism since January 2017. The study found that the United States believes that China has been restricting its food imports through the management of tariff quotas and thus points the finger at China for the change in trade policy [31,32]. The object of policy protection is more inclined to “workers”; the scope of protection is extended to the field of factor flows. This policy aims to try to maintain the monopoly position and competitiveness of its advantageous industries in the international market to alleviate the impact of the economic crisis and globalization on the domestic market [33]. Existing research findings generally agree that the rise of U.S. trade protectionism policy changes not only interrupts the integrity of the U.S. domestic industry supply chain, hindering the industry’s overall development, but also deteriorates the relationship with trading partners, accelerating the process of anti-globalization [34,35]. From the empirical point of view, the existing research mainly focuses on the impact and influence of U.S. trade policy changes on China. Scholars have empirically analyzed the impact of the U.S.–China trade dispute on the overall export competitiveness of China’s high-tech products and found that changes in U.S. trade policy negatively inhibit China’s export competitiveness in the ICT industry [36,37]. The spillover effects of U.S. trade policy uncertainty on China’s macroeconomy also suggest that an increase in U.S. trade policy uncertainty would exacerbate the rise in China’s macro leverage and the significant decline in China’s aggregate output and real investment [38,39,40].
With the changes in China’s grain trade situation in recent years, some scholars have begun to pay attention to the impact of U.S. trade policy uncertainty on the volatility of China’s grain prices and have reached different conclusions. Some studies have found that U.S. trade policy uncertainty has a mainly positive impact on soybean prices and a mainly negative impact on corn, wheat, and rice prices [41]. Conversely, some studies have found that U.S. trade policy uncertainty has mainly negative impacts on soybean and corn prices [42] and positively on wheat prices [43]. The reason may be that the impact of U.S. trade policy uncertainty on China’s grain prices has time-varying characteristics, i.e., the degree and direction of the impact vary in different periods; moreover, the conclusions of the different studies are different because of the different study intervals, sample sizes, variable indicators, and econometric models selected by the different studies.
To summarize, existing research has conducted rich studies on the factors influencing food import and export trade. It has paid attention to the impact of U.S. trade policy uncertainty on food trade, and the relevant empirical analyses have concluded constructive significance. However, the current research still has the following space. First, the existing research is mainly on the impact of U.S. trade policy uncertainty on food prices. At the same time, few time-varying and time-point impulse response analyses have been conducted on the volatility state of food trade volume. Second, there is little literature on the conduction path and role mechanism of U.S. trade policy uncertainty affecting China’s food trade to sort out. Therefore, this paper first clarifies the transmission mechanism of U.S. trade policy uncertainty affecting China’s grain trade and, on this basis, adopts the vector autoregressive model with stochastic fluctuations (TVP-SV-VAR) model to examine the time-varying and shock effects of U.S. trade policy uncertainty on China’s grain imports and exports. The aim is to accurately grasp the time-varying impact of U.S. trade policy uncertainty on the volatility of China’s grain imports and exports to provide valuable references for China’s grain production and trade policy decisions.

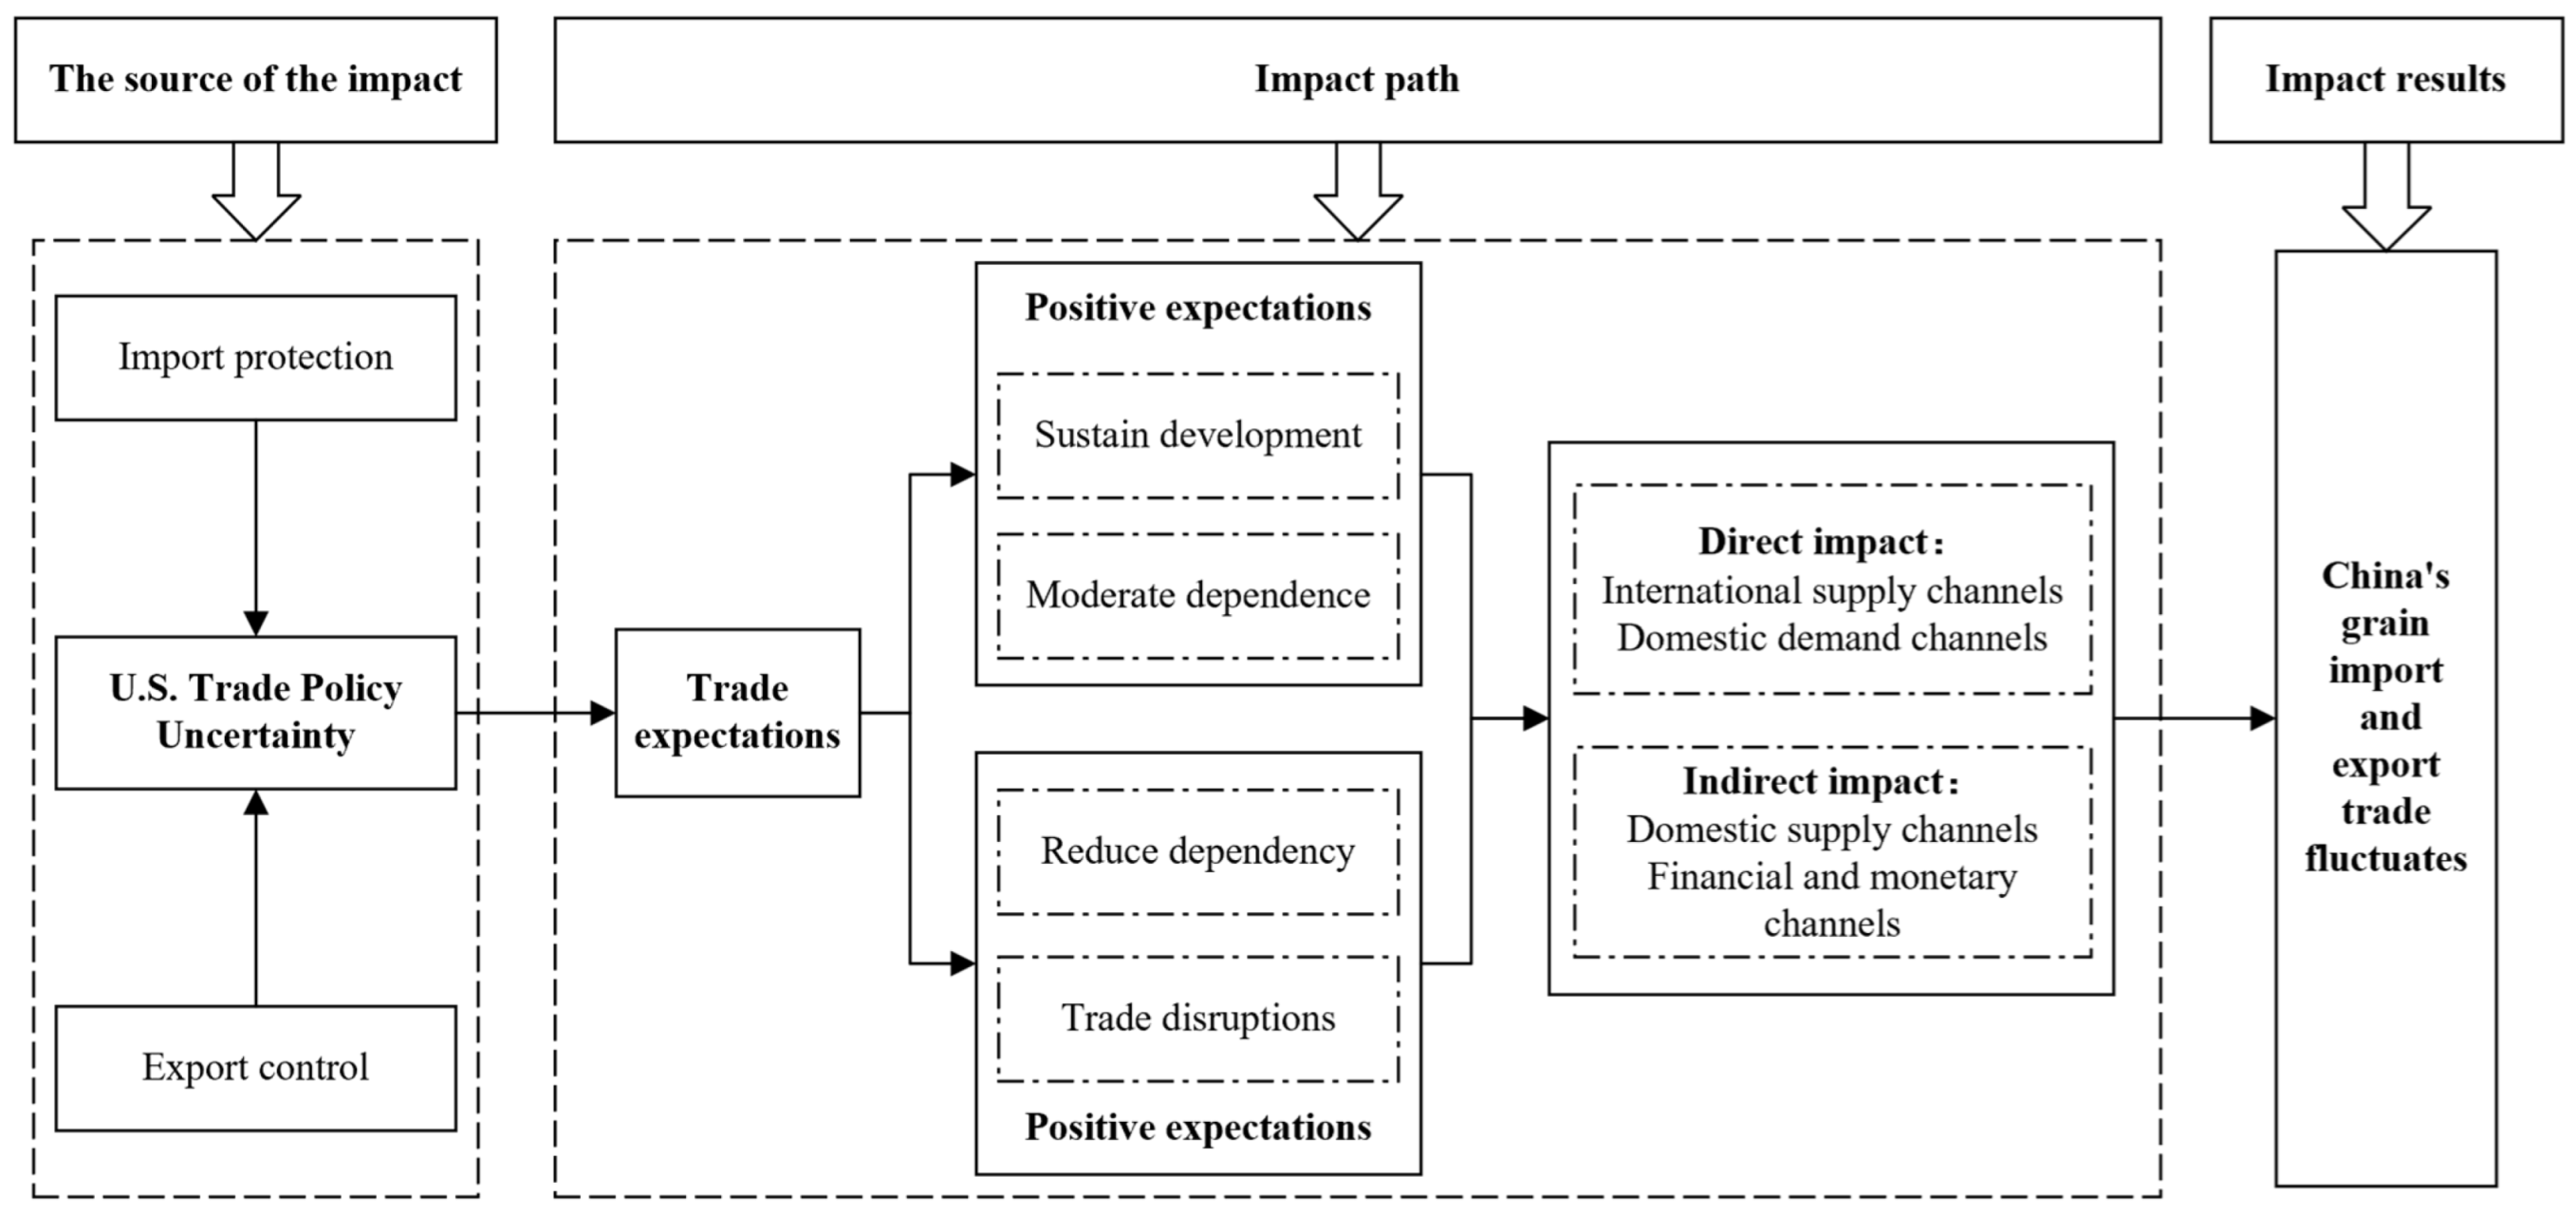
3. Analytical Framework and Theoretical Assumptions

Indeed, the WTO has a modern Dispute Settlement System (DSS) that can open up new markets, lower trade barriers, and create a stable trading environment for countries worldwide [44,45]. Still, it is skewed towards developed countries with more resources and influence [46]. In January 2018, the Office of the U.S. Trade Representative released the 2017 Report on China’s Implementation of WTO Accession Commitments. The U.S. initially admitted China to the WTO to transform China into a market economy under the “rules-based” WTO system. Still, the WTO rules have not succeeded in restricting China’s policy of “government control of commerce” [47,48,49]. The United States went on to use the so-called “market-oriented conditions” standard of WTO reform in the name of “China’s trade rules to put on a tailor-made coat” [50]; the WTO failed to effectively curb the escalation of the trade dispute between China and the United States, further exposing the marginalization of its in global governance [51]. Under uncertainty, people’s expectations of future outcomes affect their decision-making behavior [52]. In international trade, the level of a country’s trade policy uncertainty affects the expectations of both sides of the trade, affecting the decision-making behavior of both sides. Therefore, the transmission mechanism of U.S. trade policy uncertainty affecting China’s grain trade can be analyzed from the perspective of trade expectation theory. According to the trade expectations theory, if both sides of the trade in the future trade expectations for the positive tend to maintain the peaceful development of the state, each other will maintain a moderate degree of interdependence.
Conversely, suppose both sides of the trade in the future trade expectations are opposing. In that case, it will lead to both sides of the trade being interrupted in the future to avoid being subjected to the other side’s reduced interdependence among each other [53]. As shown in Figure 1, the fluctuation of U.S. trade policy uncertainty affects the trade expectations of both trading parties and directly or indirectly impacts China’s import and export trade of grain through supply and demand channels and financial channels.

3.1. Direct Channel Impact

The direct impact of U.S. trade policy uncertainty on China’s food trade mainly plays a role in China’s food imports, which can be analyzed from both the international supply channel and the domestic demand channel.

3.1.1. International Supply Channels

According to the Exporter Behavior Model, there are significant costs for exporters to enter the international market, and exporters will enter the international market only if the expected income can cover these costs [54]. Meanwhile, according to the rational farmer theory, rational farmers pursue profit maximization and adjust their production behavior according to the difference between expected income and production costs [55]. When the upward fluctuation of U.S. trade policy is slight and does not affect exporters’ entry costs and producers’ expected incomes, exporters and producers will determine that the fluctuation of trade policy is in the acceptable range and still hold a positive anticipatory attitude towards future trade relations. Not only will exporters and producers not reduce food supply and production levels, but they will also increase supply moderately because of optimistic expectations of trade relations. When the rise in U.S. trade policy is so volatile that it significantly affects exporters’ entry costs and producers’ expected revenues, exporters and producers may perceive a possible trade disruption in the future. This turn may lead to pessimism about future economic conditions and trade relations, prompting exporters to delay entry into international markets and producers to reduce investment in agriculture and technology, ultimately dampening food production and reducing the total food supply [56].

3.1.2. Domestic Demand Channels

Real options theory suggests that in an environment of uncertainty, a firm’s future investment opportunities can be viewed as call options. Investors are often not eager to invest in the current period but rather delay investment to obtain a higher option value in the future [57,58,59]. According to the theory of intertemporal consumer decision-making, consumers tend to postpone consumption decisions because of the difficulty in predicting how policy uncertainty shocks will affect their future incomes [60,61]. From the preventive saving effect, households have a precautionary saving tendency, and the proportion of precautionary saving increases with rising uncertainty, with a corresponding decrease in the proportion of consumption and investment [56,62]. When U.S. trade policy uncertainty rises by a large margin, the rising cost of food imports will lead to a deterioration in the consumption environment, and domestic consumers will believe that the trade relationship between the two sides is in a state of tension to avoid being subjected to others or suffer greater losses in the trade conflict, domestic consumers will reduce the demand for U.S. imports of food and the proportion of consumption [63]. When the rise in U.S. trade policy uncertainty is small, and the cost of food imports does not change much, domestic consumers will not worry too much about the impact of U.S. trade policy on the trade situation. They will still hold a positive attitude toward future trade relations, and the proportion of their demand for and consumption of U.S. food imports will not be significantly reduced. On the contrary, the increase in economic growth rate and the improvement of people’s living standards will also increase the consumption of U.S. imported food. Based on the above analysis, the following hypotheses are proposed:
H1. 
Smaller fluctuations in U.S. trade policy uncertainty will promote China’s grain imports.
H2. 
When the fluctuation of U.S. trade policy uncertainty is large, it will inhibit China’s food imports.

3.2. Indirect Impact Channels

The indirect impact of U.S. trade policy uncertainty on China’s grain trade mainly plays a role in China’s grain exports, which can be analyzed from the domestic supply channel and financial and monetary channels.

3.2.1. Domestic Supply Channel

According to the crowding out effect, when the fluctuation of U.S. trade policy uncertainty is slight, under the influence of positive expectations, China will rely on food imports from the United States to make up for the domestic supply gap, which, to a certain extent, will thwart China’s incentive to improve food production. The reduction of food production incentives is not only not conducive to China enhancing food self-sufficiency but also reduces the proportion of China’s food exports in the international trade market [64]. According to the import substitution effect, when the U.S. trade policy uncertainty rises sharply, the higher the cost of food imports, consumers will tend to buy domestically produced food, which stimulates the domestic food supply level [65]. On the one hand, the level of China’s food supply will increase the domestic food stock, laying a material foundation for food exports; on the other hand, the increase in the cost of food imports from the United States will reduce its international competitiveness, to create a more relaxed environment for China’s food exports. It is worth mentioning that China’s approach to increasing food production is not the traditional crude way of increasing production by reclaiming wasteland and destroying forests, but rather a sustainable way of increasing production through the rational allocation of land property rights, the use of agricultural science and technology, the improvement of food varieties, and the promotion of the scale of land management and the scale of socialized services [66,67,68].

3.2.2. Financial and Monetary Channels

A substantial rise in U.S. trade policy uncertainty will make the yuan face depreciation pressure, affecting our products’ exports [69,70]. On the one hand, the substantial fluctuations in U.S. trade policy will increase the U.S.–China trade resistance and uncertainty factors, resulting in China’s macroeconomic downward pressure; on the other hand, the U.S. trade protection policy will promote the U.S. economic recovery, thereby narrowing the gap between the U.S. and China’s economic growth rate. Under the dual role of the two, investors in the foreign exchange market no longer hold unilateral appreciation expectations for the RMB, resulting in depreciation pressure on the RMB, to a certain extent, to improve the competitive advantage of China’s grain exporters in the international market. In the U.S. trade policy, uncertainty fluctuation is small, China’s macroeconomic growth is stable, and the gap between China and the U.S. economic growth rate widens, making investors hold appreciation expectations of the RMB, reducing the competitiveness of export enterprises. Based on the above analysis, the following hypothesis is proposed:
H3. 
Smaller fluctuations in U.S. trade policy uncertainty will inhibit China’s grain exports.
H4. 
When the fluctuation of U.S. trade policy uncertainty is large, it will promote China’s grain exports.

4. Materials and Methods

4.1. Methodology

From the previous analysis, it is clear that the uncertainty of U.S. trade policy is very close to China’s grain trade, so it is necessary to explore the correlation between them. China’s grain trade is currently in the stage of structural adjustment, which will lead to a large amount of economic data to produce the phenomenon of structural mutation. If the economic variables have sudden structural changes in the process of generation and collection, the linear model used in the existing literature is prone to statistical bias; therefore, this paper will use the time-varying parameter vector autoregression method to study the dynamic correlation between the uncertainty of the U.S. trade policy and China’s grain trade. Compared with the traditional linear model, on the one hand, the vector autoregressive model can better reflect the influence relationship between the variables within the system and help to analyze the impulse response and variance decomposition of the variables; on the other hand, the model does not need to assume the existence of a clear linear correlation between the variables, and it can also overcome the impact of the structural mutation of the economic data [71,72,73].

4.2. Model Construction

Since Sims (1980) proposed the vector autoregressive (VAR) model with fixed coefficients, the method has been widely used in macroeconomics due to its advantages in dealing with multivariate time series [74]. Primiceri (2005) introduced the time-varying parameters into the VAR model when he investigated the dynamics of the transmission mechanism of monetary policy in the United States [75]. Nakajima (2011) further improved it on this basis, gradually expanding the fixed coefficients of the traditional VAR model into time-varying coefficients so that it can reflect the time-varying relationship between variables through the continuous adjustment of the time-varying nature of the parameters [76]. In different historical periods and economic environments, the impact of U.S. trade policy uncertainty on international trade under the corresponding point in time has apparent fluctuations, and correspondingly, the impact on China’s grain trade will also have time-varying characteristics. Therefore, this paper chooses the time-varying parameter vector autoregression (TVP-SV-VAR) model with stochastic volatility to analyze the characteristics of the changes generated by China’s grain trade in different periods, and the model is constructed as follows.
First, the TVP-SV-VAR model is improved from the SVAR model, and the SVAR can be expressed as follows:
A y t = B 1 y t 1 + B 2 y t 2 + + B s y t s + μ t ( t = s + 1 , , n )
In Equation (1), s is the number of lags; y t is a vector of observed variables of order k + 1 ; A and B 1 , B 2 , , B s are coefficient matrices of order k × k . The disturbance term μ t is the structural shock of k × 1 , σ i ( i = 1 , , k ) is the standard deviation of the structural shock. Assume that μ t ~ N ( 0 , Σ Σ ) , where
Σ = σ 1 0 0 0 σ 2 0 0 0 σ k
The structural shocks are assumed to obey recursive identification, i.e., the
A = 1 0 0 a 21 1 0 a k 1 a k 2 1
The pair of Equation (1) can be converted to a parsimonious VAR model:
y t = F 1 y t 1 + F 2 y t 2 + + F s y t s + A 1 Σ ε t [ ε t ~ N ( 0 , I k ) ]
Included among these, F i = A 1 B i ( i = 1 , 2 , , s ) , β = ( B 1 , B 2 , , B k ) .
Suppose that X t = I k ( y t 1 , y t 2 , , y t s ) , is the Kronecker product, then Equation (2) can be transformed and obtained in the following form:
y t = X t β + A 1 Σ ε t
However, the parameters of the model are fixed. If the model parameters are changed to time-varying parameters, the model can be extended to TVP-VAR model with stochastic volatility, expressed as follows:
y t = X t β t + A t 1 Σ t ε t ( t = s + 1 , , n )
In Equation (4), X t are the matrices created by the Kronecker product of the unit matrix and the vector of lags of the variable vectors, β t , A t , Σ t all of which are model parameters with time-varying properties. Referring to the Primiceri (2005) [75] study, let the column vector a t = ( a 21 , a 31 , a 32 , a 41 , , a k , k 1 ) be the stack of lower triangular matrices A t h i t = log σ j t 2 ( j = 1 , , k ; t = s + 1 , , n ). It is also assumed that the model parameters all obey random wandering: β t + 1 = β t + μ β t , a t + 1 = a t + μ a t , h t + 1 = h t + μ h t , and
ε t μ β t μ β t μ β t ~ 0 , I 0 0 0 0 Σ β 0 0 0 0 Σ a 0 0 0 0 Σ h
where Σ β , Σ a , Σ h are diagonal matrices. The empirical analysis process can be realized by simulated sampling through the Markov chain Monte Carlo (MCMC) method to estimate the posterior means of the parameters of the TVP-VAR model.

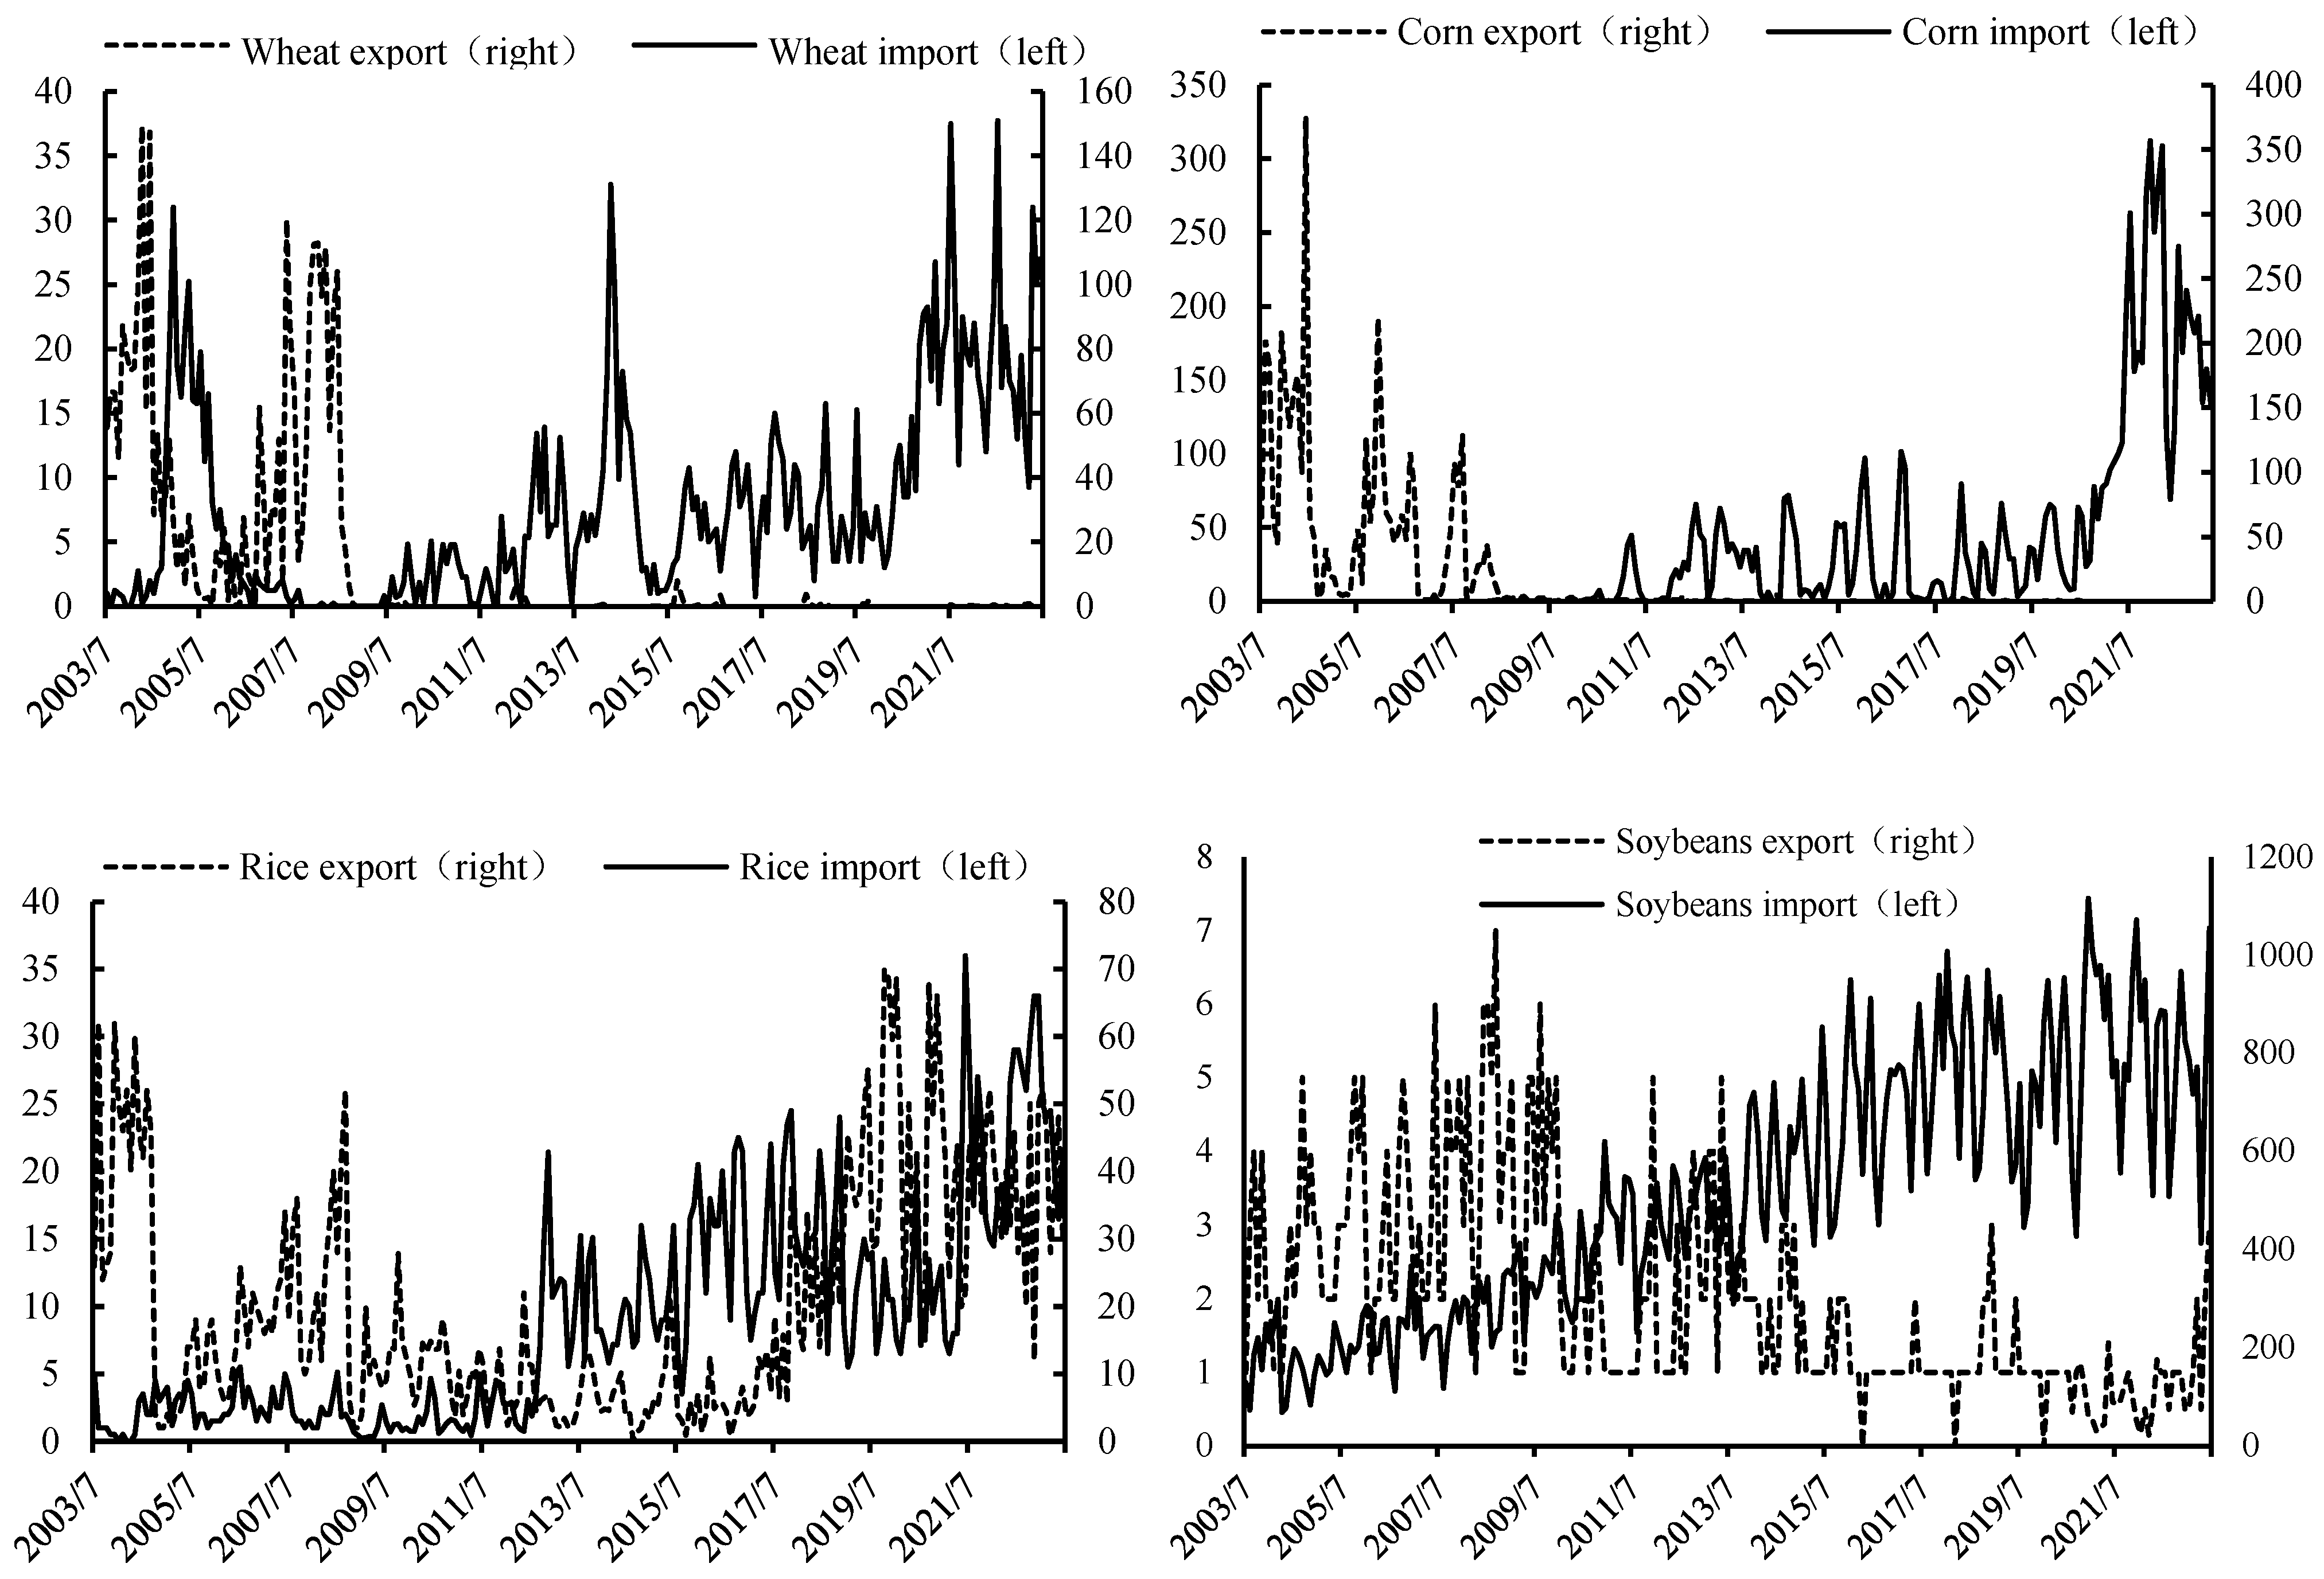
4.3. Data Sources and Description

4.3.1. Data Description

This paper selects wheat, corn, rice and soybeans relying on U.S. imports as the main objects of investigation involved in China’s food security strategic goal of basic self-sufficiency in grains and absolute security in food rations. It uses the U.S. Trade Policy Uncertainty Index constructed by Baker et al. (2016) to characterize the U.S. trade policy uncertainty [77]. China’s import and export data on wheat, corn, rice and soybeans come from the official websites of the General Administration of Customs of the People’s Republic of China and the Ministry of Commerce of the People’s Republic of China. In contrast, the data related to the U.S. Trade Policy Uncertainty Index come from the Economic Policy Uncertainty Database (www.policyuncertainty.com, accessed on 28 January 2024), with a sample period from July 2003 to December 2022, and the data used are monthly data. The sample period is from July 2003 to December 2022; the data used are monthly.
As can be seen from the trend of the U.S. Trade Policy Uncertainty Index (Figure 2), the movement of U.S. trade policy uncertainty can be roughly divided into two phases: the first phase is from mid-2003 to the end of 2015, during which the U.S. trade policy uncertainty curve is roughly flat, and although it fluctuates due to the impacts of the “financial crisis” of 2008 and the “European debt crisis” and other global events of 2010, the U.S.–China trade relationship as a whole is still in the developmental stage. In particular, from 2009 to 2015, the total trade volume of China and the United States continued to grow from USD 365.98 billion to USD 598.07 billion, with a growth rate of 63.42%. The second stage is from the beginning of 2016 to the end of 2022, a period in which U.S. trade policy is in a state of dramatic fluctuation and directly leads to the intensification of U.S.–China trade friction. In January 2017, Trump came to power and announced his withdrawal from the TPP (Trans-Pacific Partnership); in July 2018, the United States formally imposed tariffs on Chinese goods; and in August 2019, the United States announced that it would impose a 10% tariff on about USD 300 billion of Chinese imports, which escalated the trade friction between China and the United States again.
As can be seen from the trend of grain imports and exports (Figure 3), from July 2003 to December 2022, the import and export volumes of the four major staple grains, namely, wheat, maize, rice and soybeans, have been subject to a certain degree of volatility. Among them, wheat exports only rose sharply in 2003 and around 2008, with exports exceeding imports, while imports exceeded exports in all other years, and wheat imports peaked in 2004, 2014 and 2021. Changes in the import and export trade of maize can be divided into three stages: 2003~2007 is the trade surplus stage, where the export volume of maize exceeds the import volume, and the wave peak of the export volume occurs in 2004; 2008~2010 is the trade equilibrium stage, where the import and export volume of maize is flat; the trade surplus stage from 2011 to 2022, in which the import volume of maize exceeds the export volume, and the wave peaks in 2021 and shows more frequent and sharp fluctuations during the period from 2020 to 2022. On the other hand, rice shows a trade surplus from 2003 to 2008 and a trade deficit from 2011 to 2022, with imports peaking around 2021. Soybean, on the other hand, has been showing a trade deficit, with the maximum monthly export volume not exceeding 70,000 tons, and from July 2003 to December 2022, soybean imports grew from 2,177,900 tons to 10,550,000 tons, with a growth rate of 398.13%. Before 2011, food imports and exports still exist in a trade surplus. After 2011, the food trade entered the net import era, and the trade deficit is expanding.

4.3.2. Data Preprocessing

Since the data selected for this paper are monthly data, it is necessary to seasonally process all data using the Census X-12 method to eliminate seasonality effects. The data selected in this paper belong to different scales, and the absolute values of individual data differ significantly, so it is necessary to standardize the seasonally adjusted data to improve the comparability of the data with the following formula:
X = x x ¯ se ( x )
where X denotes the variable; x ¯ denotes the mean of the variable; and se ( x ) denotes the standard deviation of the variable. Finally, the standardized processed data are subjected to first-order differencing to ensure the smoothness of the time series data. Meanwhile, for the convenience of subsequent analysis, the U.S. trade policy uncertainty is abbreviated as UTPT, and wheat, corn, rice, and soybeans are abbreviated as W, C, P, and S, respectively. The descriptive statistics of each series after treatment are shown in Table 1.

5. Empirical Results and Analyses

Before conducting the empirical tests, the time series data used in the model are first tested for smoothness, and the model is estimated.

5.1. Smoothness Test of the Series and Determination of the Lag Order of the Variables

Constructing the TVP-VAR model with stochastic volatility requires a smooth selection time series. In this paper, the individual series are tested for smoothness through the ADF unit root test, and the specific test results are shown in Table 2. As can be seen from Table 2, both the U.S. trade policy uncertainty indicator series and the Chinese grain trade series have passed the significance test at the 1% level, indicating that the subsequent modeling and analysis can be carried out.
Before constructing the TVP-VAR model, it is also necessary to determine the optimal lag order of each variable in the model. According to the majority principle and the AIC criterion, the optimal lag order for wheat is 2, the optimal lag order for maize is 1, the optimal lag order for paddy is 3, and the optimal lag order for soya bean is 4 (as shown in Table 3).

5.2. Model Estimation and Diagnostic Results

Since the empirical results of the VAR model are sensitive to the order of the variables, based on the theoretical analysis and considering that the impact of US trade policy uncertainty on food imports is more direct, this paper constructs a TVP-VAR model with the order of the variables of the US Trade Policy Uncertainty Index (TPUI), the volume of food imports, and the volume of food exports, and uses Markov Chain Monte Carlo (MCMC) simulation method to obtain a sufficiently large number of valid samples. Referring to the parameter setting of Nakajima (2011), it is assumed that the µ β 0 = µ a 0 = µ h 0 , Σ β 0 = Σ a 0 = 10 I , Σ = 100 I , and ( Σ β ) i 2 ~ G a m m a ( 40 , 0.02 ) , ( Σ a ) i 2 ~ G a m m a ( 4 , 0.02 ) , ( Σ h ) i 2 ~ G a m m a ( 4 , 0.02 ) . The MCMC sampling method sets 50,000 simulated samples and discards the initial 5000 samples as Burn to obtain the posterior distributions of the parameters to be estimated. The diagnostic results of the model estimation are shown in Table 4.
As can be seen from Table 3, the maximum Geweke convergence diagnostic value is 0.99, all of which are smaller than the 95% critical value of 1.96, indicating that the posterior parameters are concurrent at the 5% significance level. The maximum null factor is 126.10, and at least 396 (50,000/126.10 ≈ 396.51) valid samples can be obtained after 50,000 samplings, satisfying the needs of a posteriori inferential analysis. The MCMC simulation is more effective, and the subsequent TVP-VS-VAR model is robust.

5.3. Analysis of Empirical Results

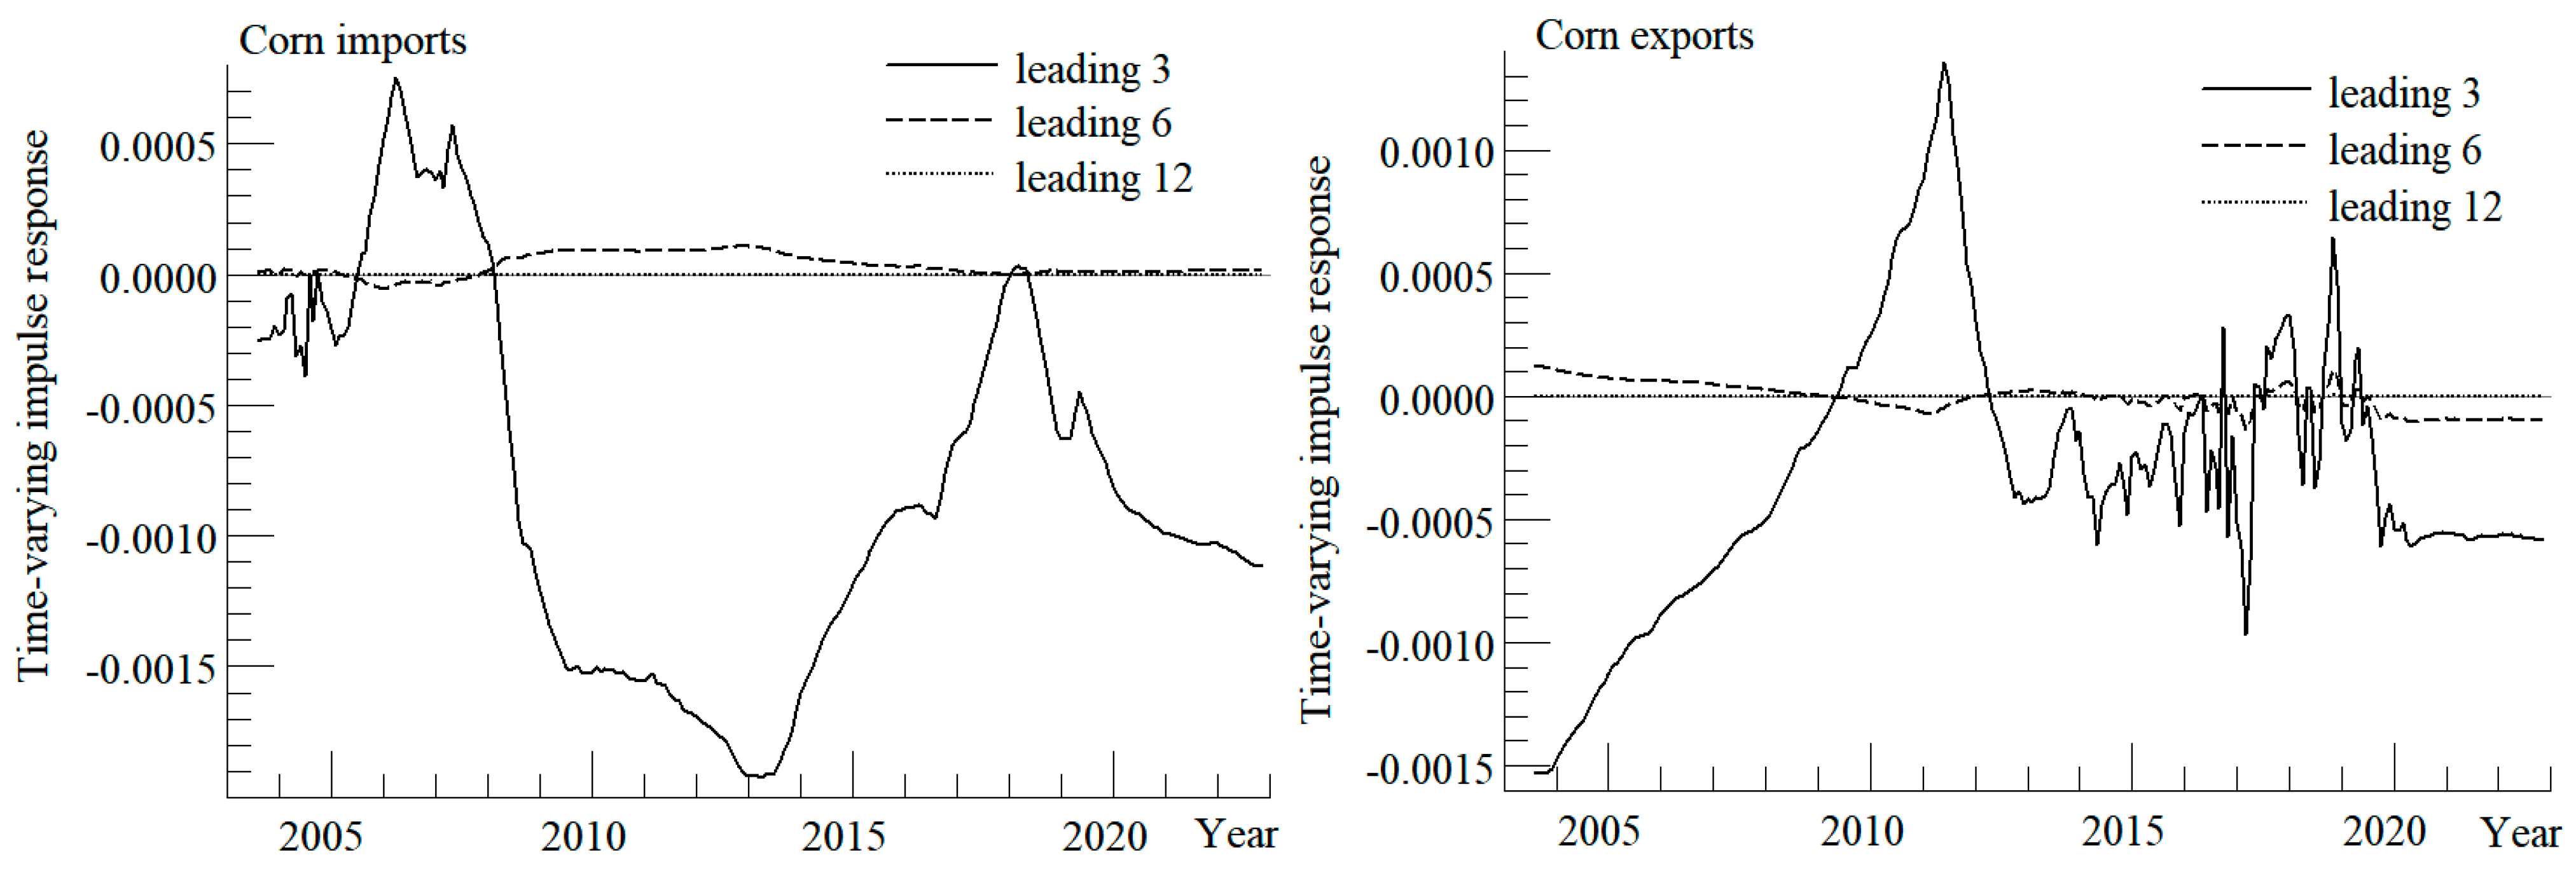
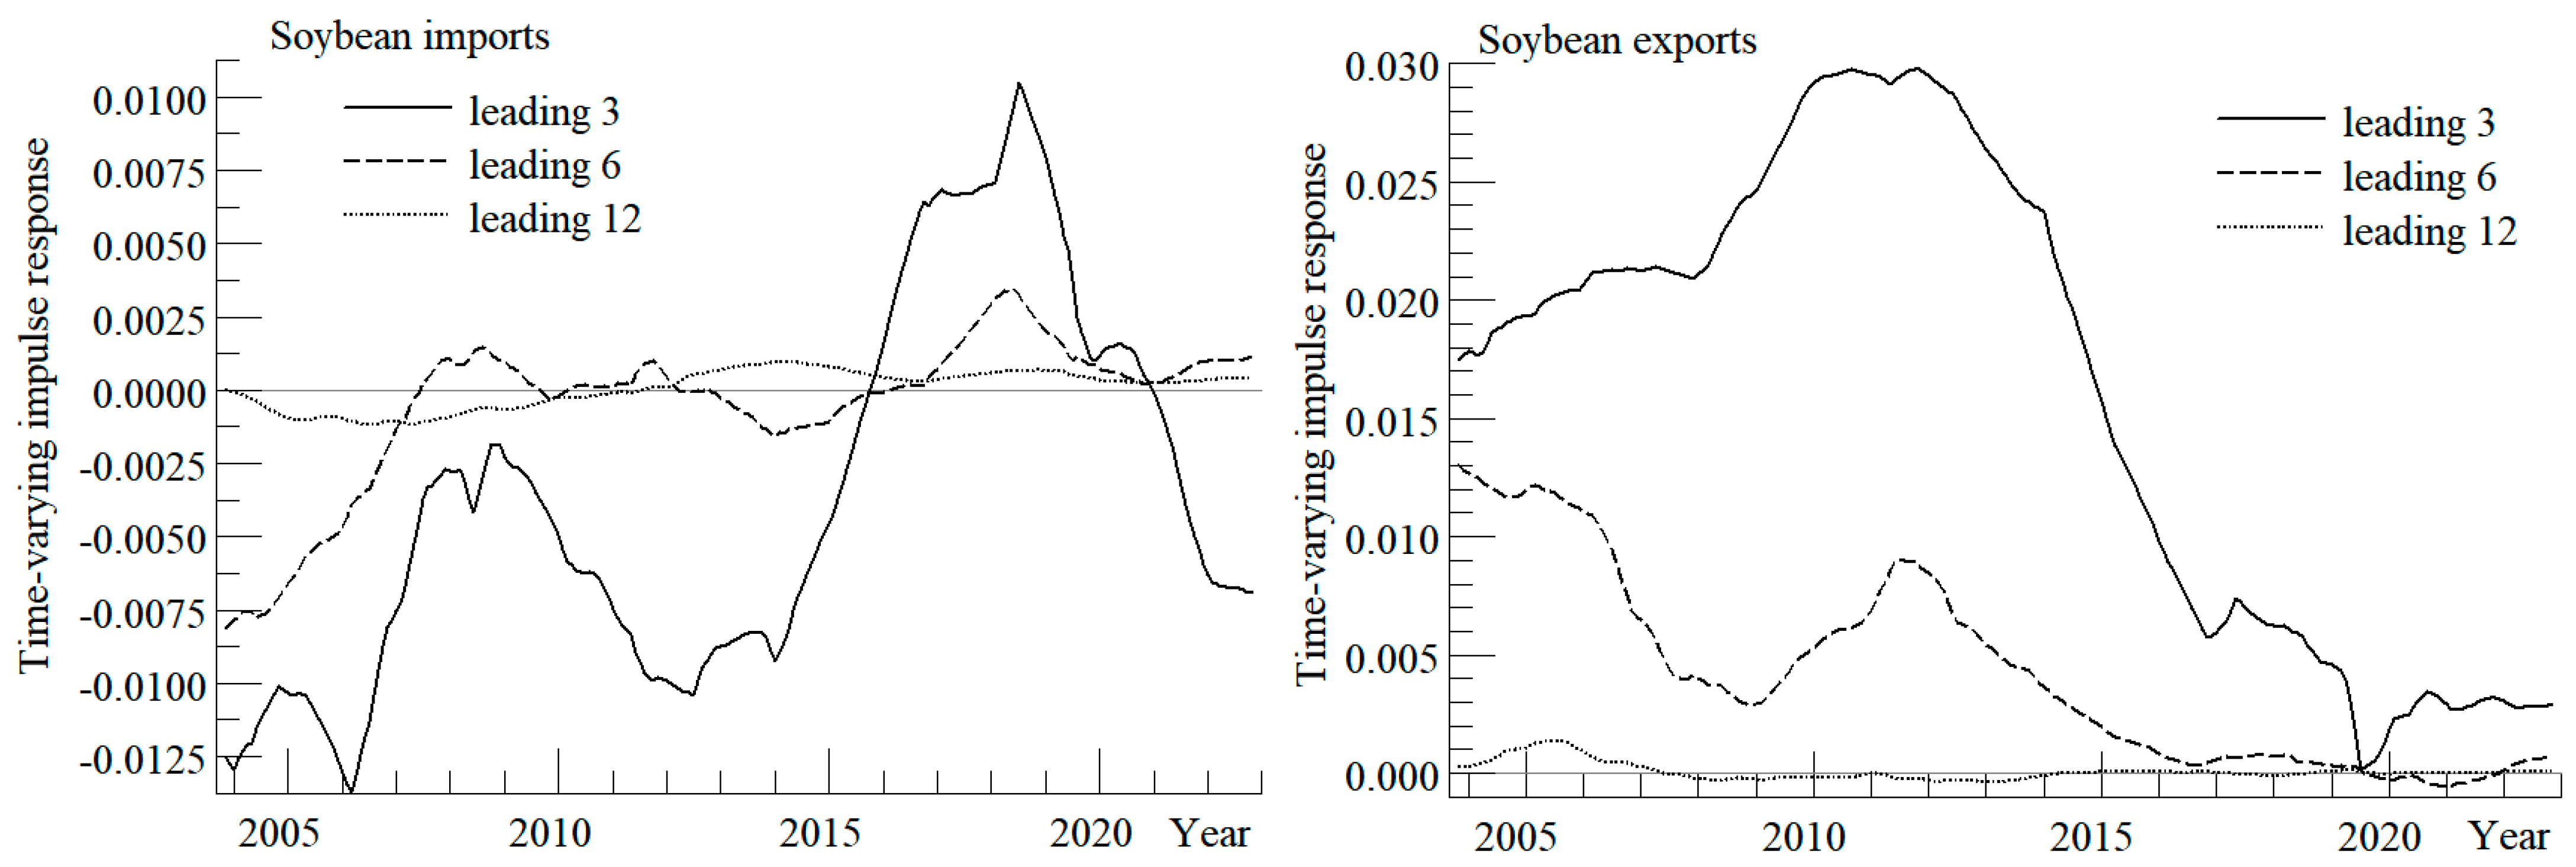
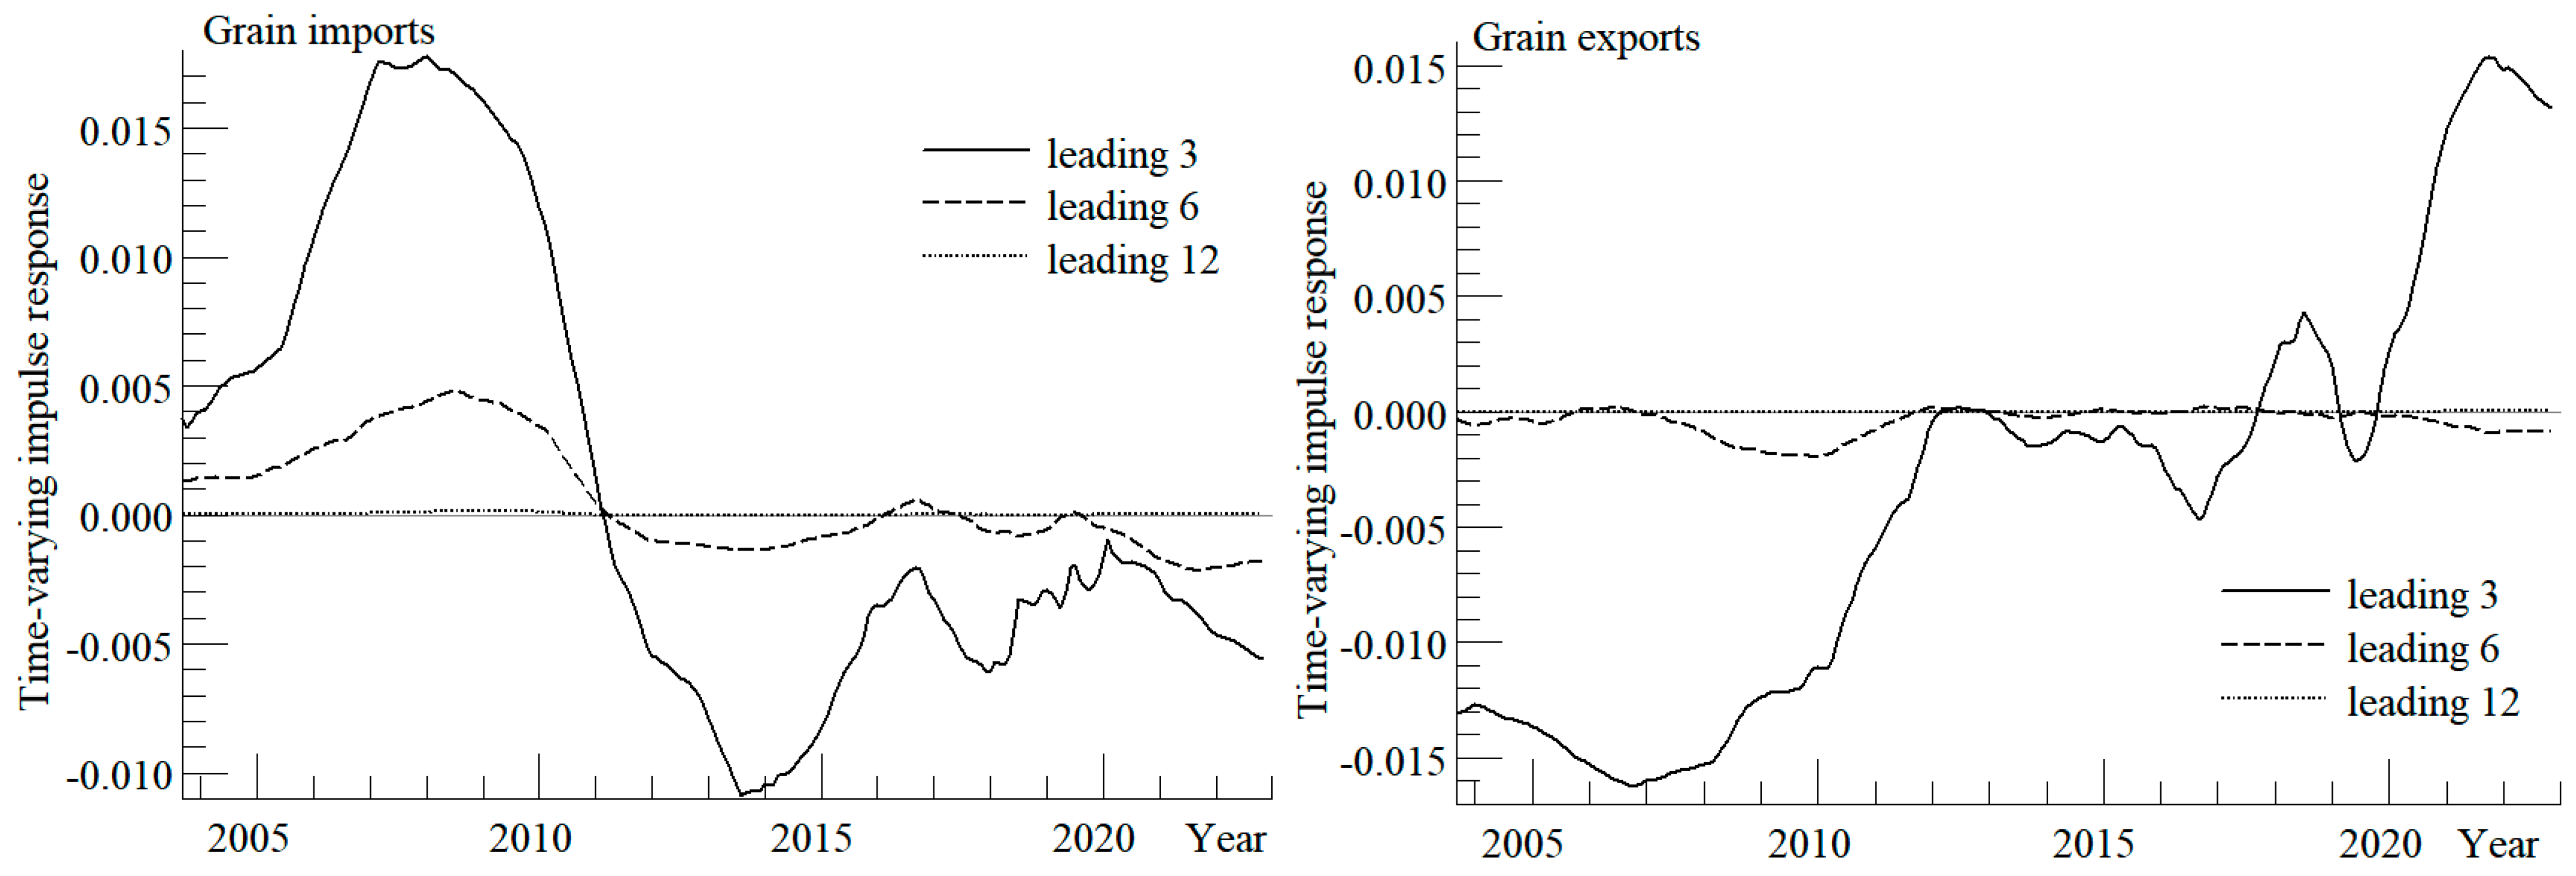
5.3.1. Time-Varying Impulse Response Results

The time-varying impulse responses of the TVP-SV-VAR model can reflect the impact of U.S. trade policy uncertainty on China’s grain trade under different leading periods. In this paper, the number of leading periods is selected as 3, 6 and 12, corresponding to the impact characteristics of U.S. trade policy uncertainty on China’s grain trade in the short-term, medium-term and long-term phases, respectively, and the specific impulse responses can be referred to Figure 4, Figure 5, Figure 6 and Figure 7. As can be seen from the figure, the impact of U.S. trade policy uncertainty on China’s grain import and export volume is more evident in the leading three periods; with the lengthening of the leading period, the impact is gradually weakened; when the leading period is 12 periods, the impact intensity tends to be 0 gradually. It can be seen that the impact of U.S. trade policy uncertainty on China’s grain import and export volume does not have long-term sustainability, so the subsequent analysis mainly focuses on the leading three periods.
(1)
Time-varying impulse response of grain imports.
According to the time-varying impulse response results of the four staple grains, it can be seen that the uncertainty of U.S. trade policy has a more significant impact on China’s grain import trade. From the perspective of the direction and intensity of the impact on various types of food, the uncertainty of U.S. trade policy on wheat imports has a noticeable trend from positive to negative. From 2003 to mid-2014, the impact on wheat imports was positive and reached its maximum level in 2005, after which the impact intensity gradually weakened. By mid-to-late 2014, the direction of the shock to wheat imports began to change from positive to negative and reached a high level in late 2016 to early 2017. Shocks to maize imports were positive from 2006 to early 2008 and reached a high level in 2006. The shock’s effect on maize turned positive to negative from mid to late 2008, and the negative shock reached its maximum at the end of 2013. Unlike wheat and maize, rice imports are subject to more frequent “alternating positive and negative” shocks, with positive shocks to rice imports caused by U.S. trade policy uncertainty in the three periods from mid-2006 to mid-2009, from end-2015 to end-2016 and from mid-2021 to end-2022, reaching a maximum level in late 2008 to early 2009. The remaining periods are subject to largely negative shocks, and the adverse shocks received reach high levels in 2003 and 2011. The shock to soybean imports from U.S. trade policy uncertainty manifests as a positive shock in 2016~2021, with the most substantial positive shocks received in late 2018. Soybean imports are hit negatively for the rest of the period, reaching high adverse shocks in 2006 and 2012, respectively.
(2)
Time-varying impulse response of grain export volume.
From the U.S. trade policy uncertainty on China’s grain export trade in the direction of the impact and the intensity of the impact, from 2003 to 2010, wheat exports subjected to the shock wave dynamic trend gradually rose and achieved the impact of the role of the shock from negative to positive, the positive impact trend in early 2011 to reach the highest level after the beginning of a sharp decline, starting in 2013, wheat exports subjected to the impact trend in the vicinity of 0 up and down fluctuations, and recently tend to stabilize. The dynamics of maize export volume exposure to U.S. trade policy uncertainty are broadly similar to those of wheat, except that maize export volume exposure is generally negative. From 2003 to 2011, the volatility of the shock to maize exports rose gradually. It turned from negative to positive, reaching its highest level in late 2011 and declining sharply before stabilizing in volatility and stabilizing at around −0.0006 recently. The impact of U.S. trade policy uncertainty on the volume of rice exports is generally negative and roughly shows a “downward—upward” trend. The negative impact on the volume of rice exports reached its maximum in 2010, after which the negative impact on the volume of rice exports gradually weakened and reached its minimum in the recent past. Unlike rice exports, the impact of U.S. trade policy uncertainty on soybean exports has been generally positive, with a roughly “up-and-down” pattern. Soybean exports experienced a sizeable positive effect around 2011, after which the positive impact continued to weaken, reaching a low in 2019 before rebounding and stabilizing at around 0.003 recently.

5.3.2. Time-Varying Impulse Response Characteristics

Comprehensively, the above analysis shows that the impact effect of U.S. trade policy uncertainty on China’s grain trade has two characteristics: first, the impact effect of U.S. trade policy uncertainty on China’s grain trade is different in different periods, i.e., the impact of U.S. trade policy uncertainty on China’s grain trade has a time-varying characteristic; second, the impact effect of different kinds of China’s grain trade on U.S. trade policy uncertainty reaction is different. The two features are analyzed in detail next:
(1)
Characteristics of Impulse Response in Different Periods.
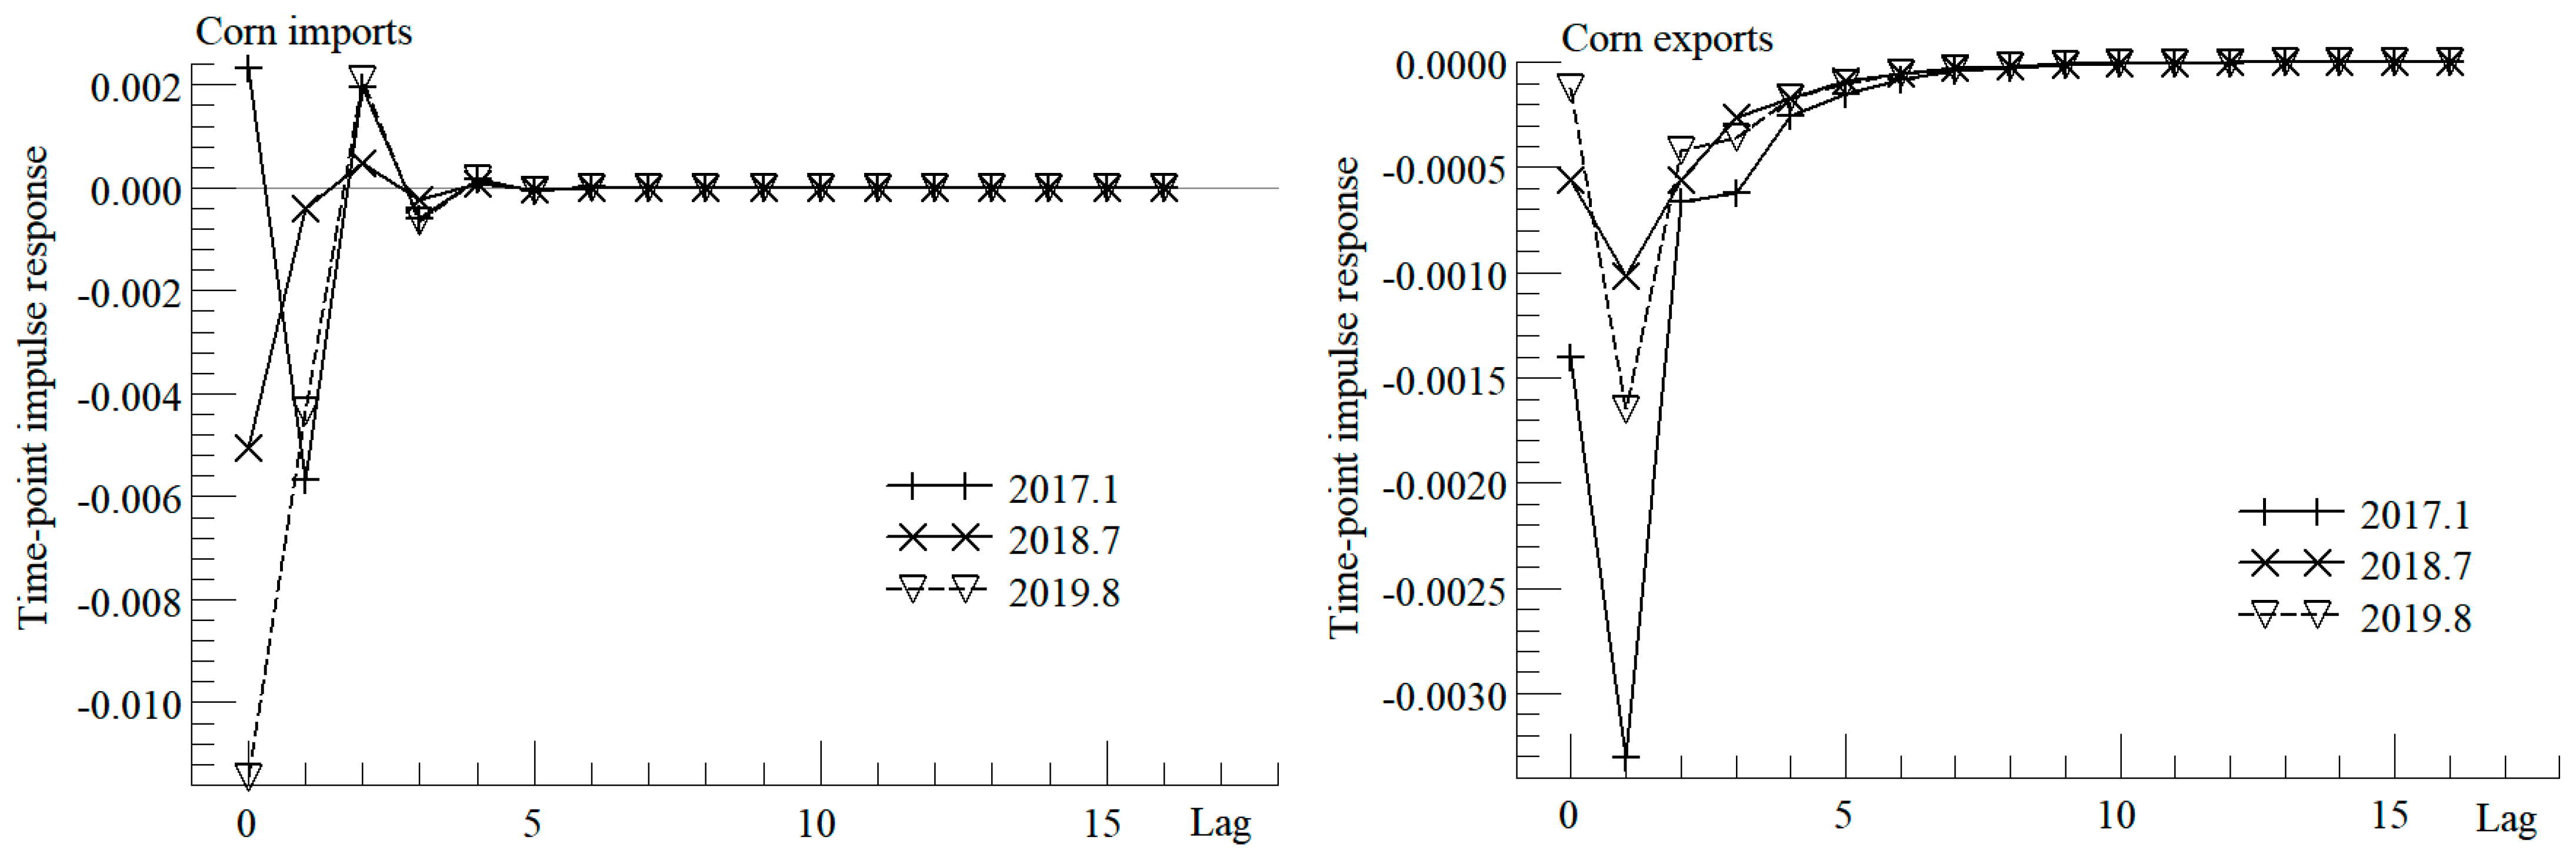
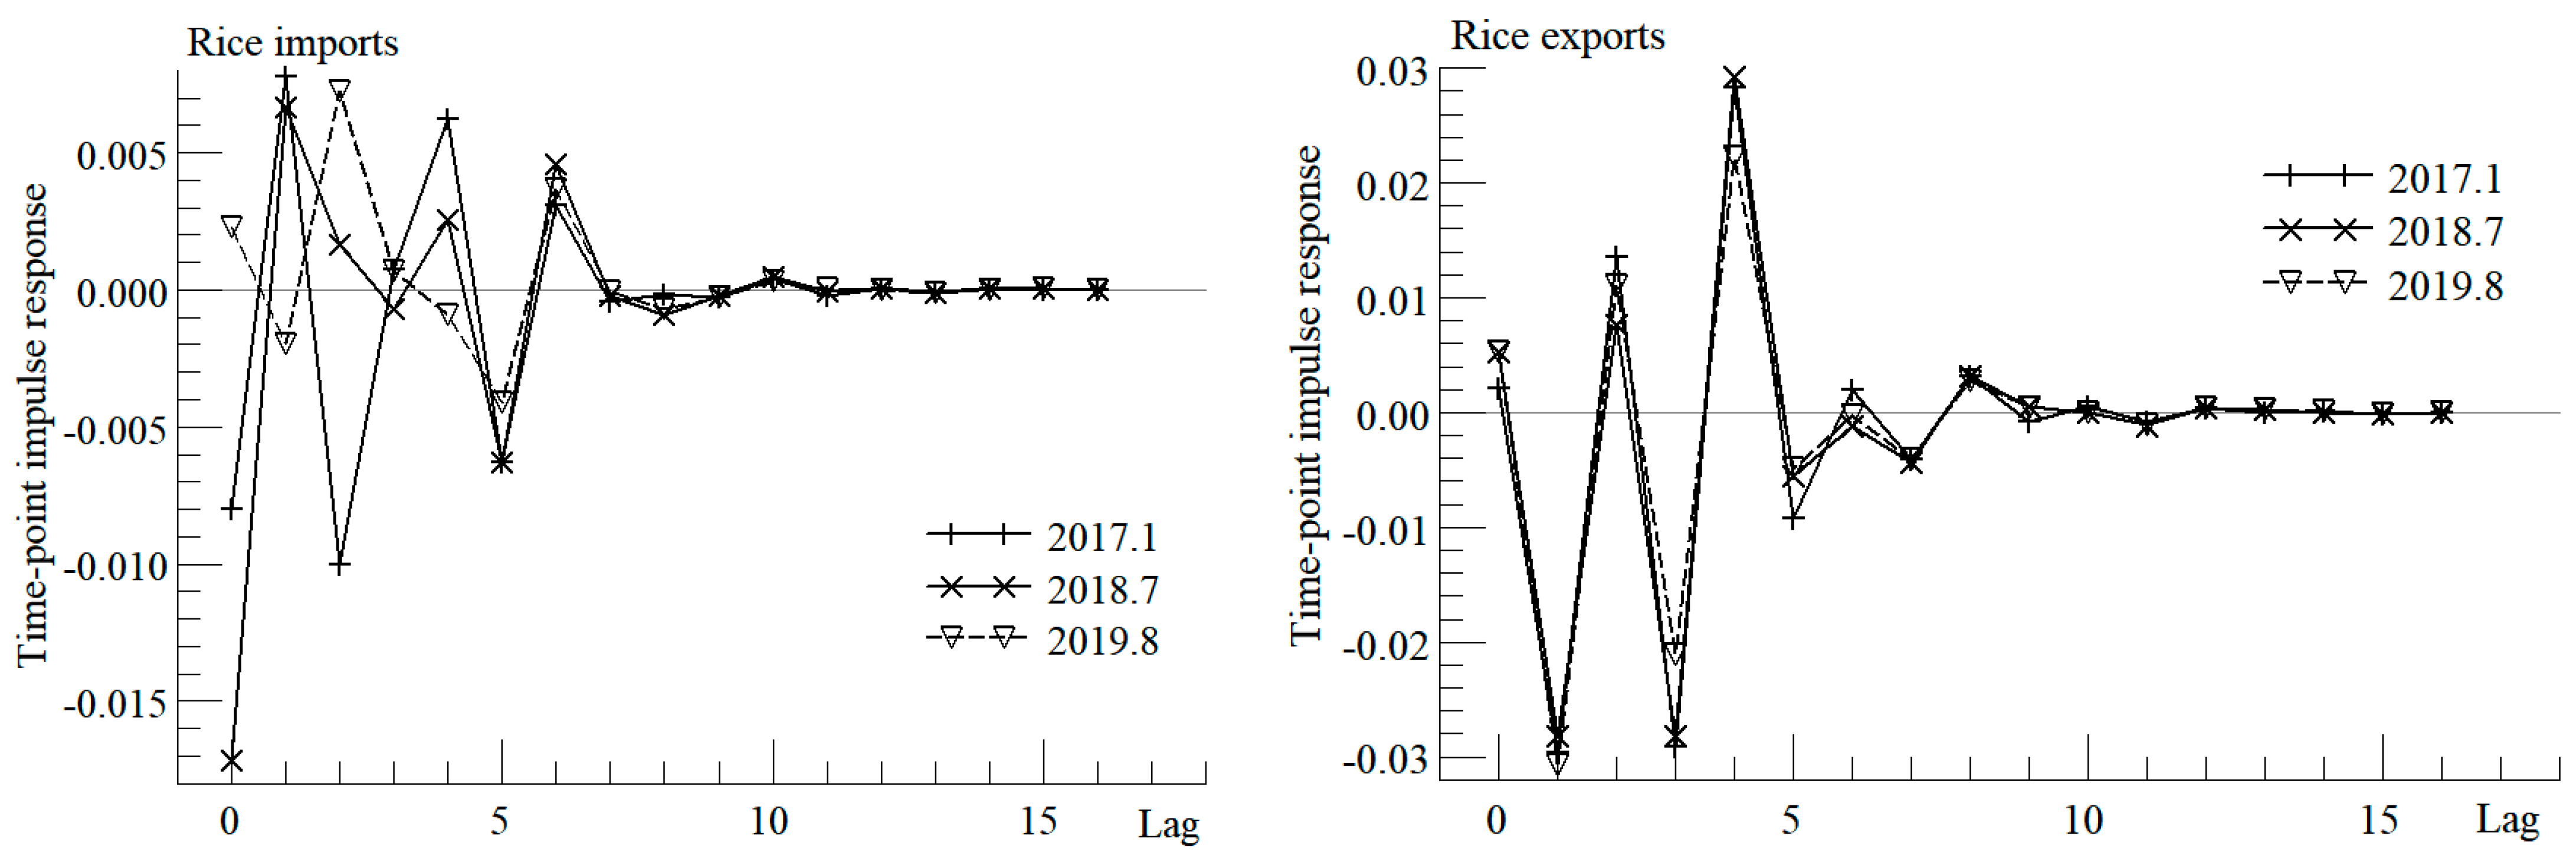
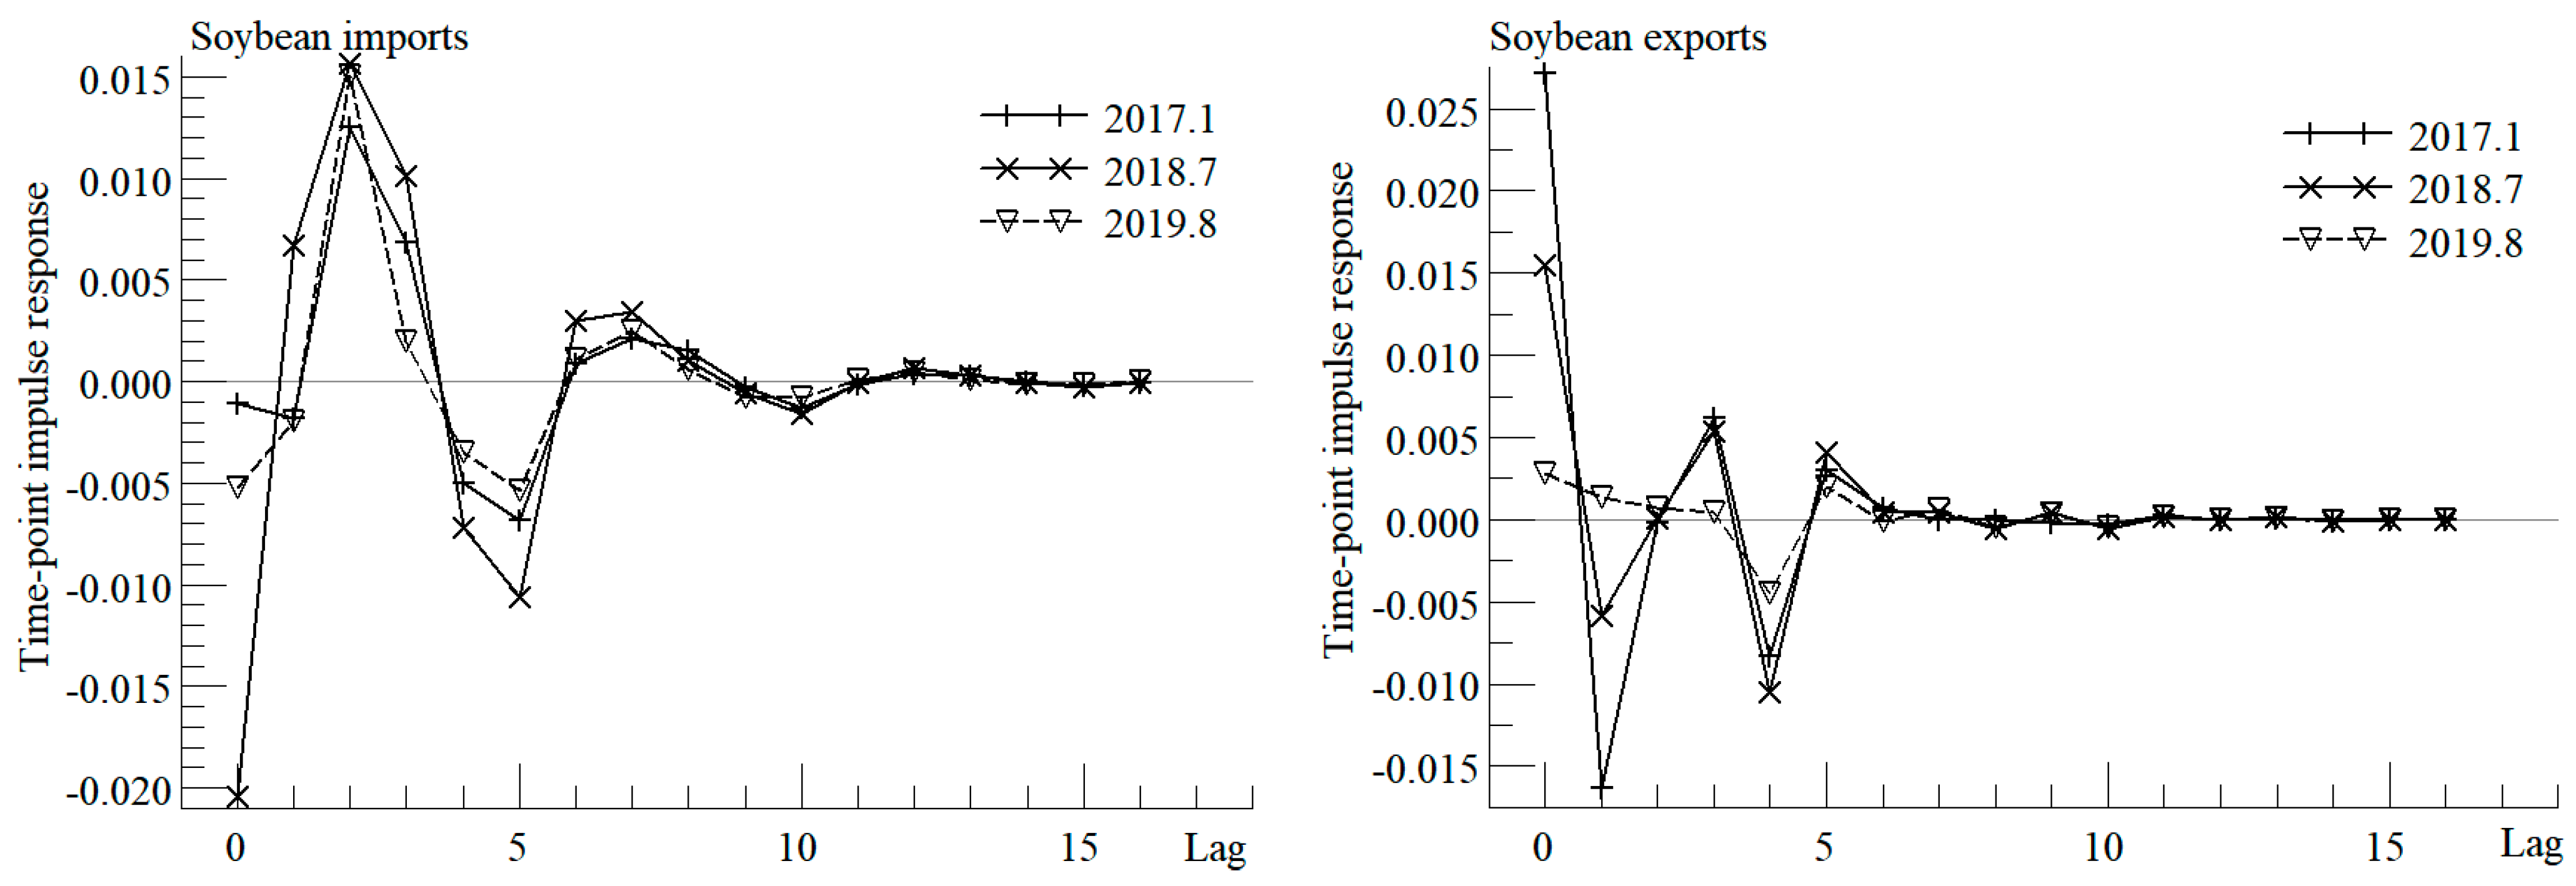
In terms of different periods, combining the time-varying impulse responses of the four-grain trade aggregates (Figure 8), the time-varying impulse responses of U.S. trade policy uncertainty on China’s grain imports and exports can be classified into two phases:
From 2003 to 2010, when the fluctuation of U.S. trade policy uncertainty was slight, the impact of U.S. trade policy uncertainty on China’s grain imports was positive, and the impact on China’s grain exports was negative. It indicates that the fluctuation of U.S. trade policy uncertainty in this period negatively affects food exports and positively affects China’s food imports, which is consistent with hypotheses H1 and H3. There may be several reasons for this: First, the increase in domestic food demand during that period, especially the expansion of domestic consumers’ demand for high-quality food due to food safety and other issues, led to a high increase in food imports and a low level of food exports. Secondly, the fluctuation of U.S. trade policy from 2003 to 2010 was slight. Both sides of the trade were positively expecting the future trade situation, and there was an abundant supply of international food at low prices, which made China’s food exports face more significant pressure but did not harm food imports.
During the high volatility of U.S. trade policy uncertainty from 2011 to 2022, the shock response of Chinese grain imports to U.S. trade policy uncertainty was negative, while Chinese grain exports gradually showed a positive response to the shock of U.S. trade policy uncertainty. This indicates that the fluctuation of U.S. trade policy uncertainty during this period suppresses China’s grain imports but promotes China’s grain exports to some extent, which aligns with hypotheses H2 and H4. The reason for this phenomenon may be that, under the continuous influence of the global financial crisis, the growth rate of China’s economic development slowed down after 2012, the RMB faced more depreciation pressure, the domestic consumer’s demand for imported food willingness has been reduced, but the depreciation of the RMB creates favorable conditions for China’s grain exports. At the same time, during the period of U.S. trade policy uncertainty, there appeared to be significantly large fluctuations in U.S. trade policy tone from “free” to “fair” trade. In particular, a series of export restriction measures would hurt the supply expectations of US food suppliers, leading to a reduction in international food supply, which would make China’s food imports respond negatively to the impacts of US trade policy uncertainty. Still, reducing the international food supply would play a particular role in promoting China’s food exports.
(2)
Impulse response characteristics of different products.
From different products, the persistence of the shock effect of U.S. trade policy uncertainty on China’s grain imports and exports is different:
For wheat, corn and rice import and export trade, the impact of U.S. trade policy uncertainty is not persistent. As can be seen from Figure 4, Figure 5 and Figure 6, the impulse response curve fluctuates more in the leading three periods; in the leading six periods, the impulse response curve fluctuates with apparent contraction; in the leading 12 periods, the impulse response curve almost coincides with the horizontal coordinate, which means that the shock effect of the U.S. trade policy uncertainty on the trade of wheat, maize, and paddy rice and other grains can gradually converge to the value of 0 in one year. The reason may be that the self-sufficiency rate of wheat, corn, and rice is always at a high level of more than 95 percent, and the degree of external dependence is not high so it can withstand the impact of external uncertainties.
The impact of U.S. trade policy uncertainty is somewhat persistent for soybean import and export trade. In the leading three periods, the impulse response curve fluctuates more; in the leading six periods, the impulse response curve has a slight contraction; in the leading 12 periods, the impulse response curve still has apparent fluctuations, which means that the impact effect of the U.S. trade policy uncertainty on the soybean trade is still present after one year. The reason for this may be related to the low level of soybean self-sufficiency; from 2003 to 2020, China’s soybean self-sufficiency rate dropped rapidly from 42.9 percent to 16 percent, and its external dependence was perennially at a high level of more than 80 percent, which made it difficult to withstand the impact of the fluctuations in international food trade policy and the structural changes in the international food market.

5.3.3. Time-Point Impulse Response Analysis

To examine the impact of U.S. trade policies, especially U.S. protectionist policies, on China’s grain trade in the context of the U.S.–China trade friction. This paper selects three time points for simulation: January 2017, July 2018 and August 2019. The three time points correspond to the beginning of US trade protectionism in 2017 when the US withdrew from the TPP, the beginning of US-China trade friction in 2018, and the escalation of US-China trade friction in 2019. Figure 9, Figure 10, Figure 11 and Figure 12 show the point-in-time impulse responses of U.S. trade policy uncertainty on China’s grain import and export trade.
Based on the results of the impulse response of China’s grain trade to U.S. trade policy uncertainty at three specific points, the grain import and export trade have different responses.
In terms of food imports, the response of wheat and soybean imports to U.S. trade policy uncertainty starts from a negative direction in three periods and then shifts to an alternating positive and negative response, with wheat leveling off after five months and soybeans leveling off after ten months; corn imports begin with a negative response to U.S. trade policy uncertainty in both the July 2018 and August 2019 periods, before shifting to an alternating positive and negative response and leveling off after three months; paddy imports, on the other hand, started in a negative direction in response to U.S. trade policy uncertainty in two periods, January 2017 and July 2018, before shifting to an alternating positive and negative response and leveling off after seven months. From the comparison of different time points, the more significant promotion effect on China’s grain imports is July 2018, especially in the imports of soybeans, rice and other grains, which is more prominent, indicating that in the context of the trade friction between China and the U.S., the trade protectionist policy adopted by the U.S. has a specific inhibitory effect on China’s imports of soybeans, rice and other grains, which once again verifies hypothesis H2.
Concerning food exports, the response of soybean and rice export volumes to United States trade policy uncertainty over the three periods started in a positive direction and then alternated between positive and negative responses, with soybeans gradually weakening and leveling off after six months and rice gradually stabilizing after nine months; the response of wheat and corn exports to U.S. trade policy uncertainty starts negatively in all three periods, and then the negative response tends to weaken and level off after six months. The comparison of the three periods shows that January 2017 has a more significant role in promoting China’s grain export trade, especially in the export of soybeans and corn, indicating that the U.S. trade protectionist policy has a specific role in promoting China’s exports of soybeans and rice, once again verifying hypothesis H4.
Overall, from the direction of the shock, the U.S.–China trade friction policy has a significant negative impact on China’s grain imports while more of a positive impact on grain exports. From the degree of impact, the impact on soybean import and export volume is more significant than the impact on other food imports and exports. Regarding the shock duration, the impact of U.S. trade policy uncertainty on China’s grain imports and exports is more volatile in the short term and roughly begins to stabilize only after ten months. In addition, according to the above analyses, the time-point impulse response results are consistent with those of the time-varying impulse response, indicating that the TVP-SV-VAR model constructed in this paper is robust.

6. Discussion

6.1. The Impact of U.S. Trade Policy Uncertainty on China’s Grain Trade Varies across Time

From 2003 to 2010, the fluctuation of U.S. trade policy was slight. Both sides of the trade were positively anticipating the future trade situation, and the supply of food was more abundant; moreover, China’s economic growth during that period led to the expansion of Chinese consumers’ demand for high-quality food, which resulted in a high growth of food imports and a low level of food exports [78]. As a result, the uncertainty of U.S. trade policy in this period had a positive impact on China’s grain imports and a negative impact on China’s grain exports; in 2011–2022, the fluctuation of U.S. trade policy uncertainty is more extensive, especially a series of export restriction measures, which negatively affects the supply expectations of U.S. grain suppliers and leads to a reduction in international grain supply [79]; moreover, the depreciation pressure faced by the RMB is more significant in this period under the continuous impact of the global financial crisis, which creates a favorable condition for the export of China’s grain. As a result, the uncertainty of U.S. trade policy harmed China’s grain imports, and the positive impact on China’s grain exports gradually emerged.

6.2. Heterogeneity in the Impact of U.S. Trade Policy Uncertainty on China’s Grain Trade

Further examination of the import and export volumes of different kinds of grains reveals that the impact of U.S. trade policy uncertainty on the import and export trade of wheat, corn, and rice is not persistent, and the impact on the import and export trade of soybeans is somewhat persistent. With the expansion of the examination interval, the fluctuation amplitude of the impulse response curves of wheat, corn and rice imports and exports is gradually narrowed. It gradually converges to 0 within one year, which means that the duration of the impact of U.S. trade policy uncertainty on the trade of wheat, corn, rice and other grains is shorter, which is in line with the conclusion of the study by Chen Bowen et al. [43]. However, the impulse response curve of soybean imports and exports in the same examination interval has only a slight contraction, which still exists after one year. In contrast, the shock effect of U.S. trade policy uncertainty on soybean trade still exists, similar to the findings of Adjemian [80]. This shows heterogeneity in the impact of U.S. trade policy uncertainty on trade in different types of food.

6.3. The Impact of U.S. Trade Policy Uncertainty on China’s Grain Trade Has a Significant Point-in-Time Effect

In the impulse response analysis of the three-time points of the prevalence of U.S. trade protectionism, the beginning of U.S.–China trade friction, and the escalation of U.S.–China trade friction, it was found that China’s grain trade was affected by the short-term impacts more obviously [81]. For example, the import and export volume of the four major staple foodstuffs in the three trade friction time points appeared as substantial fluctuations, and from the direction of the impact, the food imports have a significant negative impact on food exports’ more positive impact; from the extent of the impact, soybean imports and exports are subject to a greater degree of impact than the impact on other food imports and exports; this was from the duration of the impact to the point of view, which was roughly half a year after the stabilization of the impact. Therefore, it can be seen that the impact of U.S. trade policy uncertainty on China’s grain import and export trade has an obvious point-in-time effect.

7. Conclusions

In today’s increasingly complex trade situation between China and the United States, to guarantee the sustainable development of agriculture in the trade friction, it is necessary to analyze and explore from the national and industrial levels, respectively.
At the national level, we need to objectively recognize the essence of the trade friction between China and the United States. The fundamental purpose of the U.S. trade friction is not only to reduce its domestic trade deficit but also to strengthen the comprehensive strength of the two countries. With the turbulence of the world situation and the increase in unstable economic development factors, this China-US trade friction is likely to be a long-term confrontation and may occur frequently.
Therefore, the fluctuation of uncertainty in U.S. trade policy may be more violent; for China, food trade should not only do an excellent job soon to cope with the work but also do an excellent job in the medium- and long-term preparation.
Secondly, the multilateral coordination mechanism of the WTO should be rationally utilized. For China and the United States, this outbreak of trade friction is used to impose higher tariffs to sanction the other side and counterattack. Still, this decision hurts the domestic macroeconomics of both countries. This “lose-lose” policy tool should be used with caution; therefore, the rational use of the WTO dispute settlement mechanism is the best means of dealing with trade friction between countries. In addition, for the WTO’s rulemaking, China should try to secure more opportunities to participate in the multilateral trade agreement rulemaking to grasp a certain degree of voice, join the EU, ASEAN, the Belt and Road along with other countries and economies to improve the WTO’s trade rules, join hands to resist the unfair treatment of individual countries in trade and work together to create a free and cooperative international trade environment.
At the level of the agricultural industry, the analysis found that the impact of U.S. trade policy uncertainty on China’s soybean trade is more prominent, which is due to China’s inherent insufficient supply of soybeans, so China has to make up for the shortage of soybeans to guarantee the sustainable development of energy.
First of all, to integrate the international and domestic markets to solve the problem of soybean shortage externally, the following should be developed: agricultural products import market to make up for the problem of soybean shortage, incentives for enterprises from soybean production and processing capacity of stronger countries, such as Brazil, Argentina and other imports of soybeans and cake meal; and internally, to introduce policies to encourage feed processing enterprises and breeding enterprises to adjust the feed formula to increase the efforts of scientific research inputs to increase the number of other high-protein crops, such as alfalfa, rapeseed meal, peanut meal made of animal feed.
Second, the structure of agricultural cultivation should be adjusted, and the area planted with soybeans should be moderately expanded. At present, China’s soybean relies on the international market to make up for the reality that the gap is a short-term problem that cannot be solved but can be planted in the northeastern region through the pilot planting of high-yield varieties, a moderate increase in the area of domestically produced soybean sowing, and to encourage the production of other domestic alternative oilseed crops to safeguard the sustainable development of the domestic food and agricultural industries.
Finally, the structure of agricultural imports should be adjusted to increase imports of meat and meat products and reduce dependence on imported soybeans. The feed conversion rate of China’s domestically produced meat is significantly higher than that of major livestock-exporting countries such as Australia, New Zealand and Brazil. Beef cattle and hogs in these countries are raised on a large scale, with relatively low production costs, so domestic dependence on soybeans can be eased by increasing imports of meat products.
This study centers on the uncertainty of U.S. trade policy and China’s grain trade, which has specific innovative and reference significance. Theoretically, this study can provide a reference for the analysis of trade policy transmission mechanism and international trade influencing factors in terms of research ideas and methods; practically, this study can provide a relevant policy reference for promoting sustainable agricultural development. However, this study still has certain limitations. Firstly, due to the lack of data on the volume and direction of interprovincial grain trade in mainland China, it is impossible to analyze the heterogeneity of the shocks suffered by individual provinces. In addition, this study examines the dynamic correlation between U.S. trade policy uncertainty and China’s grain trade, pending further elaboration of the causal relationship of related variables through quantitatively calculated data.
Based on the limitations of this study, subsequent studies should synthesize the current research status of interprovincial grain in China, examine the methods used in each study, and progress to accurately calculate the volume of interprovincial grain trade better to examine the heterogeneous response of interprovincial grain trade. At the same time, references are made to relevant literature to quantitatively analyze the effect of U.S. trade policy uncertainty on sustainable economic development.

Author Contributions

Conceptualization, L.Y. and Y.G.; methodology, L.Y. and Y.G.; formal analysis, L.Y. and L.W.; investigation, Y.G.; writing—original draft preparation, L.Y. and Y.G.; writing—review and editing, A.Z. and L.W.; visualization, A.Z. and L.W.; funding acquisition, L.Y. All authors have read and agreed to the published version of the manuscript.

Funding

Supported by the Fundamental Research Funds for the Central Universities (2024SKPYWF01).

Institutional Review Board Statement

Not applicable.

Informed Consent Statement

Not applicable.

Data Availability Statement

Data is contained within the article.

Conflicts of Interest

The authors declare no conflicts of interest.

References

  1. Iashina, E.A.; Evgrafova, L.V.; Dzhancharova, G.K.; Ukolova, A.V.; Kovaleva, E.V. Analysis of the dynamics of food security in the countries of the Eurasian Economic Union. Front. Sustain. Food Syst. 2023, 7, 1114469. [Google Scholar] [CrossRef]
  2. Zhang, Y.T.; Zhou, W.X. Quantifying the status of economies in international crop trade networks: A correlation structure analysis of various node-ranking metrics. Chaos Solitons Fractals 2023, 172, 113567. [Google Scholar] [CrossRef]
  3. General Administration of Customs of the People’s Republic of China. Available online: http://www.customs.gov.cn/customs/302249/zfxxgk/2799825/302274/302277/3512606/index.html (accessed on 27 April 2024).
  4. Boyer, J.S.; Byrne, P.; Cassman, K.G.; Cooper, M.; Delmer, D.; Greene, T.; Gruis, F.; Habben, J.; Hausmann, N.; Kenny, N.; et al. The US drought of 2012 in perspective: A call to action. Glob. Food Secur.-Agric. Policy Econ. Environ. 2013, 2, 139–143. [Google Scholar] [CrossRef]
  5. Li, H.Z. Impact of Natural Disasters on China’s Soybean Imports. Master’s Thesis, Cornell University, Ithaca, NY, USA, 2023. [Google Scholar]
  6. USDA Foreign Agricultural Service. Available online: https://fas.usda.gov/data/trade (accessed on 28 April 2024).
  7. Gao, X.; Insuwan, A.; Li, Z.; Tian, S. The dynamics of price discovery between the U.S. and Chinese soybean market: A wavelet approach to understanding the effects of Sino-US trade conflict and COVID-19 pandemic. Data Sci. Manag. 2024, 7, 35–46. [Google Scholar] [CrossRef]
  8. Wen, T.; Li, P.; Chen, L.; An, Y. Market reactions to trade friction between China and the United States: Evidence from the soybean futures market. J. Manag. Sci. Eng. 2023, 8, 325–341. [Google Scholar] [CrossRef]
  9. Willer, D.F.; Aldridge, D.C. Enhancing domestic consumption to deliver food security in a volatile world. Glob. Sustain. 2023, 6, e18. [Google Scholar] [CrossRef]
  10. Zhou, Y.; Ji, Y. Trade Policy Uncertainty, Innovation and Total Factor Productivity. Sustainability 2022, 14, 266. [Google Scholar] [CrossRef]
  11. Mei, D.X.; Xie, Y.T. US grain commodity futures price volatility: Does trade policy uncertainty matter? Financ. Res. Lett. 2022, 48, 103028. [Google Scholar] [CrossRef]
  12. Pöyhönen, P. A Tentative Model for the Volume of Trade between Countries. Weltwirtschaftliches Arch. 1963, 90, 93–100. [Google Scholar]
  13. Handley, K.; Limao, N. Trade and Investment under Policy Uncertainty: Theory and Firm Evidence. Am. Econ. J.-Econ. Policy 2015, 7, 189–222. [Google Scholar] [CrossRef]
  14. Handley, K.; Limao, N. Policy Uncertainty, Trade, and Welfare: Theory and Evidence for China and the United States. Am. Econ. Rev. 2017, 9, 2731–2783. [Google Scholar] [CrossRef]
  15. EunJung, L.; Jun, S.-H. Impact of Distance and Trade Costs on the Bilateral Trade between Developing Countries. Int. Commer. Inf. Rev. 2020, 22, 395–417. [Google Scholar]
  16. Liu, A.; Lu, C.; Wang, Z. The roles of cultural and institutional distance in international trade: Evidence from China’s trade with the Belt and Road countries. China Econ. Rev. 2020, 61, 101234. [Google Scholar] [CrossRef]
  17. Wang, C.Y.; Wang, Y.W.; Zhong, S. Empirical Analysis on RMB Exchange Rate Volatility and Import and Export Commodities Trading in China. In Proceedings of the Eighth Wuhan International Conference on E-Business, Wuhan, China, 24–26 May 2009; Volume i–iii, pp. 1489–1494. Available online: https://webofscience.clarivate.cn/wos/alldb/full-record/WOS:000267479300235 (accessed on 17 January 2024).
  18. Wu, C.Z. Research on Impact of Exchange Rate to China’s Agricultural Products Export Based on Trade Gravity Model. 2010. Available online: https://www.sciencedirect.com/science/article/pii/S2666660X21000323 (accessed on 17 January 2024).
  19. Zhou, J.H.; Wang, Y.; Mao, R.; Zheng, Y.Q. Examining the role of border protectionism in border inspections: Panel structural vector autoregression evidence from FDA import refusals on China’s agricultural exports. China Agric. Econ. Rev. 2021, 13, 593–613. [Google Scholar] [CrossRef]
  20. Zhou, L.Z.; Tong, G.J.; Qi, J.G.; He, L. China and Countries along the “Belt and Road”: Agricultural Trade Volatility Decomposition and Food Security. Agriculture 2022, 12, 1850. [Google Scholar] [CrossRef]
  21. Singh, K.; Dey, M.M. International competitiveness of catfish in the U.S. market: A constant market share analysis. Aquac. Econ. Manag. 2011, 15, 214–229. [Google Scholar] [CrossRef]
  22. Miao, M.; Liu, H.; Chen, J. Factors affecting fluctuations in China’s aquatic product exports to Japan, the USA, South Korea, Southeast Asia, and the EU. Aquac. Int. 2021, 29, 2507–2533. [Google Scholar] [CrossRef]
  23. Fu, H.L.; Huang, C.L.; Teng, Z.Q.; Fang, Y.T. Market Structure, International Competitiveness, and Price Formation of Hainan’s Fruit Exports. Discret. Dyn. Nat. Soc. 2021, 2021, 6664780. [Google Scholar] [CrossRef]
  24. Li, D.K.; Zhang, F.; Li, X.Z. Can US trade policy uncertainty help in predicting stock market excess return? Financ. Res. Lett. 2022, 49, 103136. [Google Scholar] [CrossRef]
  25. Zhang, R.X.; Qu, Y.H. The Impact of US Trade Policy Uncertainty on the Trade Margins of China’s Export to the US. Sustainability 2022, 14, 15101. [Google Scholar] [CrossRef]
  26. Bahmani-Oskooee, M.; Xu, J. Whose policy uncertainty matters in the trade between China and the US? Econ. Chang. Restruct. 2022, 55, 1497–1542. [Google Scholar] [CrossRef]
  27. Saxegaard, E.C.A.; Davis, S.; Ito, A.; Miake, N. Policy uncertainty in Japan. J. Jpn. Int. Econ. 2022, 64, 101192. [Google Scholar] [CrossRef]
  28. Yan, H.; Xiao, W.G.; Deng, Q.; Xiong, S.S. Analysis of the Impact of US Trade Policy Uncertainty on China Based on Bayesian VAR Model. J. Math. 2022, 2022, 7124997. [Google Scholar] [CrossRef]
  29. Burke, J.P. The Contemporary Presidency “It Went Off the Rails”: Trump’s Presidential Transition and the National Security System. Pres. Stud. Q. 2018, 48, 832–844. [Google Scholar] [CrossRef]
  30. Riley, J. The Legal and Policy Implications of the US Steel Tariffs on East Asia. J. East Asia Int. Law 2018, 11, 193–204. [Google Scholar] [CrossRef]
  31. Kim, S.E.; Pelc, K.J. The Politics of Trade Adjustment Versus Trade Protection. Comp. Political Stud. 2021, 54, 2354–2381. [Google Scholar] [CrossRef]
  32. Tyers, R.O.D.; Zhou, Y.X. The US-China trade dispute: A macroperspective. Singap. Econ. Rev. 2021, 1–28. [Google Scholar] [CrossRef]
  33. Dadush, U. American Protectionism. Rev. D Econ. Polit. 2023, 133, 497–524. [Google Scholar] [CrossRef]
  34. Chung, M. Legislative and Policy Trends and Implications Related to the Protection of Trade Secrets of the Biden Administration in the US. Korean J. Int. Econ. Law 2021, 19, 77–112. [Google Scholar] [CrossRef]
  35. Li, C.D.; Whalley, J. Trade protectionism and US manufacturing employment. Econ. Model. 2021, 96, 353–361. [Google Scholar] [CrossRef]
  36. Bown, C.P. How the United States Marched the Semiconductor Industry into Its Trade War with China. East Asian Econ. Rev. 2020, 24, 349–388. [Google Scholar] [CrossRef]
  37. Chen, Y.F.; Zhang, S.; Miao, J.F. The negative effects of the US-China trade war on innovation: Evidence from the Chinese ICT industry. Technovation 2023, 123, 102734. [Google Scholar] [CrossRef]
  38. Chengying, H.; Rui, C.; Ying, L. US-China trade war and China’s stock market: An event-driven analysis. Econ. Res.-Ekon. Istraž. 2022, 35, 3277–3290. [Google Scholar] [CrossRef]
  39. Sha, F.Y.; Zhao, Y. The impact of the China-US trade war on firms’ financial performance-Evidence from China. Appl. Econ. 2023, 1–4. [Google Scholar] [CrossRef]
  40. Zhao, J.C.; Huang, Q.A.; Wu, X.Q.; Xiao, L. The impact of trade war on Shanghai stock exchange industry based on Granger causality network. Acta Phys. Sin. 2021, 70, 1–9. [Google Scholar] [CrossRef]
  41. Long, S.B.; Li, J.Y.; Luo, T.Y. The asymmetric impact of global economic policy uncertainty on international grain prices. J. Commod. Mark. 2023, 30, 100273. [Google Scholar] [CrossRef]
  42. Wang, X.; Yang, Y.; Tang, M.; Wang, X. The effect of macroeconomic regimes, uncertainty, and COVID-19 outcomes on commodity price volatility: Implications for green economic recovery. Econ. Res.-Ekon. Istraž. 2023, 36, 2164036. [Google Scholar] [CrossRef]
  43. Chen, B.W.; Villoria, N.B.; Xia, T. Tariff quota administration in China’s grain markets: An empirical assessment. Agric. Econ. 2020, 51, 191–206. [Google Scholar] [CrossRef]
  44. Paz, L.S.; dos Reis, M.; de Azevedo, A.F.Z. New Evidence on WTO Membership After the Uruguay Round: An Analysis at the Sectoral Level. Open Econ. Rev. 2024, 35, 1–39. [Google Scholar] [CrossRef]
  45. Lopes, J.S. Dispute Settlement System of the WTO: A Powerful Weapon for Developing Countries. In The WTO Dispute Settlement Mechanism: A Developing Country Perspective; do Amaral Júnior, A., de Oliveira Sá Pires, L.M., Lucena Carneiro, C., Eds.; Springer International Publishing: Cham, Switzerland, 2019; pp. 43–53. [Google Scholar]
  46. Moon, D. The Changing Status of Developing Countries under the World Trade Organization Dispute Settlement Mechanism. Pac. Focus 2010, 25, 136–160. [Google Scholar] [CrossRef]
  47. Moosa, I.; Burns, K. Do the Chinese Exchange Rate and Trade Policies Violate International Rules? Transnatl. Corp. Rev. 2012, 4, 50–60. [Google Scholar] [CrossRef]
  48. Rena, R. Impact of WTO Policies on Developing Countries: Issues and Perspectives. Transnatl. Corp. Rev. 2012, 4, 77–88. [Google Scholar] [CrossRef]
  49. Lang, Y.; Li, C. The impact of WTO reform on china’s economy: Some numerical simulation results. Transnatl. Corp. Rev. 2021, 13, 422–436. [Google Scholar] [CrossRef]
  50. China Will Propose WTO Reforms, but Don’t Try to Trap Us, Says Beijing’s WTO Envoy. Available online: https://www.cnbctv18.com/economy/china-will-propose-wto-reforms-but-dont-try-to-trap-us-says-beijings-wto-envoy-1443401.htm (accessed on 28 April 2024).
  51. Beckman, J.; Ivanic, M.; Shaik, S. How bilateral trade deals get in the way of multilateral agreements: Why WTO is marginalized. J. Policy Model. 2023, 45, 877–894. [Google Scholar] [CrossRef]
  52. Katona, G. Psychological Analysis of Economic Behavior; McGraw-Hill: New York, NY, USA, 1951; p. 347. [Google Scholar]
  53. Drezner, D.W. Economic Interdependence and War. J. Cold War Stud. 2015, 17, 228–231. [Google Scholar] [CrossRef]
  54. Tan, Y.; Zhao, C.C. Firms’ heterogeneity, demand accumulating, and exchange rate pass-through. South. Econ. J. 2020, 87, 700–731. [Google Scholar] [CrossRef]
  55. Sasaki, N.Z. Effects of Agricultural Policies in Kenya: An Analytical Framework and Application in the Maize Market. Ph.D. Thesis, The University of Arizona, Tucson, AZ, USA, 2000. [Google Scholar]
  56. Carreras Valle, M.J.Z. Essays on Trade Under Uncertainty. Ph.D. Thesis, University of Minnesota, Minneapolis, MN, USA, 2022. [Google Scholar]
  57. Li, J.; Rugman, A.M. Real options and the theory of foreign direct investment. Int. Bus. Rev. 2007, 16, 687–712. [Google Scholar] [CrossRef]
  58. He, Y.; Hu, W.; Li, K.; Zhang, X. Can real options explain the impact of uncertainty on Chinese corporate investment? Econ. Model. 2022, 115, 105927. [Google Scholar] [CrossRef]
  59. Duku-Kaakyire, A.; Nanang, D.M. Application of real options theory to forestry investment analysis. For. Policy Econ. 2004, 6, 539–552. [Google Scholar] [CrossRef]
  60. Kim, M.; Kim, J.-H.; Park, M.; Yoo, J. The roles of sensory perceptions and mental imagery in consumer decision-making. J. Retail. Consum. Serv. 2021, 61, 102517. [Google Scholar] [CrossRef]
  61. Zhang, G.; Li, G.; Shang, J. Optimizing mixed bundle pricing strategy: Advance selling and consumer regret. Omega 2023, 115, 102782. [Google Scholar] [CrossRef]
  62. Hong, M.Y.; Wang, J.; Tian, M.J. Rural Social Security, Precautionary Savings, and the Upgrading of Rural Residents’ Consumption Structure in China. Sustainability 2022, 14, 12455. [Google Scholar] [CrossRef]
  63. Jory, S.R.; Khieu, H.D.; Ngo, T.N.; Phan, H.V. The influence of economic policy uncertainty on corporate trade credit and firm value. J. Corp. Financ. 2020, 64, 101671. [Google Scholar] [CrossRef]
  64. Ngo, T.Q.Z. Export -Led Growth and Crowding -Out Effect Case Study: A Cointegration Approach. Ph.D. Thesis, Colorado State University, Fort Collins, CO, USA, 2009. [Google Scholar]
  65. Yang, C.H.; Hayakawa, K. The Substitution Effect of US-China Trade War on Taiwanese Trade. Dev. Econ. 2023, 61, 324–341. [Google Scholar] [CrossRef]
  66. Lei, C.C.; Qi, Q.W.; Fu, Y.; Jiang, L.L.; Liang, Q.Z. Analysis on Mechanism of China’s Grain Production Development and Evolution From 1985 to 2019. IEEE Access 2022, 10, 43221–43234. [Google Scholar] [CrossRef]
  67. Qiao, F.B. The Impact of Agricultural Service on Grain Production in China. Sustainability 2020, 12, 6249. [Google Scholar] [CrossRef]
  68. Zhang, J.H. China’s success in increasing per capita food production. J. Exp. Bot. 2011, 62, 3707–3711. [Google Scholar] [CrossRef] [PubMed]
  69. Chen, T.; Luo, W.J.; Xiang, X.Y. Exchange rate pass-through to export prices in China: Does product quality matter? Appl. Econ. 2023, 11, 1–15. [Google Scholar] [CrossRef]
  70. Akdogan, K.; Bagir, Y.K.; Torun, H. Heterogeneous effect of exchange rates on firms’ exports: Role of labor intensity. Cent. Bank Rev. 2023, 23, 100130. [Google Scholar] [CrossRef]
  71. Prado, R.; Huerta, G. Time-varying autoregressions with model order uncertainty. J. Time Ser. Anal. 2002, 23, 599–618. [Google Scholar] [CrossRef]
  72. Balcilar, M.; Gupta, R.; van Eyden, R.; Thompson, K.; Majumdar, A. Comparing the forecasting ability of financial conditions indices: The case of South Africa. Q. Rev. Econ. Financ. 2018, 69, 245–259. [Google Scholar] [CrossRef]
  73. Kim, S. Effects of Monetary Policy during Financial Market Crises and Regime Changes: An Empirical Evaluation Using a Nonlinear Vector Autoregression Model. Asian Econ. J. 2018, 32, 105–123. [Google Scholar] [CrossRef]
  74. Sims, C.A.J.E. Macroeconomics and reality. Econom. J. Econom. Soc. 1980, 48, 1–48. [Google Scholar] [CrossRef]
  75. Primiceri, G.E. Time Varying Structural Vector Autoregressions and Monetary Policy. Rev. Econ. Stud. 2005, 72, 821–852. [Google Scholar] [CrossRef]
  76. Nakajima, J.J.M.; Studies, A.E. Time-Varying Parameter VAR Model with Stochastic Volatility: An Overview of Methodology and Empirical Applications. Monet. Econ. Stud. 2011, 29, 107–142. [Google Scholar]
  77. Baker, S.R.; Bloom, N.; Davis, S.J. Measuring Economic Policy Uncertainty*. Q. J. Econ. 2016, 131, 1593–1636. [Google Scholar] [CrossRef]
  78. Villoria, N. The effects of China’s growth on the food prices and the food exports of other developing countries. Agric. Econ. 2012, 43, 499–514. [Google Scholar] [CrossRef]
  79. Yotov, Y.V. Trade adjustment, political pressure, and trade protection patterns. Econ. Inq. 2013, 51, 1867–1885. [Google Scholar] [CrossRef]
  80. Adjemian, M.K.; Smith, A.; He, W.D. Estimating the market effect of a trade war: The case of soybean tariffs. Food Policy 2021, 105, 102152. [Google Scholar] [CrossRef]
  81. Chen, Z.; Yan, B. The impact of trade policy on soybean futures in China. Manag. Decis. Econ. 2022, 43, 1152–1163. [Google Scholar] [CrossRef]
Figure 1. Shock transmission mechanism of U.S. trade policy on China’s grain trade.
Sustainability 16 04332 g001
Figure 2. U.S. Trade Policy Uncertainty Index Chart.
Sustainability 16 04332 g002
Figure 3. China’s import and export of wheat, corn, rice and soybeans, 2003–2022 (Unit: 10,000 tons. Source: official websites of the General Administration of Customs of the People’s Republic of China and the Ministry of Commerce of the People’s Republic of China).
Sustainability 16 04332 g003
Figure 4. The time-varying impulse response of wheat import and export trade.
Sustainability 16 04332 g004
Figure 5. The time-varying impulse response of maize import and export trade.
Sustainability 16 04332 g005
Figure 6. The time-varying impulse response of import and export trade of rice.
Sustainability 16 04332 g006
Figure 7. The time-varying impulse response of soybean import and export trade.
Sustainability 16 04332 g007
Figure 8. The time-varying impulse response of import and export trade in food grains (wheat, maize, paddy and soya bean).
Sustainability 16 04332 g008
Figure 9. Wheat import and export trade point-in-time impulse response.
Sustainability 16 04332 g009
Figure 10. Point-in-time impulse response of corn import and export trade.
Sustainability 16 04332 g010
Figure 11. The point-in-time impulse response of rice import and export trade.
Sustainability 16 04332 g011
Figure 12. The point-in-time impulse response of soybean import and export trade.
Sustainability 16 04332 g012
Table 1. Descriptive statistics for each series.
TypeVariableMeanS.D.SkewnessKurtosisObservations
WheatImport volume0.01400.57720.53119.5525233
Export volume−0.01180.6421−0.139321.3842233
CornImport volume0.00480.4106−0.494216.5329233
Export volume−0.00160.7960−1.673858.2468233
RiceImport volume0.00760.3749−0.09935.8748233
Export volume0.00590.6646−0.22357.1398233
SoybeansImport volume0.01320.3720−0.53615.3509233
Export volume0.00920.7540−0.40479.1238233
UTPT−0.00070.68631.683536.5491233
Note: Data from the official websites of the General Administration of Customs of the People’s Republic of China and the Ministry of Commerce of the People’s Republic of China.
Table 2. Results of series smoothness test.
TypeVariableTest Type (C, T, K)ADF StatisticCritical Value (1%)Conclusion
WheatImport volume(C, T, 1)−15.0825 ***−3.9982Smooth
Export volume(C, T, 1)−13.9111 ***−3.9982Smooth
CornImport volume(C, T, 1)−12.4770 ***−3.9982Smooth
Export volume(C, T, 1)−13.6320 ***−3.9982Smooth
RiceImport volume(C, T, 1)−14.5536 ***−3.9982Smooth
Export volume(C, T, 1)−15.8825 ***−3.9982Smooth
SoybeansImport volume(C, T, 1)−16.7825 ***−3.9982Smooth
Export volume(C, T, 1)−16.3362 ***−3.9982Smooth
UTPT(C, T, 1)−15.4513 ***−3.9982Smooth
Note: C, T and K in the test type (C, T, K) are the intercept term, the trend term and the number of lags, respectively; *** denotes significant at the 1 percent level.
Table 3. Determination of model lag order.
TypeOrderLRFPEAICSCHQ
Wheat1160.34240.03135.04965.2295 *5.1222 *
217.8152 *0.0312 *5.0479 *5.36285.1750
35.27360.03305.10255.55235.2839
41.40080.03545.17465.75945.4105
Corn1138.95350.03035.1983 *5.1983 *5.0910 *
210.02800.0313 *5.05185.36675.1788
320.7554 *0.03085.03565.48555.2171
46.77610.03235.08295.66765.3188
Rice1140.61610.01774.48084.6608 *4.5534
233.84640.01644.40704.72194.5340 *
322.2274 *0.0160 *4.3841 *4.83394.5656
46.92750.01684.43065.01544.6665
Soybean1140.70850.02164.67954.8595 *4.7521
242.62800.01934.56614.88104.6932
340.43630.01734.46014.90994.6416 *
424.3721 *0.0167 *4.4259 *5.01064.6618
Note: LR (Likelihood Ratio Statistic), FPE (Final Prediction Error), AIC (Akaike Information Criterion), SC (Schwartz Information Criterion), HQ (Hannan–Quinn Criterion), * represents the optimal order under the corresponding criterion.
Table 4. Model estimation and diagnostic results.
TypeParametric ( β ) 1 ( β ) 2 ( α ) 1 ( α ) 2 ( h ) 1 ( h ) 2
WheatGeweke0.100.810.000.120.520.99
Negative factor11.4911.9663.6928.9941.7541.70
CornGeweke0.510.010.530.130.000.00
Negative factor12.8711.3722.6724.0936.46126.10
RiceGeweke0.060.770.490.340.820.96
Negative factor12.3812.6751.0062.5839.2465.51
SoybeansGeweke0.750.040.310.090.100.26
Negative factor13.1213.3561.8575.5563.69102.34
Disclaimer/Publisher’s Note: The statements, opinions and data contained in all publications are solely those of the individual author(s) and contributor(s) and not of MDPI and/or the editor(s). MDPI and/or the editor(s) disclaim responsibility for any injury to people or property resulting from any ideas, methods, instructions or products referred to in the content.

