Abstract
Regional food marketing initiatives in the United States include state-sponsored marketing programs, promotional efforts made by non-profit organizations, and retail-level supermarket campaigns. Some employ food miles, while others emphasize state boundaries or regions. Given that U.S. consumers are faced with these options, the objectives of this study are to (1) determine whether consumers have a clear preference ranking between three regional marketing logos currently seen in the marketplace, (2) estimate whether consumers are willing to pay a price premium for food mileage information, and if so, what mileage cutoffs are preferred, and (3) uncover whether displaying food mileage, regional marketing logos, or dual-displaying both sets of information is most preferred by consumers. To address these objectives, an artefactual field experiment featuring a series of non-hypothetical, random nth-priced auctions is conducted with 98 community participants in Wisconsin. The experimental auctions feature cheese displaying a regional marketing logo, a food mileage cutoff, or both simultaneously. A random-effects two-limit tobit model is used to fit the elicited bid data. Our results suggest regional logos referencing smaller geographic areas are preferred over state logos by U.S. consumers who are willing to pay a price premium. Consumers are not willing to pay a price premium for food mileage information unless it is within 50 miles. Our results also suggest larger distances do not meet consumers’ definition of local. Therefore, to appeal to consumers, federal and state agencies, retailers, and producers should consider marketing efforts targeting smaller regional areas. Such efforts could help shorten the food supply chain while providing consumers with an opportunity to make more sustainable food choices.
1. Introduction
Regional food marketing initiatives in the United States (U.S.) include state-sponsored marketing programs (SSMPs), promotional efforts made by non-profit organizations, and retail-level supermarket campaigns. Such local food initiatives are often paired with logos, which vary how they present the concept of “local” to the consumer. Logos tied to SSMPs rely on the appeal of items from within their state’s borders. Although SSMPs vary in terms of program length and product requirements, since 2010, all fifty states in the U.S. have had at some point some form of state-sponsored agricultural marketing program [1].
In addition to state-sponsored marketing initiatives, which are primarily supported by governmental agencies, non-profit organizations also promote local food. These non-profit “buy local” programs often reference much smaller geographic regions. One of the most widely recognized is the Buy Fresh Buy Local® (BFBL) program, which is administered by Pasa Sustainable Agriculture in Pennsylvania. The BFBL program has been active since 2002, with an estimated 100 BFBL chapters across 21 states [2,3]. The majority of the BFBL chapter logos reference subregions within states’ borders. Unlike SSMPs, in which each state in the U.S. has its own unique logo, the BFBL logo is customizable to reflect a specific region, town, or county, while still maintaining a general level of conformity and similarity across states.
Paralleling these trends are regional food mileage labels that have been part of in-store marketing campaigns by mid-sized supermarket chains in the U.S. such as Roundy’s, Metcalfe’s, and Festival Foods. Displaying food mileage information in-store enables consumers to decide on purchases based on the distance an item has traveled from the point of production to the store. Although there is not yet a single federal definition for local food in the U.S., many USDA programs use what is referred to as the “statutory” definition of a local product, which is either within the state’s border, or less than 400 miles from the product’s source [4,5].
Prior U.S. Farm Bills have also used food mileage information to define local food as food sold “…less than 400 miles from the origin of the product; or the State in which the product is produced.” [4,6]. Supermarkets such as Wegmans have defined local as within 100 miles [7], while Whole Foods Market defines local as within the state of origin or 100 miles [8].
Debates over whether lower food miles are, and should be, preferable to SSMP or BFBL logos routinely appear in the popular press. As early as 2007, The New York Times [9] discussed whether consumers should be concerned about the distance their food had traveled. Later, in 2017, the U.S. Patent and Trademark Office granted a patent for a product traceability system to determine and electronically display food miles at the point of purchase [10]. While products affiliated with regional marketing initiatives facilitated by state programs, non-profits, and supermarkets can all be found in the marketplace, it is uncertain whether consumers have a clear preference ranking between them, what food mileage cutoffs consumers most prefer, and what cutoffs they may consider to be local.
Although Torquati et al. [11] have suggested that reducing food miles may have positive environmental impacts on food supply chains, Coley et al., [12] earlier remained unsure whether displaying food miles could impact consumer purchasing behavior. Meanwhile, Melkonyan et al. [13] urged the food supply chain to employ ways to make it simpler for consumers to make more sustainable food choices. Displaying food mileage information may then be one way to help consumers make such sustainable choices.
With this in mind, the objectives of this research are to (1) determine whether consumers have a clear preference ranking between three regional marketing logos currently seen in the marketplace, (2) estimate whether consumers are willing to pay a price premium for food mileage information, and if so, what mileage cutoffs are preferred, and (3) uncover whether displaying food mileage, regional marketing logos, or dual-displaying both sets of information simultaneously is most preferred by consumers.
To address these objectives, an artefactual field experiment featuring a series of non-hypothetical, random nth-priced auctions was conducted with 98 community participants in Wisconsin. The experimental auctions featured different versions of cheese; each block of cheese varied in whether it displayed a regional marketing logo, a food mileage cutoff, or both simultaneously. Three regional marketing logos were featured in the study: Wisconsin’s SSMP Something Special from WisconsinTM, Buy Fresh Buy Local®, and a regional supermarket label, Food Miles Matter.
While regional marketing logos may vary in terms of the message displayed, they all aim to increase consumer demand for local food, which in turn could help shorten food supply chains. Given the variety of regional food marketing initiatives in place, it would be helpful to identify which logos best capture consumers’ preferences and willingness to pay (WTP) for local food in the midwestern U.S. Identifying consumers’ attitudes towards and preferences between regional logos and food mileage cutoffs would help producers, marketers, and state and federal marketing agencies to promote local products, thus potentially shortening the food supply chain. No research has been published to date examining consumer preference and WTP in this region between current regional marketing logos and food mileage information.
2. Literature Review
2.1. Preference for Regional Foods
While state and federal agencies, retailers, and non-profit organizations have all attempted to define “local” using methods such as food miles and state borders, no generally accepted definition exists [5]. Local products may in fact be from a wide variety of locations: within or outside of a consumer’s state, a county, or a specific regional area. A few studies have focused on general consumer preference for local foods compared to foods from other areas. Darby et al. [14] and, earlier, Patterson et al. [15] conducted studies in Ohio and Arizona, respectively, and concluded that consumers preferred local produce over that grown in other areas of the U.S. Studies by Zepeda and Li [16] and Thilmany et al. [17] found that consumers also likely prefer local over organic, although Meas et al. [18] later identified possible substitution effects between organic and local attributes.
Several efforts have explored consumer preference for local products by identifying local as from either within a state or within a state county. Loureiro and Hine [19] surveyed Colorado consumers and found that consumers were willing to pay a premium for Colorado GrownTM potatoes compared to potatoes identified as organic or GMO-free. Schneider and Francis [20] later found that 36% of the Nebraska consumers they surveyed were willing to pay a premium for products from within their state county.
There is some evidence that SSMPs may also be successful in capturing consumer preference. SSMPs across the U.S. vary in terms of their program guidelines and use, but all highlight a product as having originated from within the state’s borders [1]. Several studies have explored consumer preference for SSMPs. Carpio and Isengildina-Massa [21] concluded that South Carolina consumers were willing to pay premiums of over 20% for Certified SC Grown® products. The preference for SSMP products versus those with generic local designations varied among consumers in the Mid-Atlantic U.S.—New Jersey consumers clearly preferred Jersey FreshTM products over local ones, whereas Delaware consumers were indifferent between their SSMP’s products versus a generic local product [22]. One recent work by Neill et al. [23] notes that when consumers are faced with SSMP products from neighboring states, consumers may not necessarily prefer their own state’s SSMP product.
SSMPs assume that consumers view products from within their state’s borders to be local. However, this may not hold in larger states, where consumers may consider smaller geographic regions as being local. Although conducted in the UK, a study by Sirieix et al. [24] found that UK consumers were receptive towards more regional logos, such as those designating a specific county of origin. As more region-specific logos appear on food products, such as “buy local” logos identifying a county or regional area, there is a need to determine if such logos are more preferable to consumers. An exploratory study by Zepeda et al. [25] examined consumer preference for sustainable food labels in several countries. The BFBL logo and several SSMP logos were included in their study, with the results indicating that BFBL was most preferred by consumers. The work by Hinrichs and Allen [26] is the only known study to have solely explored the BFBL campaign. However, their efforts focused on potential social injustice issues rather than consumer preference. Whether or not consumers are willing to pay a price premium for BFBL products has so far been unexplored.
While all of these prior studies found evidence of consumer preference for local food, none explored which locality information consumers most prefer: whether they prefer regional logos, food miles, or both. In addition, the majority of these prior studies used hypothetical methods (and, in some cases, hypothetical products) to determine consumer preference. State and federal marketing agencies, retailers, and consumers would gain from the contribution of this research to the literature. Whether consumers prefer information on food miles over state or regional logos would be vital information for state and federal agencies, retailers, local producers, and non-profits as they decide how to best support labeling efforts that could help shorten the food supply chain.
2.2. Food Miles
Reducing food miles has been studied as a possible way to lessen environmental impact, including through reducing greenhouse gas emissions and energy use [11,27,28]. Mundler and Rumpus [29] examined local food systems in France, and concluded that local fruit and vegetable distribution may result in less energy use compared to longer supply chains. When exploring local food networks, Melkonyan et al. [13] suggested that environmental concerns may be an important consumer criterion when examining the “last-mile logistics” of delivering food products.
However, limited studies have explored consumer preference for food miles, and these studies have primarily focused on non-U.S. consumers. Research by Sirieix et al. [30] concluded that consumers in France were concerned about the distance their food had traveled. Kemp et al. [31] surveyed UK grocery store consumers and found that approximately 20% indicated that if food miles were displayed, it would impact their purchasing decisions. In Italy, Caputo et al. [32] conducted a choice experiment in which consumer preference for two different food mileage labels were examined. The authors concluded that more positive effects were associated with the label displaying only the number of food miles.
Lim and Hu [33] conducted a choice experiment with Canadian consumers, and concluded that consumers were indifferent between products labeled as “local” and products labeled as “local: from within 160 km”. However, no additional mileage cutoffs were used in their study. Grebitus et al. [34] also explored how transportation distance might influence preference and WTP using German consumers. Their study is particularly relevant to this research as non-hypothetical experimental auctions with food products were employed. Grebitus et al. [34] used four different mileage cutoffs and concluded that consumer WTP declines when a product’s transportation distance increases. A later study by de Magistris and Gracia [35] involved a non-hypothetical choice experiment with consumers in Spain and likewise concluded that consumers prefer products that indicate traveling a shorter distance from the point of production. A more recent work by Meyerding et al. [36] conducted with German consumers concluded that most considered local food to be that which was both grown and sold within the same state. Bazzani and Canavari [37] likewise concluded that Italian consumers considered local to be related to geographic region rather than a certain number of food miles.
Lastly, limited studies have focused on U.S. consumers’ preferences for food miles. Govindasamy et al. [38] surveyed minority households across the U.S. and concluded that approximately 34% of households had recently changed their purchasing behavior due to concerns over food miles. Akaichi et al. [39] concluded that consumers exhibited increased WTP for rice that displayed lower food miles. Lopez and Khanal [40] examined consumer preference for food miles for cow’s milk and concluded that consumers preferred milk with lower food miles.
3. Methods
3.1. WTP and Experimental Auctions
Prior work has noted that auction experiments are both particularly useful and extensively used for eliciting consumers’ price responses [41]. This study used experimental auctions to determine consumer demand and WTP for several reasons. First, auctions have been used to determine consumer WTP for a variety of food products: grass-fed beef [42], sandwich bread [43], canned tuna [44], nano-packaged food items [45], French baguettes [46], and apricot fruit juice [47], among others. Secondly, by uncovering actual WTP estimates, our results can be easily interpreted for product marketing by regional marketing programs, state and federal agencies, grocery retailers, and other local food stakeholders.
Another advantage of using experimental auctions is that they are non-hypothetical. A concern with hypothetical methods is that some consumers may indicate a higher WTP knowing that there is no true monetary consequence for doing so. List and Gallet [48] found that such hypothetical bias can lead to WTP estimates being up to twenty times larger compared to non-hypothetical estimates. Another advantage is that auctions are incentive-compatible: the participants’ best strategy is to reveal their true value for each item. Canavari et al. [49] discuss several of the most commonly used auction mechanisms in the literature and suggest that the most popular include the Becker–DeGroot–Marschak (BDM) auction, the second-price auction, and the random nth-price auction. The BDM mechanism is particularly helpful in situations where researchers may need to elicit WTP with subjects individually, whereas the second-price and random nth-price mechanisms are often used with groups of subjects [49].
Versions of Vickrey’s [50] incentive-compatible second-price auction are widely used in the literature. In a traditional Vickrey auction, the highest bidder purchases the item but pays a price equal to the bid of the second-highest bidder. A participant’s bid determines whether they have won and thus will purchase a unit of the item. The auction selling price is set by the second-highest bid, and so is always below the auction winner’s actual bid. Since participants never actually pay what they bid, this eliminates issues of participants either bidding lower than their value to secure a bargain or bidding higher to simply win the auction.
Determining WTP can be viewed as an individual consumer’s utility maximization problem. Following Lusk and Shogren [51], we define the utility function for consumer i as Ui (X, q), where X is a vector defined as the various levels of market goods displaying regional logos and/or food mileage information, and q is the level of a good’s quality as interpreted by the consumer through their price response. This level of quality is exogenously fixed by the regional logo and/or food mileage information displayed for each good. Cheese is used as the market good in our experimental auctions, and it is assumed that an individual consumes at least one unit of cheese within a given time period. Therefore, we next consider an individual’s WTP for cheese item j:
where αij is the fixed amount that the individual i is willing to pay for cheese item j, independent of the item’s displayed locality information; VLikj is the monetary value a person places on the logo information (which are treatments k = 1, 2, 3); and VMikj is the monetary value a person places on the displayed food mileage information. A reduced form of WTP Equation (1) is later estimated using Stata 17.0 further below.
WTPij = αij + VLikj + VMikj
The research proposed here aims to uncover whether the utility gained from a local good’s perceived quality q can be defined as a function of both the regional logo displayed and/or the food mileage information presented. The conceptual model for an individual consumer’s utility is then as follows:
Ui (X, q (regional logo, food mileage cutoff)).
3.2. WTP Elicitation and Experimental Design
To determine consumer preference and WTP for regional logos and food mileage cutoffs, non-hypothetical random nth-priced experimental auctions, conducted as an artefactual field experiment, were conducted with food-shopping consumers. An artefactual field experiment differs from a standard laboratory experiment in that participants from the “market of interest” are used [52,53]. Restricting the sample to only food-shopping consumers allows the sample to be more representative of the target population. The auctions were conducted during 2015 at a midwestern university research lab in Wisconsin.
A total of 98 participants were recruited in Wisconsin for a single session, each lasting approximately 40 min. Similar sample sizes have yielded meaningful results in prior studies [46,54,55,56]. Groups of 8–20 participants comprised each of the 8 sessions conducted, and the same researcher conducted all 8 sessions. Participants were recruited through online community event postings, advertisements in local news sources, and postings at public libraries and community centers within a 30 min driving radius of the college campus. Recruitment materials referred to the auctions only as a “consumer study” to avoid any possible sample selection bias.
Participants were prescreened and excluded if they had not shopped for food products within the past month, if they were not 18 years old or older, if they did not consume cow’s milk cheese, or if they indicated an allergy or intolerance to cheese. The prescreen asked about their consumption of a variety of food products so that the participants would not identify that cow’s milk cheese would be featured in the study.
When participants arrived for their session, they were informed of the study purpose and protocol, and provided their signed informed consent to participate. The order of study tasks can be viewed in Table 1. The study protocol was approved by the university’s Institutional Review Board for research on human subjects. At the start of the session, the participants were informed that all auctions would feature a ½ lb (8 oz.) block of marbleized Colby-Jack cow’s cheese. Marbleized Colby-Jack was used as it is a mild-flavored cheese commonly found in the marketplace and a mixture of the two most common cheese colors.

Table 1.
Order of tasks in the study.
Marbleized cow’s cheese was chosen for this study as it is readily available in the marketplace featuring the regional logos and mileage cutoffs being investigated, and is a familiar product in the region that is available year-round. Participants were told they would be given USD 15 to use in the auctions, which was also the maximum they could bid in any one auction. Participants were paid USD 25–32 in cash, minus any cheese won, at the end of the session. They were also informed they would participate in several auctions, although only one would be binding. Thus, they could purchase at most one block of cheese with their USD 15.
Retail prices for the various blocks of cheese ranged from USD 2.89 to USD 4.35. Reference prices were not provided to participants in the auctions so as not to influence their bids [43,57,58]. The binding block of cheese auction was pre-decided, sealed in an envelope, displayed at the front of the room at the start of the session, and revealed at the end along with the selling price.
A slight variation of Vickrey’s original auction was used to allow for more purchasers (up to 5 per session) in order to keep participants engaged throughout the experiment [51]. Shogren et al. [59] found that random nth-priced auctions are comparable to Vickrey’s original second-price auction. Therefore, following Bernard and Bernard [60,61], a random nth-priced auction was used, and the number of people who could purchase was set to ¼ of the session size. A session with 20 participants for example would have 5 auction winners, who would each pay the sixth-highest bid for one unit of the auction item.
To reinforce the instructions, participants were presented with a series of examples adapted from Bernard et al. [62] accompanied by 8 quiz questions. Approximately 90.8% of participants correctly answered all 8 questions. Following the quiz, they completed two practice auctions. Approximately 81.6% of participants bid their induced value in the practice auction. Of those who did not, the practice bids for these participants on average were 6% different from their induced value. The results from the practice quiz and practice auctions suggested that the participants generally understood both the auction mechanism and the recommended best strategy for bidding in the auctions.
Participants were next shown 17 blocks of cheese that would be auctioned off. To mimic the marketplace as closely as possible, participants were able to examine each block prior to placing their bids, and background information on each of the regional logos, beyond what was displayed on the label, was not provided. The 17 auction treatments were investigated in a within-subjects design, and can be viewed in Table 2. A sample auction round can be viewed in Figure 1. To address order effects, the display order of the auction rounds was randomized at the individual level, as was the on-screen display order of the individual auctions within rounds. To avoid bid affiliation, the winning prices of each individual auction were not announced.
Table 2.
Auction information treatments and rounds 1.
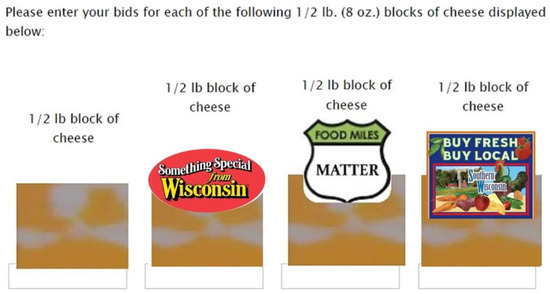
Figure 1.
Sample auction round (Round A) featuring regional logos.
Once the auction rounds were completed, participants completed a post-experiment questionnaire. A prior work by Zepeda et al. [25] suggests that both participant characteristics and logo components should be considered as possible factors influencing consumer preference for food logos. This questionnaire asked about the food shopping venues the participants frequented, their familiarity with the three regional logos, how trustworthy they considered the logos and food miles displayed to be, their price sensitivity when shopping for food, and standard demographics.
3.3. Statistical Model
A random-effects two-limit tobit model was estimated with the consumers’ bids (WTP) as the dependent variable of interest. WTP was restricted to between USD 0 and USD 15, in line with the bid restrictions for each of the auctions. This tobit model is a function of the differing regional food logos and food mileage cutoffs presented in the auctions, as well as explanatory variables from the post-experiment questionnaire, and relevant demographic variables. Correlations between these variables were analyzed to assist with building the econometric model.
As the participants entered several bids each, the error terms were likely correlated. Post-estimation tests performed on earlier model versions revealed the presence of individual heterogeneity. Following Waldman and Kerr [63] and Teuber et al. [64], a random-effects model was deemed a more appropriate fit for the data. The random-effects tobit treats each participant as a panel, allowing one to control for any unobserved heterogeneity. The final random-effects two-limit tobit model estimated in Stata 17.0 was as follows:
where Bij = {elicited bid} censored between USD 0 and USD 15; X/ = {Ti, Ai, Zi}; i = 1, …, n consumers; and j = 1, …, ni bids. Individual heterogeneity among the consumers = δi; these random effects are independent and identically distributed (i.i.d). ɛij = the error term with a zero mean across consumers, which is i.i.d independently of δi.
Bij = X/β + δi + ɛij
The baseline treatment featuring no regional logo or food mileage information is captured by the intercept term. A description of the variables used in Equation (3) can be viewed in Table 3. Ti consists of treatment dummy variables SSFWLogo, BFBLLogo, FMMLabel, 50 Miles, 100 Miles, 200 Miles, and 400 Miles, which are coded as 1 if the information was displayed in the auction, and 0 otherwise. As 9 of the auctions featured dual-displayed information, Ti also includes 9 interaction terms between the treatment dummy variables. Ai includes additional explanatory variables gathered from the post-experiment questionnaire for consumer i, coded as 1 if the participant agreed and 0 otherwise: Trustworthy, LogoFamiliarity, PriceSensitivity, and 3 interaction terms between Trustworthy and the treatment dummy variables. PrimarilyShopDirectSalesVenues is coded as 1 if the participant shopped mainly at venues where customers buy directly from farmers. Interaction terms between LogoFamiliarity and the three regional logos did not improve model fit, and thus were excluded from the model. Likewise, interaction terms between PrimarilyShopDirectSalesVenues and the regional logos and food mileage information also did not improve model fit. Approximately 31% of the participants primarily shopped for food at direct sales venues, and 20% indicated that price was the most important factor they considered when food shopping.
Table 3.
Description of variables.
Lastly, Zi consists of demographic variables for consumer i: Female, Age, BachelorsPlus, and Income10K. The study sample was 63% female and on average 36 years old. Approximately 74% had a bachelor’s degree or higher, with an average household income of USD 55,100. Quadratic effects Age2 and Income10K2 did not improve model fit, and thus were excluded from the final model. Variables for race and ethnicity were not included in the model due to low representation in the sample: only 11.2% of participants identified as non-white, and only 3.1% identified as Hispanic.
3.4. Hypotheses
It is expected that the consumers will exhibit a clear preference ranking between the three regional marketing logos, similar to findings by Onken et al. [22]. While the order of this ranking is unclear, coefficient estimates for SSFWLogo, BFBLLogo, and FMMLabel are expected to be statistically significant and have a positive effect on WTP over a conventional block of cheese. It is also hypothesized that consumers will be willing to pay a price premium for food mileage information and will prefer lower mileage cutoffs compared to higher cutoffs. This would contradict the frequently used cutoff of 400 miles. Lastly, it is unclear whether consumers will prefer food mileage information over regional marketing logos, or whether dual-displaying both mileage and logos simultaneously may be most preferred.
All remaining model variables in Table 3 are expected to have a significant effect on WTP. Following Zepeda et al. [25], individual characteristics such as logo familiarity, price sensitivity, shopping venues frequented, and demographics are expected to have a significant effect on WTP, although the direction of each effect remains unclear. Consumers’ perceived trustworthiness of the regional logos and food mileage information is expected to have a significantly positive effect on WTP, following suggestions by Lowry et al. [65].
4. Results
4.1. Descriptive Statistics for Bid Premiums
The average bids, by auction treatment, can be viewed in Table 4. The highest average bid (USD 4.77) is observed for auction treatment T10, which featured the Buy Fresh Buy Local® logo and a food mileage cutoff of 50 miles. The second-highest average bid (USD 4.67) is observed for auction treatment T3, which displayed the BFBL logo only.
Table 4.
Average bids (WTP) by auction treatment.
Differences between the bids were examined to determine preference ranking. As auction bid data are typically not normally distributed [51], Shapiro–Wilk tests for normality were performed on each of the auction treatments. The results of these tests rejected normality at less than the 1% level; therefore, non-parametric Wilcoxon signed-rank tests for matched pairs were performed rather than paired t-tests (Table 5). Consumer preference can be observed for only two out of the three regional marketing logos examined: Something Special from WisconsinTM and Buy Fresh Buy Local®. A premium of 18.16% (p ≤ 0.001) for the SSFW cheese and a premium of 30.45% (p ≤ 0.001) for the BFBL cheese are observed, compared to conventional cheese. Bids for cheese displaying the supermarket Food Miles Matter label are not statistically different from the bids for conventional cheese. Comparing bids for SSFW and BFBL, a bid premium of 12.29% (p ≤ 0.001) is observed for BFBL over the SSFW cheese. As hypothesized, there is a clear preference ranking in the order of BFBL, SSFW, and FMM among the three regional logos investigated. However, contrary to expectations, the average bid for cheese displaying the FMM label is not statistically different from that for the conventional cheese.
Table 5.
Descriptive statistics for bid premiums, comparing regional logos.
Of the four mileage cutoffs examined, only the food mileage cutoff of 50 miles produced significantly different results from the conventional cheese (Table 6). Consumers were willing to pay a price premium of 13.13% (p < 0.001) for cheese with a mileage cutoff of 50 miles (referred to as “50 miles”) compared to conventional cheese. As consumers preferred SSFW, BFBL, and 50 miles over the other versions examined, Table 7 compares these three auction treatments. No statistically significant bid premium is observed for SSFW when compared to 50 miles. However, consumers were willing to pay a price premium of 15.31% (p < 0.001) for BFBL compared to 50 miles.
Table 6.
Descriptive statistics for bid premiums: comparing food mileage cutoffs.
Table 7.
Descriptive statistics for bid premiums: comparing regional logos and the food mileage cutoff of 50 miles.
Table 8 compares Something Special from WisconsinTM, Buy Fresh Buy Local®, and 50 miles to versions where both a regional logo and a mileage cutoff were displayed. For brevity, the five highest average bids out of the nine dual-information treatments are examined. No statistically significant positive bid premiums are observed for any of the dual-information auction treatments compared to cheese that displayed only the Buy Fresh Buy Local® logo. However, three dual-information treatments were preferred over cheese displaying just the Something Special from WisconsinTM logo. Compared to SSFW, the following bid premiums are observed: 12.77% (p ≤ 0.001) for versions displaying both 50 miles and BFBL, 7.33% (p = 0.0037) for versions displaying both 50 miles and SSFW, and 5.44% (p = 0.0073) for versions displaying both 100 miles and BFBL. No significant difference in bids is observed between the cheese displaying only Something Special from WisconsinTM and the versions displaying both 100 miles and SSFW.
Table 8.
Descriptive statistics for bid premiums: comparing regional logos and the food mileage cutoff of 50 miles against dual-information treatments.
Compared to displaying 50 miles only, the following bid premiums are observed: 17.78% (p ≤ 0.001) for versions displaying both 50 miles and BFBL, 12.1% (p ≤ 0.001) for versions displaying both 50 miles and SSFW, 10.12% (p ≤ 0.001) for versions displaying both 100 miles and BFBL, and 5.93% (p = 0.0178) for versions displaying both 100 miles and SSFW. No significant difference in bids is observed between 50 miles and the versions displaying both 200 miles and SSFW. Lastly, Table 9 presents comparisons between the three dual-information treatments with the highest bid premiums. Versions displaying both 50 miles and Buy Fresh Buy Local® were the most preferred out of these three.
Table 9.
Descriptive statistics for bid premiums: comparing selected dual-information treatments.
Overall, examining these comparisons suggests that out of the 17 auction treatments investigated, Buy Fresh Buy Local® is most preferred by consumers. Adding 50 miles to a product displaying a BFBL logo did not significantly influence WTP compared to displaying only BFBL. However, adding a mileage cutoff of 100 miles to the BFBL logo reduced consumer WTP for BFBL.
4.2. Random-Effects Two-Limit Tobit Model
The results (Table 10) of the random-effects tobit support some hypotheses; significant bid premiums are uncovered for two out of three regional marketing logos investigated. Both SSFWLogo and BFBLLogo have a significantly positive effect on WTP. BFBLLogo is estimated to increase WTP by USD 0.89, holding all other factors constant. Likewise, SSFWLogo is estimated to increase WTP by USD 0.42. The supermarket FMMLabel is not statistically significant.
Table 10.
Random-effects two-limit tobit model: elicited bids (WTP) (n = 1666 bids).
The only food mileage cutoff that consumers were willing to pay significantly more for is 50 Miles, which is estimated to increase WTP by USD 0.64. When examining potential interactions between regional logos and food mileage cutoffs, only two statistically significant interactions are observed. Both BFBLLogo * 50 Miles and BFBLLogo * 100 Miles have a significantly negative interaction. The negative interaction for BFBLLogo * 50 Miles suggests that a product displaying both Buy Fresh Buy Local® and 50 miles could expect a price premium of approximately USD 1.18 compared to conventional versions. Similarly, the negative interaction for BFBLLogo * 100 Miles suggests that displaying both BFBL and 100 miles would incur a premium of approximately USD 0.55, which is less than the premium of USD 0.89 estimated for displaying Buy Fresh Buy Local® only. Displaying both Something Special from WisconsinTM and 50 miles is estimated to increase the WTP by USD 1.06; displaying SSFW and any other mileage cutoff is not estimated to be significantly different than just displaying SSFW only.
Several explanatory and demographic variables collected from the post-experiment questionnaire have a statistically significant effect on WTP. If consumers “agreed” or “strongly agreed” that the locality information displayed on the product was trustworthy, they were willing to pay an estimated USD 1.02 more. A significantly positive interaction is observed between Trustworthy and SSFWLogo, and between Trustworthy and BFBLLogo, which are estimated to increase WTP by an additional USD 0.38 and USD 0.37, respectively, beyond the USD 1.02 observed for Trustworthy.
If consumers indicated that price is the most important factor they consider when food shopping, they were willing to pay an estimated USD 0.46 less. Lastly, consumers who primarily shopped at direct sales venues such as farmers’ markets, CSAs, and co-ops, compared to grocery stores, were willing to pay an estimated USD 0.40 more. Being familiar with the regional logo displayed does not have a significant effect on WTP. The percentages of participants indicating prior familiarity with Something Special from WisconsinTM, Buy Fresh Buy Local®, and Food Miles Matter were 66.3%, 68.4%, and 53.1%, respectively. Likewise, Female, Age, and BachelorsPlus are also not significant. The only significant demographic variable is Income10K, which has a significantly positive effect on WTP.
5. Conclusions
The results from these experimental auctions indicate a clear preference ranking for the three regional marketing logos investigated. The non-profit logo Buy Fresh Buy Local® (BFBL) was the most preferred by consumers out of the three. Something Special from Wisconsin™ (SSFW) is ranked second in preference, while no significant price premium is observed for the supermarket Food Miles Matter (FMM) label compared to conventional versions. This is important information for both state-sponsored marketing programs (SSMPs), retailers, and food supply chain and sustainability stakeholders. To appeal to local food consumers, it may be wise for SSMPs to consider more targeted “buy local” initiatives focused on areas smaller than the state’s border, such as a particular county or region. Whether consumers would be willing to pay a premium similar to BFBL’s for an SSFW logo that referenced their state county or geographic part of the state (such as Southern Wisconsin) is an area in need of further research. Consumers in geographically larger states in particular may be willing to pay a premium for products identified under more targeted SSMP campaigns (and logos).
The findings of this study also suggest that consumers may be willing to pay a price premium for products displaying food mileage information of 50 miles or less, which may be helpful for efforts to shorten the food supply chain. This finding aligns with earlier work by Grebitus et al. [34], who concluded that consumers were willing to pay more for low mileage cutoffs. This is important information for stakeholders looking to display food miles at the point of purchase, and for those looking to improve the sustainability of local food during a product’s final journey to the consumer. In-store sustainable marketing campaigns may wish to consider highlighting the geographic region or county the product is from if its food miles are greater than 50 miles. However, a limitation of this study is that only four mileage cutoffs were investigated: it is unknown how mileage cutoffs over 400 will influence consumer WTP. It is possible that consumers may be willing to pay a premium for products with a food mileage greater than 50 but less than 100. However, the price premium observed for Buy Fresh Buy Local® compared to 50 miles suggests that utilizing the BFBL logo may be a better strategy than displaying just food mileage information.
A limitation of this research is also that cow’s milk cheese, a value-added product, was featured in the study. Future studies could explore whether the findings here concerning food miles hold for non-value-added items, such as whole produce. It could be that consumers are less concerned about food miles for value-added products. They may view the term as being less clear-cut than for items such as fresh produce. Whether consumers are more willing to pay a premium for food mileage information for fresh products, compared to value-added products, warrants additional research. Such information would be particularly important for sustainable marketing campaigns at the retail level, which could use this knowledge to better tailor in-store promotional efforts.
Our findings also suggest that consumers may prefer products with a local definition of 50 miles or less from the point of origin. Although, whether consumers actually consider “local” to mean within 50 miles or less warrants further research. It could be that consumers do not conceptualize distance in terms of the mileage a product has traveled. If so, this would help explain why Buy Fresh Buy Local®, which references a particular region (Southern Wisconsin), was preferred over 50 miles, and over Something Special from WisconsinTM, which references the entire state. When measuring a product’s locality, U.S. policymakers may wish to consider using either shorter distances or regions within a state’s borders to appeal to local consumers while simultaneously helping to shorten the food supply chain.
Whether consumers prefer products that dual-display both mileage information and a regional logo may depend largely on both the logo and mileage cutoff used. For BFBL, displaying both the logo and 50 miles did not significantly increase WTP compared to displaying BFBL only. It could be that consumers may already consider products displaying BFBL to be from within a 50-mile radius. From the results of the estimated random-effects tobit model, adding a mileage cutoff of 100 miles when displaying BFBL actually reduced the premium observed for BFBL. This seems to further support the earlier-made suggestion that U.S. consumers may consider local to be within 50 miles.
For the state-sponsored marketing logo Something Special from WisconsinTM, consumers were willing to pay a premium when both SSFW and 50 miles were displayed, compared to SSFW only. However, adding any of the remaining mileage cutoffs to the SSFW products’ labeling did not ensure an increased premium over SSFW. For established state programs such as SSFW, working with retailers within a 50-mile radius of the product’s origin may help secure increased premiums for program products. Likewise, retailers may wish to display food miles for SSFW products from within a 50-mile radius, at the point of purchase. For state-sponsored marketing programs, efforts targeting smaller areas within the state’s borders could help increase product premiums. It is also possible that the consumers in this study may have considered SSFW products to have originated from 100 or more miles away. As previously mentioned, a limitation of this study is that the product investigated was cheese, an item Wisconsin is well known for. Whether consumers are willing to pay similar premiums for other value-added SSFW products, or fresh SSFW produce items, requires further research.
Regional marketing initiatives should also consider paying particular attention to establishing a sense of trustworthiness with consumers. The results uncovered here indicate that consumers may be willing to pay more for a product bearing a logo they consider to be trustworthy; this premium was estimated to increase by an additional amount if they perceived BFBL or SSFW to be trustworthy. Future work investigating which logo components and displayed locality information consumers consider to be the most trustworthy may provide helpful information for regional marketing initiatives.
In conclusion, the results of this study suggest that regional logos referencing smaller geographic areas, such as Buy Fresh Buy Local®, could be most preferred by consumers. The BFBL logo is predominately blue; earlier work by Sirieix et al. [24] suggests that consumers most prefer logos with blue coloring in their design. Both the BFBL and SSFW products were preferred by consumers over those displaying food miles. That consumers appear to most prefer the BFBL logo aligns with prior findings from an exploratory study of consumers by Zepeda et al. [25]. This finding also aligns with Sirieix et al. [24], who suggest that consumers are most receptive to logos referencing smaller regional areas. When faced with products simultaneously displaying both a regional logo and food miles, consumers in this study were generally not willing to pay a premium for the additional mileage information. State and federal marketing initiatives may wish to reevaluate programs utilizing a definition of local based on mileage cutoffs greater than 50 miles or based on state borders. Future work should examine whether consumers may be willing to pay for mileage information for non-value-added products, or if the mileage displayed is less than 50 miles. While food miles did not appear to be of interest to the Midwestern U.S. participants in this study, it may be that in other regions of the U.S., they may be viewed more favorably; future research in other regions is needed to investigate this.
Author Contributions
Conceptualization, K.A.C. and L.Z.; methodology, K.A.C. and L.Z.; software, K.A.C.; validation, K.A.C. and L.Z.; formal analysis, K.A.C.; investigation, K.A.C.; resources, K.A.C. and L.Z.; data curation, K.A.C.; writing—original draft preparation, K.A.C. and L.Z.; writing—review and editing, K.A.C. and L.Z.; visualization, K.A.C.; supervision, L.Z.; project administration, K.A.C. and L.Z.; funding acquisition, K.A.C. All authors have read and agreed to the published version of the manuscript.
Funding
Research support was provided by the University of Wisconsin-Madison Department of Consumer Science and by the University of Wisconsin-Madison School of Human Ecology STAR Program funds.
Institutional Review Board Statement
The study was conducted in accordance with the Declaration of Helsinki, and approved by the Institutional Review Board of the University of Wisconsin-Madison (protocol code 2014-0592; approved 27 May 2014).
Informed Consent Statement
Informed consent was obtained from all subjects involved in the study.
Data Availability Statement
The data presented in this study are available on request from the corresponding author.
Acknowledgments
We thank John C. Bernard and Anya Samek for their helpful feedback on earlier versions of the manuscript.
Conflicts of Interest
The authors declare no conflicts of interest.
References
- Onken, K.A.; Bernard, J.C. Catching the “Local” Bug: A Look at State Agricultural Marketing Programs. Choices 2010, 25, 1–7. [Google Scholar] [CrossRef]
- Charney, M. FoodRoutes Network and the Local Food Movement. J. Agric. Food Inf. 2009, 10, 173–181. [Google Scholar] [CrossRef]
- Farmers Market Coalition. Buy Fresh Buy Local. 2021. Available online: https://farmersmarketcoalition.org/programs/buy-fresh-buy-local/ (accessed on 20 January 2024).
- Johnson, R.; Cowan, T. 2018 Farm Bill Primer: Support for Local Food Systems; Congressional Research Service, Library of Congress: Washington, DC, USA, 2019. [Google Scholar]
- McKeag, L.; Kruszewski, S. Defining Local Food: An Analysis of State Approaches and Challenges. Vermont Law and Graduate School. 2021. Available online: https://www.vermontlaw.edu/academics/centers-and-programs/center-for-agriculture-and-food-systems/reports/defining-local-food (accessed on 12 March 2024).
- Martinez, S.; Hand, M.; Pra, M.D.; Pollack, S.; Ralston, K.; Smith, T.; Vogel, S.; Clark, S.; Lohr, L.; Low, S.; et al. Local Food Systems: Concepts, Impacts, and Issues; Economic Research Report No. 96635; United States Department of Agriculture, Economic Research Service: Washington, DC, USA, 2010. [Google Scholar]
- Wells, J. Growing Pains: Why Supermarkets Are Struggling to Source Local Products. Grocery Dive. 2017. Available online: https://www.grocerydive.com/news/grocery--grocery-source-local-vegetables-fruit-produce/535172/ (accessed on 12 March 2024).
- Wagaman, A. When Whole Foods Asked for Local Produce, more than 100 Growers Applied. The Morning Call. 2016. Available online: https://www.mcall.com/2016/05/14/when-whole-foods-asked-for-local-produce-more-than-100-growers-applied/ (accessed on 20 January 2024).
- McWilliams, J.E. Food That Travels Well—The New York Times. 2007. Available online: https://www.nytimes.com/2007/08/06/opinion/06mcwilliams.html (accessed on 12 March 2024).
- Grant, E. Systems and Methods for Determining Food Miles. U.S. Patent 9,684,730, 20 June 2017. [Google Scholar]
- Torquati, B.; Cecchini, L.; Paffarini, C.; Chiorri, M. The Economic and Environmental Sustainability of Extra Virgin Olive Oil Supply Chains: An Analysis Based on Food Miles and Value Chains. Econ. Agro-Aliment. Food Econ. Open Access 2021, 23, 1–28. [Google Scholar] [CrossRef]
- Coley, D.; Howard, M.; Winter, M. Food Miles: Time for a Re-think? Br. Food J. 2011, 113, 919–934. [Google Scholar] [CrossRef]
- Melkonyan, A.; Gruchmann, T.; Lohmar, F.; Kamath, V.; Spinler, S. Sustainability Assessment of Last-Mile Logistics and Distribution Strategies: The Case of Local Food Networks. Int. J. Prod. Econ. 2020, 228, 107746. [Google Scholar] [CrossRef]
- Darby, K.; Batte, M.T.; Ernst, S.; Roe, B. Decomposing Local: A Conjoint Analysis of Locally Produced Foods. Am. J. Agric. Econ. 2008, 90, 476–486. [Google Scholar] [CrossRef]
- Patterson, P.M.; Olofsson, H.; Richards, T.J.; Sass, S. An Empirical Analysis of State Agricultural Product Promotions: A Case Study on Arizona Grown. Agribusiness 1999, 15, 179–196. [Google Scholar] [CrossRef]
- Zepeda, L.; J. Li. Who Buys Local Food? J. Food Distrib. Res. 2006, 37, 1–11. [Google Scholar] [CrossRef]
- Thilmany, D.; Bond, C.A.; Bond, J.K. Going Local: Exploring Consumer Behavior and Motivations for Direct Food Purchases. Am. J. Agric. Econ. 2008, 90, 1303–1309. [Google Scholar] [CrossRef]
- Meas, T.; Hu, W.; Batte, M.T.; Woods, T.A.; Ernst, S. Substitutes or Complements? Consumer Preference for Local and Organic Food Attributes. Am. J. Agric. Econ. 2015, 97, 1044–1071. [Google Scholar] [CrossRef]
- Loureiro, M.L.; Hine, S. Discovering Niche Markets: A Comparison of Consumer Willingness to Pay for Local (Colorado Grown), Organic, and GMO-Free Products. J. Agric. Appl. Econ. 2002, 34, 477–487. [Google Scholar] [CrossRef]
- Schneider, M.L.; Francis, C.A. Marketing Locally Produced Foods: Consumer and Farmer Opinions in Washington County, Nebraska. Renew. Agric. Food Syst. 2005, 20, 252–260. [Google Scholar] [CrossRef]
- Carpio, C.E.; Isengildina-Massa, O. Consumer Willingness to Pay for Locally Grown Products: The Case of South Carolina. Agribusiness 2009, 25, 412–426. [Google Scholar] [CrossRef]
- Onken, K.A.; Bernard, J.C.; Pesek, J.D. Comparing Willingness to Pay for Organic, Natural, Locally Grown, and State Marketing Program Promoted Foods in the Mid-Atlantic Region. Agric. Resour. Econ. Rev. 2011, 40, 33–47. [Google Scholar] [CrossRef]
- Neill, C.L.; Holcomb, R.B.; Lusk, J.L. Estimating Potential Beggar-Thy-Neighbor Effects of State Labeling Programs. Agribusiness 2020, 36, 3–19. [Google Scholar] [CrossRef]
- Sirieix, L.; Delanchy, M.; Remaud, H.; Zepeda, L.; Gurviez, P. Consumers’ Perceptions of Individual and Combined Sustainable Food Labels: A UK Pilot Investigation. Int. J. Consum. Stud. 2013, 37, 143–151. [Google Scholar] [CrossRef]
- Zepeda, L.; Sirieix, L.; Pizarro, A.; Corderre, F.; Rodier, F. A conceptual framework for analyzing consumers’ food label preferences: An exploratory study of sustainability labels in France, Quebec, Spain and the US. Int. J. Consum. Stud. 2013, 37, 605–616. Available online: https://onlinelibrary.wiley.com/doi/abs/10.1111/ijcs.12041 (accessed on 20 January 2024). [CrossRef]
- Hinrichs, C.C.; Allen, P. Selective Patronage and Social Justice: Local Food Consumer Campaigns in Historical Context. J Agric Env. Ethics 2008, 21, 329–352. [Google Scholar] [CrossRef]
- López, L.A.; Cadarso, M.-A.; Gómez, N.; Tobarra, M.-Á. Food Miles, Carbon Footprint and Global Value Chains for Spanish Agriculture: Assessing the Impact of a Carbon Border Tax. J. Clean. Prod. 2015, 103, 423–436. [Google Scholar] [CrossRef]
- Van Passel, S. Food Miles to Assess Sustainability: A Revision. Sustain. Dev. 2013, 21, 1–17. [Google Scholar] [CrossRef]
- Mundler, P.; Rumpus, L. The Energy Efficiency of Local Food Systems: A Comparison between Different Modes of Distribution. Food Policy 2012, 37, 609–615. [Google Scholar] [CrossRef]
- Sirieix, L.; Grolleau, G.; Schaer, B. Do consumers care about food miles? An empirical analysis in France. Int. J. Consum. Stud. 2008, 32, 508–515. Available online: https://onlinelibrary.wiley.com/doi/10.1111/j.1470-6431.2008.00711.x (accessed on 12 March 2024). [CrossRef]
- Kemp, K.; Insch, A.; Holdsworth, D.K.; Knight, J.G. Food Miles: Do UK Consumers Actually Care? Food Policy 2010, 35, 504–513. [Google Scholar] [CrossRef]
- Caputo, V.; Vassilopoulos, A.; Nayga, R.M., Jr.; Canavari, M. Welfare Effects of Food Miles Labels. J. Consum. Aff. 2013, 47, 311–327. [Google Scholar] [CrossRef]
- Lim, K.H.; Hu, W. How Local Is Local? A Reflection on Canadian Local Food Labeling Policy from Consumer Preference. Can. J. Agric. Econ. Rev. Can. D’Agroecon. 2016, 64, 71–88. Available online: https://onlinelibrary.wiley.com/doi/10.1111/cjag.12062 (accessed on 12 March 2024). [CrossRef]
- Grebitus, C.; Lusk, J.L.; Nayga, R.M. Effect of Distance of Transportation on Willingness to Pay for Food. Ecol. Econ. 2013, 88, 67–75. [Google Scholar] [CrossRef]
- de Magistris, T.; Gracia, A. Do Consumers Care about Organic and Distance Labels? An Empirical Analysis in Spain. Int. J. Consum. Stud. 2014, 38, 660–669. [Google Scholar] [CrossRef]
- Meyerding, S.G.H.; Trajer, N.; Lehberger, M. What Is Local Food? The Case of Consumer Preferences for Local Food Labeling of Tomatoes in Germany. J. Clean. Prod. 2019, 207, 30–43. [Google Scholar] [CrossRef]
- Bazzani, C.; Canavari, M. Is Local a Matter of Food Miles or Food Traditions? Ital. J. Food Sci. 2017, 29, 505–517. [Google Scholar] [CrossRef]
- Govindasamy, R.; Pudurib, V.; Kelleyc, K.M.; Simond, J.E. Increased Purchases of Locally Grown Ethnic Greens and Herbs Due to Concerns about Food Miles. J. Food Distrib. Res. 2012, 43, 61–73. [Google Scholar] [CrossRef]
- Akaichi, F.; Nayga, R.M.; Nalley, L.L. Are There Trade-Offs in Valuation with Respect to Greenhouse Gas Emissions, Origin and Food Miles Attributes? Eur. Rev. Agric. Econ. 2017, 44, 3–31. [Google Scholar] [CrossRef]
- Lopez, R.A.; Khanal, B. Got Local? Demand for Milk with Food Miles. In Proceedings of the 2020 Agricultural and Applied Economics Association Annual Meeting, Kansas City, MO, USA, 26–28 July 2020. [Google Scholar]
- Breidert, C.; Hahsler, M.; Reutterer, T. A Review of Methods for Measuring Willingness-to-Pay. Innov. Mark. 2006, 2, 8–32. [Google Scholar]
- Evans, J.R.; D’Souza, G.E.; Collins, A.; Brown, C.; Sperow, M. Determining Consumer Perceptions of and Willingness to Pay or Appalachian Grass-Fed Beef: An Experimental Economics Approach. Agric. Resour. Econ. Rev. 2011, 40, 233–250. [Google Scholar] [CrossRef]
- Hellyer, N.E.; Fraser, I.; Haddock-Fraser, J. Food Choice, Health Information and Functional Ingredients: An Experimental Auction Employing Bread. Food Policy 2012, 37, 232–245. [Google Scholar] [CrossRef]
- de Magistris, T.; Del Giudice, T.; Verneau, F. The Effect of Information on Willingness to Pay for Canned Tuna Fish with Different Corporate Social Responsibility (CSR) Certification: A Pilot Study. J. Consum. Aff. 2015, 49, 457–471. [Google Scholar] [CrossRef]
- Katare, B.; Yue, C.; Hurley, T. Consumer Willingness to Pay for Nano-Packaged Food Products: Evidence from Experimental Auctions and Visual Processing Data. In Food Markets: Consumer Perceptions, Government Regulations and Health Impacts; Nova Science Publishers, Inc.: Hauppauge, NY, USA, 2016. [Google Scholar]
- Verneau, F.; La Barbera, F.; Del Giudice, T. The Role of Implicit Associations in the Hypothetical Bias. J. Consum. Aff. 2017, 51, 312–328. [Google Scholar] [CrossRef]
- Lerro, M.; Caracciolo, F.; Vecchio, R.; Cembalo, L. Consumer’s Side of Corporate Social Responsibility: A Nonhypothetical Study. J. Consum. Aff. 2018, 52, 689–710. Available online: https://onlinelibrary.wiley.com/doi/10.1111/joca.12182 (accessed on 12 March 2024). [CrossRef]
- List, J.A.; Gallet, C.A. What Experimental Protocol Influence Disparities Between Actual and Hypothetical Stated Values? Environ. Resour. Econ. 2001, 20, 241–254. [Google Scholar] [CrossRef]
- Canavari, M.; Drichoutis, A.C.; Lusk, J.L.; Nayga, R.M., Jr. How to Run an Experimental Auction: A Review of Recent Advances. Eur. Rev. Agric. Econ. 2019, 46, 862–922. [Google Scholar] [CrossRef]
- Vickrey, W. Counterspeculation, Auctions, and Competitive Sealed Tenders. J. Financ. 1961, 16, 8–37. [Google Scholar] [CrossRef]
- Lusk, J.L.; Shogren, J.F. Experimental Auctions: Methods and Applications in Economic and Marketing Research; Quantitative Methods for Applied Economics and Business Research; Cambridge University Press: Cambridge, UK, 2007. [Google Scholar] [CrossRef]
- Harrison, G.W.; List, J.A. Field Experiments. J. Econ. Lit. 2004, 42, 1009–1055. [Google Scholar] [CrossRef]
- List, J.A. Why Economists Should Conduct Field Experiments and 14 Tips for Pulling One Off. J. Econ. Perspect. 2011, 25, 3–16. [Google Scholar] [CrossRef]
- Costanigro, M.; Kroll, S.; Thilmany, D.; Bunning, M. Is It Love for Local/Organic or Hate for Conventional? Asymmetric Effects of Information and Taste on Label Preferences in an Experimental Auction. Food Qual. Prefer. 2014, 31, 94–105. [Google Scholar] [CrossRef]
- Vecchio, R.; Van Loo, E.J.; Annunziata, A. Consumers’ Willingness to Pay for Conventional, Organic and Functional Yogurt: Evidence from Experimental Auctions. Int. J. Consum. Stud. 2016, 40, 368–378. [Google Scholar] [CrossRef]
- Su, L.; Adam, B.D.; Lusk, J.L.; Arthur, F. Anchoring, Information, and Fragility of Choice Experiments: An Application to Consumer Willingness to Pay for Rice with Improved Storage Management. J. Agric. Resour. Econ. 2017, 42, 255–274. [Google Scholar] [CrossRef]
- Drichoutis, A.C.; Lazaridis, P.; Nayga, R.M. The Role of Reference Prices in Experimental Auctions. Econ. Lett. 2008, 99, 446–448. [Google Scholar] [CrossRef]
- Bernard, J.C.; He, N. Confounded by the Field: Bidding in Food Auctions When Field Prices Are Increasing. Agric. Resour. Econ. Rev. 2010, 39, 275–287. [Google Scholar] [CrossRef]
- Shogren, J.F.; Margolis, M.; Koo, C.; List, J.A. A Random nth-Price Auction. J. Econ. Behav. Organ. 2001, 46, 409–421. [Google Scholar] [CrossRef]
- Bernard, J.C.; Bernard, D.J. What Is It About Organic Milk? An Experimental Analysis. Am. J. Agric. Econ. 2009, 91, 826–836. [Google Scholar] [CrossRef]
- Bernard, J.C.; Bernard, D.J. Comparing Parts with the Whole: Willingness to Pay for Pesticide-Free, Non-GM, and Organic Potatoes and Sweet Corn. J. Agric. Resour. Econ. 2010, 35, 457–475. [Google Scholar] [CrossRef]
- Bernard, J.C.; Hustvedt, G.; Carroll, K.A. What Is a Label Worth? Defining the Alternatives to Organic for US Wool Producers. J. Fash. Mark. Manag. Int. J. 2013, 17, 266–279. [Google Scholar] [CrossRef]
- Waldman, K.B.; Kerr, J.M. Is Food and Drug Administration Policy Governing Artisan Cheese Consistent with Consumers’ Preferences? Food Policy 2015, 55, 71–80. [Google Scholar] [CrossRef]
- Teuber, R.; Dolgopolova, I.; Nordström, J. Some like it organic, some like it purple and some like it ancient: Consumer preferences and WTP for value-added attributes in whole grain bread. Food Qual. Prefer. 2016, 52, 244–254. [Google Scholar] [CrossRef]
- Lowry, P.B.; Vance, A.; Moody, G.; Beckman, B.; Read, A. Explaining and Predicting the Impact of Branding Alliances and Web Site Quality on Initial Consumer Trust of E-Commerce Web Sites. J. Manag. Inf. Syst. 2008, 24, 199–224. [Google Scholar] [CrossRef]
Disclaimer/Publisher’s Note: The statements, opinions and data contained in all publications are solely those of the individual author(s) and contributor(s) and not of MDPI and/or the editor(s). MDPI and/or the editor(s) disclaim responsibility for any injury to people or property resulting from any ideas, methods, instructions or products referred to in the content. |
© 2024 by the authors. Licensee MDPI, Basel, Switzerland. This article is an open access article distributed under the terms and conditions of the Creative Commons Attribution (CC BY) license (https://creativecommons.org/licenses/by/4.0/).