Article

Resilient Urban Flood Management: A Multi-Objective Assessment of Mitigation Strategies

1
Institute of Urban Water Management and Landscape Water Engineering, Graz University of Technology, 8010 Graz, Austria
2
University of Innsbruck, Department of Infrastructure, Unit of Environmental Engineering, Technikerstrasse 13, 6020 Innsbruck, Austria
*
Author to whom correspondence should be addressed.
Sustainability 2024, 16(10), 4123; https://doi.org/10.3390/su16104123
Submission received: 26 March 2024 / Revised: 27 April 2024 / Accepted: 9 May 2024 / Published: 14 May 2024
(This article belongs to the Special Issue Flood Resilience in Urban and Rural Communities)

Abstract

:
This study employs a comprehensive multi-objective efficiency index (EI) to assess urban flood mitigation strategies. The EI enables the simple interpretation of a mitigation strategy’s efficiency with a value range between −1 (low efficiency) and 1 (high efficiency), which represents a practical communication tool for decision makers, engineers, and researchers. This was tested at the study site of Feldbach (Austria) with an integrated 1D–2D urban flood model and a distributed hydrological model. A total of 112 scenarios were analysed for six mitigation strategies, which were built from three future challenge scenarios, two observed heavy storm events, and two hydrological pre-conditions. For the given study site, the analysis identifies mitigation strategies implemented in rural boundary areas as the most effective. A novel aspect of this study is the consideration of the urban water balance change, highlighting its impact on the EI. The analysis highlights the importance of analysing each relevant process separately to determine the EI in order to understand why a mitigation strategy is more or less efficient.

1. Introduction

1.1. Future Challenges of Urban Flooding

The increase in heavy precipitation due to rising air temperatures caused by anthropogenic climate change is no longer an open question but a fact, especially on a large scale [1,2,3,4]. This can be explained by the correlation between the atmosphere’s temperature and its water-holding capacity, which is described by the Clausius Claperon equation [5,6]. At the regional scale, this is also expected to increase the number of convective events [7,8], which can result in more pluvial flooding events [1,2,9]. Furthermore, increasing urbanisation [10] induces an increasing impervious rate, which results in a higher surface runoff rate [11,12]. New findings show that urban structures themselves influence hydrological processes, such as urban heat island effects that are responsible for the occurrence of convective precipitation [13,14]. In summary, the key drivers in the context of urban flooding represent increasing urbanisation in combination with the effects of anthropogenic climate change [15]. For this reason, the urban drainage system, as one essential infrastructure in urban areas, must be modified [16].

1.2. The Term Urban Flooding

Urban flooding is a highly complex term involving several physical processes. To understand how urban flooding can be modelled, clarity regarding this term and the processes that influence it is needed. The failure or overload of an urban drainage system is often responsible for flooding in urban catchment areas [17]. For this reason, the runoff behaviour in the sewer has a significant influence on surface runoff [18].
Today, the system is managed from an integrated perspective that includes sustainable concepts [19,20]. Many cities have adopted one of these approaches to urban drainage. There are many definitions of these strategies around the world (presented by Fletcher et al. [19]), but they all have similar goals of reducing runoff at the point of origin by using near-natural solutions to enhance hydrological processes such as evapotranspiration or infiltration. The implementation of such nature-based solutions (NBSs) [21] can support stormwater management systems [22]. Therefore, urban flooding is not only directly influenced by sewerage systems, but it must also include processes of NBS infrastructure elements such as infiltration ponds, green roofs, or tree pits.
Additionally, flooding in an urban catchment can be dominated by runoff processes in a rural boundary catchment [23,24], especially if one or more streams are located in the urban catchments. Such rural boundary catchments are commonly large in contrast to urban catchments, and the runoff input from a rural boundary catchment can also be high. Hence, runoff generation in a rural boundary catchment must be considered.
In summary, the term urban flooding represents a highly integrated process which must include several sub-processes like runoff in the sewer system and on the urban surface, the elements of sustainable drainage systems (e.g., green roof), and hydrological runoff generation from boundary catchments outside the urban catchments, which may include a stream system. Therefore, urban flooding is often induced by a combination of fluvial (stream-based runoff) and pluvial (surface-based runoff) flooding events.

1.3. Mitigation Strategies regarding Urban Flooding

Numerous infrastructure constructions are commonly implemented in urban catchments to reduce urban flooding [25]. This ranges from traditional strategies like central retention or detention basins, which are commonly constructed between the rural and the urban catchment [26], to novel nature-based solutions (NBSs), which can be implemented in rural [27] or urban catchments [28].
In the flooding context, detention basins or retention basins represent an effective measure to reduce the impact of stormwater in urban catchments by storing the runoff volume coming from a rural boundary area and dampening the hydrograph [29,30,31]. This represents one of the commonly used ways to deal with extreme storm events [32]. The adaptation of the sewer system (e.g., implementation of storage tunnels) itself represents another technique in urban areas either to increase the runoff capacity or to avoid or reduce the inflow of stormwater into the system [33].
The field of urban drainage supports the integration of NBS infrastructure elements, such as green roofs and infiltration ponds, into existing conventional systems to reduce the impact of urban flooding and increase urban resilience [28,34]. A combination of several techniques is very effective in reducing peak and total runoff [34,35,36]. One combinatory technique to deal with urban flooding is the multifunctional retention basin in combination with a planned waterway. This is an attractive option when the sewer system reaches its capacity limits [20,37]. Furthermore, this combination offers a potential solution for managing the residual risk associated with the failure of the conventional sewer system.
An alternative way to achieve the same objective is to implement NBSs in rural areas to increase the retention and detention volumes and delay runoff locally [38]. Such techniques use soil management measures to store more water in the soil zone and increase surface roughness. This can be extended with foresting techniques to increase the interception storage and the evapotranspiration rate [39].
However, it is not a question of one or the other, but more about which is the best combination of centralised grey and decentralised green measures [40].
Past studies mainly focused on the evaluation of the flooding area [27,30,41], the resilience of stormwater systems [42,43,44], or urban flood resilience [45]. However, in the context of urban flooding, a single objective assessment is not suitable for evaluating the highly integrated process due to the dependencies of numerous physical processes [46,47]. Because urban flooding is influenced by a variety of processes, the impact of a mitigation strategy on these processes (runoff in the urban drainage systems, streams, and on the surface) must be included in the assessment.
All of these points suggest using a multi-criteria decision making (MCDM) approach to identify the best strategy. Generally, MCDM approaches are divided into the following three main parts [48]: (i) the identification of criteria; (ii) the determination of weighting factors; and (iii) ranking based on an appropriate MCDM approach. Such approaches have already been applied in terms of urban flood resilience [49,50], but a holistic view of urban flooding, especially considering long-term effects and climate–economic aspects, should be considered in an integrated manner in the future [51].

1.4. Study Objective

The presented common knowledge about urban flood mitigation does not demonstrate a clear picture regarding the most efficient strategy against future challenges. The individual consideration of flooded areas (e.g., [24,45,52]) is not able to assess the integrated process of urban flooding holistically, as some crucial processes (e.g., runoff in the sewer system or changes in the urban water balance) are not taken into account. Therefore, a multi-objective assessment approach with more than one criterion is required [46]. The main goal of this study is to develop a multi-objective index to assess the efficiency of a strategy (Figure 1). Creating a simple interpretation and formulation of the index is the aim, especially concerning communication between non-experts and experts, to support the decision-making process. The developed index will be demonstrated via application to six mitigation strategies for an urban drainage system in a small peri-urban catchment in Austria.

2. Materials and Methods

2.1. Study Site: Feldbach

The study site is the small city of Feldbach in southeast Styria in Austria (Figure 2), with a total number of inhabitants of 13,421 (date: 1 January 2023 [53]). The modelled catchment area of 634 hectares is the result of hydrological catchment delineation. The catchment is subdivided into one urban area (102 hectares) and two rural boundary areas (Aderbach with 35 hectares and Oederbach with 497 hectares). The focus of the study is the urban catchment. The catchment includes two small creeks (Aderbach and Oederbach) and the Raab river representing the northern boundary. The topography of the catchment can be described as flat in the centre zone and hilly with a high surface slope in two rural boundary areas. The hilly character generates very fast and high runoff rates in the case of a heavy storm event, which leads to an increased flooding potential in the underlying urban area. Additionally, the damage potential is increased by the high erosion potential due to the agricultural land in the boundary areas.

2.2. Assessment of Mitigation Strategies

Urban flooding is influenced by various processes, including runoff in the sewer system, surface runoff in urban areas, runoff from the surrounding rural boundary areas, and hydrological processes related to sustainable urban drainage systems. Consequently, an effective assessment of mitigation strategies requires the consideration of each of these processes.
The extent of the flooded area serves as an indicator for urban flooding and must be factored into the evaluation of mitigation strategies. This area can be influenced by runoff from rural boundary areas.
Moreover, flooding areas are impacted by the sewer system, which includes various components. Key indicators for designing and assessing a sewer system in the context of heavy storm events include the overflow volume, sewer surcharge volume, and technical resilience of the sewer system.
Often, a wastewater treatment plant is situated at the end of a sewer system, and its performance depends on the inflow from the sewer system, making it an equally relevant metric for assessing mitigation strategies.
Additionally, in alignment with the primary objective of sustainable development outlined in the European Standard CEN EN 752:2017 [54], the sustainability impact must be considered in an integrated assessment. To summarise these different objective values in a single indicator, three main subparts have been identified: (i) surface flooding; (ii) urban drainage system; and (iii) sustainable impacts.
The proposed indicator, referred to as the efficiency index (EI), is designed to assess the effectiveness of a mitigation strategy regarding these subparts. The EI is calculated by determining the relative deviation of each subpart between a given reference scenario and the corresponding scenarios of the mitigation strategy. The scenarios must simulate measured storm events using a 1D–2D urban flooding model to ensure that all relevant processes are considered. In formulating the EI (1), each subpart is normalised (EIi) to enable a combined assessment (2).
E I = 1 n i = 1 n E I i
E I i = n o r m ( R D i , r e f R D i , s c e n ) R D i , r e f
EI = the efficiency index of one specific mitigation strategy; EIi = the normalised efficiency index of the subpart i; RDi,ref = the relative deviation of the reference scenario (e.g., flooding area); RDi,scen = the relative deviation of the mitigation strategies scenario; and n = the number of subparts.

2.2.1. Assessment regarding Surface Flooding

The simulated change in the flooded area caused by an implemented mitigation strategy was used to consider the impact of one mitigation strategy regarding surface flooding (3). The flooded area is defined by all cells with a simulated maximum water level greater than a defined threshold value. The threshold value was chosen to be 0.1 m, which can be justified because numerous used damage functions expect damages from this water depth onwards [12,55,56,57]. This threshold value represents the most sensitive value [58], which mostly depends on the building structure in the catchment (e.g., buildings with basements or without basements) and the corresponding damage function [55]. However, study-site-specific damage functions are not available for this analysis.
R D 1 = A 0.1 , r e f A 0.1 , s c e n A 0.1 , r e f
RD1 = the relative deviation of surface flooding; A0.1,ref = the flooded area with a water depth higher than 0.1 m in the reference scenario; and A 0.1 , s c e n = the flooded area higher than 0.1 m of the mitigation strategy.

2.2.2. An Assessment of the Urban Drainage System

Three objectives to assess flood mitigation regarding the urban drainage system were used in this work: (i) the stored water capacity at the maximum water level in the sewer system and the sewer flooding volume (RD2,1 (5)); (ii) the discharge volume change in combined sewer overflows (CSOs) and the wastewater treatment plant (WWTP) (RD2,2 (6)); and (iii) the technical resilience of the sewer system (RD2,3 (7)).
The first part makes it possible to estimate how much water is leaving the sewer system at the manholes and determine the maximum water volume in the sewer pipes. As both values are volumes, they can be combined into a single relative deviation, RD2.1. Reducing both volumes has a positive effect as more water can be stored in the sewer and less water returns to the surface. As the whole system is evaluated, many high statistical outliers are expected in some system locations. For this reason, the median is used as a robust statistical value to evaluate the stored water capacity and the flood volume from the sewer system.
The second part deals with the volume of water that leaves the sewer system through sewer overflows and flows into the WWTP. One approach to sustainable rainwater management is to store and use the water at the point of origin without damaging it and avoid draining it out from the cities [59]. To achieve this goal on a catchment scale, both volumes should be reduced in the interest of positive efficiency. The mean of the CSO volume and the flow to the WWTP is appropriate as the sewer system often includes more than one CSO and inflows to the WWTP (RD2.2).
The last part considers the technical resilience of the sewer system with the resilience approach demonstrated by Mugume et al. [42]. This quantifies resilience using the severity approach of the loss of system functionality due to a failure [60]. The heavy storm event represents the failure in this study. The severity of a failure is defined as a function between the peak of failure and the failure duration. The presented approach simplifies the real integration of the system performance with the assumption of a rectangular recovery curve with the resilience index, REI. An REI of 1 represents the best value. For this reason, a high REI value represents a positive impact on the sewer system’s resilience.
All three relative deviations between the reference and mitigation scenario will be combined by the mean value (4).
R D 2 = R D 2,1 + R D 2,2 R D 3,1 3
RD2 = the combined relative deviation of the urban drainage system, and RD2.j = the relative deviations used to assess the urban drainage system.
R D 2.1 = 1 2 c ~ max , ref   - c ~ max , scen c ~ max , ref + V ~ max , ref   - V ~ max , scen V ~ max , ref
R D 2.2 = 1 2 V ¯ W W T P , ref   - V ¯ W W T P , scen V ¯ W W T P , ref + V ¯ C S O , ref   - V ¯ C S O , scen V ¯ C S O , ref
R D 2.3 = REI r e f   - REI s c e n REI r e f     w i t h   R E I = 1 V t o t a l V I n f l o w t ¯ f l o o d i n g t s i m
RD2.1 = the relative deviation to assess the impact of the sewer system; c ~ max,ref = the median of the maximum capacity in each sewer conduit of the reference scenario; c ~ max,scen = the median of the maximum capacity in each sewer conduit of the mitigation strategy; V ~ max,ref = the median of the sewer flooding volume in each sewer junction of the reference scenario; V ~ max,scen = the median of the sewer flooding volume in each sewer junction of the mitigation strategy; RD2.2 = the relative deviation to assess the impact of the sewer system on the neighbourhood system (e.g., streams by CSO and WWTP); V ¯ WWTP,ref = the mean discharge volume to the WWTP of the reference scenario; V ¯ WWTP,scen = the mean discharge volume to the WWTP of the mitigation strategy; V ¯ CSO,ref = the mean CSO volume of the reference scenario; V ¯ CSO,scen = the mean CSO volume of the mitigation strategy; RD2.3 = the relative deviation for the technical resilience of the sewer system; REI = the resilience index developed by Mugume et al. [42]; Vtotal = the total sewer flooding volume in the system; VInflow = the inflow volume into the sewer system; t ¯ f l o o d i n g = the mean flooding time in the sewer system; and tsim = the duration of the simulation.

2.2.3. Hydrological Urban Water Balance to Assess the Sustainable Impact

The sustainability of a mitigation strategy can be assessed by considering the hydrological water balance equation [45]. However, not every hydrological process has a significant impact on event-based analyses, such as evapotranspiration. A long-term analysis is required to address this. An integrated urban flood model is not suitable for such hydrological evaluation, as hydrological processes are only applied to the runoff at its source cell. After runoff generation, the runoff enters the hydraulic model, which does not take into account hydrological processes such as infiltration and evapotranspiration. These can only be considered in a fully distributed hydrological model aggregated from the integrated high-resolution urban flood model. Furthermore, any mitigation strategy needs to be integrated into the hydrological model.
The water balance equation used is a modification of the water balance equation in urban catchments, including runoff, evapotranspiration, and storage change in the urban study side area, with the runon component from a possible rural boundary area (9). This adjustment is needed to reflect the impact of mitigation strategies located in rural boundary areas on the urban water cycle. It is also assumed that the change in storage is negligible due to the long-term analysis. Furthermore, the evapotranspiration component combines three hydrological subprocesses: (i) infiltration from the surface in the soil layer; (ii) evapotranspiration from the surface; and (iii) evapotranspiration from the soil layer.
P + R O r u r a l = R O u r b a n + E T u r b a n
P = precipitation; ROrural = runon coming from a boundary rural area; ROurban = the runoff in the urban study site; and ETurban = evapotranspiration in the urban study site.
Subsequently, for each water balance component (9), the relative deviation between the reference scenario and a specific mitigation strategy is calculated and results in the relative deviation of the water balance (RD3) (10), which we want to maximise to improve the urban water balance. The positive relative deviation of both runoff components and a negative relative deviation of the evapotranspiration components resulted in a positive effect. For this reason, evapotranspiration is included in the balance equation with a negative sign, as the aim is to maximise the RD3 value. A positive RD3 value (>0) signifies an increase in sustainability compared to the reference scenario, while a negative RD3 (<0) indicates a decrease. In addition, the reference scenario represents a typical built-up condition in a catchment area and not a natural condition. Otherwise, the positive effect would have to be formulated differently.
        Δ W B m = W B m , r e f W B m , s c e n W B m , r e f
R D 3 = Δ W B R O , u r b a n + Δ W B R O , r u r a l Δ W B E T , u r b a n
RD3 = the relative deviation of the water balance; ΔWBm = the relative deviation of the water balance component m; WBm,ref = the reference value for the water balance component m; WBm,scen = the mitigation scenario value for the water balance component m; ΔWBRO,urban = the relative deviation of the yearly urban runoff component; ΔWBRO,rural = the relative deviation of the yearly rural runoff component; and ΔWBET,urban = the relative deviation of the yearly urban evapotranspiration component.

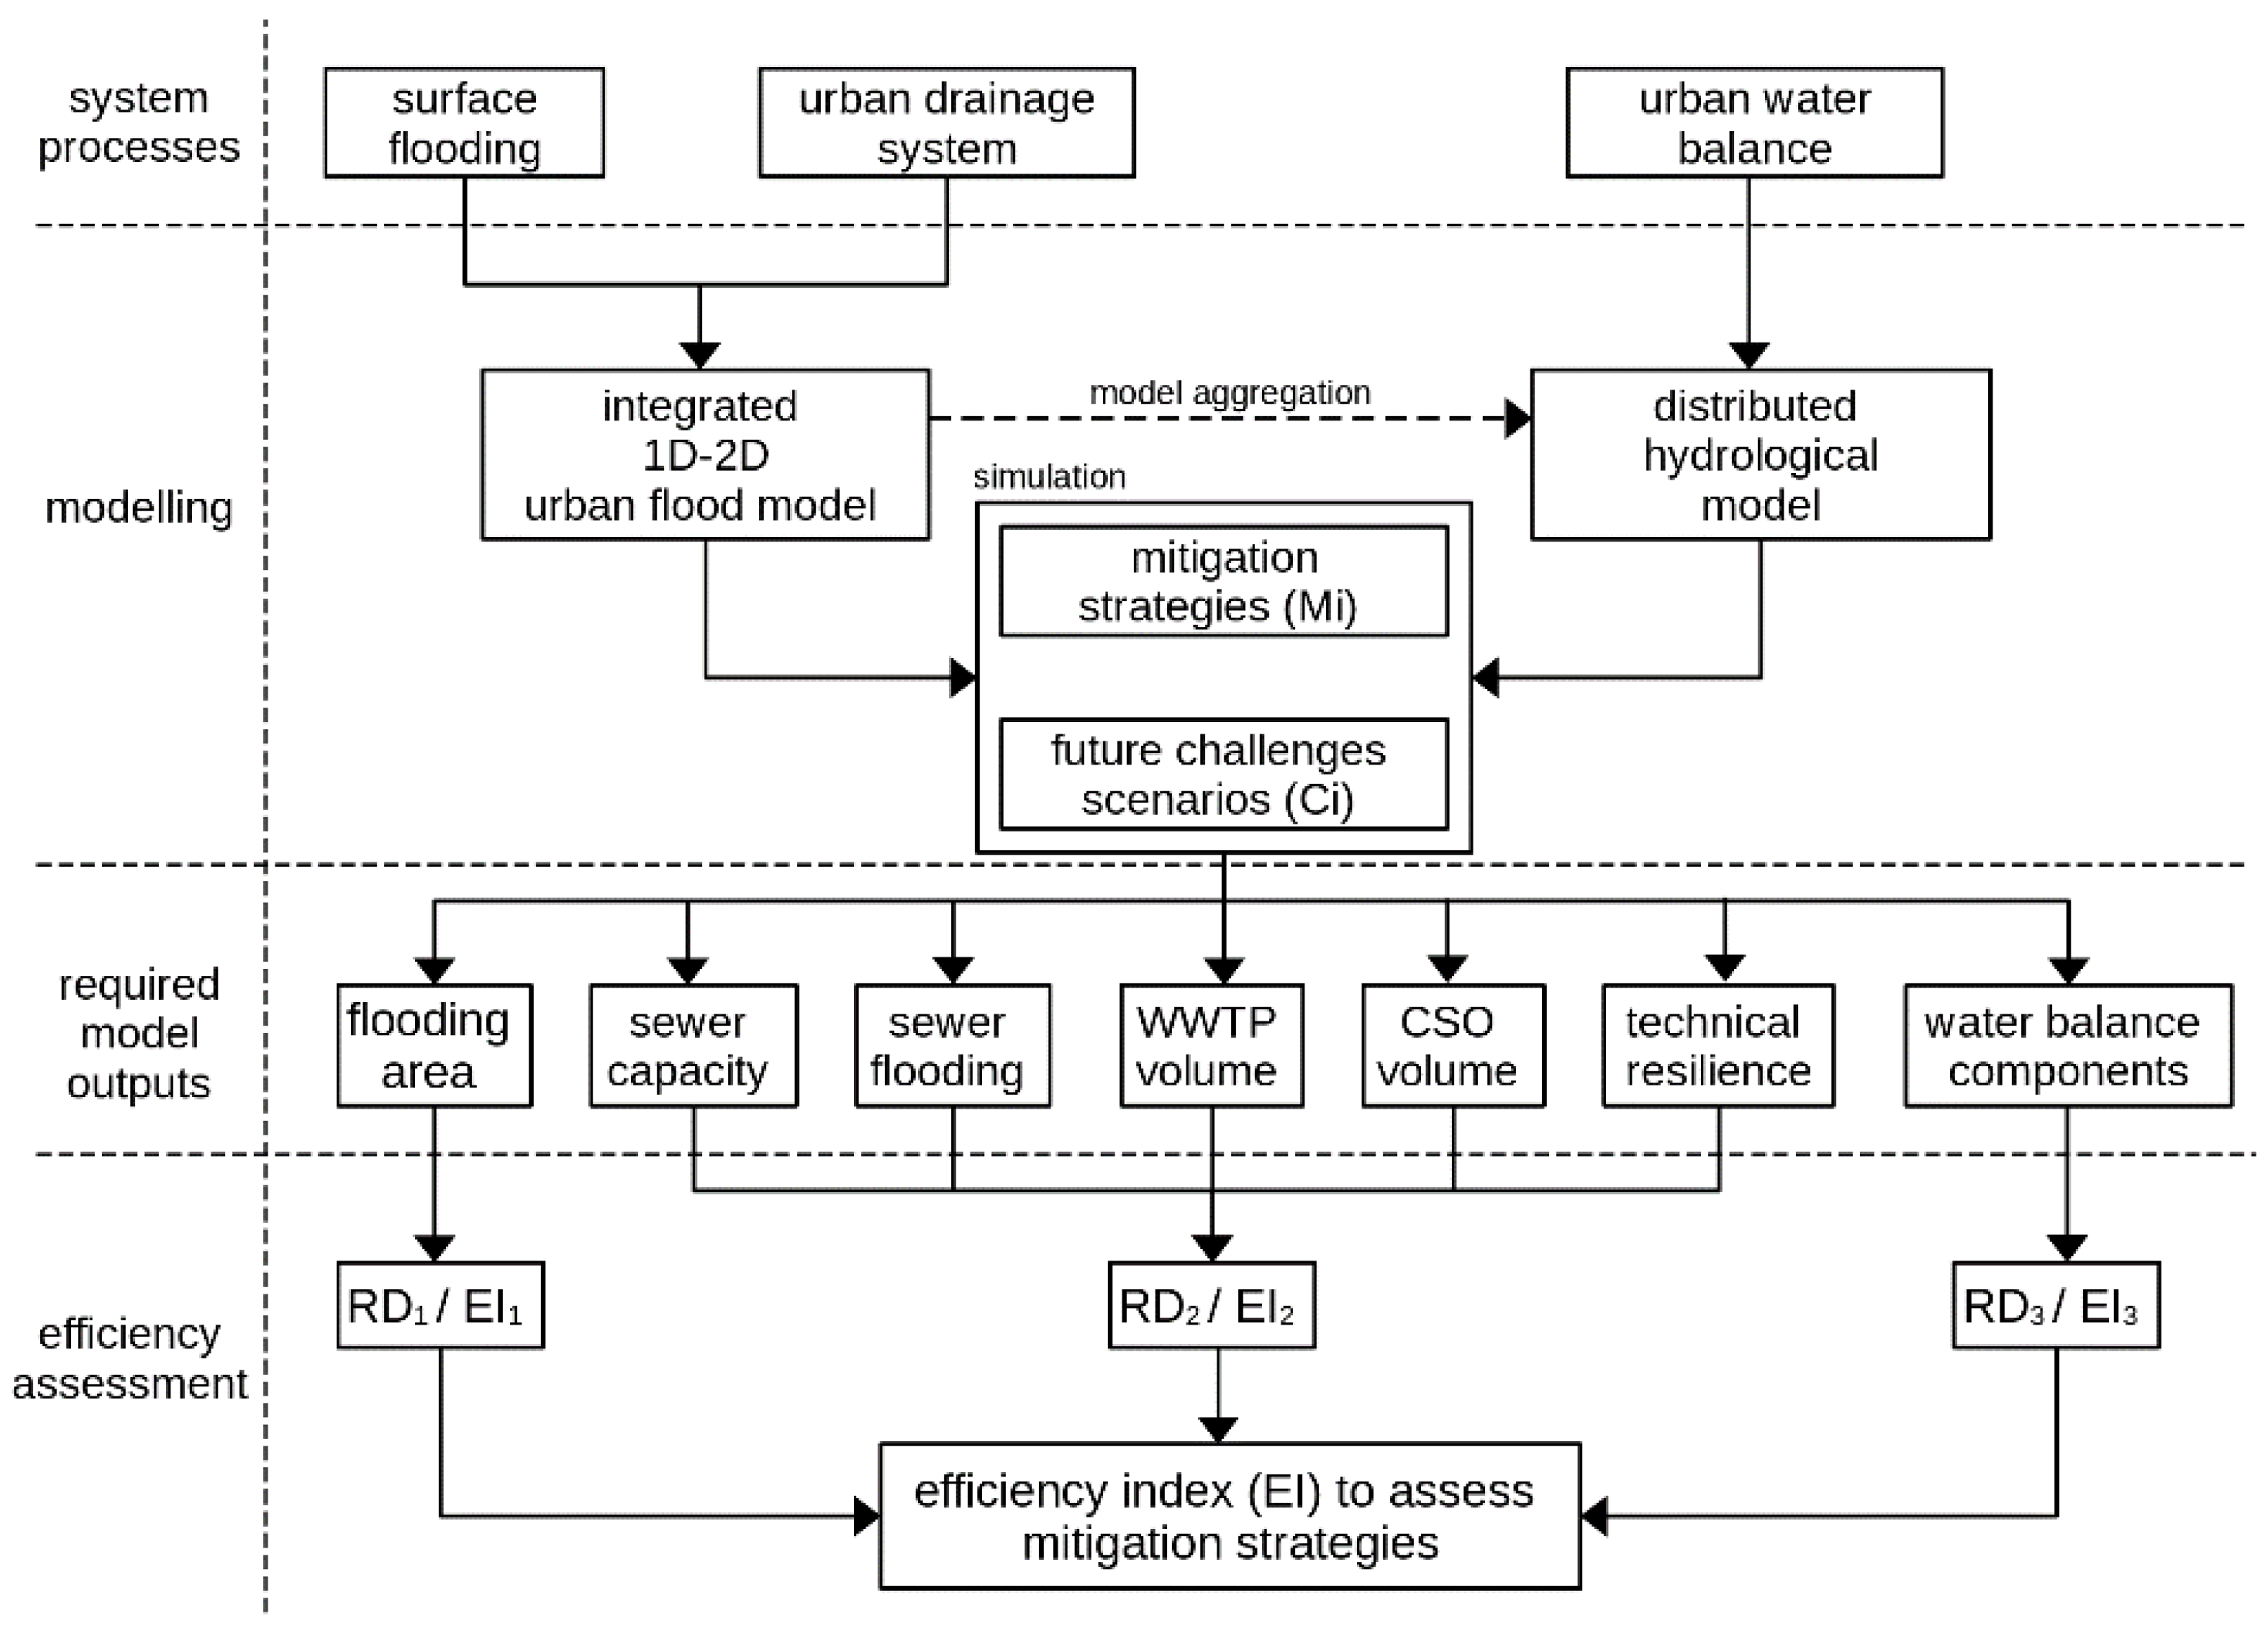
2.2.4. A Combined Assessment of the Three Subparts of the Efficiency Index

Each used efficiency subpart (RD1RD3) for the determination of the total efficiency has a different order of magnitude. Therefore, the normalisation of each sub-value is required to combine all described subparts (EI1EI3). To contain the possible negative impact in some locations, the standard min–max normalisation approach must be modified through a distinction of a negative and positive value range of the reduction sub-values (11). This will result in a possible value range between −1 and 1 for each subpart. Such normalised values can be easily combined with the mean value, which represents the final efficiency index (EI) of the corresponding mitigation strategy.
E I i = R D j , k R D m a x   j , k     for       R D j , k > 0                       with   R D m a x   j , k   = max j = ( 1 : n ) R D j , k   R D j , k R D m i n   j , k     for       R D j , k < 0                       with   R D m i n   j , k   = min j = ( 1 : n ) R D j , k
EIi = the subparts i of the efficiency index EI; R D m a x   j , k   = the maximal value of every simulated mitigation strategy j corresponding to the future challenge scenario k; R D m i n   j , k   = the minimum value of every simulated mitigation strategy j corresponding to the future challenge scenario k, and RDj,k = the relative deviation of one mitigation strategy, j, corresponding to the future challenge scenario k.

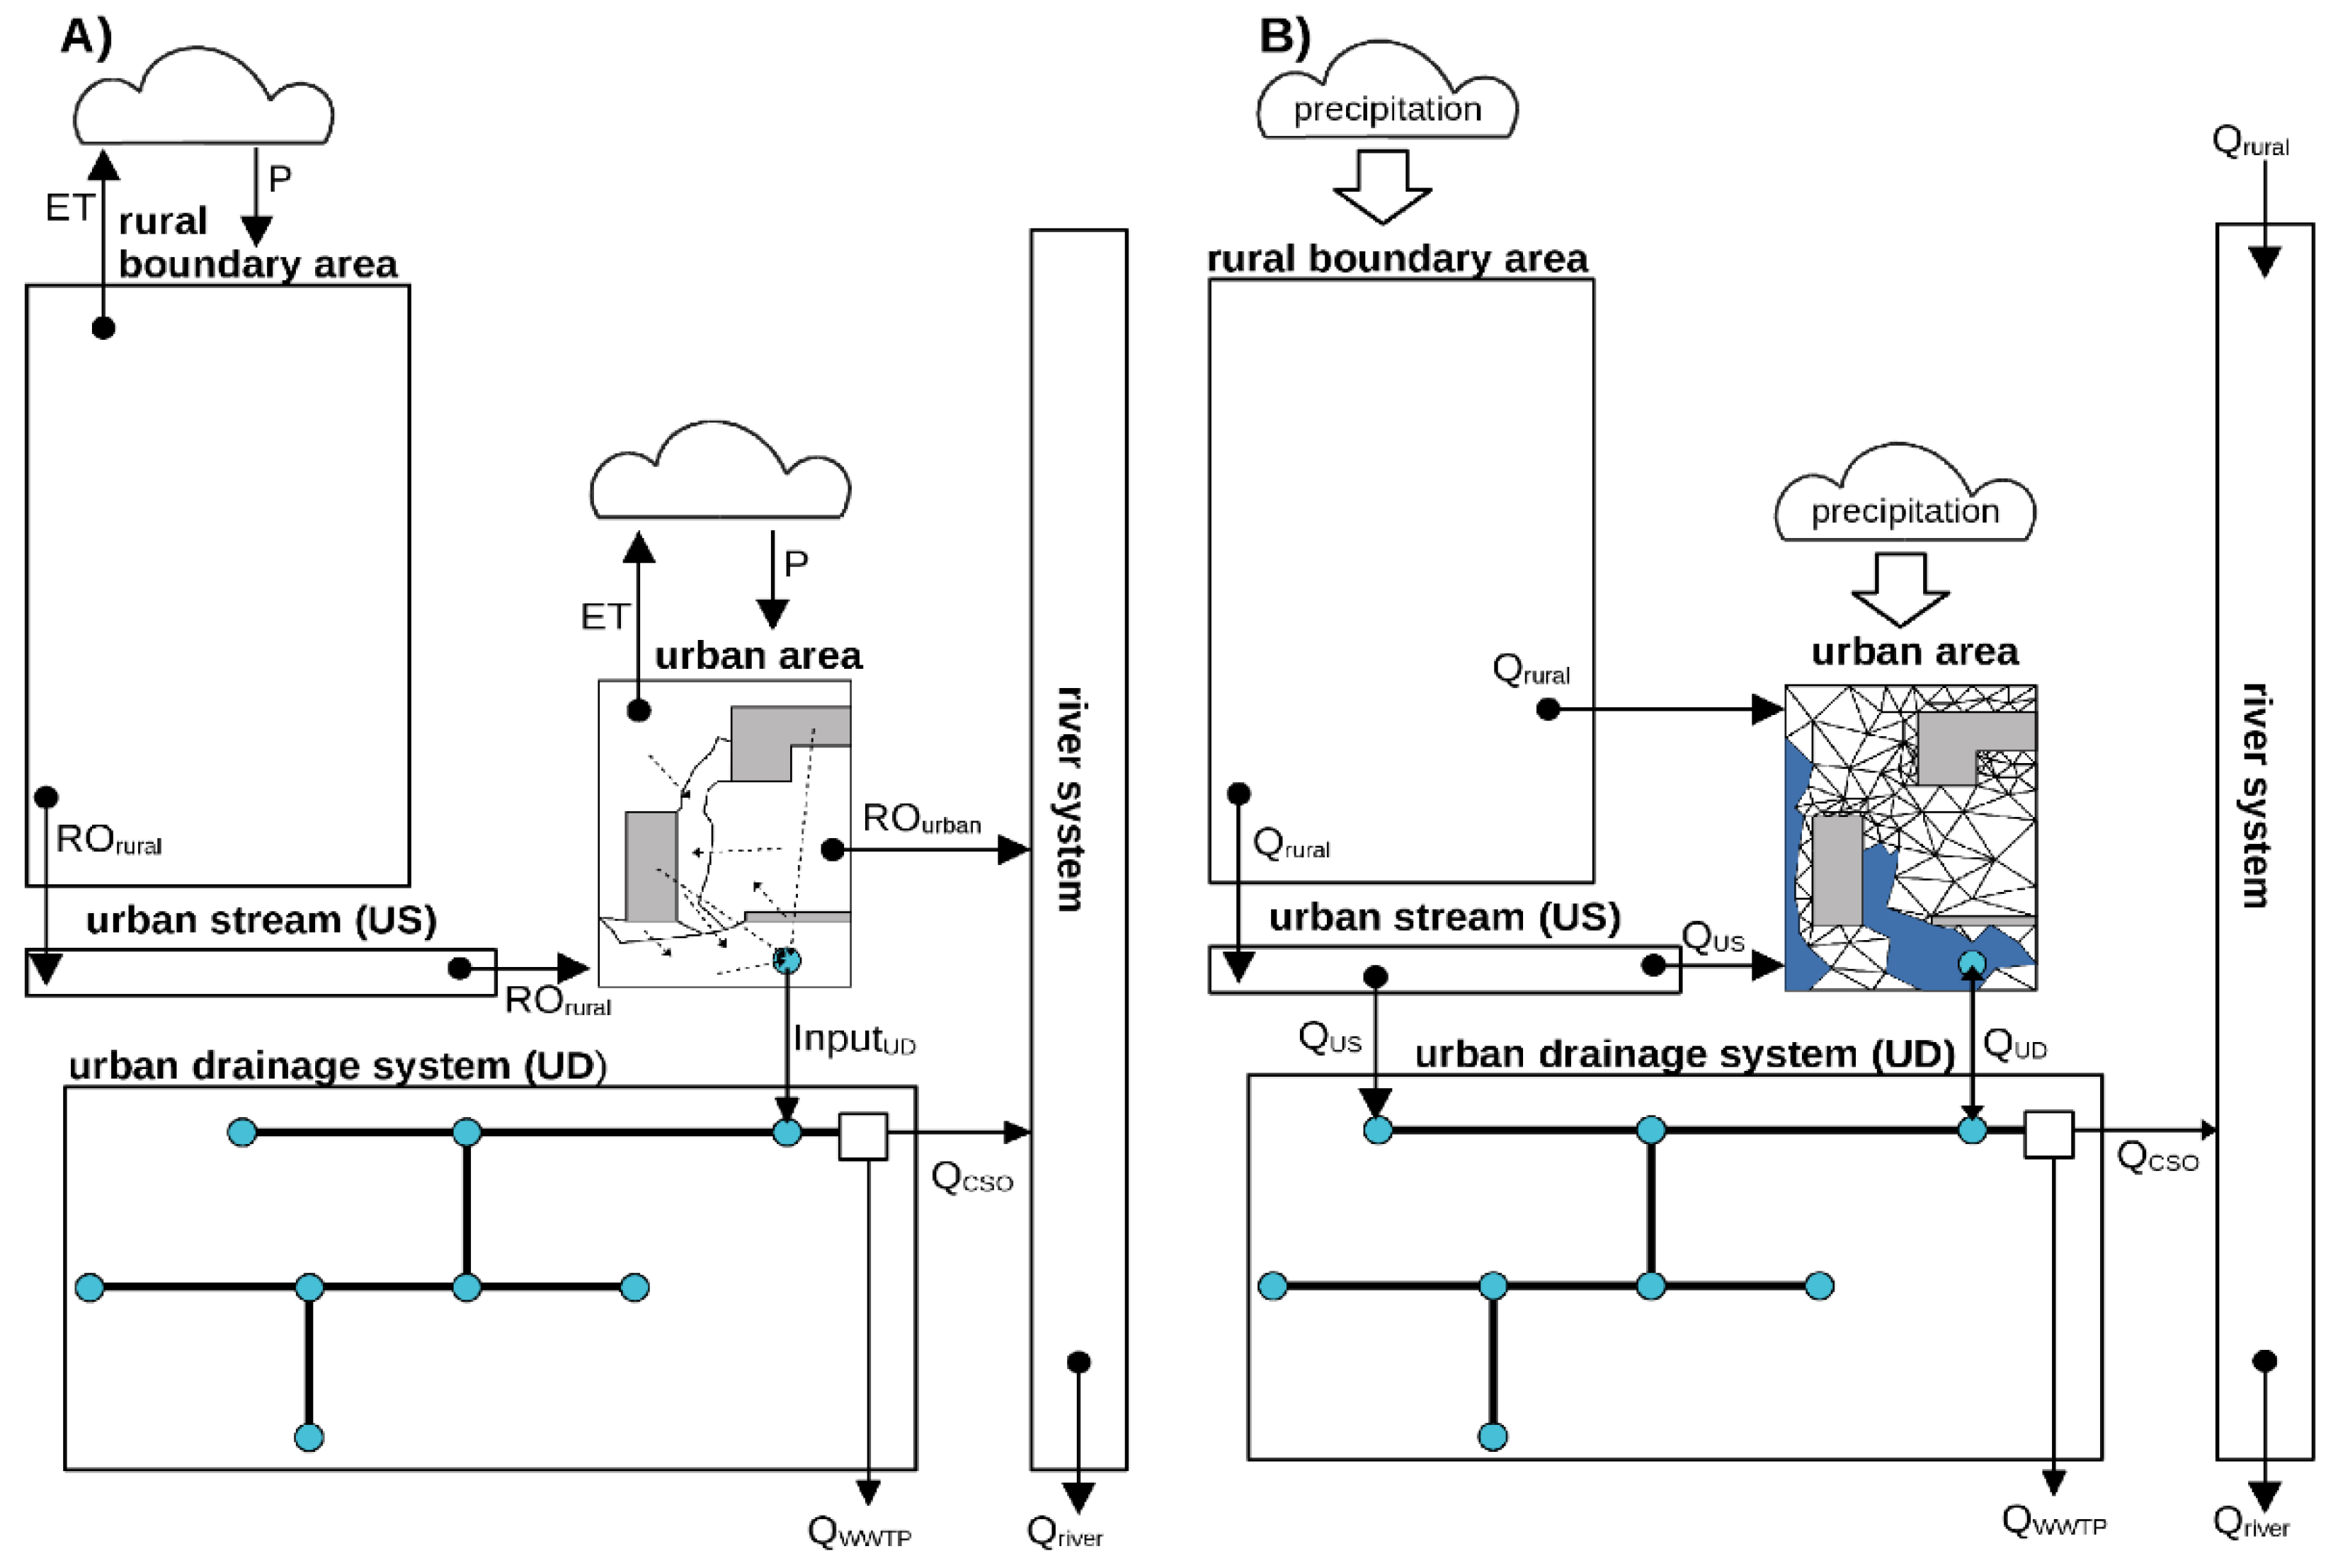
2.3. Model Development

An integrated 1D–2D model was used to quantify the hydraulic processes on the surface and the urban drainage system (Figure 3A). Based on this, a distributed hydrological model was created to quantify long-term changes in the urban water balance under consideration of the impact of the connected rural catchment areas (Figure 3B).

2.3.1. Integrated 1D–2D Urban Flood Model

As the study objective requires a holistic view of the urban drainage system, all essential elements and processes of this system have to be modelled realistically. Schmitt et al. [18] describe three main data requirements to simulate urban flooding: (i) data to consider relevant hydrological processes, such as infiltration, interception, storage losses, and evapotranspiration; (ii) sewer system data (e.g., the location and depth of sewer nodes or the length and cross-section of sewer links); and (iii) data for the surface characteristics (e.g., a digital elevation model (DEM), a digital surface model (DSM) and data regarding obstructions, bridges, and culverts). Such data must be supplemented with data on existing or planned mitigation strategies, such as detention ponds or green or blue infrastructure assets (e.g., green roofs). In particular, data on green infrastructure assets are currently difficult to obtain and can often only be recorded through personal interviews and inspections [61].
The commercial software PCSWMM Professional 2D (version: 7.4.3240) developed by the Computational Hydraulic Institute (CHI) was used to build the integrated 1D–2D urban flood model. This software creates a virtually one-dimensional calculation mesh on the surface based on the spatial discretised unstructured raster cells, which also represent the hydrological response units (HRUs) for the hydrological model. Each raster cell is connected to a virtual node on the surface, and flow transport between two nodes is solved by an open virtual link with geometry depending on the raster cell resolution [62]. The fully 1D Saint-Venant equation is used to estimate the water depth and the resulting velocity vector at each virtual node of the mesh. The whole solving algorithm is based on the EPA Storm Water Management Model Version 5.2. (SWMM), which is also used to estimate the one-dimensional flow transport in the 1D sewer system [63]. For this reason, both models (1D and 2D) can be easily coupled in a bidirectional way by using the bottom orifice element on the nearest sewer manholes as an exchange element between both hydraulic models. The hydrological model determines the runoff time series as input for both models and is coupled in a unidirectional way. The whole description with all relevant equations is presented by Reinstaller et al. [64].

2.3.2. Model Evaluation

Two well-established evaluation approaches were used to evaluate the model [65]: (i) qualitative model evaluation using the Contingency Matrix; (ii) quantitative model evaluation based on measured or field observations.
To take advantage of both methods, a combined approach was used to evaluate the developed urban flood model using a measured heavy storm event on 22 August 2020. To build a contingency matrix, operational protocols were obtained from the fire brigade, and interviews with affected people were conducted. The resulting flooded area was also defined by the sum of raster cells with a simulated water depth greater than 0.1. Based on this, the model accuracy, hit rate, and success index were estimated to evaluate the model qualitatively. This was combined with a quantitative evaluation by comparing the maximum simulated water depth with observed watermarks at three locations in the study area to estimate the peak error. Based on the conclusions of Reinstaller et al. [64], the spatial distributed parameter surface roughness increased and the hydrological losses parameter decreased on the steep hillside peri-urban area in the study site. This resulted in a more realistic model quality quantified by the three observed watermarks.

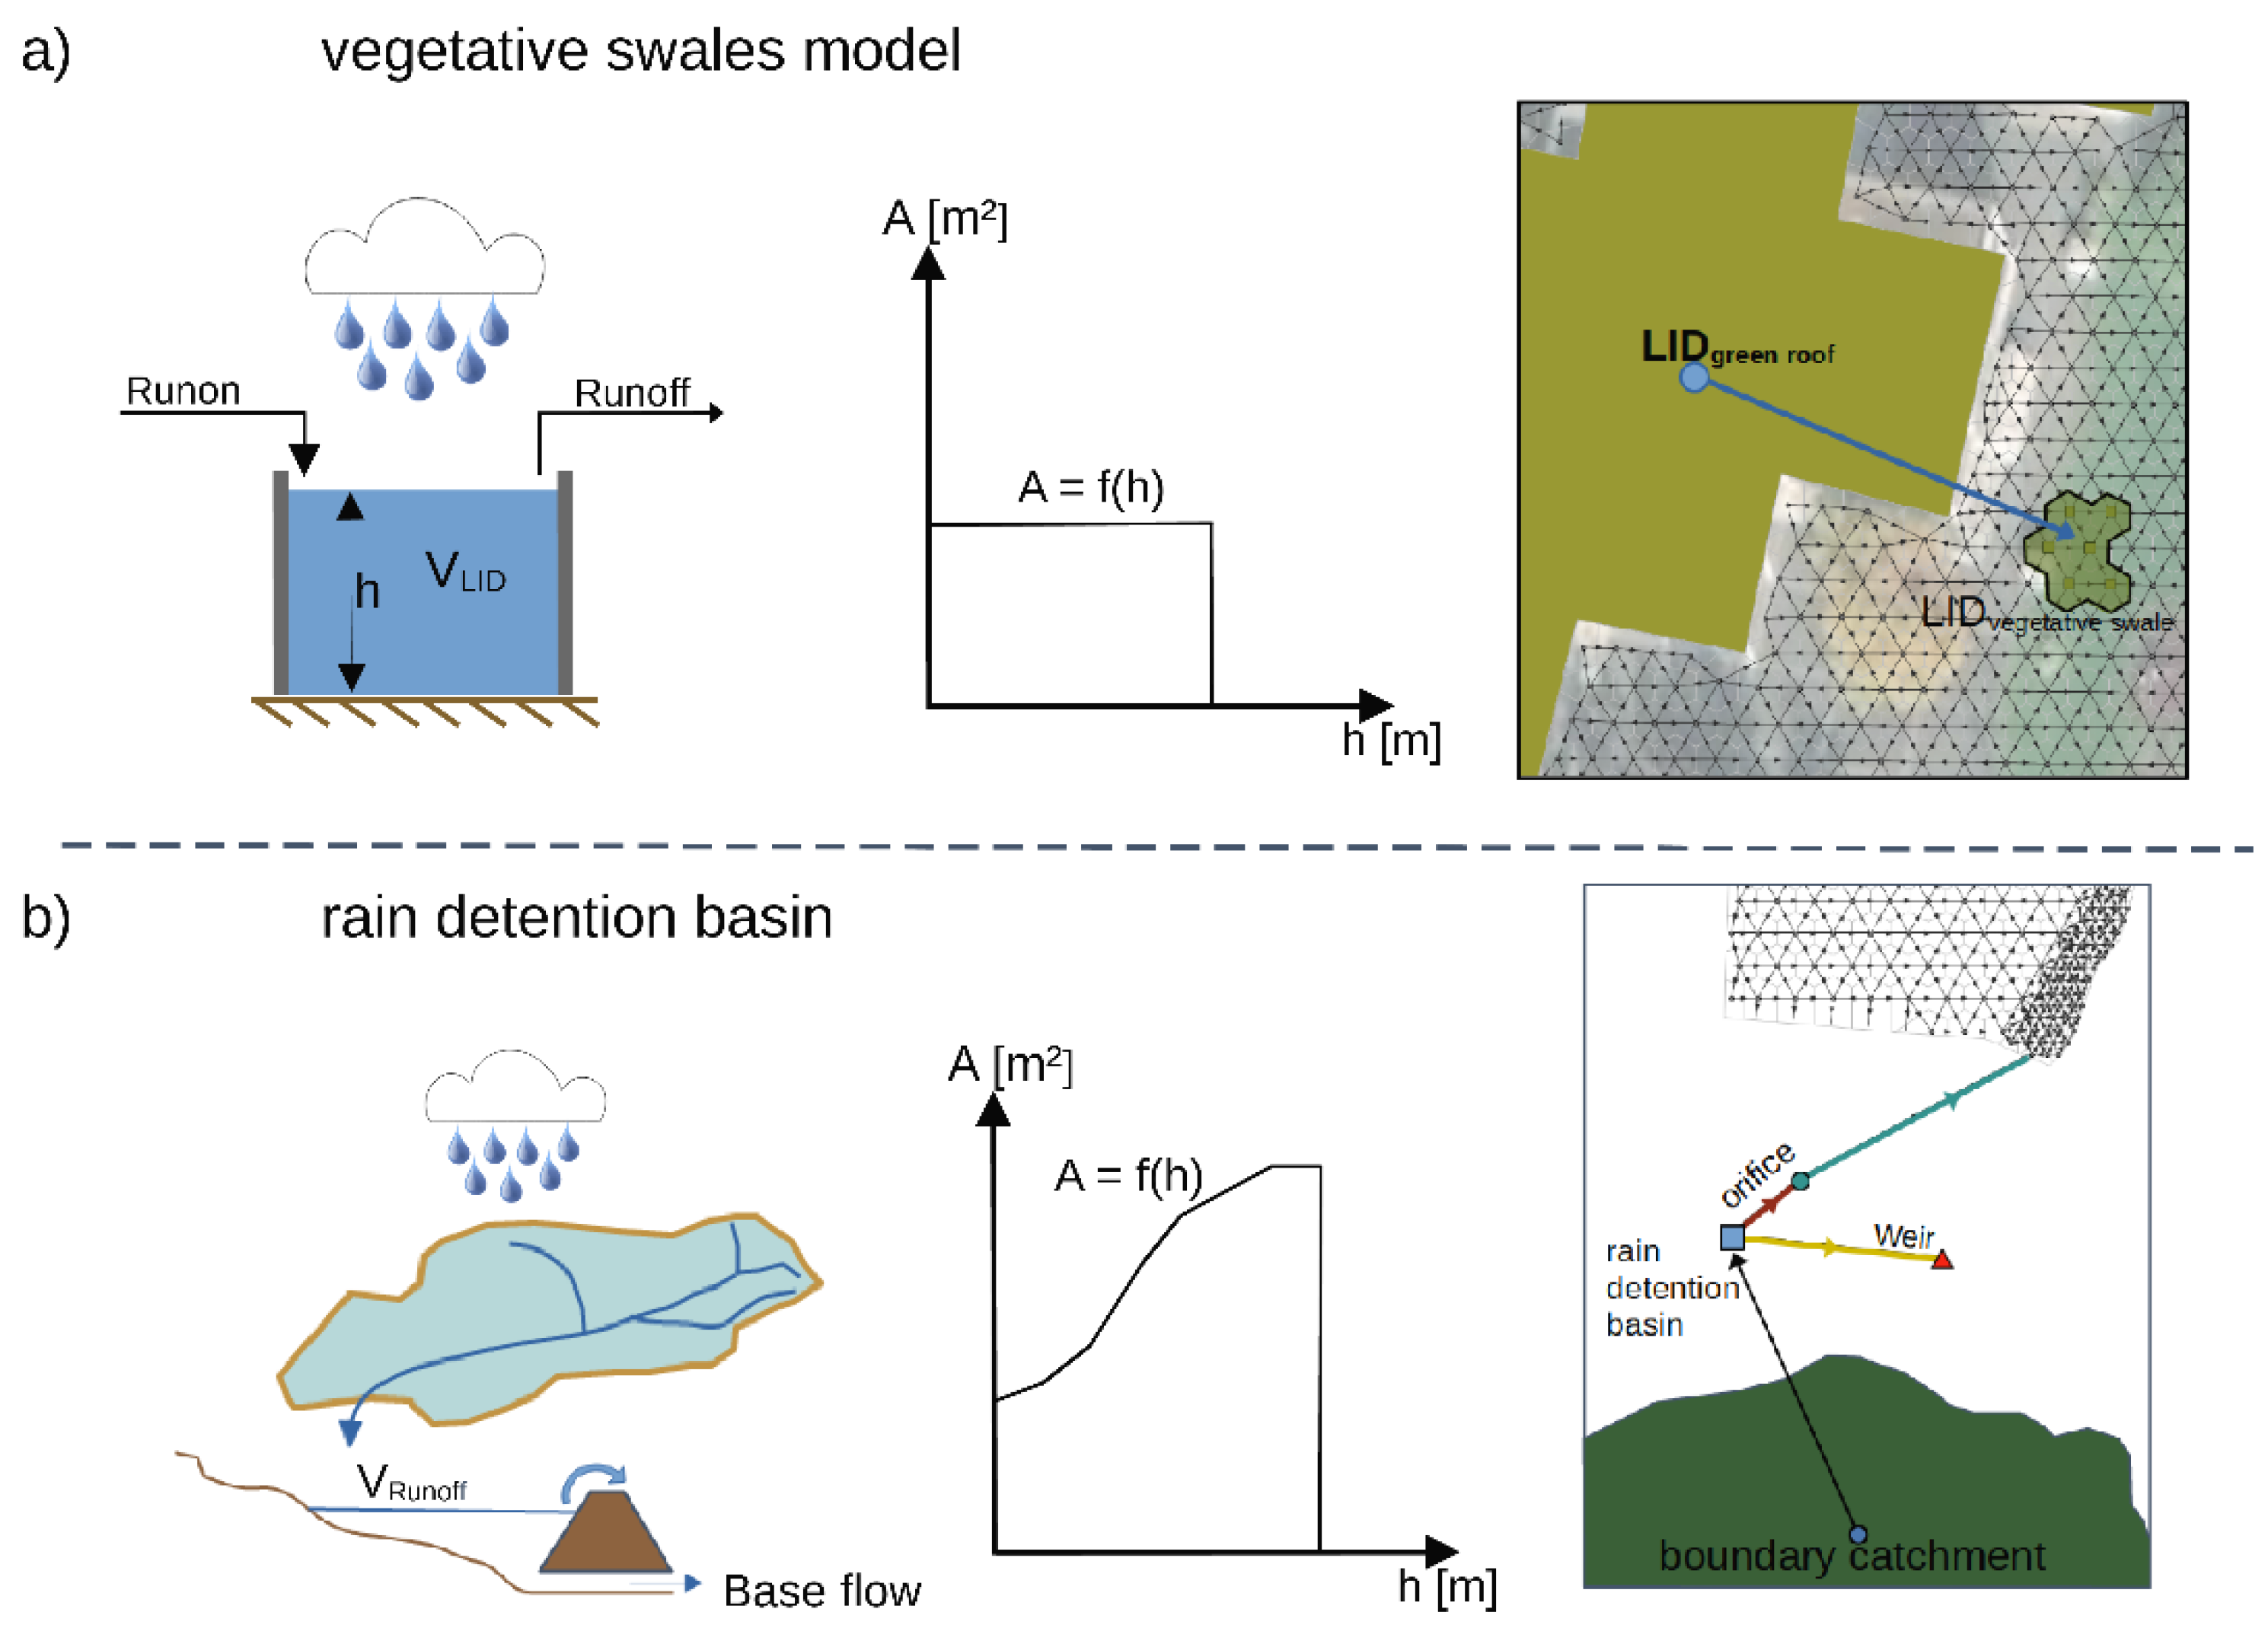
2.4. Mitigation Strategies

2.4.1. Modelling of Mitigation Strategies

The main task of all flood mitigation strategies is to store the runoff volume and reduce the runoff peaks [28]. This can be achieved with centralised strategies and decentralised strategies.
In this study, six commonly used mitigation strategies in practice were implemented in the developed 1D–2D urban flood model (Table 1). Due to a lack of data on design conditions, the status of the mitigation strategies was assumed to be under perfect planning design conditions. For this reason, design standards that are commonly used in Austria were used to plan the mitigation strategies. A variation in the design parameters (e.g., weir high) to consider malfunctions or uncertainties regarding the initial states of the strategies was not taken into account. The base scenario (M0) represents the present as-is state without a mitigation strategy.
The first strategy scenario (M1) involves detention basins that are designed to store a 100-year design storm event, which are located between the rural boundary areas and the urban area. This uses a simplified linear storage node and a bottom outlet solved by the Torricelli equation (Figure 4b). When the reservoir is full, the water can flow back into the stream or leave the model. Both options are solved by the weir equation using a rectangular cross section. From a hydrological perspective, the modelled detention basin can be described as a green measure regarding the hydrological water balance.
The second strategy scenario (M2) combines a multifunctional retention basin with an open surface waterway. The waterways are strategically located at known flood hotspots, identified through a hotspot analysis using a flow path analysis and historical damage data on private and public areas [61]. In the event of a flood, the open waterway drains the water into the multifunctional retention basin (designed to store a 30-year design storm event) without causing damage. The waterways are modelled by manipulating the elevation in the 2D mesh. The multifunctional retention basin is modelled using linear storage nodes. Two combined mitigation strategies are implemented in the study area, located at two flood hotspots near the watercourses.
The combination of green roofs and vegetated swales is analysed as a further mitigation strategy (M3). This represents a decentralised strategy to store rainwater on private land in the study area. The green roof unidirectionally drains the rainwater that is not directly stored to the vegetated swale on the surface (Figure 4a). The low impact development (LID) approach is used to model the green roof [66]. The vegetative swale is also modelled with a linear storage node. The storage curve used is defined by a standard design of vegetated swales, considering runoff corresponding to a design rainfall event with a return period of 5 years. This combination is assumed to apply to private properties with flat roofs where a green roof could potentially be implemented, resulting in a total of 65 buildings in the study site.
The M4 strategy represents a mitigation scenario with grey infrastructure elements (sewers). The aim of such strategy is to increase the sewer volume in the main system by enlarging the conduit cross sections. This has been applied to known problem locations in the main sewer system because a system-wide implementation is unrealistic. As a result, only the cross sections in the 1D sewer model increased along two selected parts of the study area. It was assumed that the European standard for urban drainage systems [54] (return period between T = 10a and T = 50a depending on the locations in the system (city centre, peri-urban area, and rural boundary area)) was complied with in the study site, and the increase in the sewer storage volume led to an improvement in the urban drainage system.
Strategy M5 introduces a technique to protect identified hot spots in the catchment through the use of sandbags or mobile barriers. These barriers divert water to non-vulnerable locations (e.g., streams, car parks, or public green spaces). Similar to the M2 strategy, mobile barriers are implemented in the 1D–2D model of the study site by increasing the surface elevation of the 2D mesh at the mobile barrier locations.
The final scenario, M6, enhances the retention potential in the boundary areas with agricultural soil measures (increasing the infiltration potential) and reforesting specific plant types to boost water storage capacity. These scenarios are hydrologically modelled by increasing depression storage and modifying hydraulic conductivity concerning the soil layer in both boundary catchments. Due to the unavailability of guidelines, no design parameters were taken into account, and experience values were used. This resulted in a better storage effect through the exchange of agricultural land and the targeted afforestation of plants with high interception storage.

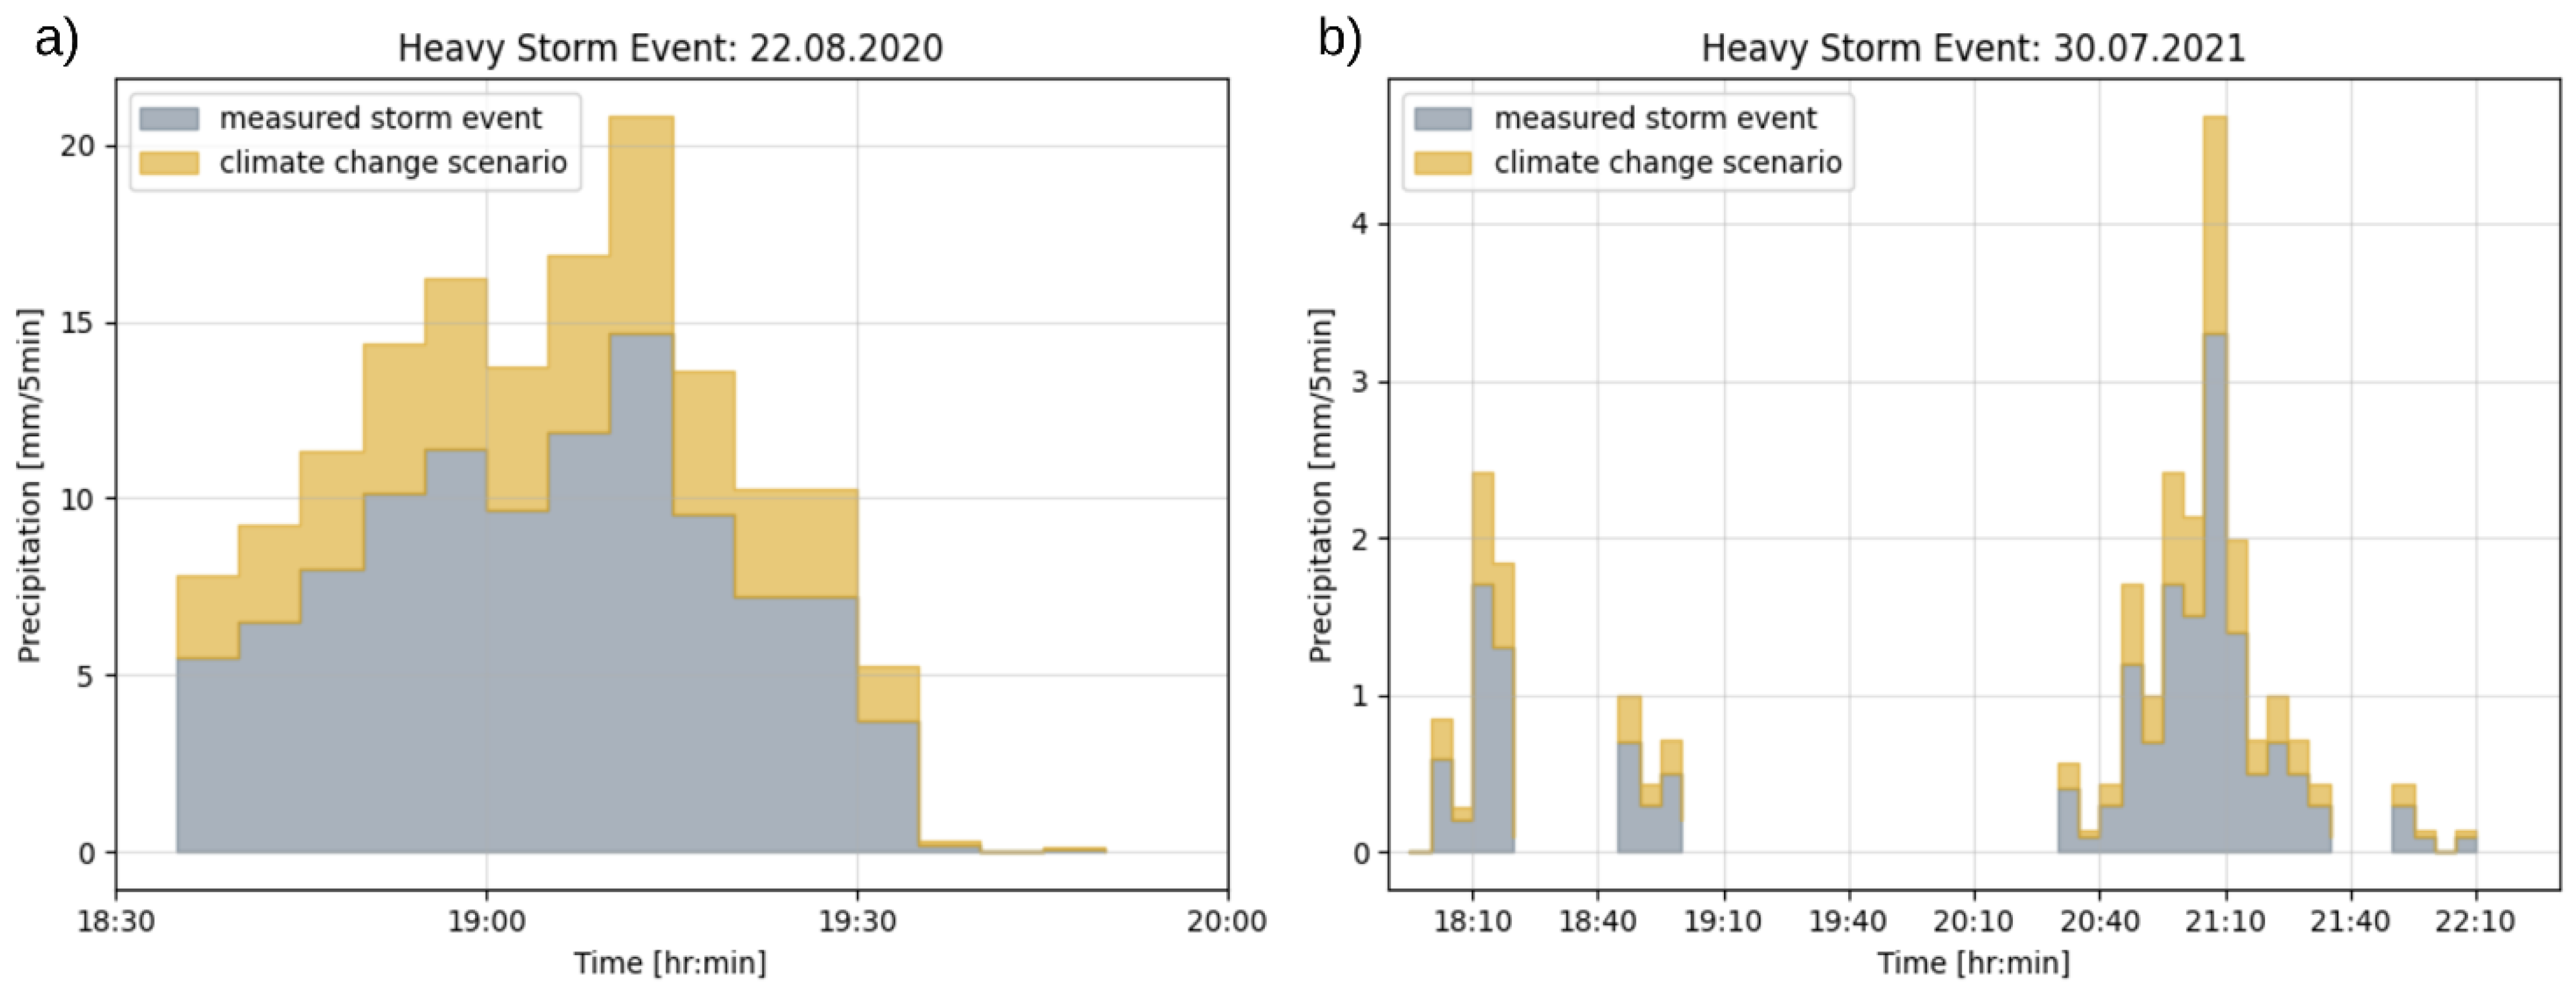
2.4.2. Future Challenge Scenarios

Future challenges in urban drainage system design require an analysis beyond the current environmental conditions, including changes in precipitation, which is a critical factor in flood analysis, and consideration of the growing urban population in the catchment [11,15]. Therefore, four environmental conditions (Ci) are considered in this study: (i) C0, the current state of the catchment; (ii) C1, climate change (increased rainfall intensities); (iii) C2, increasing impervious areas; and (vi) C3, a combination of both (climate change and increasing impervious areas).
To estimate the influence of climate change on future heavy rainfall events, two measured heavy storm events are projected into the future by a simplified factor. Only the total volume and the intensity of the event are modified. To address this, a “business-as-usual” scenario with a 3-degree-Celsius increase is used. In the study region (southeastern Austria), the Clausius–Clapeyron rate could increase to a rate of 10–14 percent per degree Celsius. This is plausible to account for the higher local temperature change during a short intense storm event [7,67]. The pessimistic assumption of a 14 percent increase per degree Celsius in the study site’s regions results in a stronger heavy rainfall event of 42 percent, which is applied to both events (Figure 5).
The population of the study area has increased by 12 percent compared to 30 years ago, showing an increasing trend [53]. Future projections in Austrian cities for the year 2050 demonstrate a possible increase in population between 20 and 47 percent [12]. Therefore, a 30 percent increase in population was assumed, resulting in a direct increase in imperviousness with the same value in the peri-urban area and the two rural border areas. Wu et al. [68] identified such population increase as one main driver for the higher imperviousness rates. However, a future change in Austrian legislation regarding population density was not considered due to a lack of detailed data. Therefore, the scenario represents a simplified way to consider the impact of urbanisation in Austria.

2.4.3. Hydrological Pre-Conditions

In addition to the future scenarios, the hydrological pre-conditions before heavy storms hit must be considered [36]. These conditions can be split into two types: (i) when the soil has sufficient available storage (dry conditions) and (ii) when prior rain events have resulted in small to no available storage (wet conditions). To model wet conditions, we adjusted the hydraulic conductivity parameter for the Green Ampt infiltration approach and set the hydrological loss parameter to zero. This simple method helps to capture the effect of hydrological pre-conditions without increasing the simulation time. In addition, the water depth at the sewer overflows was adjusted based on a function reflecting the rising water levels in the Raab river.

2.4.4. Simulation Scenarios

The three future challenge scenarios and one current state scenario resulted in four individual reference scenarios. Combined with six mitigation strategies and one current state strategy, the total number of simulations for each event is 28. This number was multiplied by two observed heavy storm events, and two hydrological preconditions resulted in a total number of 112 simulations. All of these different scenarios were analysed to show the possible change in efficiency depending on the climatological or hydrological state of the catchment.
For the correct interpretation of the resulting EI, it is important to note that the selected reference scenario to determine the relative deviations depends on whether a mitigation strategy (M1–M6) or a reference strategy (M0) is under analysis for the As-Is (C0) or future challenge scenarios (C1–C3). This is necessary to evaluate the strategies concerning their baselines rather than the present state (M0 and C0). For example, if an M0 strategy was being examined, the present reference state (M0 and C0) was used. On the other hand, when a mitigation strategy scenario was being analysed, the corresponding reference depended on the future challenge scenario (M0 and C1–C3).

3. Results

The peak error at the three observed water marks resulted in a range between −0.212 and 0.202 after the parameter modification (surface roughness and hydrological losses in steep peri-urban areas). The peak error on the observed watermark, L2, resulted in a peak error of 0.003. The qualitative analysis based on the contingency matrix resulted in model accuracy and a success index of 0.6 and a hit rate of 0.67. The hit rate indicates that 16 out of 24 damages were detected by the model. Therefore, the integrated urban flooding model can be considered to have an acceptable model quality as assessed by the combined approach (Figure 6).
The developed efficiency index (EI) serves as a quantifiable metric to assess the impact of six modelled urban flood mitigation strategies. To evaluate the influence of each relevant process of urban flooding, the relative deviations of seven model variables are essential, as illustrated in Figure 7: (i) the water depth for surface flooding (EI1); (ii) discharge to the wastewater treatment plant (EI2); (iii) the combined sewer overflow volume (EI2); (iv) free capacity in the main sewer system (EI2); (v) the sewer flooding volume (EI2); (vi) the resilience index of the sewer system (EI2); and (vii) the sustainable impact (EI3). This enables the interpretation of which process resulted in a high or low total EI.
The relative deviations resulted in three main subparts to calculate the EI. The normalisation (demonstrated by Equation (11)) of each of these subparts resulted in the EI being a multi-objective value to asses a mitigation strategy regarding urban flooding. A negative value stands for low efficiency, and a positive value stands for high efficiency in terms of urban flood prevention. This was calculated for each of the 112 simulations (Figure 8).
The obtained EI for the various mitigation strategies (M1–M6) exhibited a range from −0.364 to 0.925. Notably, the highest efficiency, marked by an EI of 0.925, was attained through the implementation of the agriculture and forestry measure (M6) under future challenge scenario C1 and the 30 July 2021 dry event. In contrast, the lowest EI (−0.364) was associated with the combination of the retention basin and waterways (M2) in the context of combined future challenge scenario C3 and the 30 July 2021 wet event. Furthermore, the comparison of reference scenarios (M0) regarding the future challenges scenarios resulted in low EIs (from 0.060 (M0 and C2 of the 30 July 2021 dry event) to −0.958 (M0 and C3 of the 22 August 2020 wet event)).
To identify the most impactful strategy, all simulation results were classified regarding each mitigation strategy (Figure 9a). A further class regarding the events and hydrological precondition analysed the impact of the event characteristic on efficiency (Figure 9b). A final class addressed the impact of the three future challenge scenarios (C1–C3) in the study site regarding the efficiency of the mitigation strategies (Figure 9c).
The results confirm that mitigation strategies M1 and M6 were the most effective with median values of 0.72 (M1) and 0.66 (M6), while M2 showed the lowest efficiency with a median of 0.01. The green infrastructure combination (M3) had a mean efficiency index of 0.17, and scenarios involving more traditional grey infrastructure (M4 and M5) had a median value of 0.02.
The character of both 22 August 2020 events resulted in a higher median EI (ranging from 0.19 to 0.32) compared to the character of both 30 July 2021 events (ranging from 0.09 to 0.17).
The mitigation strategies regarding the combined future challenge scenario (C3) as the reference scenario resulted in the highest median EI of 0.35. In comparison, the climate change scenario (C1), as the reference scenario, had the lowest median EI of 0.05.
To quantify the influence of the three classes (a: mitigation strategies; b: simulated events; c: future challenges) analysed, an additional analysis of variance (ANOVA) was performed. The results of this analysis (Table 2) demonstrated whether the three analysed classes are significantly related to the developed EI.

4. Discussion

4.1. The Identification of the Most Effective Mitigation Strategy

The detention basin strategy (M1) with a median efficiency index of 0.72 and the agriculture and forestry strategy (M6) with a median efficiency index of 0.66 resulted in the highest EI values. The positive relative deviation of the water balance (RD3: sustainable), the combined sewer overflow volume (RD2.2: CSO), and the surface flooding (RD1: flooding) are responsible for the high impact (as can be seen in Figure 5).
This outcome contrasts with strategy M2, which demonstrates the lowest efficiencies with a median EI of 0.01. This discrepancy arises from the limited implementation of M2 within the urbanised area, resulting in comparatively minor relative deviations (RDi).
Additionally, strategies M4 and M5 resulted in a low EI median due to zero change in the hydrological urban water balance.
Both highly efficient strategies are either implemented within the rural boundary area or between the rural boundary and the urban area. In the study site, the rural boundary areas are larger than the urban area by a factor of 5. Consequently, a strategy implemented over a large rural boundary area is effective in minimising urban flooding by reducing the runoff input from the rural boundary area. This is demonstrated by the high efficiency of the detention basin strategy (M1) because the designed storage volume is based on the runoff input from the rural boundary area with a high return period, especially if the detention basin is emptied by infiltration and evaporation, which results in a high sustainable impact (RD3: between 0.55 and 1).
Similarly, high efficiencies can be achieved through the storage of rainwater in rural boundary areas by the implementation of nature-based solutions (M6). Previous studies have demonstrated similar results, namely that large-scale NBS measures are effective in minimising flood damage costs [34] or reducing the flooding area [28].
In contrast to the results obtained by Liew et al. [30], not only the detention basin, but also the nature-based solutions resulted in high efficiencies, which supports the conclusions of Martínez et al. [46] about the high efficiency of green infrastructure strategies. This suggests that the character of the rural catchment (e.g., hillside, flat area, landcover development) and the location of implementation inside the considered catchment have a strong impact on the efficiency of a mitigation strategy. Such dependency must always be kept in mind regarding general statements about the most effective mitigation strategy.
Another point to note is that an optimal design state was assumed for all strategies analysed. Uncertainties regarding the conditions of the individual systems (e.g., blockages of inlets and outlets) were not taken into account in the presented assessment, although both malfunctions of green infrastructure [69] and the optimal design of detention basins [70] can have a major impact on the system’s performance. This aspect should be taken into account in future research, especially for strategies with high efficiencies (EI>>) and those which are already standardised in the form of guidelines (e.g., detention basins in the presented study site).

4.2. Impact of Event Characteristic

The EIs of all simulated events had similar ranges. However, when comparing the events between the median values (22 August 2020: 0.19–0.32 and 30 July 2021: 0.09–0.17), as well as when comparing the absolute values between the identified two effective strategies (M1 and M6), clear differences in the EI were observed (Figure 8). This suggests that while the character of the analysed events (especially the temporal distribution and the intensity) has an impact on the efficiency of one strategy, the EI itself is not significantly affected by the analysed storm event character. Such is quantified by a higher p-value (0.268) than the threshold of significance (0.05).
But as only two events with a similar return period (T > 100a) and similar hydrological initial conditions (dry soil conditions and wet soil conditions) were simulated, this represents an expected result. Nevertheless, it is necessary to analyse a large number of events with different return periods, storm intensities, and temporal distribution [71] to make a valid statement about the influence of event character on urban flood mitigation strategies.
These results are indicators of higher efficiency for shorter than longer heavy storm events, which is a similar conclusion to a study presented by Qin et al. [72] in which the use of low impact development to manage urban flooding was analysed. In summary, the presented study demonstrates the impact of the heavy storm event character on urban flooding and its mitigation, which supports the findings of previously presented studies [26,73,74].

4.3. Impact of Future Challenge Scenarios

Only the comparison of the reference scenarios (M0 and C1–C3) enables the identification of future challenge scenarios with the greatest impact. The increasing impervious rates resulted in a median EI of −0.02. This supports the conclusion of Li et al. [43], which demonstrates a great impact of system performance regarding urban flood resilience by changing the impervious rate. The median EI for all reference climate change scenarios and reference combined scenarios are in a similar low range between −0.95 and −0.94. This represents an expected result, as the precipitation deeply influenced the urban flooding process [30].
The evaluation of all mitigation strategies related to the class of future challenges shows that the efficiency in the media is higher when considering an increasing impervious rate (median of 0.26 (C2) and 0.35 (C3)) compared to only changing the precipitation (median 0.05 (C1)). From this, it can be deduced that the presented mitigation strategies are more effective against land cover changes than against the change in precipitation events in this study site.
Although the small deviations of the ranges between the three analysed scenarios do not indicate that the analysed scenarios of future challenges have a large influence on the EI, this could not be confirmed by the results of the ANOVA, since the p-value is smaller than the significance threshold of 0.05. Therefore, future challenge scenarios have a significant impact on the developed EI. However, since the difference is only slightly smaller and the F-value is also not very high (3.506), a further analysis of numerous climate change scenarios and increasing impervious rate scenarios is needed to confirm this statement.

4.4. Impact of Water Balance Change of Mitigation Strategies

One highlight of the presented study is the consideration of water balance change as a sustainable impact (RD3) to assess an urban flooding mitigation strategy. This takes the long-term effects of a measure on the hydrological water cycle in the assessment into account.
A specific aspect of this is the separation of the runoff components in a part related to the rural and urban catchment areas. In this way, it is possible to assess the impact of a mitigation strategy which is implemented in the rural area on the water balance in the urban area. This applies to the detention basin strategy (M1) and the agriculture and forestry strategy (M6). Both resulted in the highest positive relative deviation, which was between 1.11 and 2.03 for the detention basin strategy and 1.46 and 1.64 for the agriculture and forestry strategy in the presented study case. Consequently, subpart EI3 resulted in the same high range between 0.55 and 1 for both strategies.
The five-times-larger rural area and the large-scale implementation of the nature-based solution (M6) resulted in such high efficiency because the runoff in the rural area was deeply reduced. Furthermore, the modelled detention basin (M1) resulted in a high positive relative deviation in the water balance in the analysed urban area. This is because the high runoff from the rural boundary area is stored in the basin and discharged mainly by infiltration and restricted outflow. This leads to a positive change in the water balance of the urban study site area. However, this is only possible if the detention basin is designed for high return periods (high stored water) and allows the stored water to infiltrate and evaporate in the basin. If such boundary conditions are changed, the efficiency of the strategy is reduced.
In summary, the results demonstrate that not only can the flooded areas be reduced by strategies in the rural catchment areas, but the urban water cycle can also be influenced positively if the strategies enable infiltration and evaporation processes.

4.5. Multi-Objective Assessment regarding Urban Flooding

In this study, a multi-objective approach is used to assess mitigation strategies, encompassing the most relevant process of urban flooding. These processes include surface flooding, water transport in the central sewer system, sustainable urban drainage constructions such as green infrastructure assets, runoff input from neighbourhood rural catchments, and the long-term impact on the hydrological water cycle. This approach resulted in three main subparts (surface flooding (EI1), urban drainage (EI2), and sustainable impact (EI3)), leading to different interpretations concerning the identification of the most effective mitigation strategies. The combination of the above into one combined efficiency index (EI) allows for a better comparison of different mitigation strategies and future conditions. This would not be possible when looking into the individual components.
If only the EI1 subpart is considered, the agricultural and forestry strategy (M6) with a relative deviation between 0.02 and 0.3 and the retention basin strategy (M1) with a relative deviation between 0.11 and 0.21 are deemed the most effective. However, the final median value of the EI identifies the combined green infrastructure strategy (M3) as the third efficient mitigation strategy (median EI of 0.17), even though the relative deviation of RD1 is only in the range from −0.03 to 0.05. This can be explained by the higher values regarding the sustainable impact (RD3 between 0.06 and 0.37) and the high efficiency of the flow reduction to the wastewater treatment plant (relative deviation between 0 and 0.5), resulting in a high combined urban drainage subpart EI2 for the M3 strategy. Therefore, the effectiveness of combined green infrastructure measures would be significantly reduced if long-term water balance effects are not taken into account.
However, as challenges such as increasing droughts and heavy storm events [4] or increasing urban flood risk due to urbanisation effects [15] become more important in the future, long-term objectives such as increasing water balance need to be included in the evaluation of mitigation strategies in addition to reducing urban flooding.
In summary, the results indicate that a combination of near-natural solutions in rural boundary areas (M6), combined green infrastructure strategies in the urban area (M3), and detention basins between rural and urban areas (M1) are the most effective in a multi-objective assessment. The same high efficiency of combined measures was also found in the study by Pudar et al. [40].
However, a sensitive analysis of each relative deviation and an optimisation analysis are necessary to analyse each possible strategy combination, and they will be the next steps to find the optimal combination of mitigation strategies. Furthermore, the presented EI includes options for extensions with more criteria. The consideration of the radio between investment costs and prevented damage sum can be an economic option for extensions, which is recommended by Iradukunda et al. [51]. Although the presented EI offers the possibility of including climate-related long-term effects in the strategy assessment, there is still a lack of such economic criteria.

5. Conclusions

This study aimed to develop a multi-objective efficiency index (EI) to assess the effectiveness of mitigation strategies to holistically reduce urban flooding, including their long-term effectiveness. The application of the developed EI was demonstrated using the peri-urban study site of Feldbach. It is based on the simulation results of a 1D–2D urban flooding model and a hydrological model to evaluate the long-term change in the water balance. Across 112 simulations, several key findings were derived.
The developed EI provides a straightforward assessment of flood mitigation strategies by presenting a user-friendly range of values (−1 to 1). This simplicity makes the EI a practical communication tool for various stakeholders involved in determining the optimal strategy to increase urban flood resilience. However, the presented EI is not able to take into account economic objectives such as the cost of the strategy or the amount of damage avoided, which can only be achieved by extending the index.
The results demonstrate that strategies in rural boundary areas, particularly retention basins (M1) and agriculture/forestry strategies which use nature-based solutions (M6), have high efficiency in flood mitigation, and they can be applied to study cases with similar characteristics. Furthermore, both strategies contain high efficiencies regarding the long-term effects such as the hydrological water balance change, which emphasises the importance of including the water balance change in the assessment. Therefore, in contrast to traditional grey infrastructure strategies, mitigation strategies that positively support hydrological water balance are recommended, particularly for long-term challenges, such as climate change and urbanisation. Additionally, the study results emphasise the need for a combined approach to assess the impact of mitigation strategies on urban flooding under future challenges. This is evident in the difference between a single relative deviation of each used model variable (RDi) and the resulting EI of each respective mitigation strategy. Despite this, analysing all individual relative deviations is crucial to identifying the responsible processes for a high or low EI. This emphasises the importance of using models that consider all of these processes.
Further validation of the multi-objective efficiency index (EI) through an analysis in real urban catchments with different characteristics and a higher variation in event character regarding the return period and future challenge scenarios is needed to support all of these conclusions. It is also possible to extend the EI to other objectives, such as determining the cost of a mitigation strategy. Finally, sensitivity and multi-criteria optimisation analyses are needed to find the optimal combination of mitigation strategies to improve urban flood management.

Author Contributions

Conceptualisation: S.R., F.F., M.K. and D.M.; methodology: S.R. and A.W.K.; modelling: S.R. and F.F.; validation: S.R. and F.F.; formal analysis: S.R.; investigation: S.R.; writing—original draft preparation: S.R.; writing—review and editing: S.R., F.F., M.P., A.W.K. and M.K.; visualisation, S.R. and M.P.; supervision: D.M.; project administration: S.R. and D.M.; funding acquisition, D.M. All authors have read and agreed to the published version of the manuscript.

Funding

This research was part of the research project “BEJOND” funded by the Federal Ministry of Agriculture, Forestry, Regions and Water Management Austria with project number C000204 (September 2021 – November 2023). This work was supported by the TU Graz Open Access Publishing Fund.

Institutional Review Board Statement

Not applicable.

Informed Consent Statement

Not applicable.

Data Availability Statement

The used digital sewer data and the calibration data were provided by the city of Feldbach. These data can be provided upon request. Furthermore, the following data resources were used: for the digital elevation model (DEM) and the land cover data, the open government data platform was used (https://data.steiermark.at/ (acessed on 2 March 2023)); for the precipitation data, the data hup of the geosphere Austria (https://data.hub.geosphere.at/ (acessed on 11 March 2023)) was used; and data from the Institute of Urban Water Management and Landscape Engineering were used (which can be provided upon request). For data modifications and validations, the open data platform basemap can be found at https://basemap.at/ (acessed on 2 November 2022).

Acknowledgments

We want to acknowledge all project partners of the BEJOND research project for supporting this study with inputs and co-funding (federal state of Styria). We especially want to thank the involved departments of the city of Feldbach and the fire departments, who supported this study with data to validate the used urban flood model. Additionally, great acknowledgement goes to Computational Hydraulics International (CHI-Water), which supported this research by allowing us to use the PCSWMM2D software.

Conflicts of Interest

The authors declare that they have no conflicts of interest.

References

  1. Kundzewicz, Z.W.; Pińskwar, I.; Brakenridge, G.R. Changes in River Flood Hazard in Europe: A Review. Hydrol. Res. 2018, 49, 294–302. [Google Scholar] [CrossRef]
  2. Berndtsson, R.; Becker, P.; Persson, A.; Aspegren, H.; Haghighatafshar, S.; Jönsson, K.; Larsson, R.; Mobini, S.; Mottaghi, M.; Nilsson, J.; et al. Drivers of Changing Urban Flood Risk: A Framework for Action. J. Environ. Manag. 2019, 240, 47–56. [Google Scholar] [CrossRef] [PubMed]
  3. Clarke, B.; Otto, F.; Stuart-Smith, R.; Harrington, L. Extreme Weather Impacts of Climate Change: An Attribution Perspective. Environ. Res. Clim. 2022, 1, 012001. [Google Scholar] [CrossRef]
  4. Bednar-Friedl, B.; Biesbroek, R.; Schmidt, D.N.; Alexander, P.; Børsheim, K.Y.; Carnicer, J.; Georgopoulou, E.; Haasnoot, M.; Cozannet, G.L.; Lionello, P.; et al. Europe. In Climate Change 2022: Impacts, Adaptation and Vulnerability. Contribution of Working Group II to the Sixth Assessment Report of the Intergovernmental Panel on Climate Change; Cambridge University Press: Cambridge, UK; New York, NY, USA, 2022; pp. 1817–1927. ISBN 978-1-00-932584-4. [Google Scholar]
  5. Berg, P.; Moseley, C.; Haerter, J. Strong Increase in Convective Precipitation in Response to Higher Temperature. Nat. Geosci. 2013, 6, 181–185. [Google Scholar] [CrossRef]
  6. Rogers, R.R.; Rogers, R.R.; Yau, M.K.; Yau, M.K. A Short Course in Cloud Physics, 3rd ed.; International Series In Natural Philosophy, Reprint; Butterworth Heinemann: Woburn, MA, USA, 1996; ISBN 978-0-7506-3215-7. [Google Scholar]
  7. Maraun, D.; Knevels, R.; Mishra, A.; Truhetz, H.; Bevacqua, E.; Proske, H.; Zappa, G.; Brenning, A.; Petschko, H.; Schaffer, A.; et al. A Severe Landslide Event in the Alpine Foreland under Possible Future Climate and Land-Use Changes. Commun. Earth Environ. 2022, 3, 87. [Google Scholar] [CrossRef]
  8. Pfahl, S.; O’Gorman, P.A.; Fischer, E.M. Understanding the Regional Pattern of Projected Future Changes in Extreme Precipitation. Nat. Clim. Chang. 2017, 7, 423–427. [Google Scholar] [CrossRef]
  9. Hammond, M.J.; Chen, A.S.; Djordjević, S.; Butler, D.; Mark, O. Urban Flood Impact Assessment: A State-of-the-Art Review. Urban Water J. 2015, 12, 14–29. [Google Scholar] [CrossRef]
  10. UN. 68% of the World Population Projected to Live in Urban Areas by 2050, Says UN. Available online: https://www.un.org/development/desa/en/news/population/2018-revision-of-world-urbanization-prospects.html (accessed on 17 December 2020).
  11. Freddy, V.; El Mehdi Saidi, M.; Douvinet, D.; Fehri, N.; Nasrallah, W.; Menad, W.; Mellas, S. Urbanization and Land Use as a Driver of Flood Risk. In The Mediterranen Region under Climate Change; IRD Éditions/Institut de Recherche Pour le Développement Marseille: Marseille, France, 2016; pp. 563–575. ISBN 978-2-7099-2219-7. [Google Scholar]
  12. Mikovits, C.; Tscheikner-Gratl, F.; Jasper-Tönnies, A.; Einfalt, T.; Huttenlau, M.; Schöpf, M.; Kinzel, H.; Rauch, W.; Kleidorfer, M. Decision Support for Adaptation Planning of Urban Drainage Systems. J. Water Resour. Plan. Manag. 2017, 143, 04017069. [Google Scholar] [CrossRef]
  13. Torelló-Sentelles, H.; Marra, F.; Peleg, N. Changing spatial patterns of convective rainfall across urban areas. In Proceedings of the EGU General Assembly 2023, Vienna, Austria, 24–28 April 2023. [Google Scholar] [CrossRef]
  14. Steensen, B.M.; Marelle, L.; Hodnebrog, Ø.; Myhre, G. Future Urban Heat Island Influence on Precipitation. Clim. Dyn. 2022, 58, 3393–3403. [Google Scholar] [CrossRef]
  15. O’Donnell, E.C.; Thorne, C.R. Drivers of Future Urban Flood Risk. Philos. Trans. R. Soc. A 2020, 378, 20190216. [Google Scholar] [CrossRef]
  16. Hosseinzadehtalaei, P.; Tabari, H.; Willems, P. Climate Change Impact on Short-Duration Extreme Precipitation and Intensity–Duration–Frequency Curves over Europe. J. Hydrol. 2020, 590, 125249. [Google Scholar] [CrossRef]
  17. Lee, E.H.; Lee, Y.S.; Joo, J.G.; Jung, D.; Kim, J.H. Flood Reduction in Urban Drainage Systems: Cooperative Operation of Centralized and Decentralized Reservoirs. Water 2016, 8, 469. [Google Scholar] [CrossRef]
  18. Schmitt, T.G.; Thomas, M.; Ettrich, N. Analysis and Modeling of Flooding in Urban Drainage Systems. J. Hydrol. 2004, 299, 300–311. [Google Scholar] [CrossRef]
  19. Fletcher, T.D.; Shuster, W.; Hunt, W.F.; Ashley, R.; Butler, D.; Arthur, S.; Trowsdale, S.; Barraud, S.; Semadeni-Davies, A.; Bertrand-Krajewski, J.L.; et al. SUDS, LID, BMPs, WSUD and More—The Evolution and Application of Terminology Surrounding Urban Drainage. Urban Water J. 2015, 12, 525–542. [Google Scholar] [CrossRef]
  20. Zhou, L.; Guan, D.; Huang, X.; Yuan, X.; Zhang, M. Evaluation of the Cultural Ecosystem Services of Wetland Park. Ecol. Indic. 2020, 114, 106286. [Google Scholar] [CrossRef]
  21. Pinto, L.V.; Pereira, P.; Gazdic, M.; Ferreira, A.; Ferreira, C.S.S. Assessment of NBS Impact on Pluvial Flood Regulation Within Urban Areas: A Case Study in Coimbra, Portugal. In Nature-Based Solutions for Flood Mitigation: Environmental and Socio-Economic Aspects; Ferreira, C.S.S., Kalantari, Z., Hartmann, T., Pereira, P., Eds.; The Handbook of Environmental Chemistry; Springer International Publishing: Cham, Switzerland, 2022; pp. 289–312. ISBN 978-3-030-77505-6. [Google Scholar]
  22. Orta-Ortiz, M.; Geneletti, D. Reviewing the Performance of Nature-Based Solutions for Stormwater Management in Urban Areas. In Innovation in Urban and Regional Planning. INPUT 2021. Lecture Notes in Civil Engineering; La Rosa, D., Privitera, R., Eds.; Springer: Cham, Switzerland, 2021; Volume 146. [Google Scholar] [CrossRef]
  23. Apel, H.; Martínez Trepat, O.; Hung, N.N.; Chinh, D.T.; Merz, B.; Dung, N.V. Combined Fluvial and Pluvial Urban Flood Hazard Analysis: Concept Development and Application to Can Tho City, Mekong Delta, Vietnam. Nat. Hazards Earth Syst. Sci. 2016, 16, 941–961. [Google Scholar] [CrossRef]
  24. Qi, M.; Huang, H.; Liu, L.; Chen, X. An Integrated Approach for Urban Pluvial Flood Risk Assessment at Catchment Level. Water 2022, 14, 2000. [Google Scholar] [CrossRef]
  25. Qi, W.; Ma, C.; Xu, H.; Chen, Z.; Zhao, K.; Han, H. A Review on Applications of Urban Flood Models in Flood Mitigation Strategies. Nat. Hazards 2021, 108, 31–62. [Google Scholar] [CrossRef]
  26. Ahmadisharaf, E.; Alamdari, N.; Tajrishy, M.; Ghanbari, S. Effectiveness of Retention Ponds for Sustainable Urban Flood Mitigation across Range of Storm Depths in Northern Tehran, Iran. J. Sustain. Water Built Environ. 2021, 7, 05021003. [Google Scholar] [CrossRef]
  27. Guido, B.I.; Popescu, I.; Samadi, V.; Bhattacharya, B. An Integrated Modeling Approach to Evaluate the Impacts of Nature-Based Solutions of Flood Mitigation across a Small Watershed in the Southeast United States. Nat. Hazards Earth Syst. Sci. 2023, 23, 2663–2681. [Google Scholar] [CrossRef]
  28. Ferreira, C.S.S.; Potočki, K.; Kapović-Solomun, M.; Kalantari, Z. Nature-Based Solutions for Flood Mitigation and Resilience in Urban Areas. In Nature-Based Solutions for Flood Mitigation: Environmental and Socio-Economic Aspects; Ferreira, C.S.S., Kalantari, Z., Hartmann, T., Pereira, P., Eds.; The Handbook of Environmental Chemistry; Springer International Publishing: Cham, Switzerland, 2022; pp. 59–78. ISBN 978-3-030-77505-6. [Google Scholar]
  29. Jacob, A.C.P.; Rezende, O.M.; de Sousa, M.M.; de França Ribeiro, L.B.; de Oliveira, A.K.B.; Arrais, C.M.; Miguez, M.G. Use of Detention Basin for Flood Mitigation and Urban Requalification in Mesquita, Brazil. Water Sci. Technol. 2019, 79, 2135–2144. [Google Scholar] [CrossRef]
  30. Liew, Y.S.; Mat Desa, S.; Md. Noh, M.N.; Tan, M.L.; Zakaria, N.A.; Chang, C.K. Assessing the Effectiveness of Mitigation Strategies for Flood Risk Reduction in the Segamat River Basin, Malaysia. Sustainability 2021, 13, 3286. [Google Scholar] [CrossRef]
  31. Abduljaleel, Y.; Salem, A.; ul Haq, F.; Awad, A.; Amiri, M. Improving Detention Ponds for Effective Stormwater Management and Water Quality Enhancement under Future Climate Change: A Simulation Study Using the PCSWMM Model. Sci. Rep. 2023, 13, 5555. [Google Scholar] [CrossRef]
  32. Nordbeck, R.; Steurer, R.; Löschner, L. The Future Orientation of Austria’s Flood Policies: From Flood Control to Anticipatory Flood Risk Management. J. Environ. Plan. Manag. 2019, 62, 1864–1885. [Google Scholar] [CrossRef]
  33. Kang, N.; Kim, S.; Kim, Y.; Noh, H.; Hong, S.J.; Kim, H.S. Urban Drainage System Improvement for Climate Change Adaptation. Water 2016, 8, 268. [Google Scholar] [CrossRef]
  34. Pour, S.H.; Wahab, A.K.A.; Shahid, S.; Asaduzzaman, M.; Dewan, A. Low Impact Development Techniques to Mitigate the Impacts of Climate-Change-Induced Urban Floods: Current Trends, Issues and Challenges. Sustain. Cities Soc. 2020, 62, 102373. [Google Scholar] [CrossRef]
  35. Zhang, P.; Chen, L.; Hou, X.; Wei, G.; Zhang, X.; Shen, Z. Detailed Quantification of the Reduction Effect of Roof Runoff by Low Impact Development Practices. Water 2020, 12, 795. [Google Scholar] [CrossRef]
  36. Leimgruber, J. Model-Based Assessment of Cost-Effective Low Impact Development Strategies to Control Water Balance; Technischen Universität Graz: Graz, Austria, 2019. [Google Scholar]
  37. Keyvanfar, A.; Shafaghat, A.; Ismail, N.; Mohamad, S.; Ahmad, H. Multifunctional Retention Pond for Stormwater Management: A Decision-Support Model Using Analytical Network Process (ANP) and Global Sensitivity Analysis (GSA). Ecol. Indic. 2021, 124, 107317. [Google Scholar] [CrossRef]
  38. Liu, L.; Dobson, B.; Mijic, A. Optimisation of Urban-Rural Nature-Based Solutions for Integrated Catchment Water Management. J. Environ. Manag. 2023, 329, 117045. [Google Scholar] [CrossRef]
  39. Tamura, T. Improvement of the Flood-Reduction Function of Forests Based on Their Interception Evaporation and Surface Storage Capacities. In Green Infrastructure and Climate Change Adaptation: Function, Implementation and Governance; Nakamura, F., Ed.; Ecological Research Monographs; Springer Nature: Singapore, 2022; pp. 93–104. ISBN 9789811667916. [Google Scholar]
  40. Pudar, R.; Plavsic, J.; Todorovic, A. Evaluation of Green and Grey Flood Mitigation Measures in Rural Watersheds. Appl. Sci. 2020, 10, 6913. [Google Scholar] [CrossRef]
  41. Martínez Cano, C.; Sanchez Torres, A.; Toloh, B.; Vojinovic, Z. Multi-Objective Evaluation of Urban Drainage Networks Using a 1D/2D Flood Inundation Model. Water Resour. Manag. 2018, 32, 4329–4343. [Google Scholar] [CrossRef]
  42. Mugume, S.N.; Gomez, D.E.; Fu, G.; Farmani, R.; Butler, D. A Global Analysis Approach for Investigating Structural Resilience in Urban Drainage Systems. Water Res. 2015, 81, 15–26. [Google Scholar] [CrossRef]
  43. Li, J.; Strong, C.; Wang, J.; Burian, S. An Event-Based Resilience Index to Assess the Impacts of Land Imperviousness and Climate Changes on Flooding Risks in Urban Drainage Systems. Water 2023, 15, 2663. [Google Scholar] [CrossRef]
  44. Li, J.; Burian, S.J.; Johnson, R.C. Exploring Cost-Effective Implementation of Real-Time Control to Enhance Flooding Resilience against Future Rainfall and Land Cover Changes. Preprints 2023. [Google Scholar] [CrossRef]
  45. Rezende, O.M.; de Franco, A.B.R.; Oliveira, A.K.B.; Jacob, A.C.P.; Miguez, M.G. A Framework to Assess Urban Floods Resilience. In New Trends in Urban Drainage Modelling. UDM 2018; Mannina, G., Ed.; Springer: Cham, Switzerland, 2018; pp. 533–538. ISBN 978-3-319-99867-1. [Google Scholar]
  46. Martínez, C.; Vojinovic, Z.; Sanchez Torres, A. Multi-Objective Model-Based Assessment of Green-Grey Infrastructures for Urban Flood Mitigation. Hydrology 2021, 8, 110. [Google Scholar] [CrossRef]
  47. Reinstaller, S.; Funke, F.; Kleidorfer, M.; Muschalla, D. Maßnahmen zur urbanen Überflutungsprävention: Wirksamkeit von dezentraler Niederschlagswasserbewirtschaftung im Vergleich zu konventionellen Maßnahmen. Osterr. Wasser-Abfallwirtsch. 2023, 75, 626–633. [Google Scholar] [CrossRef]
  48. Taherdoost, H.; Madanchian, M. Multi-Criteria Decision Making (MCDM) Methods and Concepts. Encyclopedia 2023, 3, 77–87. [Google Scholar] [CrossRef]
  49. Miguez, M.G.; Veról, A.P. A Catchment Scale Integrated Flood Resilience Index to Support Decision Making in Urban Flood Control Design. Environ. Plan. B Urban Anal. City Sci. 2017, 44, 925–946. [Google Scholar] [CrossRef]
  50. Bertilsson, L.; Wiklund, K.; de Moura Tebaldi, I.; Rezende, O.M.; Veról, A.P.; Miguez, M.G. Urban Flood Resilience—A Multi-Criteria Index to Integrate Flood Resilience into Urban Planning. J. Hydrol. 2019, 573, 970–982. [Google Scholar] [CrossRef]
  51. Iradukunda, P.; Mwanaumo, E.M.; Kabika, J. A Review of Integrated Multicriteria Decision Support Analysis in the Climate Resilient Infrastructure Development. Environ. Sustain. Indic. 2023, 20, 100312. [Google Scholar] [CrossRef]
  52. Grahn, T.; Nyberg, L. Assessment of Pluvial Flood Exposure and Vulnerability of Residential Areas. Int. J. Disaster Risk Reduct. 2017, 21, 367–375. [Google Scholar] [CrossRef]
  53. Bundesanstalt Statistik Österreich Ein Blick Auf Die Gemeinde. Available online: https://www.statistik.at/blickgem/gemDetail.do?gemnr=62379 (accessed on 4 May 2023).
  54. DIN EN 752:2017-07; Entwässerungssysteme Außerhalb von Gebäuden Kanalmanagement. Deutsches Institut für Normung: Berlin, Germany, 2017. [CrossRef]
  55. Pistrika, A.; Tsakiris, G.; Nalbantis, I. Flood Depth-Damage Functions for Built Environment. Environ. Process. 2014, 1, 553–572. [Google Scholar] [CrossRef]
  56. Smith, G.P.; Davey, E.K.; Cox, R. Flood Hazard WRL Technical Report 2014/07; University of New South Wales: Sydney, Australia, 2014. [Google Scholar]
  57. Landesanstalt für Umwelt, Messungen und Naturschutz Baden-Württemberg (Ed.) Leitfaden Kommunales Starkregenrisikomanagement in Baden-Württemberg; Stand Dezember 2016; LUBW Landesanstalt für Umwelt, Messungen und Naturschutz: Karlsruhe, Germany, 2016; ISBN 978-3-88251-391-2. [Google Scholar]
  58. Reinstaller, S.; Muschalla, D. Qualitative Techniques to Evaluate Urban Flood Models. In Proceedings of the 12th International Conference of Urban Drainage Modelling, Costa Mesa, CA, USA, 10–12 January 2022. [Google Scholar]
  59. Brears, R.C. From Traditional Grey Infrastructure to Blue-Green Infrastructure. In Blue and Green Cities; Springer International Publishing: Cham, Switzerland, 2023; pp. 5–42. ISBN 978-3-031-41392-6. [Google Scholar]
  60. Hwang, H.; Lansey, K.; Quintanar, D.R. Resilience-Based Failure Mode Effects and Criticality Analysis for Regional Water Supply System. J. Hydroinform. 2014, 17, 193–210. [Google Scholar] [CrossRef]
  61. Sörensen, J.; Persson, A.S.; Olsson, J.A. A Data Management Framework for Strategic Urban Planning Using Blue-Green Infrastructure. J. Environ. Manag. 2021, 299, 113658. [Google Scholar] [CrossRef] [PubMed]
  62. James, R.; Finney, K.; Perera, N.; Peyron, N. SWMM5/PCSWMM Integrated 1D-2D Modeling. In Proceedings of the Engineering Conferences International ECI Digital Archives, Iceland, 23–27 July 2012. [Google Scholar]
  63. Rossman, L.A.; Simon, A.M. Storm Water Management Model User’s Manual Version 5.2; U.S. Environmental Protection Agency: Cincinnati, OH, USA, 2022. [Google Scholar]
  64. Reinstaller, S.; Krebs, G.; Pichler, M.; Muschalla, D. Identification of High-Impact Uncertainty Sources for Urban Flood Models in Hillside Peri-Urban Catchments. Water 2022, 14, 1973. [Google Scholar] [CrossRef]
  65. Bennett, N.D.; Croke, B.F.W.; Guariso, G.; Guillaume, J.H.A.; Hamilton, S.H.; Jakeman, A.J.; Marsili-Libelli, S.; Newham, L.T.H.; Norton, J.P.; Perrin, C.; et al. Characterising Performance of Environmental Models. Environ. Model. Softw. 2013, 40, 1–20. [Google Scholar] [CrossRef]
  66. Rossman, L.A.; Huber, W.C. Storm Water Management Model Reference Manual Volume III—Water Quality; EPA—United States Environmental Protection Agency: Cincinnati, OH, USA, 2016. [Google Scholar]
  67. Schroeer, K.; Kirchengast, G.; Sungmin, O. Strong Dependence of Extreme Convective Precipitation Intensities on Gauge Network Density. Geophys. Res. Lett. 2018, 45, 8253–8263. [Google Scholar] [CrossRef]
  68. Wu, W.; Li, C.; Liu, M.; Hu, Y.; Xiu, C. Change of Impervious Surface Area and Its Impacts on Urban Landscape: An Example of Shenyang between 2010 and 2017. Ecosyst. Health Sustain. 2020, 6, 1767511. [Google Scholar] [CrossRef]
  69. Funke, F.; Kleidorfer, M. Sensitivity of Sustainable Urban Drainage Systems to Precipitation Events and Malfunctions. Blue-Green Syst. 2024, 6, 33–52. [Google Scholar] [CrossRef]
  70. Ngo, T.T.; Yoo, D.G.; Lee, Y.S.; Kim, J.H. Optimization of Upstream Detention Reservoir Facilities for Downstream Flood Mitigation in Urban Areas. Water 2016, 8, 290. [Google Scholar] [CrossRef]
  71. Mei, C.; Liu, J.; Wang, H.; Li, Z.; Yang, Z.; Shao, W.; Ding, X.; Weng, B.; Yu, Y.; Yan, D. Urban Flood Inundation and Damage Assessment Based on Numerical Simulations of Design Rainstorms with Different Characteristics. Sci. China Technol. Sci. 2020, 63, 2292–2304. [Google Scholar] [CrossRef]
  72. Qin, H.; Li, Z.; Fu, G. The Effects of Low Impact Development on Urban Flooding under Different Rainfall Characteristics. J. Environ. Manag. 2013, 129, 577–585. [Google Scholar] [CrossRef] [PubMed]
  73. Gülbaz, S.; Kazezyilmaz-Alhan, C.M. Experimental Investigation on Hydrologic Performance of LID with Rainfall-Watershed-Bioretention System. J. Hydrol. Eng. 2017, 22, D4016003. [Google Scholar] [CrossRef]
  74. Jackisch, N.; Weiler, M. The Hydrologic Outcome of a Low Impact Development (LID) Site Including Superposition with Streamflow Peaks. Urban Water J. 2017, 14, 143–159. [Google Scholar] [CrossRef]
Figure 1. A general workflow to assess an urban flooding mitigation strategy with the multi-objective efficiency index (EI), which includes the following main steps: (i) process understanding; (ii) modelling; (iii) required model output to quantify the efficiency; and (iv) the creation of the multi-objective efficiency index (EI).
Sustainability 16 04123 g001
Figure 2. An overview of the study site Feldbach in southeastern Styria in Austria with a total catchment area of 634 hectares with the detailed overview of the urban area (yellow: 103 hectares) and two rural boundary areas (Aderbach catchment with 35 hectares and Oederbach catchment with 497 hectares).
Sustainability 16 04123 g002
Figure 3. Key concepts regarding the process of understanding both used models to determine the efficiency index EI. (A) A distributed hydrological model with the change in water balance in the urban area as the main objective; (B) a 1D–2D model with the flooding area and the state variables in the urban drainage system as the main objective.
Sustainability 16 04123 g003
Figure 4. Model approach, used storage function (A = f(h)), and detailed implementation in 1D/2D model of scenario. (a) M3 LID combination with green roof and vegetative swales; (b) rain detention basin.
Sustainability 16 04123 g004
Figure 5. Used measured storm events and climate scenarios: (a) heavy storm event on 22 August 2020 in Feldbach (total measured precipitation sum of 106 mm and 151 mm future projected precipitation sum in 2 h); (b) heavy storm event on 30 July 2021 in Graz (total measured precipitation sum of 90 mm and 128 mm future projected precipitation sum in 5 h).
Sustainability 16 04123 g005
Figure 6. A combined approach to evaluate the developed 1D–2D urban flood model. Left side: a qualitative model evaluation with the resulting contingency matrix to estimate the model accuracy, hit rate, and success index; right side: the simulated water depth on the three observed watermarks (L1, L2, and L3) to estimate the peak error as a quantitative model evaluation.
Sustainability 16 04123 g006
Figure 7. The relative deviations of each required model variable from the reference scenario (M0) for each of the 112 simulations sorted by model variable (surface flooding (flooding), the free capacity in the main sewer system (capacity), the combined sewer overflow volume (CSO), the discharge to the wastewater treatment plant (WWTP), the resilience index of the sewer system (resilience), sewer flooding (sewer flooding), and the relative deviation of the water balance (sustainable))) and the simulated events: 2 heavy storm events (30 July 2021 and 22 August 2020) and 2 hydrological pre-conditions (wet and dry conditions). The 4 future challenges scenarios (C0–C3) and the 7 mitigation strategies (M0–M6)) are also presented.
Sustainability 16 04123 g007
Figure 8. The final efficiency index (EI) to asses each of the six mitigation strategies (M1–M6) and baseline reference strategies for the three future challenge scenarios (C1–C3) and one present state (C0) based on two measured heavy storm events (22 August 2020 and 30 July 2021) with two hydrological pre-conditions (dry and wet soil conditions).
Sustainability 16 04123 g008
Figure 9. Box plots of the total efficiency index (EI) with the median values regarding the (a) mitigation strategies (M1: rain detention basin; M2: multifunctional retention pond; M3: green–infrastructure combination; M4: sewer modification; M5: mobile barriers; and M6: agriculture and forestry measure); (b) simulated events (22 August 2020 and 30 July 2021) in combination with dry or wet hydrological pre-conditions; and (c) future challenges (climate change (C1); increasing impervious areas (C2); the combination of C1 and C2).
Sustainability 16 04123 g009
Table 1. An overview of the analysed mitigation strategy scenarios with the used general model approach and design conditions with the assumed return period to design the strategies.
NumberStrategy NameModelling ApproachModel DescriptionDesign Conditions
M0reference hydrological–hydraulicevaluated the 1D–2D urban flood model of the current state
M1rain detention basinhydraulichydraulic storage node modelled with an area/depth functionT = 100a
M2multifunctional retention basin hydrauliccombination of depth-modified nodes in the 2D mesh for the waterways and storage nodes as
multifunctional retention ponds
T = 30a
M3green infrastructure combinationhydrological–hydrauliccombination of the LID approach for green roofs and hydraulic storage nodes for vegetative swalesT = 5a
M4sewer system modificationhydraulicmodification of the conduit geometry of the 1D sewer modelT = 10–50a
M5mobile barriershydraulicincreasing the depth of the fictive nodes of the mesh where the mobile barriers are implemented
M6agriculture and forestry measurehydrologicalmodification of the loss parameters (depression storage and interception storage) and hydraulic conductivity in the hydrological model
Table 2. The results of the ANOVA with the F-value and p-value as statistical objectives to quantify the impact of the three analysed classes on the EI (mitigation strategies; simulated events; and future challenges).
Statistical ObjectiveMitigation StrategiesSimulated EventsFuture Challenges
F-value55.9071.3333.505759
p-value1.3 × 10−292.7 × 10−11.8 × 10−2
Disclaimer/Publisher’s Note: The statements, opinions and data contained in all publications are solely those of the individual author(s) and contributor(s) and not of MDPI and/or the editor(s). MDPI and/or the editor(s) disclaim responsibility for any injury to people or property resulting from any ideas, methods, instructions or products referred to in the content.

