Article

Economic Strategy for Developing the Oil Industry in Mexico by Incorporating Environmental Factors

by
Tatyana Semenova
* and
Juan Yair Martínez Santoyo
Economics, Organization and Management Department, Saint Petersburg Mining University, 2, 21st Line, 199106 Saint Petersburg, Russia
*
Author to whom correspondence should be addressed.
Sustainability 2024, 16(1), 36; https://doi.org/10.3390/su16010036
Submission received: 6 December 2023 / Revised: 14 December 2023 / Accepted: 16 December 2023 / Published: 19 December 2023
(This article belongs to the Special Issue Circular Economy and Mining Ecology Management)

Abstract

:
This article presents a methodological approach that can more effectively solve environmental problems related to the activities of oil companies. Traditionally, environmental factors have been seen as merely an additional cost that obstructs economic development. The contribution of the authors’ approach lies in the fact that it substantiates the need and the possibility to increase the potential for the functioning and development of the country, for the case of Mexico, while considering environmental factors on a scientific basis. This study proposes a methodology and, therefore, the selection of a strategy for the development of Mexico’s oil industry, ensuring an increase in its environmental and economic efficiency and the sustainability of its territorial functioning and development. The methodology presented in this article develops the concept of sub-potentials, which include the sub-potentials of reproduction, protection, management and development, and reserve. Sub-potentials, particularly the protection sub-potential, integrate environmental components. Neglecting environmental factors leads to an increase in the sub-potentials of the threat and deterrence. Environmental factors are analyzed as a part of a unified strategy for the development of the country, when presenting the formation of a comprehensive system of indicators using management guidelines and a three-dimensional assessment of the criteria for the development of the country’s oil and gas sector. The consequence of using this methodology is the integration of the environmental component of the development in the oil and gas sector into the country’s unified socio-economic strategy. This can effectively solve environmental problems and achieve socio-economic development goals. Consequently, incorporating the environmental aspect based on the proposed methodology permits the effective utilization of society’s limited resources. The application of this systematic approach, encompassing all levels of sustainable strategic development—the oil company, the industry, and the country—also yields additional synergies.

1. Introduction

This article analyzes Mexico’s oil industry’s environmental and economic development strategy through the case of the Transition Strategy to Promote the Use of Cleaner Technologies and Fuels through the concept of an environmental sub-potential. This strategy is Mexico’s national energy transition policy of the oil and electric sectors. An important factor in the development of the oil industry in Mexico is the business of Petroleos Mexicanos (PEMEX), which has a significant impact on the environment, making up 96% of the hydrocarbon production in the country. This research presents the hypothesis that resources allocated to this strategy, especially strategic resources allocated to PEMEX, improve the environmental performance of Mexico’s territorial functioning and development. These pollutants include greenhouse gas emissions derived from carbon dioxide (CO2) and sulfur oxides (SOx), electricity consumption during hydrocarbon production, and areas polluted by the company’s activities.
The article proposes a methodological approach for selecting strategies for the oil industry, aiming to enhance the economic efficiency while considering the environmental impact. The strategy should be incorporated into the overarching environmental and economic development strategy of the territorial area. A calculation for Mexico was carried out based on the presented methodological approach, and a strategy for Mexico was selected. A conceptual approach for creating a comprehensive system of indicators, as an effective tool for strategic management, is proposed to bolster the efficiency and implementation of the oil sector’s strategic management.
Through the development of the concept of sub-potentials, this study contributes to the integration of the environmental component into the socio-economic strategy of the country and its oil and gas sector. Improving the environmental situation increases the sub-potential for protection and, accordingly, the potential for the functioning and development of the territory. When assessing the directions of development in a territory, an integrated approach is important, allowing one to take into account the various components of the effectiveness of investment projects accepted for implementation. An important aspect of the proposed conceptual and methodological approach is the comprehensive consideration of various types of efficiency, which makes possible the evaluation of the environmental factor to implement projects. Various types of effectiveness are predominantly associated with individual sub-potentials and in an integrated form, they determine the potential for functioning and development. For instance, the social component of the efficiency increases the sub-potentials of reproduction, and technological efficiency increases the sub-potential of the reserve. The mutual influence of sub-potentials allows us to further develop the final result for increasing the potential for the functioning and development of the territory because considering the territorial system as a single set of the most important subsystems leads to the possibility for using the properties of synergy in systems, subject to adequate government regulation measures with the elaboration of the environmental component. It should be emphasized that the traditional view of the environmental factor usually considers environmental activities only as additional costs that reduce the possibilities of economic development. This article presents the first analysis of environmental data from PEMEX within a methodology to assess the environmental factor in a development strategy. We conducted an analysis of the determinants and factors for the sustainable development of the Mexican oil industry.
The first part of this article presents the regulatory situation of Mexico’s energy transition. In the literature review, an exploration of the ideas of energy transition in countries and at national oil companies is presented, as well as the specific studies conducted in the case of Mexico. Secondly, we introduce the concept of sub-potentials for the territory. In the third part, we present the results of the algorithm to select a rational strategy for the oil sector in Mexico, considering the environmental factor. Then, we discuss this concept in the light of the literature, as well as the effectiveness of energy use in the territory and the technical and public policy implications of this concept. Finally, we conclude that the integration of the environmental component of the development and the oil and gas sector is necessary for the effective use of the resources in a transition strategy to cleaner oil extraction at country and company levels.
The Paris Agreement to limit the global temperature rise to two degrees changed the goals of investors in the energy industry. This happened simultaneously with the oil price crisis during the period leading to 2020. The energy price crisis forced oil companies to improve their efficiency [1]. Oil and gas companies’ investments outside their core business, such as the transition to clean generation, account for less than 1% of their total capital expenditure, according to the International Energy Agency [2].
According to the International Renewable Energy Agency, oil companies initiated a number of actions to make their production cleaner [3]. For comparison, it is important to look at what private oil companies implement to achieve cleaner production goals, for example, at the five largest private companies: BP plc, Chevron, Eni S.p.A, Equinor, ExxonMobil, Shell plc, and Total [4]. The shareholders of these companies require that their strategies comply with sustainability goals in their entire business model.
The traditional perception is that the oil industry is negatively associated with investment in renewable energy sources in general. At the same time, the country needs to carry out technological innovation and expand the use of renewable energy sources to improve the quality of the environment, which, in turn, is associated with the volatility of oil prices, an issue that plays an important role in various investments [5].
The analysis uses Mexico’s National Energy Transition and Sustainable Energy Strategy, developed in 2008 through the Renewable Energy and Energy Transition Financing Act. This strategy aimed to create instruments for financing the energy transition. The Ministry of Energy is responsible for channeling these investments into the national energy matrix, of which PEMEX is a member. As article 24 states, these investments should “promote the use of clean technologies and renewable energy sources, as well as savings and the most rational use of all types of energy in processes and activities, from operation to consumption” [6].
Mexico’s energy reform gave greater autonomy to PEMEX and the state-owned electricity company. Along with new climate commitments adopted by several countries at COP-21 in Paris in 2015, there is a need to improve legislation. Although the way resources are managed is changing, the goal of the strategy continues to be technological transformation to solve environmental problems. The analysis shows that there is continuity in how resources from the Mexican federal budget are distributed [7].
The study of the strategic development documents points toward an increase in the influence of the energy sector on the overall economic and environmental situation in the country. The Transition Strategy to Promote the Use of Cleaner Technologies and Fuels, approved following the 2014 energy sector reform, set goals for developing an efficient energy market and a low-carbon economy and improving social security conditions [8]. This first strategy served as the basis for the Energy Transition Law, published in 2015. The law defines the strategy as the axis of the energy policy in the medium and long terms, concerning the commitments to clean energy, sustainable energy use, and the energy efficiency of economically feasible emission reductions in the electricity sector.
In 2018, this strategy was updated to include changes to the assessment of the conditions and the setting of goals for the energy sector for 2050. From this reform, it is important to invest in the use of technical and technological capabilities to ensure the country’s energy security [9].
This study argues that despite the measures that are taken, environmental pollution from the oil sector remains high. In addition, a number of socio-economic issues remain pending in the country. Therefore, to increase the efficiency of the oil industry, which has a significant share in the formation of the state budget (the third part of the budget), a new methodological approach is required that makes it possible to integrate the management of the development of the oil sector into a unified socio-economic strategy.
When developing this approach, the authors considered that the activities of the PEMEX company are of great importance for the electricity sector [9]. Fuel supplies for the Mexican electricity sector come primarily from crude oil and petroleum products (38%), as well as natural gas and condensate (47%); the remainder comes from coal (7%). The company is also a producer of fuel for the electric power industry in the forms of fuel oil and gas. The rest (8%) consists of renewable energy sources and nuclear energy. At the same time, the company is one of the largest consumers of electricity in the country and as the analysis showed, PEMEX is the largest debtor in Mexico’s electricity system: the volume of debt by 2022 amounted to 83.19% of the electricity bills not paid to the federal government. Thus, this research concludes that the management of the company’s economic development needs to improve based on modern scientific approaches. In addition, it is necessary to ensure the sustainable functioning and development of the industry and the country’s economy as a whole.

2. Literature Review

2.1. The Effect of Green Finance on the Energy Transition of Oil Companies

International oil and gas companies use a range of strategies to invest in renewable energy technologies and projects [10]. Oil companies have become major players in the renewable energy market, providing their scale and business expertise for the deployment of clean energy. But so far, they have had mixed success [11,12]. The author Jarboui examines operational and environmental indicators for 45 U.S. oil and gas companies between 2000 and 2018 [13]. The results show that in recent years, U.S. oil and gas companies have begun to move toward lowering CO2 emissions [13].
It is important to find an answer to the question of whether “green” innovations harm the financial performance of oil and gas companies. Research by Aastvedt et al. shows that practical results vary. In theory, companies’ boards of directors decide on the level of their green investments to improve their environmental performance while maintaining the desired financial performance, but it is not linear. In the U.S.A., at low values of the environmental component, a positive effect on green investment can be observed, but an inverse effect happened in European companies [14].
On the critical side, Cherepovitsyn et al. highlight the inconsistency in the methods used to assess the value of oil companies’ strategies to diversify their businesses. These are due to the lack of a unified methodological approach to evaluate the impact on the efficiency and competitive capacity of companies. Global crises in the international energy market and a reduction in the importance of oil and gas resources in the energy balance are the reasons that stimulate companies to diversify their asset portfolios [15].
Green finance seeks to introduce environmental management principles to the financial sector. Xiong and Dai examine this phenomenon in the Chinese financial market from 1990 to 2020. There is a negative impact on environmental pollution in China and a positive impact on the adoption of technological innovation and renewable energy sources. [16]. Dutta et al. ask whether green investments have a relationship with fluctuations in oil prices, they observe a positive but statistically insignificant effect [17]. The work of Yaya et al. examines how five green investments respond to changes in the oil market [18].
When improving approaches for managing development in this area, it is important to consider that investment projects on the subsoil are characterized by a long cycle, high level of complexity, and capital intensity, which limit adaptation projects, for example, the transition to cleaner generation [19]. At the same time, it should be noted that currently, an integrated approach for assessing the effectiveness of investment is not sufficiently developed. Methodological developments are aimed at calculating the integral effect of projects, including economic, environmental, technological, and innovative components.
An analysis of the work of authors like Zhong et al. (2018) [11], Pickl et al. (2019) [10], and Griffiths et al. (2022) [12] shows that currently, there are problems in the forms of limited incentives for capital investment in decarbonization technologies, competition for financing projects, a lack of highly qualified personnel and institutional experience to implement effective programs, as well as a lack of incentives among decisionmakers to introduce new technologies. Some call the oil-refining industry a “dying” industry owing to the incompatibility of its products with global climate change goals. This view, however, does not adequately recognize the current and continuing importance of the entire sociotechnical system of the industry and the sociotechnical systems with which it is connected [12].
Taking into account the environmental factor of oil-producing companies’ activities, the literature considers, first of all, market, rent, and cost approaches. The natural-resource rent could be calculated based on the price of the land factor, the policies to protect the environment in the extractive industries, labor costs, the use of special equipment, and accelerated depreciation [20]. However, the costs of climate change are not always included in companies’ calculations.
On the positive aspect of energy transitions, Nunes et al. study the impact of oil prices on patent applications for alternative energy sources. When prices fall, as they did after 2014, the decline in innovation is more pronounced, while when the spread of innovation slows down, prices rise. The authors conclude that there is a certain lack of commitment for finding sustainable alternatives to fossil fuel use [21].
To increase public investment in projects related to the development of renewable energy sources, technological innovation and trade globalization are important for increasing the share of the renewable energy supply and reducing carbon dioxide emissions in the long term [22], but international oil companies have yet to integrate renewable energy sources into their core business [23].
In recent years, the pandemic and global politics have impacted the implementation of the low-carbon energy transition. Ye and Chaiyapa explore the role of national oil companies, arguing for state-centered management, which has greater potential [24]. Bricout et al. analyzed the diminishing influence of the corporate decisions of European international oil companies on the market [25]. A similar argument could be made for the coal industry; renewable energy in coal-mining companies is unattractive to private investors and requires additional government support [26]. Foreign economic risks should be considered to estimate the competitiveness of the enterprise [27].
There are differences in how the industry approaches climate change issues, depending on geography and socio-political context of each company [28]. There is a long-term correlation among green investments, geopolitical risk, financial uncertainty, oil price volatility, and green bond investments around the world [29].
Another approach for assessing the sustainability factors of oil production projects is to examine the principles of public–private partnerships. Of particular importance for studying the management of environmental effects is the introduction of indicators of the returns for stakeholders, that is, companies participating in the project, also considering the point of view of the community [30]. Legislation on the rational exploitation of limited resources with many users may also apply for the oil industry [31]. One of PEMEX’s main challenges is the maturity of its existing wells; the company must capitalize on these dwindling resources.
A negative aspect of this transition is that according to Halttunen’s research, because current strategies depend on existing capabilities, the current pace of change remains slow [32]. The development of a new-energy vehicle industry to reduce global energy shortages and pollution is having a slow impact on the relationship between oil prices and innovation [33]. In the light of the challenges presented in the literature, this article proposes an integral methodological approach, which is currently required to calculate the environmental factor within the framework of the economic development strategy of the state and individual oil companies.

2.2. Transition Strategies of National Oil Companies (NOCs)

Litvinenko et al. develop the idea of mineral resources as natural capital. As the basis of the sustainable development of a country, mineral resources depend on professional public management instruments. Countries have started moving toward a more active participation of the State in the management of these resources, changing the trend of the last 30 years regarding the pre-eminence of the market as the regulatory mechanism for the sector [34].
A number of authors have analyzed the existing strategies of oil companies. Thus, Magnus Abraham-Dukuma analyzed the transition to clean generation during the transformation of the national Danish oil and gas company [35]. The concept considers three types of “green” transitions that can occur in oil companies: socio-technical transitions, institutional transitions, and transitions in the field of business models. Socio-technical transitions represent the adoption of changes in the methodological, scientific, and cultural goals of activities, such as hydrocarbon extraction. Although institutional transitions occur as a result of changes driven by environmental laws and regulations, business model changes are based on efficiency and shareholder demands. The transitions of business models involve changes in the decarbonization of electricity production and operation, the value chain, the deployment of offshore wind power, onshore renewables, greener power plants, and green finance. These emerge as companies rethink how they measure the success of their operations and goals for the future [35].
However, it is possible to state the critique that the demand for the oil and gas industry could be significantly reduced in the foreseeable future by pressing companies to introduce new technologies [36]. Our research explores the possible ways in which an oil and gas company can become a sustainable development corporation and remain relevant in the future. The hydrogen economy, offshore wind energy, deep sea mining, biorefinery, seawater conditioning, geothermal energy, and geoengineering, may be economically feasible alternatives in which the oil and gas industry could invest [37].
Norway is an example of the introduction of technologies for the transition to green energy. Researchers Mäkitie et al. propose a theoretical framework and indicators for technological innovation systems to study how established industries influence technological industries, using the relationship between the oil and gas sector and offshore wind in Norway as an example. The oil and gas sector has a positive impact on the offshore wind industry through technological duplication and company diversification. There are conflicting priorities and low interest in oil and gas companies in the new industry [38].
A critical stance of this transformation can be observed in the Chinese market, where market trends have a stronger effect over energy transitions. Bei and Wang examine the relationship between renewable energy investments and green finance using data from Chinese companies from 2000 to 2020. Investments in renewable energy and green finance show unsustainable behaviors with GDP and green infrastructure projects. However, green infrastructure projects showed no connection with investments in renewable energy sources [39]. Because China is the largest importer of oil, Chinese green innovation reveals causal relationships among the oil price, green innovation, and institutional change [40].
Onshore generation is one of the few technically mature concepts with a very high emission reduction potential. Several alternative developed concepts that could also achieve significant emission reductions include fuel switching, CO2 capture and storage, and the use of renewable energy sources combined with energy storage. Combined cycle gas turbines and offshore wind farms together with gas turbines are technically mature technologies and can provide some emission reductions [41]. Also, the transformation of companies’ business models occurred in the gas sector earlier than in the oil sector. For some companies, the cost for producing gas relative to oil is driven by their environmental goals [42].

2.3. The Transition Strategy to Cleaner Energies in Mexico

National oil companies, such as PEMEX, face challenges in implementing these global adaptation trends [43]. The International Energy Agency highlights the commitments of several countries to these reforms, but national companies face structural investment challenges associated with the way they invest [2]. These structural problems relate to the dilemma between the economic and political goals of these companies [44]. Therefore, the energy transition has started slowly at national oil companies [45].
One issue affecting PEMEX is how oil revenues return to the government [46]. Studying the relationship between oil and institutions, de Soysa et al. find that higher per capita oil production leads to weaker economic institutions in the form of lower levels of protection of private property rights; oil interest groups use their economic power to achieve weaker property rights to maintain their economic and political positions in society [47]. Pazouki and Zhu examine the impact of volatility. The quality of political institutions is linked to oil price volatility; this is reflected in increased government spending. Thus, improved strategic risk planning combined with greater government transparency can lead to improved institutional quality [48].
On a negative aspect of energy transitions, the low investment situation that PEMEX is currently facing contrasts with the company’s trajectory in previous decades. Researchers Silva Gutiérrez et al. identified the determinants of the performance of state-owned oil companies, using the company’s role as an instrument of national fiscal policy [49]. New production prospects in Mexico force companies to explore deep deposits; automated process control systems can be implemented to estimate the effects of production [50].
Wei and Umut examine the impacts of renewable energy, financial development, and technological innovation on the ecological footprint in Brazil from 1990 to 2018. Although it is clear that economic progress degrades the ecosystem, the authors do not find a significant relationship between the financial development and ecological footprint [51]. Ciotta et al. study the case of Brazil and its role in reducing emissions. The CO2 level can be measured using the example of depleted oil and gas fields, where technical data are already available [52,53].
Mohammed et al. study the impacts of the oil revenue ownership structure on financial markets and institutions. State ownership of oil revenues works against the effectiveness of financial institutions when the quality of political institutions is low but increases their efficiency when political institutions are strong [54].
Another facet of the problem is that these are goals in financial markets. Using data from China’s publicly traded mining companies, Wu et al. examine the ESG for green innovation. The effect of these goals is that they can encourage companies to engage in green innovation activities by easing financial constraints, increasing internal incentives, and applying external pressure [55]. Also, the social legitimacy of eco-innovation is enhanced by high levels of environmental governance [56].
The extraction of natural gas for electricity generation in Mexico is the most significant change in this sector. But at the same time, the influence of the activity of heavy hydrocarbons on electricity is the most important factor in the growth of the greenhouse effect. In Mexico, natural gas is displacing renewable energy [57].

2.4. Systems and Potentials

However, these approaches lack an integrated approach to consider the environmental component within the framework of the general concept of territorial socio-economic development. Considering the complexity and cost of the influence of the environmental factor, this area is strategically important. It has been proposed that the environmental and economic development of the oil and gas sector should be integrated into a territorial strategy based on the concept of sub-potentials and the formation of a comprehensive system of indicators characterizing the country’s development strategy.
We use Bossel’s concept of sustainability to establish indicators for a methodology for the development of the territory [58]. Bossel analyzes the frontiers of sustainable development based on physical, human, and temporal limitations. From these frontiers, it is possible to define a methodology for the development of a system that leads to sustainable development [59]. This paper presents systems and development systems along with the potentials and sub-potentials of each system, presented in Table 1.
To measure this potential, Bossel proposes the following three methodological steps. This article will focus on identifying representative indicators (point 3) and quantifying basic benchmarks as follows:
  • Conceptual understanding of the total system;
  • Identification of representative indicators;
  • Quantification of the counselor’s basic satisfaction;
  • Participatory process.
A literature review on this concept by Ruggerio examines recent developments in the concept of sustainability developed by Bossel [59]. The literature provides conflicting definitions of sustainability and sustainable development; it is not until after the 1990s that there is a consolidation of a methodology to measure this concept. Sustainability measurements have evolved to study limited territories. This methodology must take into account the society–nature interrelationships within a territory. When it refers to territorial scales, the methodology delimits processes, as in the case of this article, the processes for managing the oil and gas sector. The potential of the territory is a concept used to study the case of protected natural areas in Mexico [60] and for the study of renewable energies in Brazil [61].

3. Materials and Methods

3.1. Characteristics of the Research Methods

This section delves into the methodology to study emissions from oil extractive activities based on the concept of sub-potentials. The concept of sub-potentials considers the development of the oil and gas sector not on its own but in close integration with the tasks of the socio-economic development of the country as a whole. This will significantly improve the operating effectiveness of oil and gas enterprises, which make a significant contribution to the country’s budget. This is the main point for using the concept of sub-potentials because the potentials of individual companies influence each other, increasing or decreasing the capabilities of other enterprises.
To ensure socio-economic and organizational uniformity concerning the processes of the activity and the development of Mexico and its oil-producing companies, this study proposes the use of the concept of sub-potentials based on indicators of sustainable development.
This section describes a more rational course of action and a system of measurements for the practical implementation of public programs. At the stage of practical implementation, it is necessary to monitor and evaluate the real effectiveness.
Using the concept chart in Figure 1, the circuits from AB, from AC, and from AD represent feedback circuits that relate the implementation to the foundational stages of the model in an iterative process, but we have to assess the concrete effectiveness of the strategy within the environmental sub-potential. Subsequently, the oil industry’s strategy is integrated into the overall strategy for the environmental and economic development of Mexico on the basis of a comprehensive system of indicators, using the iterative communication chain AC within the framework of the presented methodology. If necessary, adjustments are made along the AD and AB chains.
We develop the proposed conceptual approach in four stages from top to bottom, as presented in Figure 1. The first stage (I) consists of a study of the potential for the exploitation and development of the territory from the point of view of the capabilities of large oil companies. The potential of a territory can be represented as a system of sub-potentials for functioning and development, which, in turn, include four sub-potentials: replication, protection, management, and reserve. The emissions into the environment and pollution of a territory should be considered as sub-potentials of threat and deterrence, which must be neutralized for the territorial system to function and develop under normal conditions. It is necessary to regard that in some situations, sub-potentials can transform, influence each other’s changes, and manifest negative synergies. At the first stage, it is necessary to determine the line of transition from the sub-potential for functioning and development to the sub-potential for the threat and containment. To do this, a specific indicator will be proposed, and its significance for Mexico will be assessed.
The second stage (II) considers the development of a strategy for the development of the oil and gas sector. At this stage, it is necessary to analyze the overall strategy of the environmental and economic development of Mexico to integrate this strategy and improve its performance. The third stage (III) involves the development of specific programs. At the third stage, the choice of the strategy for the development of the oil industry in Mexico is made. Simultaneously, the socio-economic implications of potential alternatives are evaluated; the effectiveness of the most rational option is evaluated, and an environmental factor is considered when selecting the optimal alternative. During the implementation stage (IV), the monitoring and assessment should estimate the actual effectiveness of the implemented program activities. At the fourth stage, it is necessary to select projects to implement the chosen strategy. This requires an integrated approach for assessing their effectiveness, taking into account environmental and other components.
In this part of the methodology, we examine the institutional and economic conditions of the transition to cleaner fuels for the oil and gas industry in Mexico, considering the results of an assessment of its capabilities. To achieve this goal, we used an analytical approach to measure the influence of the actors that influence the transition strategy to cleaner fuels [62]. We chose a multi-criteria decision-making algorithm based on an analytic hierarchy process [63]. We studied socio-economic indicators and industry concerns that shape strategic planning for a technological transition that lessens environmental impacts, as presented in Figure 2.
The following section outlines the algorithm we utilize to select a strategy for the Mexican environmental oil industry: We begin by evaluating the policy factors of the Mexican oil industry via paired comparisons in a matrix form. We then contrast the entities involved in formulating a transition strategy in Mexico. Third, we measure their economic and environmental goals. Finally, we evaluate the influence of the actors to achieve these goals. Figure 3 illustrates the algorithm.
This comparison is calculated based on a group of paired comparison matrices, expressing the set’s influence on the unit element of the adjacent level [64]. Then, the result is to be normalized to one, thus obtaining a priority vector. The factors are compared pairwise, assessing their impact on the functioning and development of the region. After determining their relevance, the consistency of the local criteria should be assessed. The consistency index provides information about the degree of change in the numerical and ordinal consistencies. If the deviation exceeds the established limits, the calculations in the matrix should be verified.
C I = ( λ m a x n ) / ( n 1 )
A pivotal role in the interaction between sub-potentials, which can transition to the sub-potentials of the threat and deterrence when exposed to adverse factors, belongs to the environmental component. Under the conditions of the 21st century, taking into account and reducing the negative impacts of enterprises on the environment has become fundamentally important both for oil and gas enterprises and for the economy and social sphere in general. This practical tool that integrates the activities of the oil and gas sector into the socio-economic development of the country is a comprehensive system of indicators.
The development of a system of indicators for sustainable environmental and economic development is an important methodological issue in the formation of an economic mechanism for the activities of oil and gas enterprises and, in general, a mechanism for territorial development.
To estimate the system of indicators, this study presents a matrix tool for studying this sub-potential. The development of effectiveness criteria, which should be presented within the framework of an integrated approach reflecting the main performance indicators, can be supplemented by the strategic guidelines of the system; this is represented by a three-dimensional assessment of the criteria for the innovation subsystem of the region, which is illustrated in Figure 4 and Table 2.
A comprehensive system of indicators should be aimed at ensuring sustainable environmental and economic development. This requires the achievement of a certain quality of the territorial system, which is determined by the following guidelines: existence, effectiveness, freedom of action, security, adaptability, and coexistence.
The monitoring of the achievement of the sustainable development goals, management of this process, and assessment of the effectiveness of the means that are used and the level of achievement of the set goals require the development of appropriate indicators for sustainable operation and development. The development of such a system of indicators is essential for diagnosing the state of the territorial system and paving the way for correcting it within the formation and implementation of the strategy for the environmental and economic development of the oil and gas sector.
The following scientific approaches were used in the study:
(1) a systemic approach, which considers an object as a system of interconnected subsystems, with each decomposed into manageable parts. The challenges of accounting for environmental factors include levels within oil companies, industries, and national economies. Development strategies for oil companies must fit within the industry’s strategy and the overall socio-economic development of the country. The oil industry, which forms a third of the federal budget in Mexico, is not an end in itself but a means for improving the quality of life of the country’s population and solving society’s problems. This will allow this research to solve environmental problems as efficiently as possible;
(2) an integrated approach that involves the consideration of all the necessary components. To ensure the sustainable functioning and development of the oil industry, taking into account the environmental factor, it is necessary to identify management guidelines that will consider the necessary components to ensure such a state of the system;
(3) the concept of sub-potentials, which make it possible to integrate the environmental factor into the development potential of the industry and territory, to prevent the formation of conditions that contribute to the activation of the sub-potentials of the threat and deterrence and a decrease in the number of development opportunities of the industry and the country’s economy as a whole;
(4) an assessment of the level of sustainability of the development of enterprises, industries, and the country’s economy involves using an approach based on management guidelines, which has a graphical interpretation in the form of a “benchmark star”.

3.2. Pollutants Generated by PEMEX’s Operations

Table 3 describes the pollutants from the company PEMEX, which occupies 90% of the Mexican oil market. Carbon emissions increased over the period 2016–2022 by more than 8%, and sulfur oxide emissions increased by more than 6%. The company’s electricity consumption fell by less than 1% over this period. Finally, the number of hectares affected by environmental problems associated with the company’s activities increased by more than 3%.

3.3. Resources for the Energy Transition Strategy

Using data for expenditures from the federal budget of Mexico, the allocations that PEMEX received to finance its industrial transformation and that seem to be in line with the strategy are examined. In this budget, PEMEX allocations have data from the pre-2014 reform, as stated in the Introduction of this article. The post-reform budget item has existed since 2016.
To compare these expenses, the federal budgets for 2010–2022 (approved in December of the previous years) were considered. These values were deflated using 2022 as the base year and converted to U.S. dollars. Table 4 provides the descriptive statistics for these resources.
The amount of resources for the strategy has declined since 2017, after the reform of the strategy. On the other hand, low fuel prices, especially during the pandemic, limited federal and corporate resources for new investments. They started to recover in the approved budget for 2022.
In percentage terms, the relevance of the resources for the technological transformation to clean energy is decreasing. However, it is interesting to note that the amount of resources allocated for 2022 increased as a percentage of the expenditure allocated to the strategy; this may be due to the large flow of resources received as a result of rising oil prices following the pandemic.
We acknowledge that the data considerably vary over time, especially the budget variable, where the allocation of the strategy resources increased more during the starting period. This causes a distribution with outliers in the first year.
The production variable has been declining since 2010, which is consistent with what the literature indicates about PEMEX’s challenges in producing more oil from mature fields and exploring less-productive fields. The relevance of the energy transition is that despite the weakening of PEMEX, the company pollutes more through emissions.
For the other dimensions, Table 5 shows a set of management benchmarks to ensure the management of operational and developmental sub-potentials on the basis of effective strategic planning.
In regard to the technological implementation of projects at PEMEX, we see an increase in investments and rigs, with a positive annual growth. However, this does not equate to production or government revenues, which have a downward yearly trend. We can infer that there is an ineffective allocation of resources at the company. Also, the large variations in the infrastructure budget show an ineffective spending trend.

4. Results

4.1. Trends between the Variables

In this section, we present the results of the trends between the budget and the pollution and energy-consumption variables. An analysis of the company’s activities establishes that the company increased its emissions but became more energy efficient and stopped increasing the number of polluted areas, reducing it slightly in 2022. The analysis revealed that CO2 and SOx greenhouse gas emissions increased simultaneously. This increase is consistent, and events that change production, such as a pandemic, falling prices, or global changes, do not seem to affect the emission trend. The energy use for hydrocarbon production decreased, but the percentage at which these changes occurred was less than 1%. Simultaneously, the number of polluted hectares reported by the company increased, although at a slower pace than the increasing greenhouse gas emissions.
The trends in Table 6 showed that the use of technology reduces energy consumption; however, this does not mean that all the resources are allocated to reducing the number of polluted areas. Therefore, it is necessary to improve strategic planning at the levels of the company and the state as a whole to consider the environmental factor as much as possible within the framework of a unified economic development strategy. The development of an effective budget strategy helps reduce all types of emissions and reduce the pollution in the territory.
The general and specific resources of the strategy appear to be reducing CO2 and SOx emissions but have a positive trend in relation to the electricity consumption and number of polluted areas. Although it seems that hydrocarbon production is also negatively related to the generation of the two types of gas and electricity production, the number of contaminated areas is increasing.

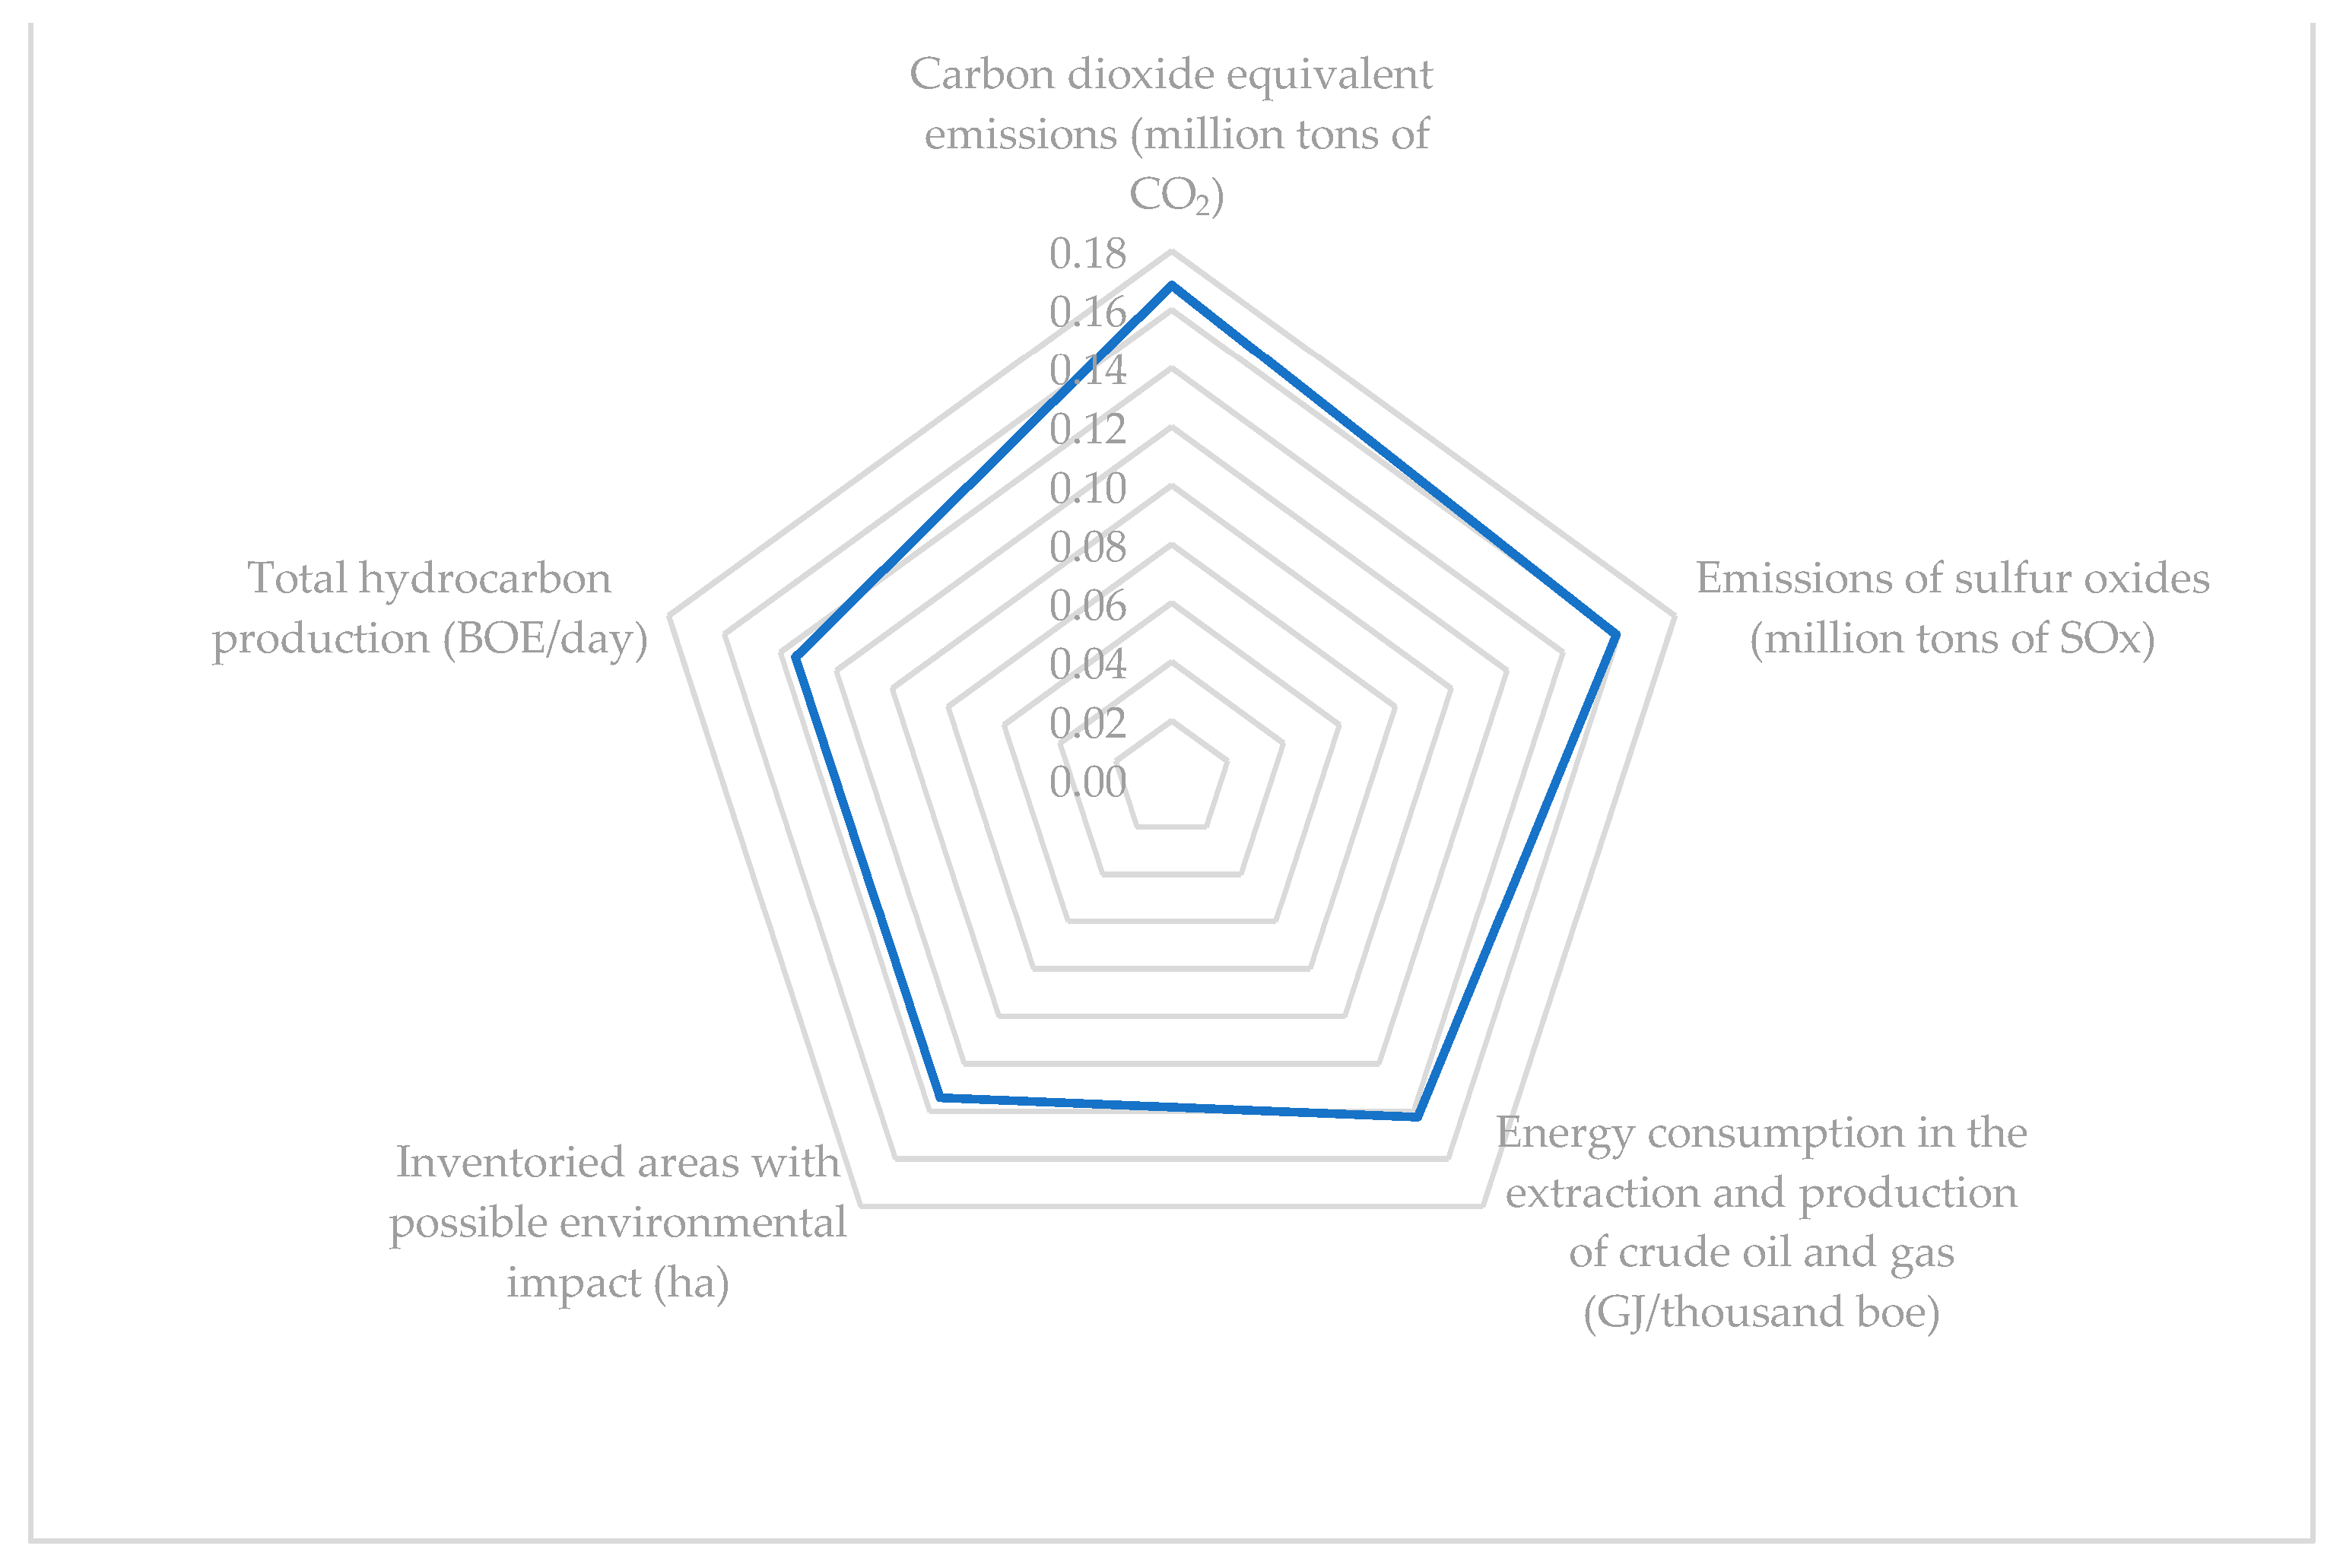
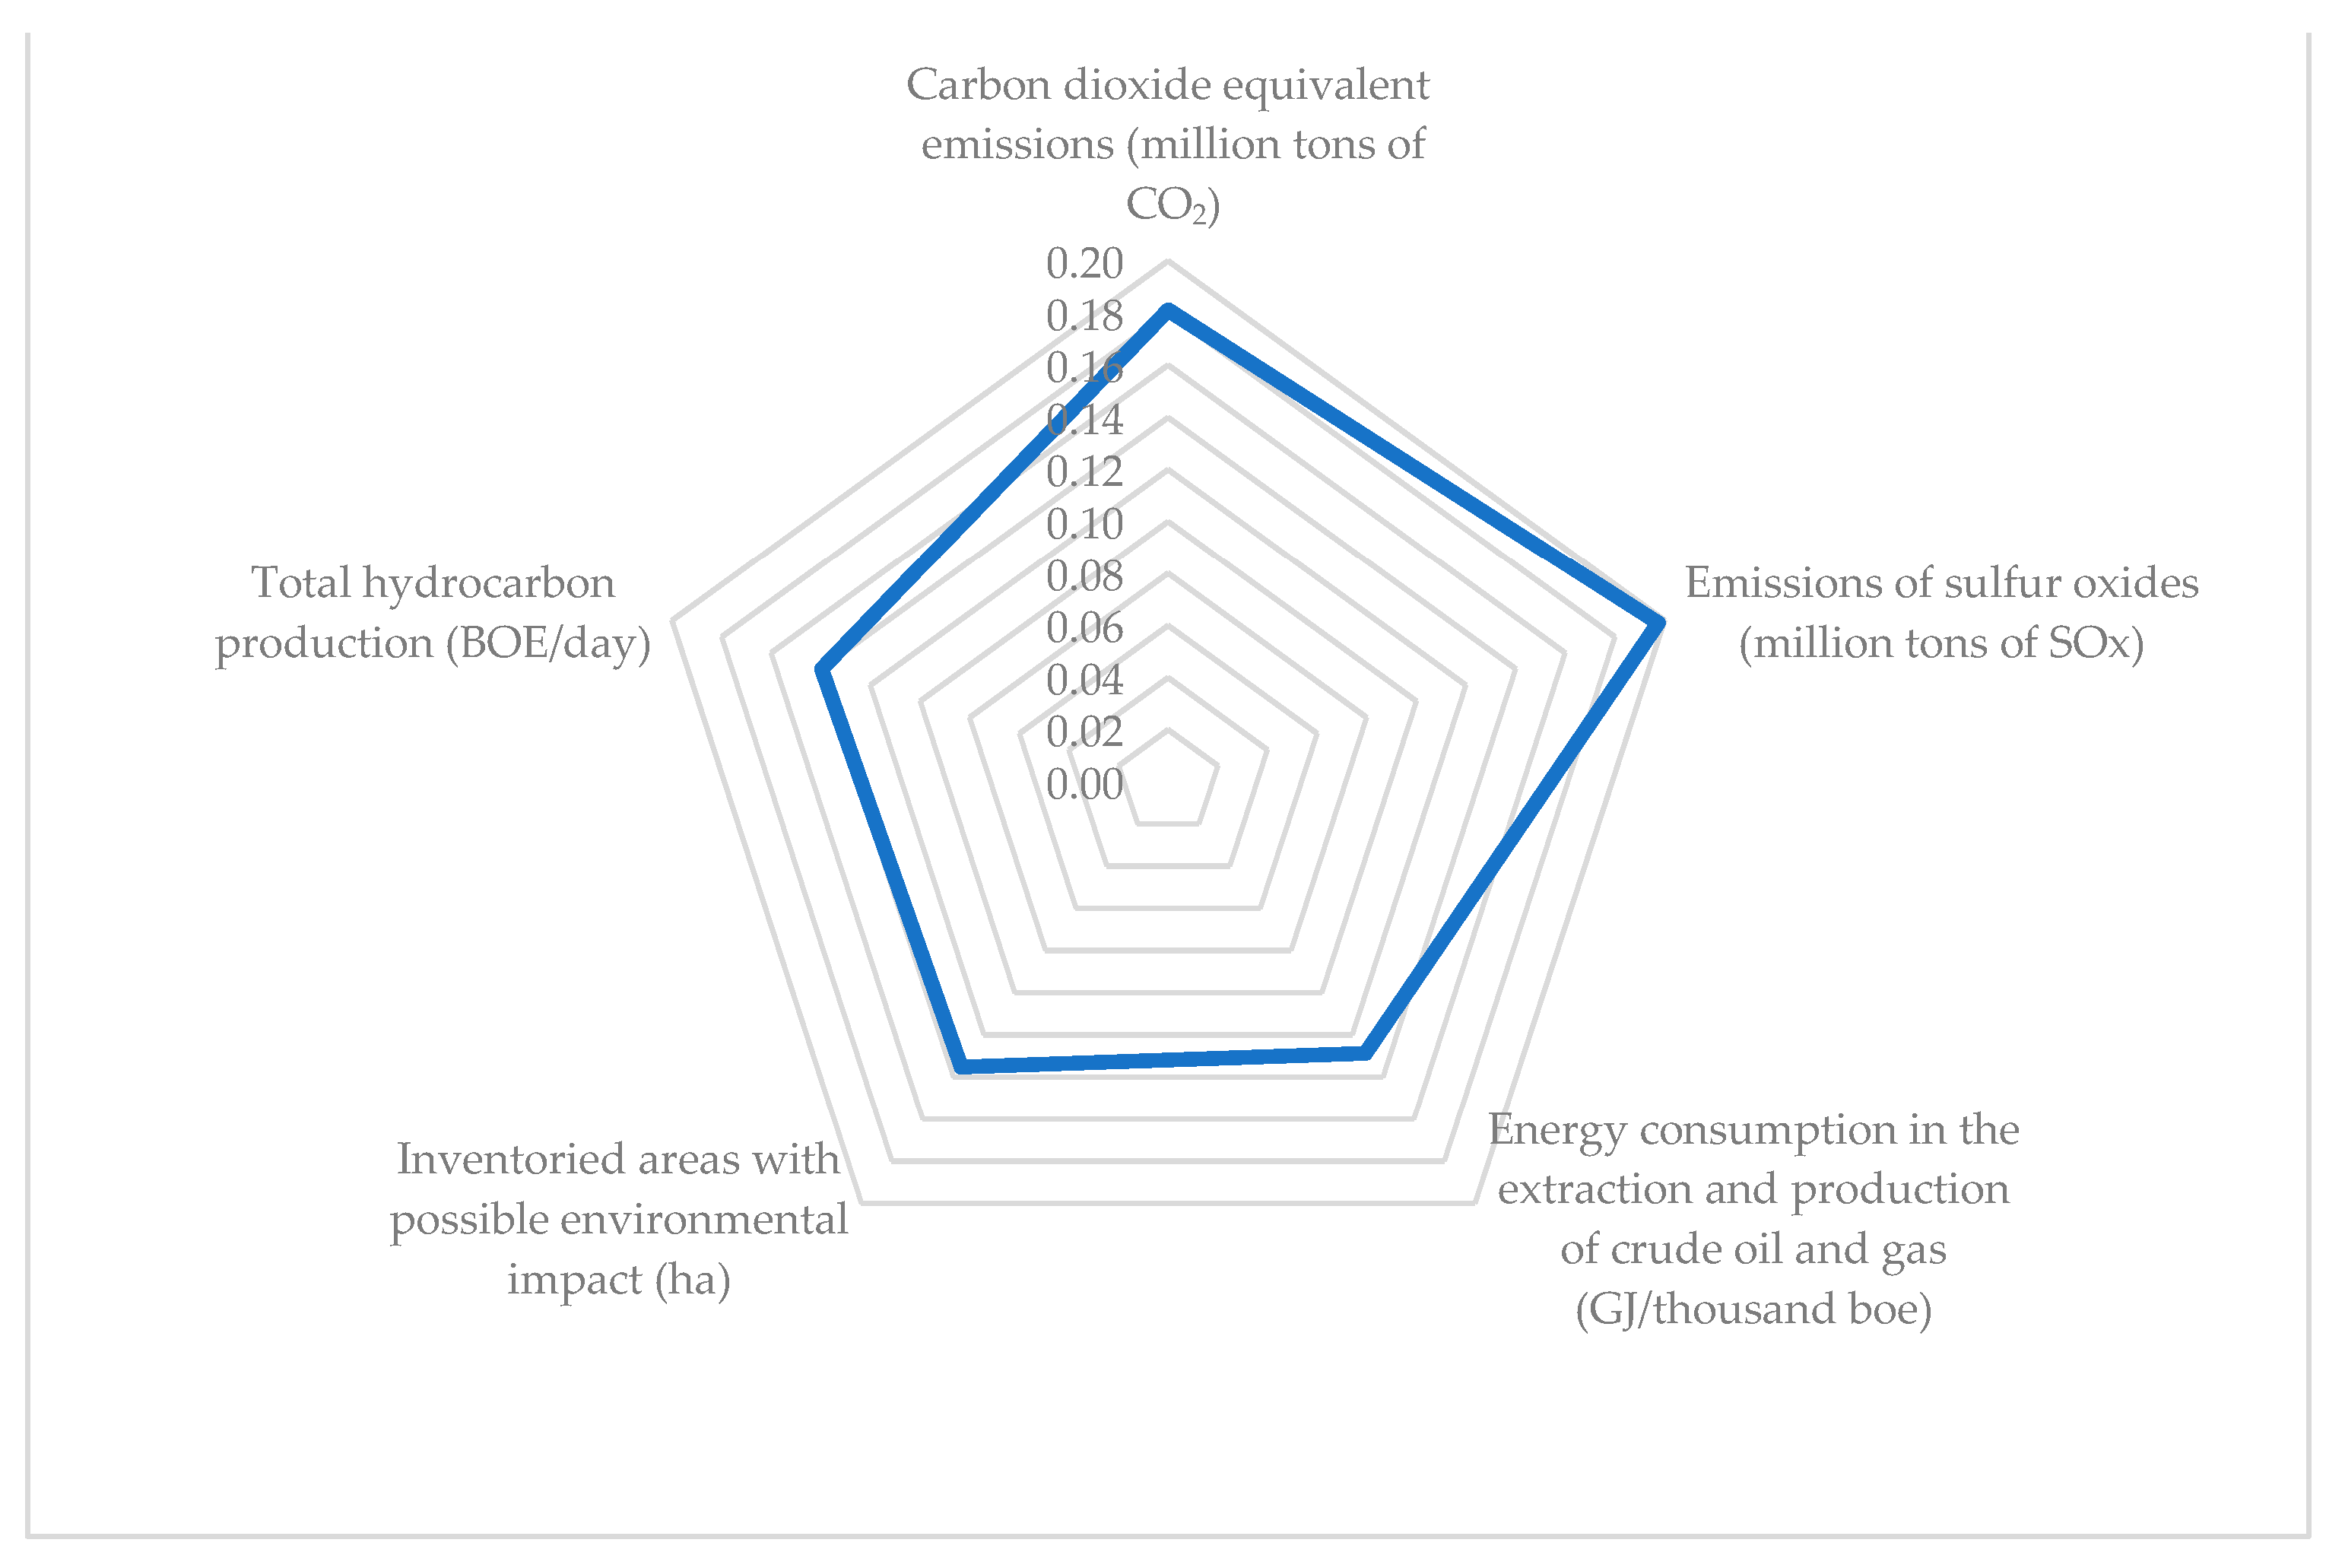
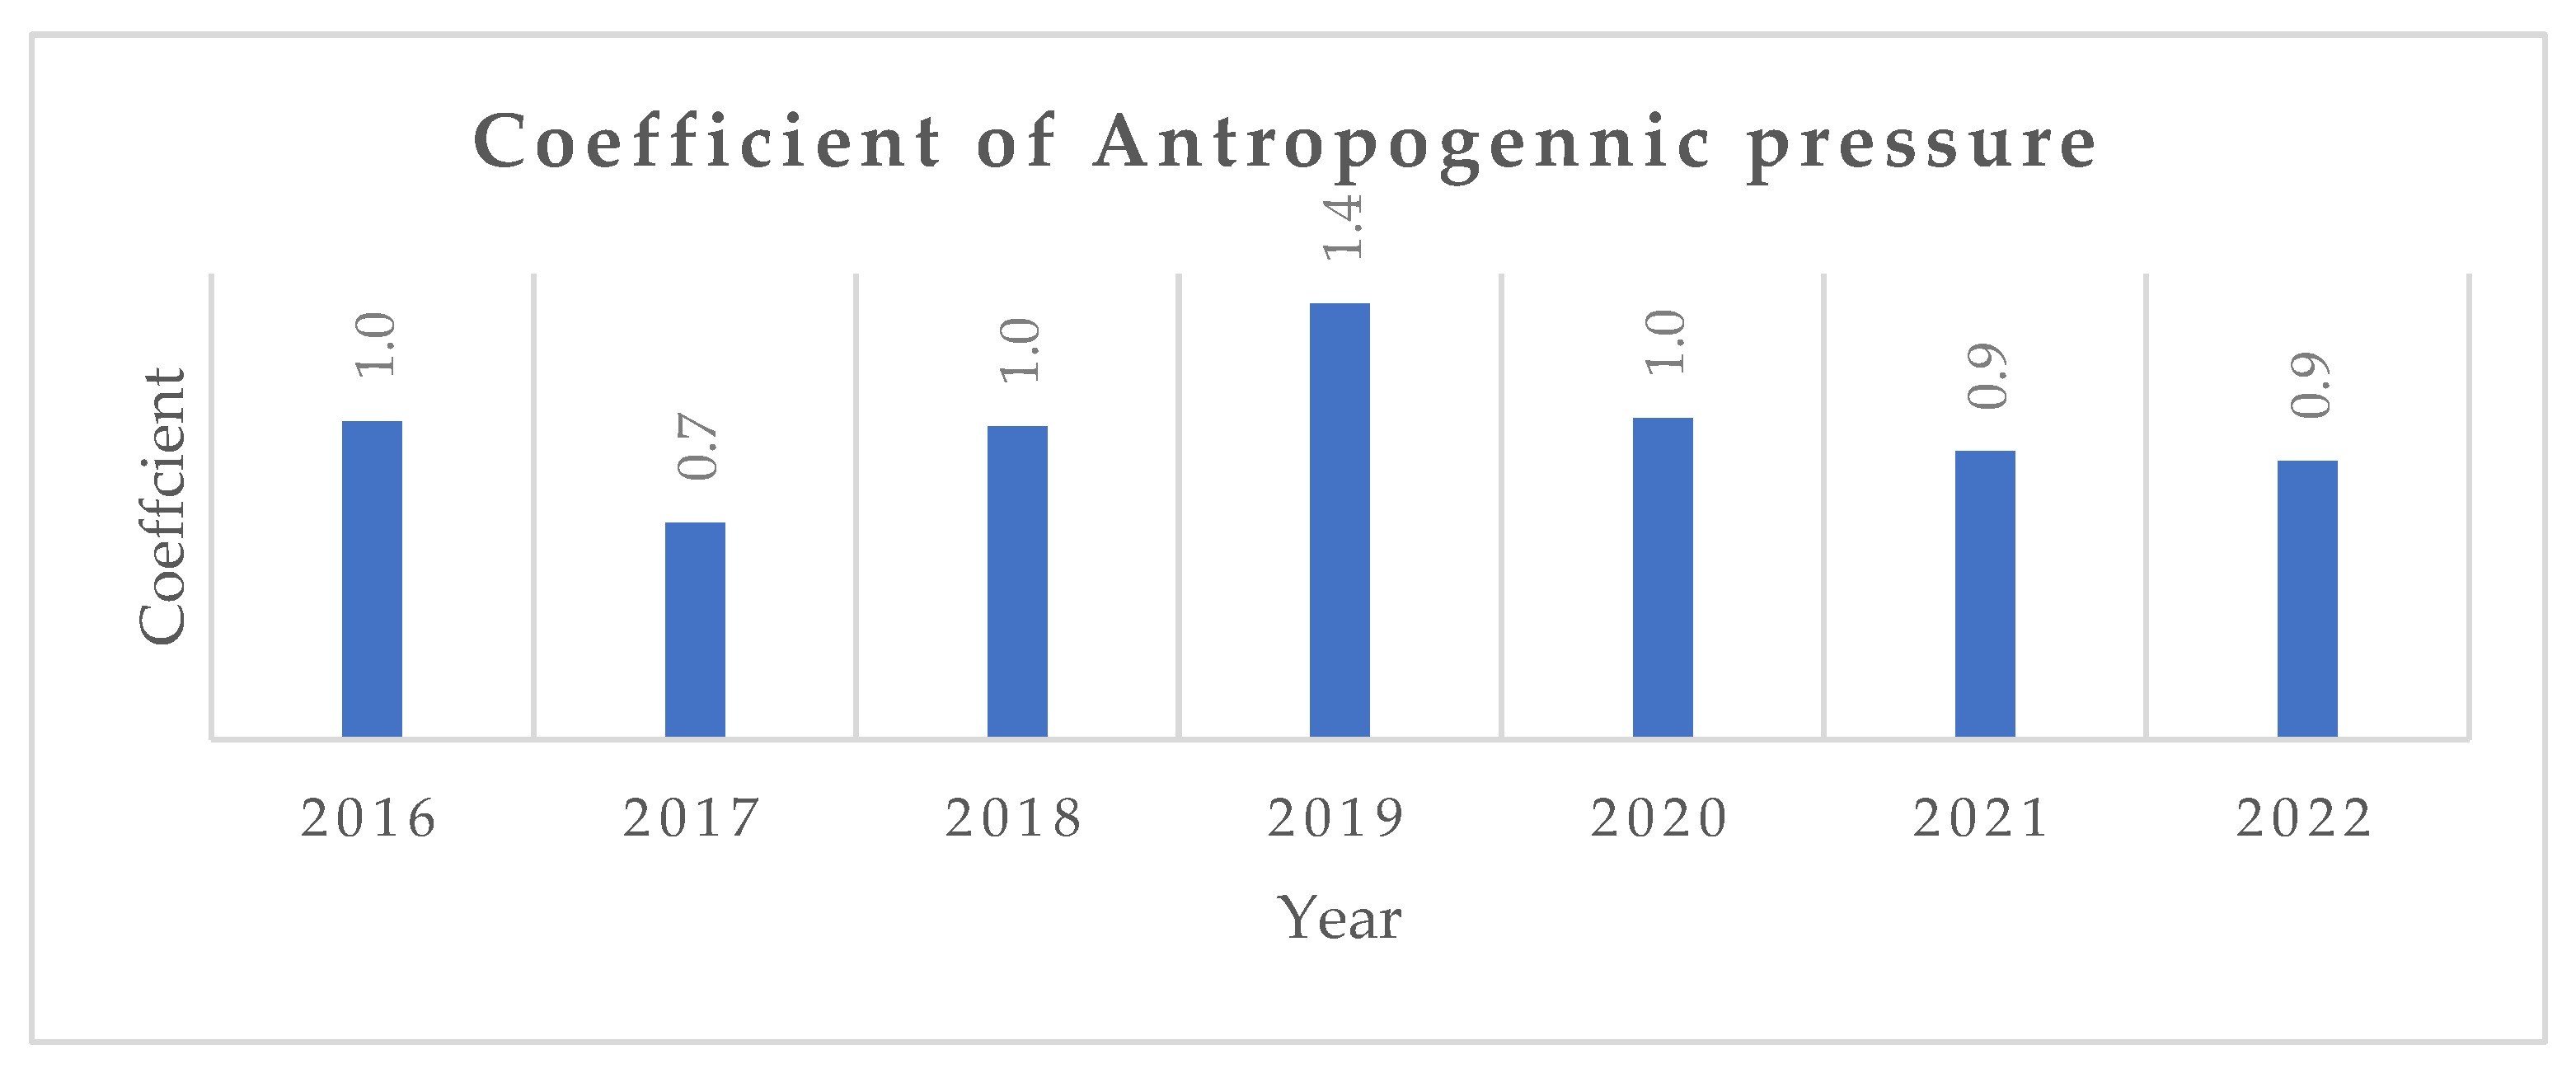
4.2. Indicator of Anthropogenic Pressure for Mexican Oil Production

To assess the environmental sub-potential for the strategy and for Mexico at the country level, we propose to measure the index of the anthropogenic pressure over the territory, linking energy consumption to the areas with possible environmental impact. Anthropogenic pressure indexes are used in the literature to measure the effects of energy consumption on marine ecosystems [68], national parks [69], and areas linked to extractive and industrial activities [70].
This index will allow us to know the effectiveness of the energy use in the territory. We know that there is a negative trend in the way that PEMEX uses energy but to build an indicator, we need to weigh the energy use in the territory in which the company carries out its activities. The coefficient of the anthropogenic pressure is calculated based on the energy consumption per territory according to the following formula:
K j a = E j / S j 1 n j = 1 n E j / S j
where Ej is the energy consumption in region j, S is the area of the region in millions of hectares, and n is the number of years. For the period from 2016 to 2022, we calculate the energy consumption at PEMEX as it is the main objective of the transition strategy; as the territory variable, we use the inventoried areas with possible environmental impact (ha), as measured by PEMEX. Therefore, using the data from Table 3, we obtain a yearly indicator, as shown in Figure 5.
Using this indicator, we normalize a scale of points to create a rating. When evaluating the readiness of a particular country to improve its production factors in the oil and gas sector, we should take the sustainability components into account. In 2019, the anthropogenic pressure coefficient reached a maximum of 1.4. After the pandemic, however, the trend in the growth changed, and the pressure from the energy use decreased.

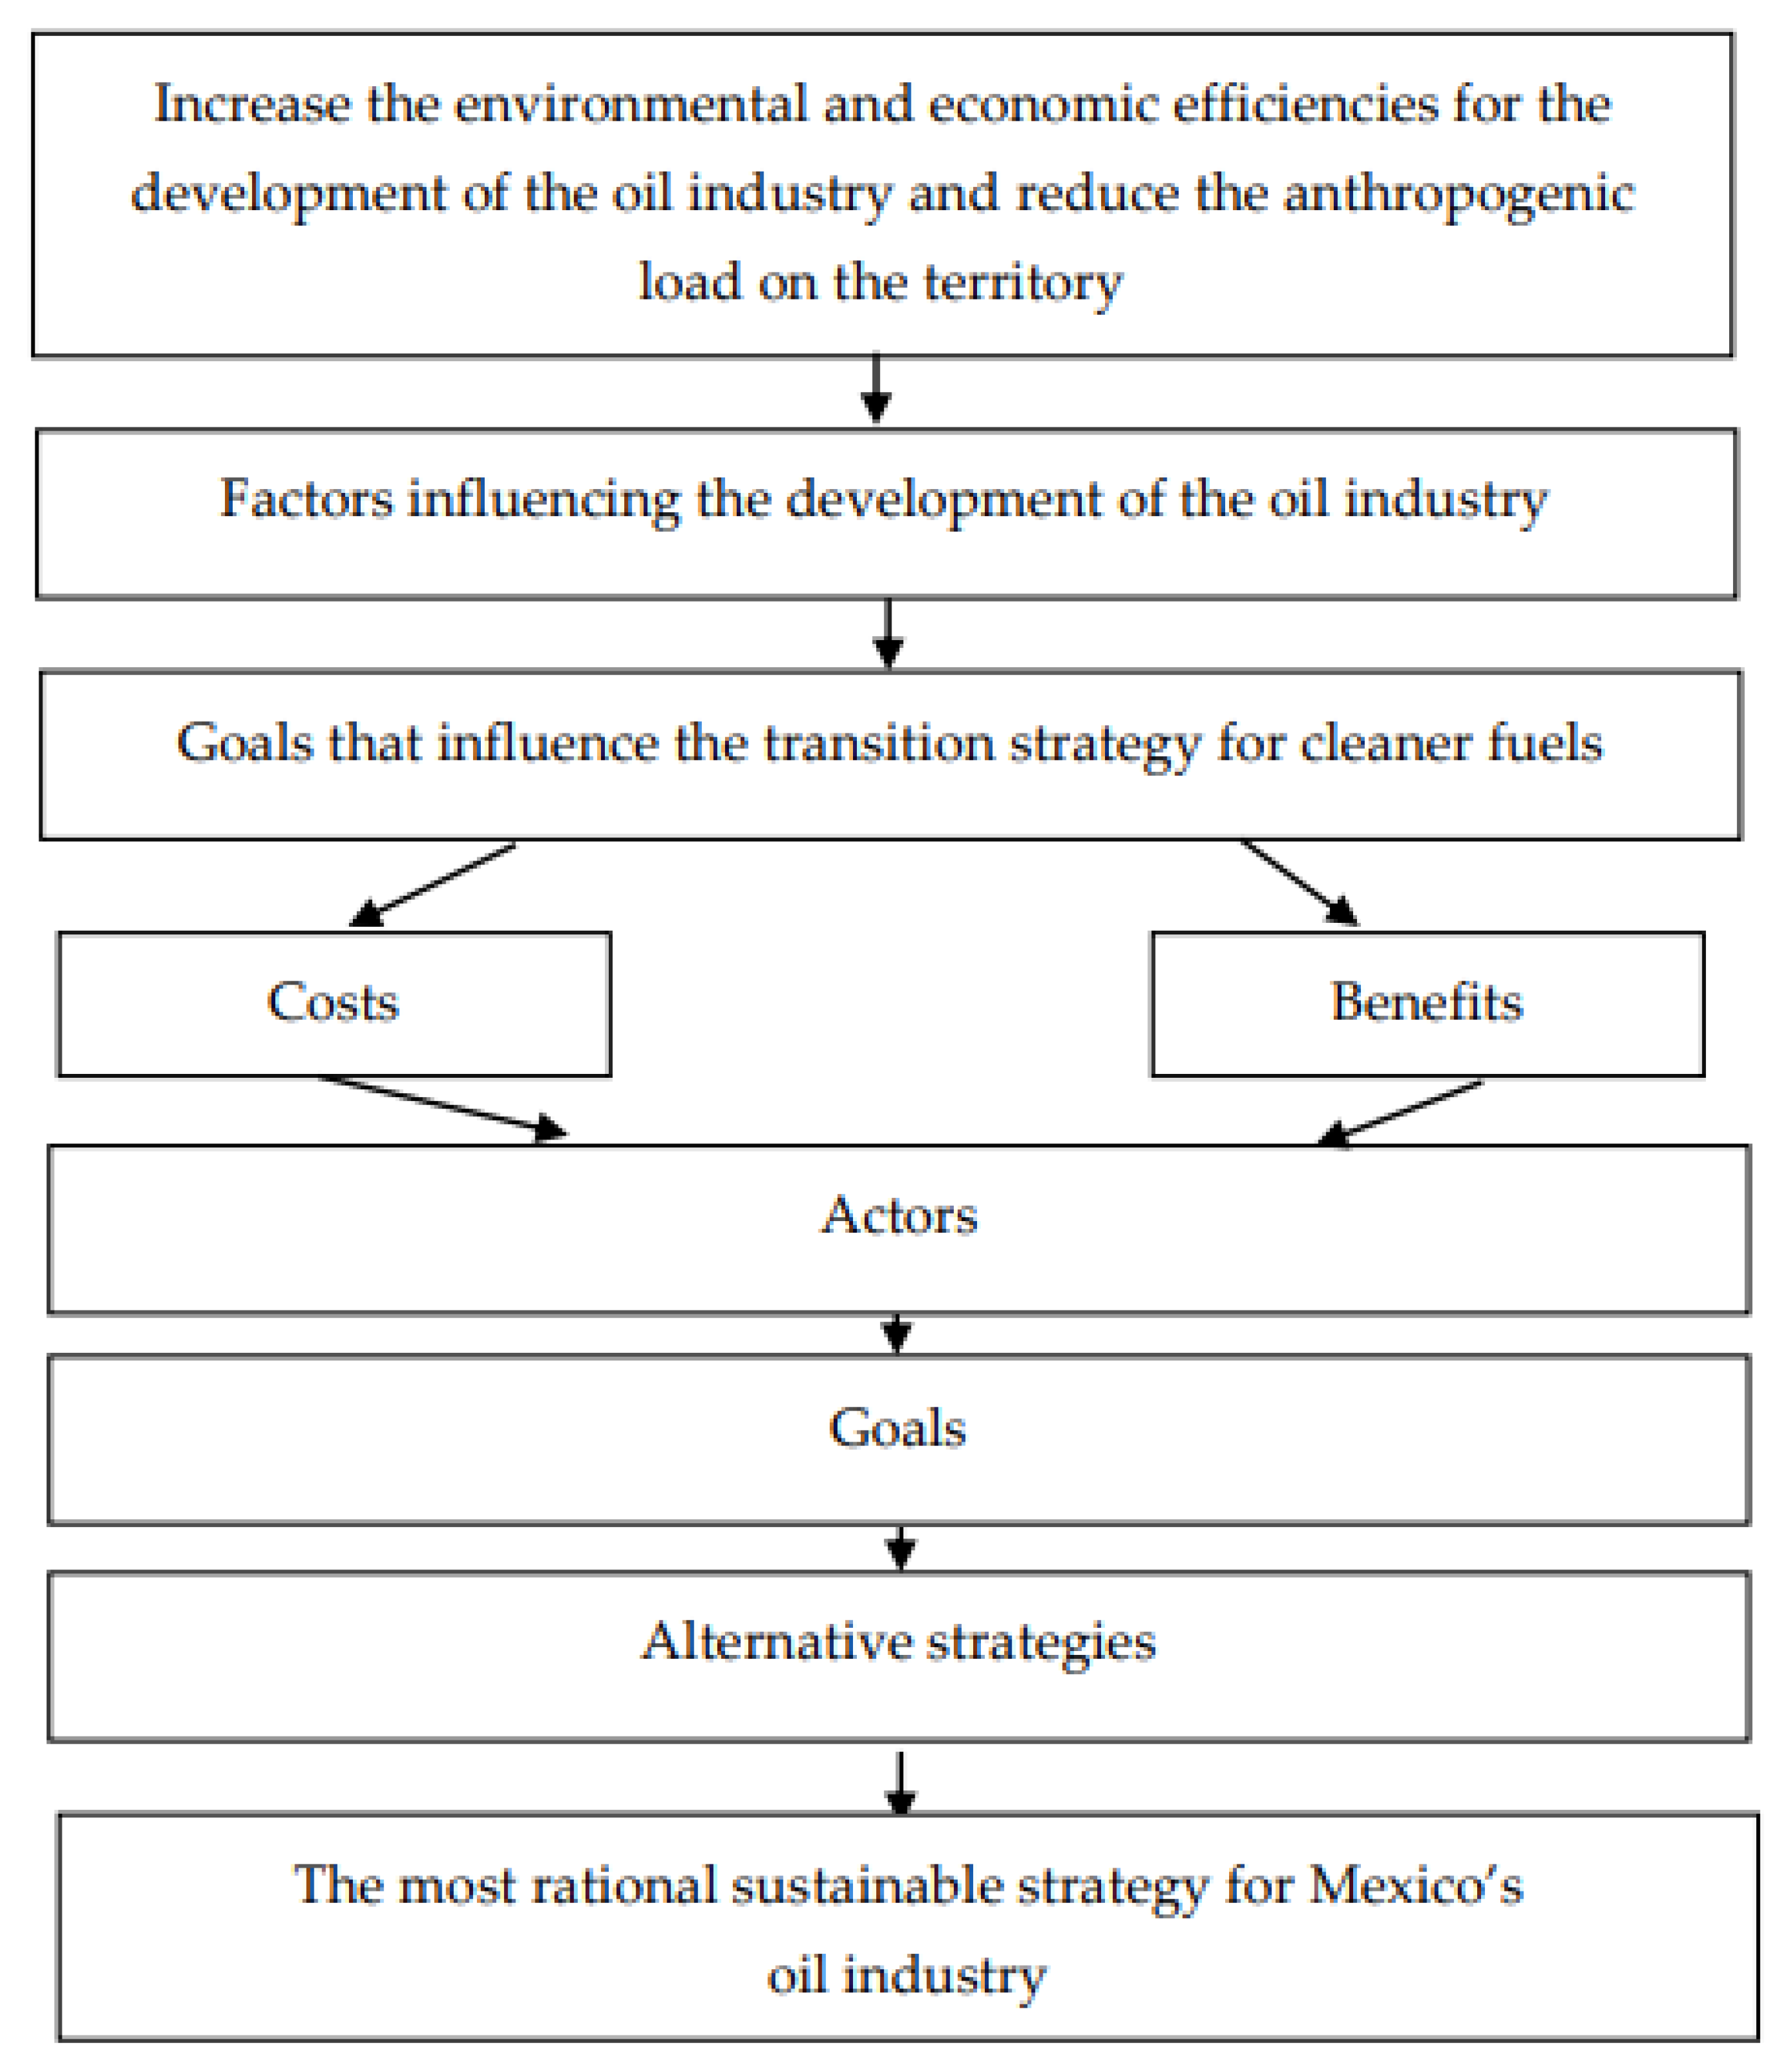
4.3. Selection of a Strategy for the Oil Industry in Mexico

Using the algorithm of the analytic hierarchy process presented in Figure 3, we calculate an actor comparison by factor. This hierarchy analysis method compares factors in pairs; then, their impact on the overall process characteristics is analyzed in relation to the results obtained by other authors. Table 2 presents the results of an assessment of these factors’ impacts on the functioning and development of the Mexican oil and gas industry. Let us consider pairwise comparisons as a matrix. Table 6 presents the results of an assessment of these factors’ impacts on the development of Mexico’s oil and gas industry.
A pair-on-pair comparison was conducted between actors and factors on a 1-to-5 scale. The consistency index (CI) and the consistency ratio (CR) were calculated. The relevance of these indexes consists of the generation of an analytical summary of the results of the preferences of industry actors. The consistency index provides information about the degree of violation of the numerical and ordinal consistencies. Ther lack of consistency could become a limiting factor; therefore, the value of the consistency ratio should not exceed 20%. An “eigen vector” is calculated for each dimension as the mean of the relative value for each factor.
The consistency index is calculated as follows: First, each column of the evaluated preference is summed; then, the sum of the first column is multiplied by the value of the first component of the normalized priority vector. The sum of the second column is multiplied by the second component and so on. Then, the resulting numbers are summed. Thus, one can obtain the value denoted as λmax as follows:
For an inversely symmetric matrix, λmaxn is calculated.
The consistency index can be found using the following formula:
C I = ( λ m a x n ) / ( n 1 )
where n is the number of compared components.
CI = (18.755 − 5)/4 = 3.439
The average consistencies for random matrices of different orders are given in Table 7 as follows:
To make a pairwise comparison of the factors’ influences on functioning and development on a scale from 1 to 5, the corresponding random average consistencies were used to calculate the consistency index, with the corresponding quantity of the compared elements. The summary vector of this comparison is presented in Table 8.
The relative influence of each actor on another is compared in a pair-wise comparison. Each comparison is conducted using a factor agenda, resulting in 5 comparisons. The resulting eigen vectors of the 5 matrixes are presented in Table 9.
After presenting the calculation by actor and factor, we present the calculation to compare the matrix with the goal vector. The resulting matrix will give us a priority vector for each actor. We will use these values after calculating the priority of the goals of each institution.
0.405 0.423 0.364 0.298 0.378 0.285 0.247 0.279 0.339 0.257 0.067 0.071 0.057 0.072 0.074 0.138 0.107 0.116 0.177 0.109 0.105 0.152 0.184 0.113 0.182       0.402 0.423 0.364 0.298 0.378 = 0.393 0.283 0.067 0.123 0.142
Then, we implement the same pair-wise comparison by goals for each actor, and we present the corresponding eigen vectors to calculate the goal matrixes, as shown in Table 10.
After the goal-to-goal pair-wise comparison, an analysis of the influences of the actors on these goals is presented. This is based on the calculation of a vector for the summary of the priorities, which is the result of multiplying the matrix in Table 3 by the vector in Table 4. The result represents the priorities of each actor in the system of factors.
The resulting matrix is then multiplied by the corresponding matrix of goals by actors, as presented in the following set of equations:
Secretariat of Energy:
0.393   0.539 0.360 0.101 = 0.212 0.141 0.040
Secretariat of Environment and Natural Resources:
0.283   0.469 0.417 0.113 = 0.133 0.118 0.032
Local governments:
0.067   0.575 0.305 0.120 = 0.039 0.020 0.008
PEMEX:
0.123   0.607 0.287 0.107 = 0.075 0.035 0.013
Private oil companies:
0.142   0.314 0.087 0.599 = 0.045 0.012 0.085
Let us consider the results of the analysis in regard to the environmental and economic goals in the case of the oil industry in the Gulf of Mexico:
(1) For the Secretariat of Energy, the main goal is to reduce electrical energy consumption due to extractive activities (normalized maximal goal value: 0.390);
(2) For the Secretariat of the Environment and Natural Resources, the main goal is to reduce the volume of emissions (normalized maximal goal value: 0.244);
(3) For local governments, the main goal is to protect the coastal economic–environmental system (normalized maximal goal value: 0.071);
(4) For PEMEX, the main goal is to improve hydrocarbon production (normalized maximal goal value: 0.137);
(5) For private oil companies, the main goal is to comply with the country’s environmental rules (normalized maximal goal value: 0.157).
Below in Table 11. is a comparison between the strategies presented in Figure 3 with respect to the normalized maximum vectors.
Next, the vector resulting from multiplying this matrix, which compares strategies with the optimal objectives, is presented. From the literature, we can extract these competing alternative strategies concerning the environmental factor of oil production in Mexico as follows:
(1) Infrastructure approach: This strategy is aimed at developing the infrastructure of the oil industry;
(2) Strategy for the introduction of new progressive technologies at oil enterprises;
(3) Strategy for the development of an environmental management system at enterprises;
(4) A strategy for reducing the risk of spills (from increased pressure as a result of the action of manmade and natural factors) during oil production;
(5) Strategy for maximizing the prevention of damage from hurricanes in the Caribbean.
To do this, the matrix is multiplied by the normalized maximum values of the strategy selection. The resulting vector produces the maximum value that symbolizes the most efficient strategy. In our case, this is an infrastructure strategy to drive the energy transition in Mexico.
0.333 0.306 0.322 0.341 0.299 0.285 0.231 0.280 0.242 0.313 0.190 0.273 0.239 0.214 0.211 0.118 0.113 0.099 0.123 0.109 0.074 0.076 0.060 0.080 0.068     0.390 0.244 0.071 0.137 0.157 = 0.321 0.270 0.220 0.114 0.073
The resulting vector contains the maximum value for the infrastructure approach strategy. This value marks the selection of this strategy. Infrastructure is expensive, so government participation and the development of an infrastructural approach within the framework of a unified strategy for the development of the country’s territory are required. To take into account all the aspects of the environmental and economic development, a comprehensive system of indicators for territorial functioning and development is proposed. To increase the efficiency of the implementation of the oil industry strategy, the strategy should be developed in conjunction with the strategy for the socio-economic development of the territory. Such an integration may be achieved within the framework of the strategic system of the territorial development indicators. The direct consideration of the environmental factor in the development of oil enterprises occurs by identifying the environment and resource subsystem, as well as the oil industry subsystem, which in a number of countries, are of key importance for the formation of the state budget.
A comprehensive system of indicators should take into account, among other things, the following research results aimed at rationalizing costs and results:
(1) The identified infrastructural orientation of the strategy in the oil industry requires the development of oil infrastructure as a part of the development of the entire infrastructure in the territory, which is reflected in the identification of the infrastructural subsystem;
(2) Increasing the efficiency for taking into account the environmental factor additionally occurs by highlighting the natural resource subsystem;
(3) The identification of the oil industry as a separate subsystem is necessary because the oil industry makes a significant contribution to the formation of the state budget of Mexico (and other countries).

4.4. Design of a Comprehensive System of Indicators

However, environmental pollution as a result of the activities of enterprises reduces the potential of the industry, and its partial transition to the sub-potentials of the threat and deterrence occurs. Under the present conditions of instability and technological challenges, there is a need to establish a comprehensive and systematic approach to the development of the oil industry, which is only possible on the basis of a single concept of socio-economic development and government regulation. An integrated approach involves the consideration of all the necessary components of the strategic development based on general benchmarks.
To make an assessment of the sustainability of the oil industry within the framework of a unified strategy for the development of the country’s economy, this study explores the use of an approach based on a graphical display using geometric shapes. This methodological approach can be used both for oil enterprises and for territorial development.
Figure A1, Figure A2, Figure A3, Figure A4, Figure A5, Figure A6 and Figure A7 in Appendix A illustrate the annual variations in the benchmark stars that were used for the estimation. Using the variables of the previous model, this research calculated the weight of the variable as a part of their totals during the 2016–2022 period. From the elements of the estimate, this paper builds one benchmark star per year. It is possible to see an evolution in the right half, which symbolizes an increase in emissions, but a weakening of the production edge on the left side. The starting scenario in 2016 has one of the predominant production dimensions. The next year is characterized by stable variables in all the dimensions except in the inventoried areas. On the contrary, energy consumption is the predominant indicator in 2018.
The years 2016 and 2017 differ drastically from the period from 2018 to 2022 in the evolution of the indicators. This change maybe studied in further research. A change in the governing political party in Mexico in 2018 could have also altered PEMEX’s strategy. It is interesting to note that the pandemic had no effect on the trend. In 2019, the energy consumption rose in comparison to the other indicators. The year 2020 represents a breaking point at which there was a similar distribution for all the variables; from that point on, emissions began to grow faster than the other indicators. The graphs for 2021 and 2022 show a growth in emissions.
The approach presented in this article is also implemented to assess the level of economic development in a territory, including at the level of the specific “sustainability” dimension of the country as a whole. Thus, H. Bossel proposed the use of the appropriate parameters to find the level of development of the components of the system and their contributions to the maintenance of the effective functioning of the entire socio-economic system [58]. To maintain the required levels of functioning and stability, the system must be able to respond to threats, adapt to them, and take measures to prevent damage. Figure 6 presents a graphical interpretation of the approach based on management guidelines.
The stability of the system depends on compliance with six necessary fundamental principles. These six basic principles should be highlighted: existence, effectiveness, freedom of action, safety, adaptability, and co-development. The effectiveness and direction of development of the system will be limited by the system’s level of minimal satisfaction. Therefore, when planning, it is necessary, first of all, to take into account the benchmarks that act as limiting factors.
Figure 6 shows the rays that represent the value of changes in the subsystem benchmark during the year (points A, B, C, D, E, and F). To make comparisons, it is recommended to use dimensionless relative base values for measurements. Thus, the changes in the values of the parameter are considered as differences in its value in comparison with those in the previous period.
The maximum possible change in the indicator over the period corresponds to one value in this figure, while the range of the change varies from 0 to 1. The area of the figure is formed by connecting points A–F with straight lines. It should be concluded that the lines reflect the levels of functioning and development of the subsystem and of the entire system. A decrease or an increase in the area of this figure over the observation period reflects a decrease or an increase in the level of development of the subsystem and, in general, of the socio-economic system as a whole.
There may be two extreme cases in this approach:
1. When the system benchmarks change during the period to the maximum extent according to all the management guidelines, the area of the displayed figure reaches its maximum. In this case, the displayed figure is a regular polygon, which is inscribed in a circle with a radius of one unit (Figure 7);
2. When the parameters of the subsystem change during the period according to all the main benchmarks according to the minimum values, the area of the displayed figure becomes minimal, and the indicator is reduced to the central point (Figure 8).
In all the other cases, the changes in the system along various benchmarks are displayed graphically in the form of irregular polygons of various areas and shapes.
By comparing the geometric figures obtained as a result of monitoring the level of functioning in the system over a certain number of years, the analyst can draw conclusions about the levels of development and stability of the subsystems and the system as a whole. A decrease in the relative value of a subsystem parameter (reflected in the polygon) is a signal and a tool for creating management benchmarks.
The system must have adaptive properties. Given the dynamic nature of socio-economic systems, their evolution is particularly impacted by market conditions, such as the recent global events of 2020–2022. Therefore, it is important to maintain the flexibility of indicator lists and the ability to revise them in response to new requirements.
As a tool for strategic planning and the development of the Mexican economy, this research proposes the use of a comprehensive system of indicators aimed at ensuring sustainable territorial functioning and development. This presupposes the achievement of a certain quality in the territorial system, which is determined by the aforementioned benchmarks: existence, effectiveness, freedom of action, security, adaptability, and co-development.

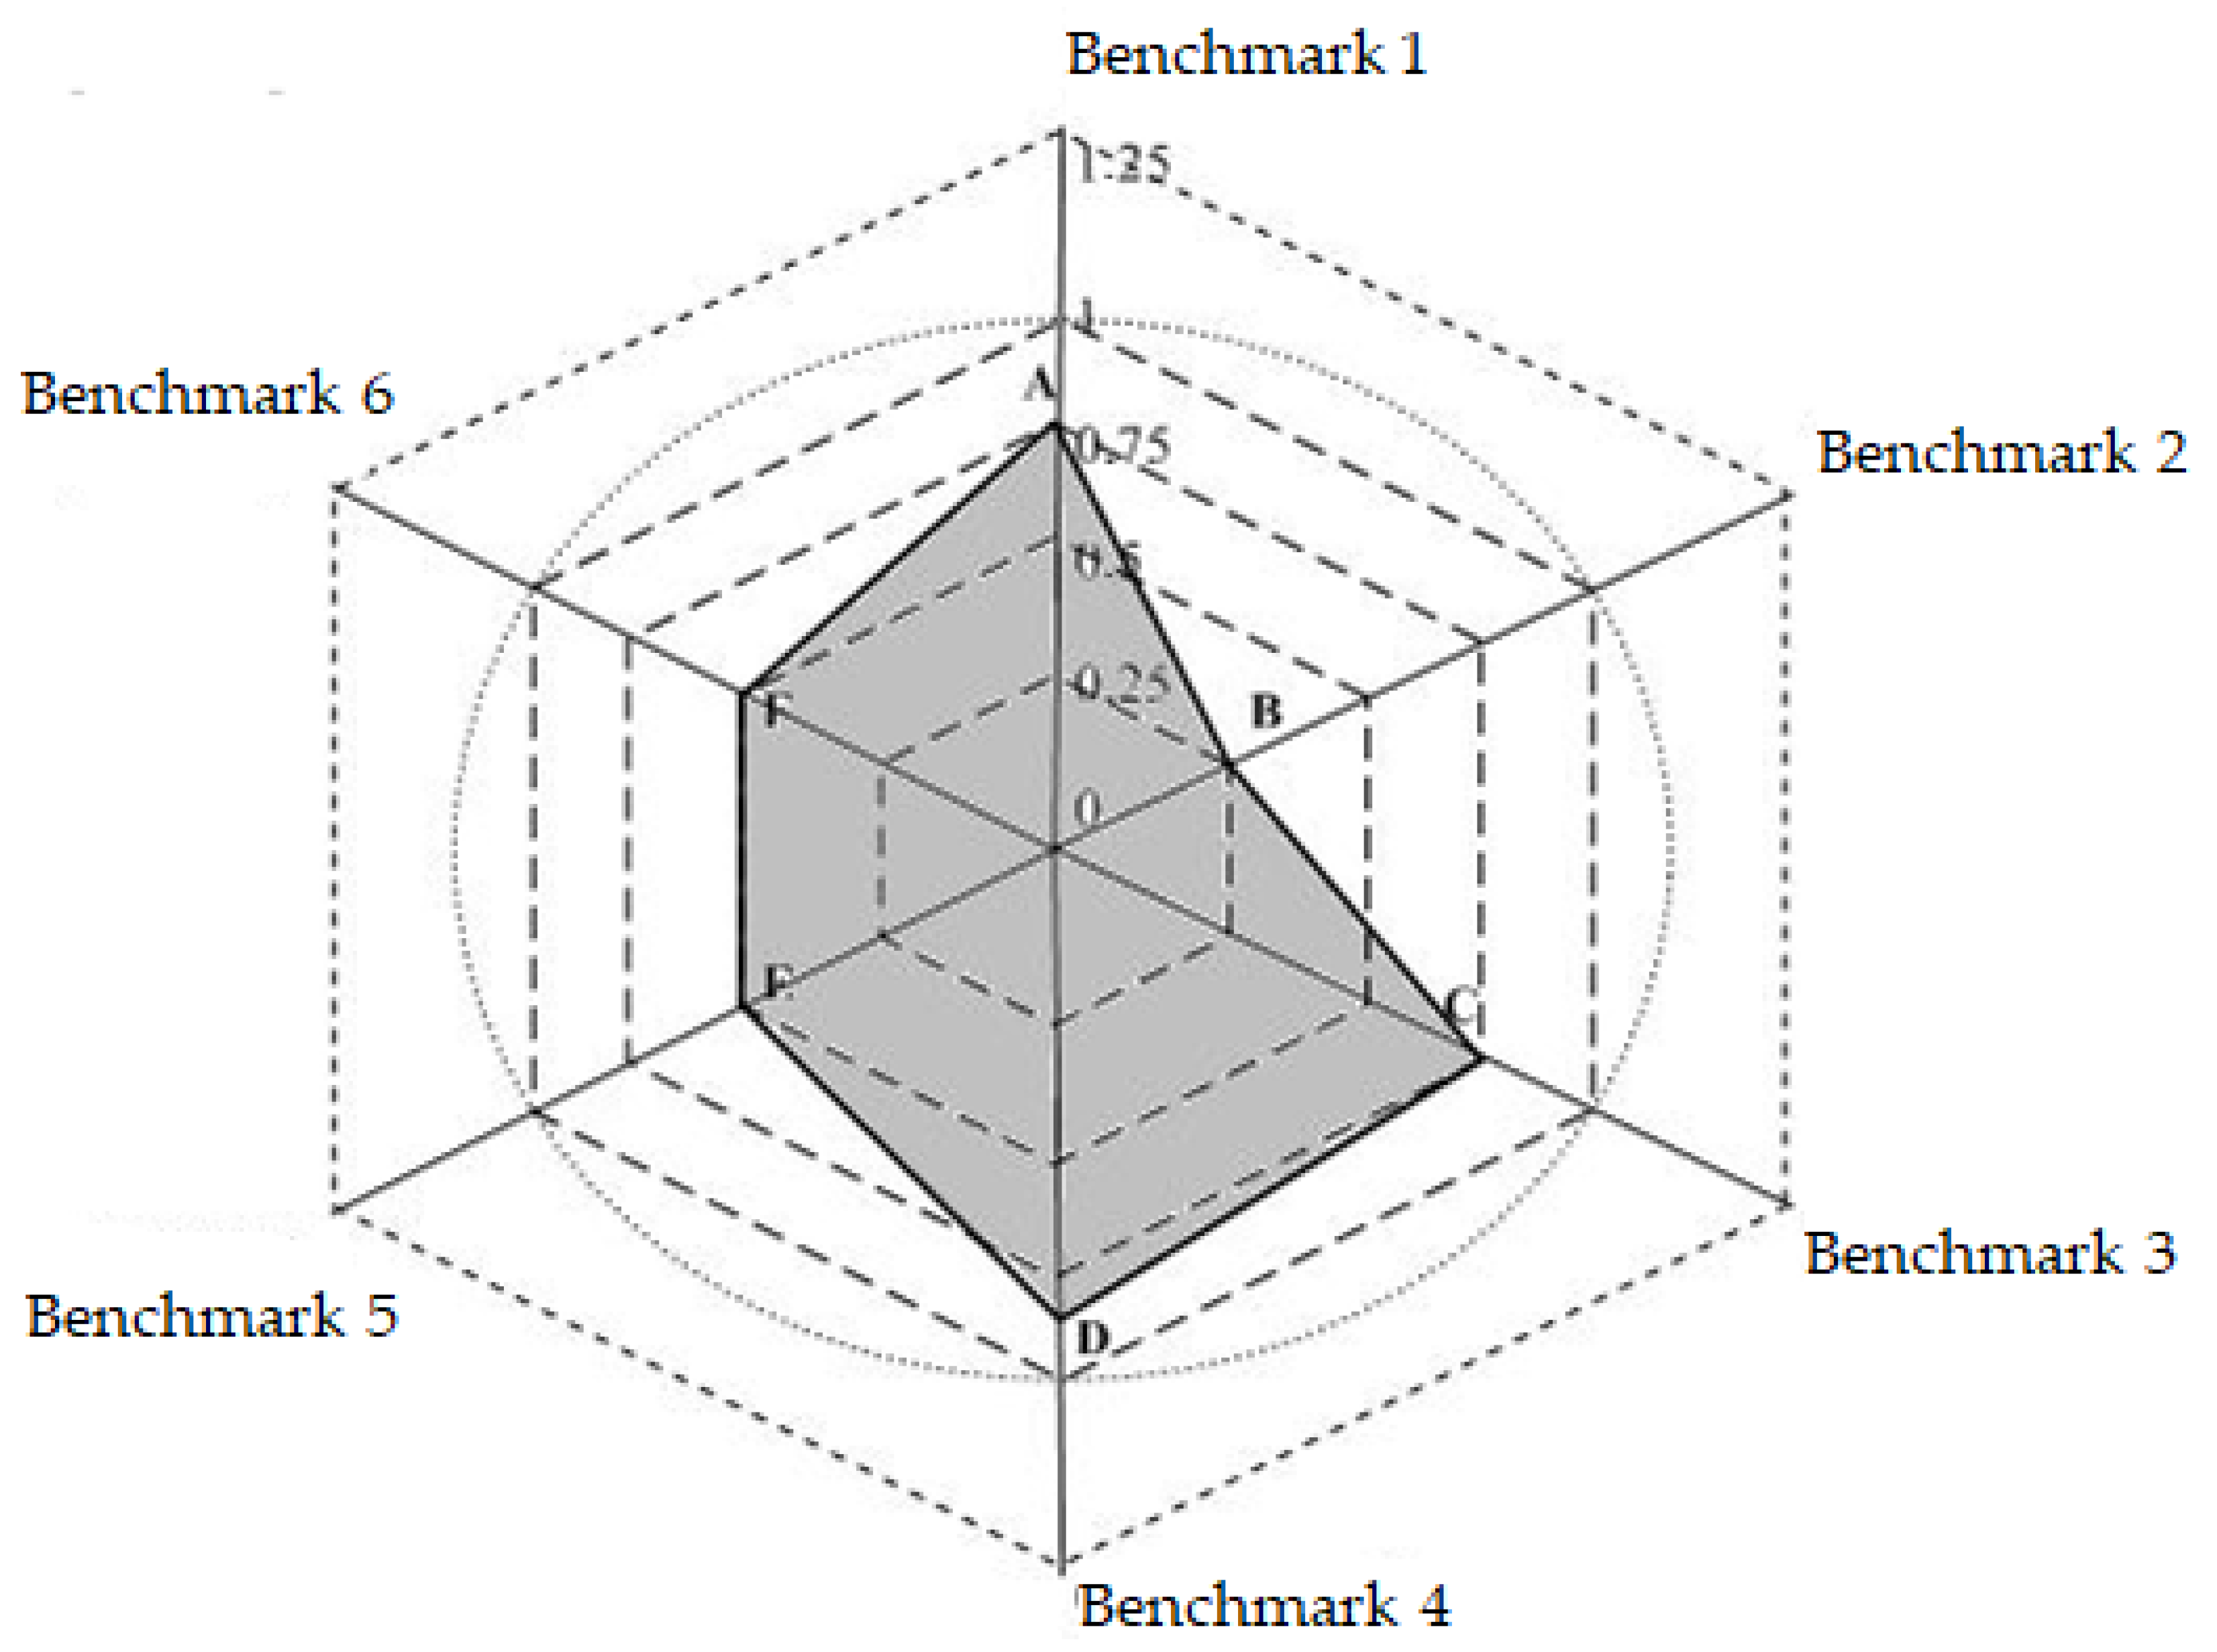
4.5. Environmental Performance Assessment

The indicators proposed in this research are distinguished by the fact that they are derived from a scientific approach that consists of the selection of the indicators based on management guidelines; the selection of the indicators is conducted using expert means, and scientific methods are used to process expert survey data by calculating relevant consistency indicators based on relevant management guidelines. The system of the proposed indicators should fulfill an important role in diagnosing the state of the strategic development of the Mexican economy, guiding the development of the country’s oil industry by taking into account the environmental factor. The petroleum industry and environment and resource subsystems are integral elements of the proposed tool and provide the strategic development of the system. There should be enough indicators to ensure compliance with the identified management guidelines. Simultaneously, these indicators should align with the goals of strategic management. Table 12 illustrates the indicators for the oil and gas industry based on Bossel’s extensive indicator set for a global region.
A comprehensive system of indicators for socio-economic development is a strategic management tool aimed at measuring the changes in the development of the socio-economic system in accordance with systemic and integrated approaches and management guidelines and the expert justification for the selection of indicators using scientific data-processing techniques.
Indicator values may change owing to the development of systems under conditions of uncertainty. The presented methodology empowers policymakers to make necessary adjustments in accordance with evolving requirements. The adaptability in this system of indicators is one of the important aspects of the model, which considers the possibility of revisions in response to new needs. Moreover, adaptability is a key attribute of a systematic approach, along with characteristics such as emergence, multiplicativity, and synergy.
The proposed tool also makes it possible to ensure the environmental orientation of the economic development to integrate environmental and social aspects into the evolution of oil and gas enterprises, the industry, and the country’s economy as a whole.

5. Discussion

5.1. Implications of the Results within the National Oil Companies’ Literature

As a result of the analysis of the Mexican oil industry, it was clear that the current state of the industry was incompatible with the actual opportunities provided by the natural resource potential of the country, as well as internal economic requirements. The oil industry functions were identified as replication, system formation, integration, social, communication, distribution, and regulation.
The relevant problems in the Mexican oil industry are related to the need for infrastructure development, as 76% of the oil fields are located offshore. An important factor is the state of the Mexican oil industry’s technological and socio-ecological infrastructure, which generates environmental pollution in the absence of effective oil waste disposal technologies.
As noted by Oswald, national oil companies, such as PEMEX, face challenges in implementing global adaptation trends [43]. Greenhouse gas emissions seem to be the element that limits the ecological performance of PEMEX; however, the strategy has an effect on the reduction in electricity consumption and the number of polluted areas.
The implementation of the low-carbon energy transition has been affected by the pandemic and global changes. Following the Ye and Chaiyapa paper on state-centric governance, PEMEX may fall into the category of a fast response to implement a policy to respond to the energy transition but with slow market results [24].
Authors Ahmed et al. also comment on the effectiveness of such strategies. Although PEMEX is adopting technologies to become more efficient in energy consumption, it seems to fail to increase the green energy production and supply [22].
We can compare the model to that of Hu et al., who study how the Chinese green innovation reveals the causal relationships among the oil price, green innovation, and institutional pressure [40]. The price may be an interesting variable to consider in further studies. The radical variations in prices during the pandemic and the appreciation in the prices of fossil fuels after 2021 influenced the selection of the production variable in the trend analysis in this article. Also, Li et al. argue that the crude oil price volatility plays an important role in renewable energy investments [71]. Resource management can improve the drivers of climate change [72].

5.2. Environmental Performance Evaluation

To include the coefficient of the anthropogenic pressure in the system of environmental performance indicators and then derive an integral indicator for assessing the efficiency, a scoring system is proposed. The variation between the maximum and minimum of the distribution is 0.7 percentage points. If the indicator increases then 0 points are assigned. A decrease in the anthropogenic load coefficient to 0.3 corresponds to 5 points; to below 0.3, 10 points.
In Table 13, we present a methodology for examining the environmental efficiency as a part of the technological component of the oil and gas industry. Using a partial indicator calculated based on a scoring system, a company can identify a specific component of the environmental efficiency [72]. The indicator of the level of pollution will consider the previous variables of emissions, energy consumption, and number of polluted areas generated by PEMEX.
The minimum acceptable value (in points) in the integral assessment of the environmental efficiency of projects for oil industry enterprises in Mexico was obtained—no fewer than 5 points. Subsequently, calculations were performed for other efficiency components, including economic, technological, and social, and were then converted to a score format. This process resulted in a comprehensive indicator that evaluates the project effectiveness.
For Mexico, the value of the anthropogenic load coefficient at which the environmental sub-potential turns into the threat and containment sub-potentials has been established. Given the 2019 trend of an anthropogenic pressure coefficient of 1.4, a company or government may set the maximum threshold at 1.4. Oil and gas projects should not exceed this threshold. As the threshold value rises, the risk of the protection sub-potential shifting toward the threat and deterrence sub-potentials sharply escalates.

5.3. Limitations of the Sub-Potential Methodological Approach

The main limit is that new threats from the environmental sub-potential are hard to foresee. The pandemic and global conflicts were the main unforeseen risks that altered the oil market in the last four years. However, regional factors that the methodology may not account for include the intensity of natural disasters and their effects on platforms, a factor that is particularly relevant in the Gulf of Mexico and for which the intensity is hard to predict.
To increase the sustainability of the functioning and development of the oil and gas sector, reduce the impact of the threat and deterrence sub-potentials, and, at the same time, increase the protection and reserve sub-potentials, it is necessary to increase the technological efficiency of projects. This means that the technological potential of the country, including that of the oil and gas sector, should be increased.
One of the ways to reduce the influences of the threat and deterrence sub-potentials is to adapt existing technologies. One path that the Mexican State follows to incorporate innovation into the oil industry and at PEMEX is the transfer and adaptation of existing technologies. Some of these technologies were developed under different geological conditions or for other crude oil qualities or under other economic conditions, but the Mexican Petroleum Institute (IMP) carries out the double task for innovating and adapting technologies. It is possible to observe the intellectual property that the institute generates to identify the new technologies that the Mexican oil industry is using and which have the most potential to generate sustainable effects on PEMEX’s activities. Table 14. describes the possible ecological potentials of some technologies that the institute has recently introduced to the Mexican market.
Table 15 illustrates the number of patents implemented by the institute during the previous period in relation to changes in the oil industry and the institute’s budget. These are the various forms of intellectual property that the institute submits to the property registration system in Mexico.
During the reporting period, this research observed an increase in the number of patents and a decrease in the number of new patent applications. On average, the Mexican Petroleum Institute issues 13 patents per year and issues 14 applications. Likewise, it generates intellectual property for 16 brands and creates up to 5 public domain innovations. Major macroeconomic and institutional changes within the country mark this period.
PEMEX, like other national oil companies, contributes more directly to the country’s oil rent. Political and legislative changes have been introduced in the last few years to increase the productivity of the oil sector. These changes may continue, but they are also an opportunity to test this methodological approach in regulatory environments.

5.4. Policy Implications

The policy implications of the findings in this study point toward a change in how PEMEX uses the resources of the strategy. The rise in CO2 emissions was the particular environmental factor that activated the sub-potentials of the threat and deterrence, therefore addressing the specifics of the combustion process within the company.
There are political and market pressures to increase production at the company. Decreasing production has led to decreasing revenues for oil rent, limiting the resources available for allocation to the strategy. The global scenario of high oil prices in the post-pandemic oil market may improve the chances of an energy transition in Mexico.
The available resources should be directed toward enhancing existing technologies in the energy transition. Several studies indicate that similar to many national oil companies, PEMEX faces challenges in swiftly adopting new technologies.
A systematic approach for implementing indicators of socio-economic development could facilitate the integration of the national energy policy with an energy transition strategy, thereby enhancing environmental outcomes.

5.5. Final Remarks

Further analysis has to incorporate the technological sub-potential to assess the relationship between technology and environmental results. Technology explains how the budget is used within the country and the company.
Despite the failure to clearly reduce emissions, the strategy was successful in generating energy savings in PEMEX extractive activities. This component represents the most direct application of the strategy at the company and should be further explored.
A methodology to account for the environmental factor of the oil-extracting activities at PEMEX may be replicated at other national oil companies in Latin America. As the second-largest company after Petrobras, PEMEX shares a legal framework and environmental goals with similar companies in the region.

6. Conclusions

In this work, we outlined an effective strategy for the development of companies in the Mexican oil sector and selected the infrastructure approach in our methodology. The necessity for applying a critical methodological approach to calculate the hierarchy of priorities as a strategy for the actors in the oil sector in Mexico was proven as a prerequisite for selecting an oil sector development strategy. Based on this proposed approach, a calculation was carried out in the case of Mexico. The infrastructure approach emerged as the most effective approach among all the studied alternatives.
To increase the effectiveness of the strategic development of the petroleum infrastructure of Mexico, the need for the overall implementation of the infrastructure is justified in a unified environmental and economic development strategy. To achieve this, a methodological approach was employed to establish a system of indicators for territorial development. This indicator system is a tool for the development of the environmental sector in Mexico. An economic approach was proposed for prioritizing programs and projects within the implementation strategy to evaluate their effectiveness.
Third, we adopted a method to calculate the threshold at which the functioning and development sub-potentials could transition to the threat and containment sub-potentials for the case of Mexico. An indicator, the coefficient of the anthropogenic pressure, was calculated for this purpose, and we found its specific transition value for the Mexican oil sector.
The study advocates for the centrality of the environmental component in an integrated development strategy, particularly for the oil and gas sector, which is instrumental to the country’s economy. Without due consideration of the environmental conditions in accordance with the proposed concept of sub-potentials, the sub-potential for the protection could transition to the sub-potentials for the threat and deterrence, reducing the potential of the territory. It is essential to establish indicators that indicate the likelihood of such a transition. Moreover, these indicators should be incorporated into a comprehensive assessment of the effectiveness of projects implemented within the territory. The responsible execution of projects with the potential to diminish both the environmental and economic potentials is impossible.
In this article, the coefficient of the anthropogenic pressure is suggested as an indicator of sustainability. The objective of this experimental study was to identify the values of this indicator that should not decrease during the implementation of oil and gas projects as well as other developmental projects in Mexico.
This research established that specifically for Mexico, the value of this indicator should not be more than 1.4. Otherwise, there is a high risk of the protection sub-potential transforming to the threat and deterrence sub-potentials. The recommended values are aimed at improving the environmental and economic situations. For Mexico, the recommended threshold of this indicator should be less than 0.9.
The application of this indicator facilitates the integration of the environmental and economic aspects of development in both territorial management and project implementation by oil and gas companies. To include this indicator in a comprehensive assessment of a specific project’s effectiveness, a scale of values is proposed.
The proposed approach introduces the sub-potential concept and establishes a unified development strategy that incorporates environmental considerations based on established benchmarks. The expanded application of this methodology requires, in each specific case, the selection of indicators that consider the specifics of the country. When characterizing them, it is advisable to use the system proposed in this article.
The primary focus of this article lies in the environmental aspect of this methodology, comparing whether the environmental results of the company PEMEX align with the country’s transition strategy. This research concluded that these environmental indicators do not match the budget allocations for the transition strategy. The introduction of a methodology based on a comprehensive system of indicators for strategic development, including indicators of the oil industry, which represents one-third of Mexico’s budget revenues, aids in the identification of strategic goals, indicators, programs, and projects, which increase the effectiveness of government regulation in this area to ensure its effective functioning, as well as a mechanism for adjusting the strategic direction under unstable conditions.
The concept of sub-potentials makes possible the integration of the environmental component into the socio-economic strategy of the country and the oil and gas sector. The improvement in the environmental conditions is a factor that increases the protection sub-potential and, correspondingly, the potential for the functioning and development of the territory. When assessing the directions of development in a territory, an integrated approach is important, considering the various components of effective investment projects. Accounting for the social component of the efficiency increases the sub-potential of the reproduction, technological efficiency, and the sub-potential of the reserve.
The engineering component is an integral part of these sub-potentials when assessing the competitiveness of technologies within the framework of technological efficiency. The methodology for assessing competitiveness involves the identification of the following indicators of product quality and technology: operational indicators, including indicators of purpose, reliability, standardization, unification, and design continuity; production and technical indicators, including material intensity, labor intensity, and energy intensity. The criteria used to evaluate a specific technology and their contents and units of measurement are determined by the specifics of the technology or product. The assessment of the engineering component, considering the specifics of technologies and products, also occurs at the stage for selecting an integrated indicator of the technical level when calculating the competitiveness indicator.
According to the proposed methodological approach, the integration of the environmental component of the development and the oil and gas sector into a single socio-economic strategy occurs based on the formation of a comprehensive system of indicators. This system is built on a scientific approach using management guidelines and identifying the most important subsystems, one of which is the oil and gas industry’s subsystem. Representing the country’s economy in the form of a hierarchy of subsystems acknowledges the properties of systems under the use of a scientific approach. The properties of synergy, multiplicativity, and emergence in this case enhance the final result; that is, they increase the potential for the functioning and development of the territory. Some considerations of the conceptual approach could be practically implemented using the example of Mexico. However, the proposed methodology allows other countries to use this approach.
The development of projects in the oil industry requires considerable effort and capital. Environmental activities consume considerable resources. The proposed concept of sub-potentials asserts that considering the environmental factor increases the potential of the territory and does not reduce it. Simultaneously, the potential of subsystems, identified using the decomposition method of a large system, increases. In particular, the potential of the oil and gas sector increases with proper management under the present conditions of environmental and economic development. A rational allocation of these costs is possible using scientific approaches based on government regulation. By applying the proposed methodology within the framework of the concept of sub-potentials, systemic and integrated approaches for integrating the industry’s strategy into a single socio-economic unit with a comprehensive system of indicators can enhance the effectiveness of the functioning and development of the oil industry and the country’s economy as a whole.

Author Contributions

Conceptualization, T.S.; Methodology, T.S. and J.Y.M.S.; Formal analysis, J.Y.M.S.; Investigation, J.Y.M.S.; Writing—review & editing, T.S. All authors have read and agreed to the published version of the manuscript.

Funding

This research received no external funding.

Institutional Review Board Statement

Not applicable.

Informed Consent Statement

Not applicable.

Data Availability Statement

The data used in this study are publicly available in the Results statements of the company PEMEX and the federal budget of Mexico, as stated in the references.

Conflicts of Interest

The authors declare no conflict of interest.

Appendix A

In this appendix, we present the benchmark stars according to the variables of pollution and production at PEMEX.
Figure A1. “Benchmark star” for emissions and production variables—2016.
Sustainability 16 00036 g0a1
Figure A2. “Benchmark star” for emissions and production variables—2017.
Sustainability 16 00036 g0a2
Figure A3. “Benchmark star” for emissions and production variables—2018.
Sustainability 16 00036 g0a3
Figure A4. “Benchmark star” for emissions and production variables—2019.
Sustainability 16 00036 g0a4
Figure A5. “Benchmark star” for emissions and production variables—2020.
Sustainability 16 00036 g0a5
Figure A6. “Benchmark star” for emissions and production variables—2021.
Sustainability 16 00036 g0a6
Figure A7. “Benchmark star” for emissions and production variables—2022.
Sustainability 16 00036 g0a7

References

  1. Pickl, M.J. The Trilemma of Oil Companies. Extr. Ind. Soc. 2021, 8, 100868. [Google Scholar] [CrossRef]
  2. International Energy Agency. The Oil and Gas Industry in Energy Transitions—Analysis—IEA. Available online: https://www.iea.org/reports/the-oil-and-gas-industry-in-energy-transitions (accessed on 21 April 2023).
  3. Lu, H.; Guo, L.; Zhang, Y. Oil and Gas Companies’ Low-Carbon Emission Transition to Integrated Energy Companies. Sci. Total Environ. 2019, 686, 1202–1209. [Google Scholar] [CrossRef] [PubMed]
  4. Asmelash, E.; Gorini, R. International Oil Companies and the Energy Transition. Available online: https://www.irena.org/Technical-Papers/Oil-companies-and-the-energy-transition (accessed on 25 April 2023).
  5. Li, Z.; Qadus, A.; Maneengam, A.; Mabrouk, F.; Shahid, M.S.; Timoshin, A. Technological Innovation, Crude Oil Volatility, and Renewable Energy Dimensions in N11 Countries: Analysis Based on Advance Panel Estimation Techniques. Renew. Energy 2022, 191, 204–212. [Google Scholar] [CrossRef]
  6. Mexico Energy Secretariat. National Strategy for Energy Transition and Sustainable Use of Energy. Available online: https://www.gob.mx/sener/documentos/estrategia-nacional-de-transicion-energetica-y-aprovechamiento-sustentable-de-la-energia (accessed on 2 October 2023).
  7. Fang, M.; Chang, C.L. The Role of COP26 Commitment and Technological Innovation in Depletion of Natural Resources: Evidence from BRICS Countries. Resour. Policy 2023, 81, 103365. [Google Scholar] [CrossRef]
  8. National Commission for the Efficient Use of Energy (Mexico). Transition Strategy to Promote the Use of Cleaner Technologies and Fuels. Available online: https://www.gob.mx/conuee/acciones-y-programas/estrategia-de-transicion-para-promover-el-uso-de-tecnologias-y-combustibles-mas-limpios-2016 (accessed on 19 March 2023).
  9. Secretary of the Interior of Mexico. Agreement by Which the Ministry of Energy Approves and Publishes the Update of the Transition Strategy to Promote the Use of Cleaner Technologies and Fuels, in Terms of the Energy Transition Law. 2020. Available online: https://www.dof.gob.mx/nota_detalle.php?codigo=5585823&fecha=07/02/2020#gsc.tab=0 (accessed on 15 December 2023).
  10. Pickl, M.J. The Renewable Energy Strategies of Oil Majors—From Oil to Energy? Energy Strateg. Rev. 2019, 26, 100370. [Google Scholar] [CrossRef]
  11. Zhong, M.; Bazilian, M.D. Contours of the Energy Transition: Investment by International Oil and Gas Companies in Renewable Energy. Electr. J. 2018, 31, 82–91. [Google Scholar] [CrossRef]
  12. Griffiths, S.; Sovacool, B.K.; Kim, J.; Bazilian, M.; Uratani, J.M. Decarbonizing the Oil Refining Industry: A Systematic Review of Sociotechnical Systems, Technological Innovations, and Policy Options. Energy Res. Soc. Sci. 2022, 89, 102542. [Google Scholar] [CrossRef]
  13. Jarboui, S. Renewable Energies and Operational and Environmental Efficiencies of the US Oil and Gas Companies: A True Fixed Effect Model. Energy Rep. 2021, 7, 8667–8676. [Google Scholar] [CrossRef]
  14. Aastvedt, T.M.; Behmiri, N.B.; Lu, L. Does Green Innovation Damage Financial Performance of Oil and Gas Companies? Resour. Policy 2021, 73, 102235. [Google Scholar] [CrossRef]
  15. Cherepovitsyn, A.; Kazanin, A.; Rutenko, E. Strategic Priorities for Green Diversification of Oil and Gas Companies. Energies 2023, 16, 4985. [Google Scholar] [CrossRef]
  16. Xiong, Y.; Dai, L. Does Green Finance Investment Impact on Sustainable Development: Role of Technological Innovation and Renewable Energy. Renew. Energy 2023, 214, 342–349. [Google Scholar] [CrossRef]
  17. Dutta, A.; Jana, R.K.; Das, D. Do Green Investments React to Oil Price Shocks? Implications for Sustainable Development. J. Clean. Prod. 2020, 266, 121956. [Google Scholar] [CrossRef]
  18. Yaya, O.O.S.; Ogbonna, A.E.; Vo, X.V. Oil Shocks and Volatility of Green Investments: GARCH-MIDAS Analyses. Resour. Policy 2022, 78, 102789. [Google Scholar] [CrossRef]
  19. Matrokhina, K.; Trofimets, V.; Mazakov, E.; Makhovikov, A.; Khaykin, M. Development of Methodology for Scenario Analysis of Investment Projects of Enterprises of the Mineral Resource Complex. J. Min. Inst. 2023, 259, 112–124. [Google Scholar] [CrossRef]
  20. Lapinskas, A.A. Influence of Mining Rent on the Efficiency of Using Natural Potential: The Paradox of Plenty and Its Russian Specifics. J. Min. Inst. 2023, 259, 79–94. [Google Scholar] [CrossRef]
  21. Nunes, I.C.; Catalão-Lopes, M. The Impact of Oil Shocks on Innovation for Alternative Sources of Energy: Is There an Asymmetric Response When Oil Prices Go up or Down? J. Commod. Mark. 2020, 19, 100108. [Google Scholar] [CrossRef]
  22. Ahmed, Z.; Ahmad, M.; Murshed, M.; Ibrahim Shah, M.; Mahmood, H.; Abbas, S. How Do Green Energy Technology Investments, Technological Innovation, and Trade Globalization Enhance Green Energy Supply and Stimulate Environmental Sustainability in the G7 Countries? Gondwana Res. 2022, 112, 105–115. [Google Scholar] [CrossRef]
  23. Hawkes, A.; Muûls, M.; Hamilton, J.W. Big Oil and the Energy Transition: Evidence from M&A. Energy Policy 2023, 183, 113762. [Google Scholar] [CrossRef]
  24. Ye, W.; Chaiyapa, W. What Does Energy Resilience Mean for Transitioning Oil Majors: A Study of the Impact of Energy Governance on Energy Resilience. Soc. Sci. Humanit. Open 2023, 8, 100686. [Google Scholar] [CrossRef]
  25. Bricout, A.; Slade, R.; Staffell, I.; Halttunen, K. From the Geopolitics of Oil and Gas to the Geopolitics of the Energy Transition: Is There a Role for European Supermajors? Energy Res. Soc. Sci. 2022, 88, 102634. [Google Scholar] [CrossRef]
  26. Nepsha, F.; Varnavskiy, K.; Voronin, V.; Zaslavskiy, I.; Liven, A. Integration of Renewable Energy at Coal Mining Enterprises: Problems and Prospects. J. Min. Inst. 2023, 261, 455–469. [Google Scholar]
  27. Dzhancharova, G.; Kosheleva, A.; Drobysheva, N.; Pasternak, S.; Shelygov, A.; Lebedev, K. Economic and Legal Aspects of Foreign Economic Risks Within the Framework of Sustainable Development of Russian Enterprises. J. Law Sustain. Dev. 2023, 11, e317. [Google Scholar] [CrossRef]
  28. Morgunova, M.; Shaton, K. The Role of Incumbents in Energy Transitions: Investigating the Perceptions and Strategies of the Oil and Gas Industry. Energy Res. Soc. Sci. 2022, 89, 102573. [Google Scholar] [CrossRef]
  29. Wang, F.; Ma, W.; Mirza, N.; Altuntaş, M. Green Financing, Financial Uncertainty, Geopolitical Risk, and Oil Prices Volatility. Resour. Policy 2023, 83, 103716. [Google Scholar] [CrossRef]
  30. Luebeck, Y.V. Comprehensive Evaluation of the Efficiency of Investment Projects under Concession Agreements in the Russian Regions with Mineral and Raw Materials Specialization. Laplage Rev. 2021, 7, 676–696. [Google Scholar] [CrossRef]
  31. Golovina, E.; Khloponina, V.; Tsiglianu, P.; Zhu, R. Organizational, Economic and Regulatory Aspects of Groundwater Resources Extraction by Individuals (Case of the Russian Federation). Resources 2023, 12, 89. [Google Scholar] [CrossRef]
  32. Halttunen, K.; Slade, R.; Staffell, I. Diversify or Die: Strategy Options for Oil Majors in the Sustainable Energy Transition. Energy Res. Soc. Sci. I 2023, 104, 103253. [Google Scholar] [CrossRef]
  33. He, J.; Li, J.; Zhao, D.; Chen, X. Does Oil Price Affect Corporate Innovation? Evidence from New Energy Vehicle Enterprises in China. Renew. Sustain. Energy Rev. 2022, 156, 111964. [Google Scholar] [CrossRef]
  34. Litvinenko, V.S.; Petrov, E.I.; Vasilevskaya, D.V.; Yakovenko, A.V.; Naumov, I.A.; Ratnikov, M.A. Assessment of the Role of the State in the Management of Mineral Resources. J. Min. Inst. 2023, 259, 95–111. [Google Scholar] [CrossRef]
  35. Abraham-Dukuma, M.C. Dirty to Clean Energy: Exploring ‘oil and Gas Majors Transitioning’. Extr. Ind. Soc. 2021, 8, 100936. [Google Scholar] [CrossRef]
  36. Marinina, O.; Tsvetkova, A.; Vasilev, Y.; Komendantova, N.; Parfenova, A. Evaluating the Downstream Development Strategy of Oil Companies: The Case of Rosneft. Resources 2022, 11, 4. [Google Scholar] [CrossRef]
  37. Hunt, J.D.; Nascimento, A.; Nascimento, N.; Vieira, L.W.; Romero, O.J. Possible Pathways for Oil and Gas Companies in a Sustainable Future: From the Perspective of a Hydrogen Economy. Renew. Sustain. Energy Rev. 2022, 160, 112291. [Google Scholar] [CrossRef]
  38. Mäkitie, T.; Andersen, A.D.; Hanson, J.; Normann, H.E.; Thune, T.M. Established Sectors Expediting Clean Technology Industries? The Norwegian Oil and Gas Sector’s Influence on Offshore Wind Power. J. Clean. Prod. 2018, 177, 813–823. [Google Scholar] [CrossRef]
  39. Bei, J.; Wang, C. Renewable Energy Resources and Sustainable Development Goals: Evidence Based on Green Finance, Clean Energy and Environmentally Friendly Investment. Resour. Policy 2023, 80, 103194. [Google Scholar] [CrossRef]
  40. Hu, J.; Wang, K.H.; Su, C.W.; Umar, M. Oil Price, Green Innovation and Institutional Pressure: A China’s Perspective. Resour. Policy 2022, 78, 102788. [Google Scholar] [CrossRef]
  41. Voldsund, M.; Reyes-Lúa, A.; Fu, C.; Ditaranto, M.; Nekså, P.; Mazzetti, M.J.; Brekke, O.; Bindingsbø, A.U.; Grainger, D.; Pettersen, J. Low Carbon Power Generation for Offshore Oil and Gas Production. Energy Convers. Manag. X 2023, 17, 100347. [Google Scholar] [CrossRef]
  42. Gong, B. Different Behaviors in Natural Gas Production between National and Private Oil Companies: Economics-Driven or Environment-Driven? Energy Policy 2018, 114, 145–152. [Google Scholar] [CrossRef]
  43. Oswald, Ú. Seguridad, Disponibilidad y Sustentabilidad Energética En México. Rev. Mex. Cienc. Políticas Y Soc. 2017, 62, 155–195. [Google Scholar] [CrossRef]
  44. Heller, P.R.P. Doubling Down: National Oil Companies as Instruments of Risk and Reward. Oxf. Univ. Press 2018, 1, 298–317. [Google Scholar] [CrossRef]
  45. Kenner, D.; Heede, R. White Knights, or Horsemen of the Apocalypse? Prospects for Big Oil to Align Emissions with a 1.5 °C Pathway. Energy Res. Soc. Sci. 2021, 79, 102049. [Google Scholar] [CrossRef]
  46. Gochberg, W.; Menaldo, V. To Rent or Not to Rent? Mechanics, Causes and Consequences of Ricardian and Quasi-Rents in the Oil Industry. Resour. Policy 2022, 78, 102826. [Google Scholar] [CrossRef]
  47. De Soysa, I.; Krieger, T.; Meierrieks, D. Oil and Property Rights. Resour. Policy 2022, 79, 103069. [Google Scholar] [CrossRef]
  48. Pazouki, A.; Zhu, X. The Dynamic Impact among Oil Dependence Volatility, the Quality of Political Institutions, and Government Spending. Energy Econ. 2022, 115, 106383. [Google Scholar] [CrossRef]
  49. Silva Gutiérrez, D.; Paz, M.J.; Moreno Vite, A. Factors That Explain the Results of the National Oil Companies: The Impact of the Fiscal Role on Pemex’s Results. Resour. Policy 2021, 74, 102280. [Google Scholar] [CrossRef]
  50. Ilyushin, Y. V Development of a Process Control System for the Production of High-Paraffin Oil. Energies 2022, 15, 6462. [Google Scholar] [CrossRef]
  51. Wei, S.; Wei, W.; Umut, A. Do Renewable Energy Consumption, Technological Innovation, and International Integration Enhance Environmental Sustainability in Brazil? Renew. Energy 2023, 202, 172–183. [Google Scholar] [CrossRef]
  52. Ciotta, M.; Peyerl, D.; Zacharias, L.G.L.; Fontenelle, A.L.; Tassinari, C.; Moretto, E.M. CO2 Storage Potential of Offshore Oil and Gas Fields in Brazil. Int. J. Greenh. Gas Control 2021, 112, 103492. [Google Scholar] [CrossRef]
  53. Araujo, F.C.; Leoneti, A.B. How Attractive Is Brazil’s Oil and Gas Regulatory Framework to Investors? Extr. Ind. Soc. 2019, 6, 906–914. [Google Scholar] [CrossRef]
  54. Mohammed, J.I.; Fiador, V.O.; Karimu, A.; Abor, J.Y. Ownership Structure of Oil Revenues: Political Institutions and Financial Markets in Oil-Producing Countries. J. Multinatl. Financ. Manag. 2022, 66, 100760. [Google Scholar] [CrossRef]
  55. Wu, D.; Jia, W.; Xie, Y. The Impact of Environmental Information Disclosure on Green Innovation in Extractive Enterprises: Promote or Crowd Out? Extr. Ind. Soc. 2023, 14, 101247. [Google Scholar] [CrossRef]
  56. Adomako, S.; Nguyen, N.P. Eco-Innovation in the Extractive Industry: Combinative Effects of Social Legitimacy, Green Management, and Institutional Pressures. Resour. Policy 2023, 80, 103184. [Google Scholar] [CrossRef]
  57. Santillán Vera, M.; García Manrique, L.; Rodríguez Peña, I.; De La Vega Navarro, A. Drivers of Electricity GHG Emissions and the Role of Natural Gas in Mexican Energy Transition. Energy Policy 2023, 173, 113316. [Google Scholar] [CrossRef]
  58. Bossel, H. Indicators for Sustainable Development: Theory, Method, Applications. A Report to the Balaton Group; International Institute for Sustainable Development: Winnipeg, MB, Canada, 1999; ISBN 1-895536-13-8. [Google Scholar]
  59. Ruggerio, C.A. Sustainability and Sustainable Development: A Review of Principles and Definitions. Sci. Total Environ. 2021, 786, 147481. [Google Scholar] [CrossRef] [PubMed]
  60. Santana-Medina, N.; Franco-Maass, S.; Sánchez-Vera, E.; Imbernon, J.; Nava-Bernal, G. Participatory Generation of Sustainability Indicators in a Natural Protected Area of Mexico. Ecol. Indic. 2013, 25, 1–9. [Google Scholar] [CrossRef]
  61. Cordaro, P.G.; Braga, B.L.; Corotti, D.; Gallego, A.G.; Silveira, J.L. Electricity and Hydrogen Production by Cogeneration System Applied in a Fuel Station in Brazil: Energy Analysis of a Combined SOFC and Ethanol Steam Reforming Model. Fuel 2024, 356, 129615. [Google Scholar] [CrossRef]
  62. Saaty, R.W. The Analytic Hierarchy Process—What It Is and How It Is Used. Math. Model. 1987, 9, 161–176. [Google Scholar] [CrossRef]
  63. Demir, G.; Chatterjee, P.; Pamucar, D. Sensitivity Analysis in Multi-Criteria Decision Making: A State-of-the-Art Research Perspective Using Bibliometric Analysis. Expert. Syst. Appl. 2024, 237, 121660. [Google Scholar] [CrossRef]
  64. Semenova, T.; Al-Dirawi, A. Economic Development of the Iraqi Gas Sector in Conjunction with the Oil Industry. Energies 2022, 15, 2306. [Google Scholar] [CrossRef]
  65. Petróleos Mexicanos PEMEX|Business Plan. Available online: https://www.pemex.com/acerca/plan-de-negocios/Paginas/default.aspx (accessed on 10 April 2023).
  66. Ministry of Finance and Public Credit of Mexico. Diario Oficial de la Federación; Ministry of Finance and Public Credit of Mexico: Mexico City, Mexico, 2021; pp. 2–91.
  67. Organization of the Petroleum Exporting Countries. Annual Statistical Bulletin 2023. Available online: https://asb.opec.org/index.html (accessed on 4 October 2023).
  68. Poikane, S.; Ritterbusch, D.; Argillier, C.; Białokoz, W.; Blabolil, P.; Breine, J.; Jaarsma, N.G.; Krause, T.; Kubečka, J.; Lauridsen, T.L.; et al. Response of Fish Communities to Multiple Pressures: Development of a Total Anthropogenic Pressure Intensity Index. Sci. Total Environ. 2017, 586, 502–511. [Google Scholar] [CrossRef]
  69. Arnan, X.; Leal, I.R.; Tabarelli, M.; Andrade, J.F.; Barros, M.F.; Câmara, T.; Jamelli, D.; Knoechelmann, C.M.; Menezes, T.G.C.; Menezes, A.G.S.; et al. A Framework for Deriving Measures of Chronic Anthropogenic Disturbance: Surrogate, Direct, Single and Multi-Metric Indices in Brazilian Caatinga. Ecol. Indic. 2018, 94, 274–282. [Google Scholar] [CrossRef]
  70. Doussin, J.-F. The Mediterranean Atmosphere Under Anthropogenic Pressures. Atmos. Chem. Mediterr. Reg. 2023, 77–98. [Google Scholar] [CrossRef]
  71. Li, Y.; Li, H.; Tan, J. Technological Catch-up and Innovations of China’s Offshore Oil and Gas Equipment-Manufacturing Industry: The Role of the Supply Chain and Government Policy. J. Clean. Prod. 2022, 365, 132681. [Google Scholar] [CrossRef]
  72. Semenova, T.; Al-Dirawi, A.; Al-Saadi, T. Environmental Challenges for Fragile Economies: Adaptation Opportunities on the Examples of the Arctic and Iraq. Agronomy 2022, 12, 2021. [Google Scholar] [CrossRef]
  73. Mexican Institute of Industrial Property. SIGA 2.0. Available online: https://siga.impi.gob.mx/inicio (accessed on 23 October 2023).
Figure 1. Concept chart for the sustainable strategic development of the Mexican oil industry, taking into account the environmental factor.
Sustainability 16 00036 g001
Figure 2. Sequence of stages for the selection of a strategy.
Sustainability 16 00036 g002
Figure 3. Methodology used to select a strategy for the environmental and economic development of the Mexican oil industry.
Sustainability 16 00036 g003
Figure 4. Dimensions for assessing territorial development.
Sustainability 16 00036 g004
Figure 5. Coefficients of anthropogenic pressure for the case of Mexico’s oil industry.
Sustainability 16 00036 g005
Figure 6. Management guidelines of the ecological–economic system.
Sustainability 16 00036 g006
Figure 7. Maximum feasibility of the socio-economic system.
Sustainability 16 00036 g007
Figure 8. Minimum feasibility of the socio-economic system.
Sustainability 16 00036 g008
Table 1. Systemic view of sustainable development [58].
SystemPotential
Individual developmentIndividual potential
Social systemSocial potential
GovernmentOrganizational potential
InfrastructureInfrastructure potential
Economic systemProduction potential
Table 2. Systemic view of sustainable development [58].
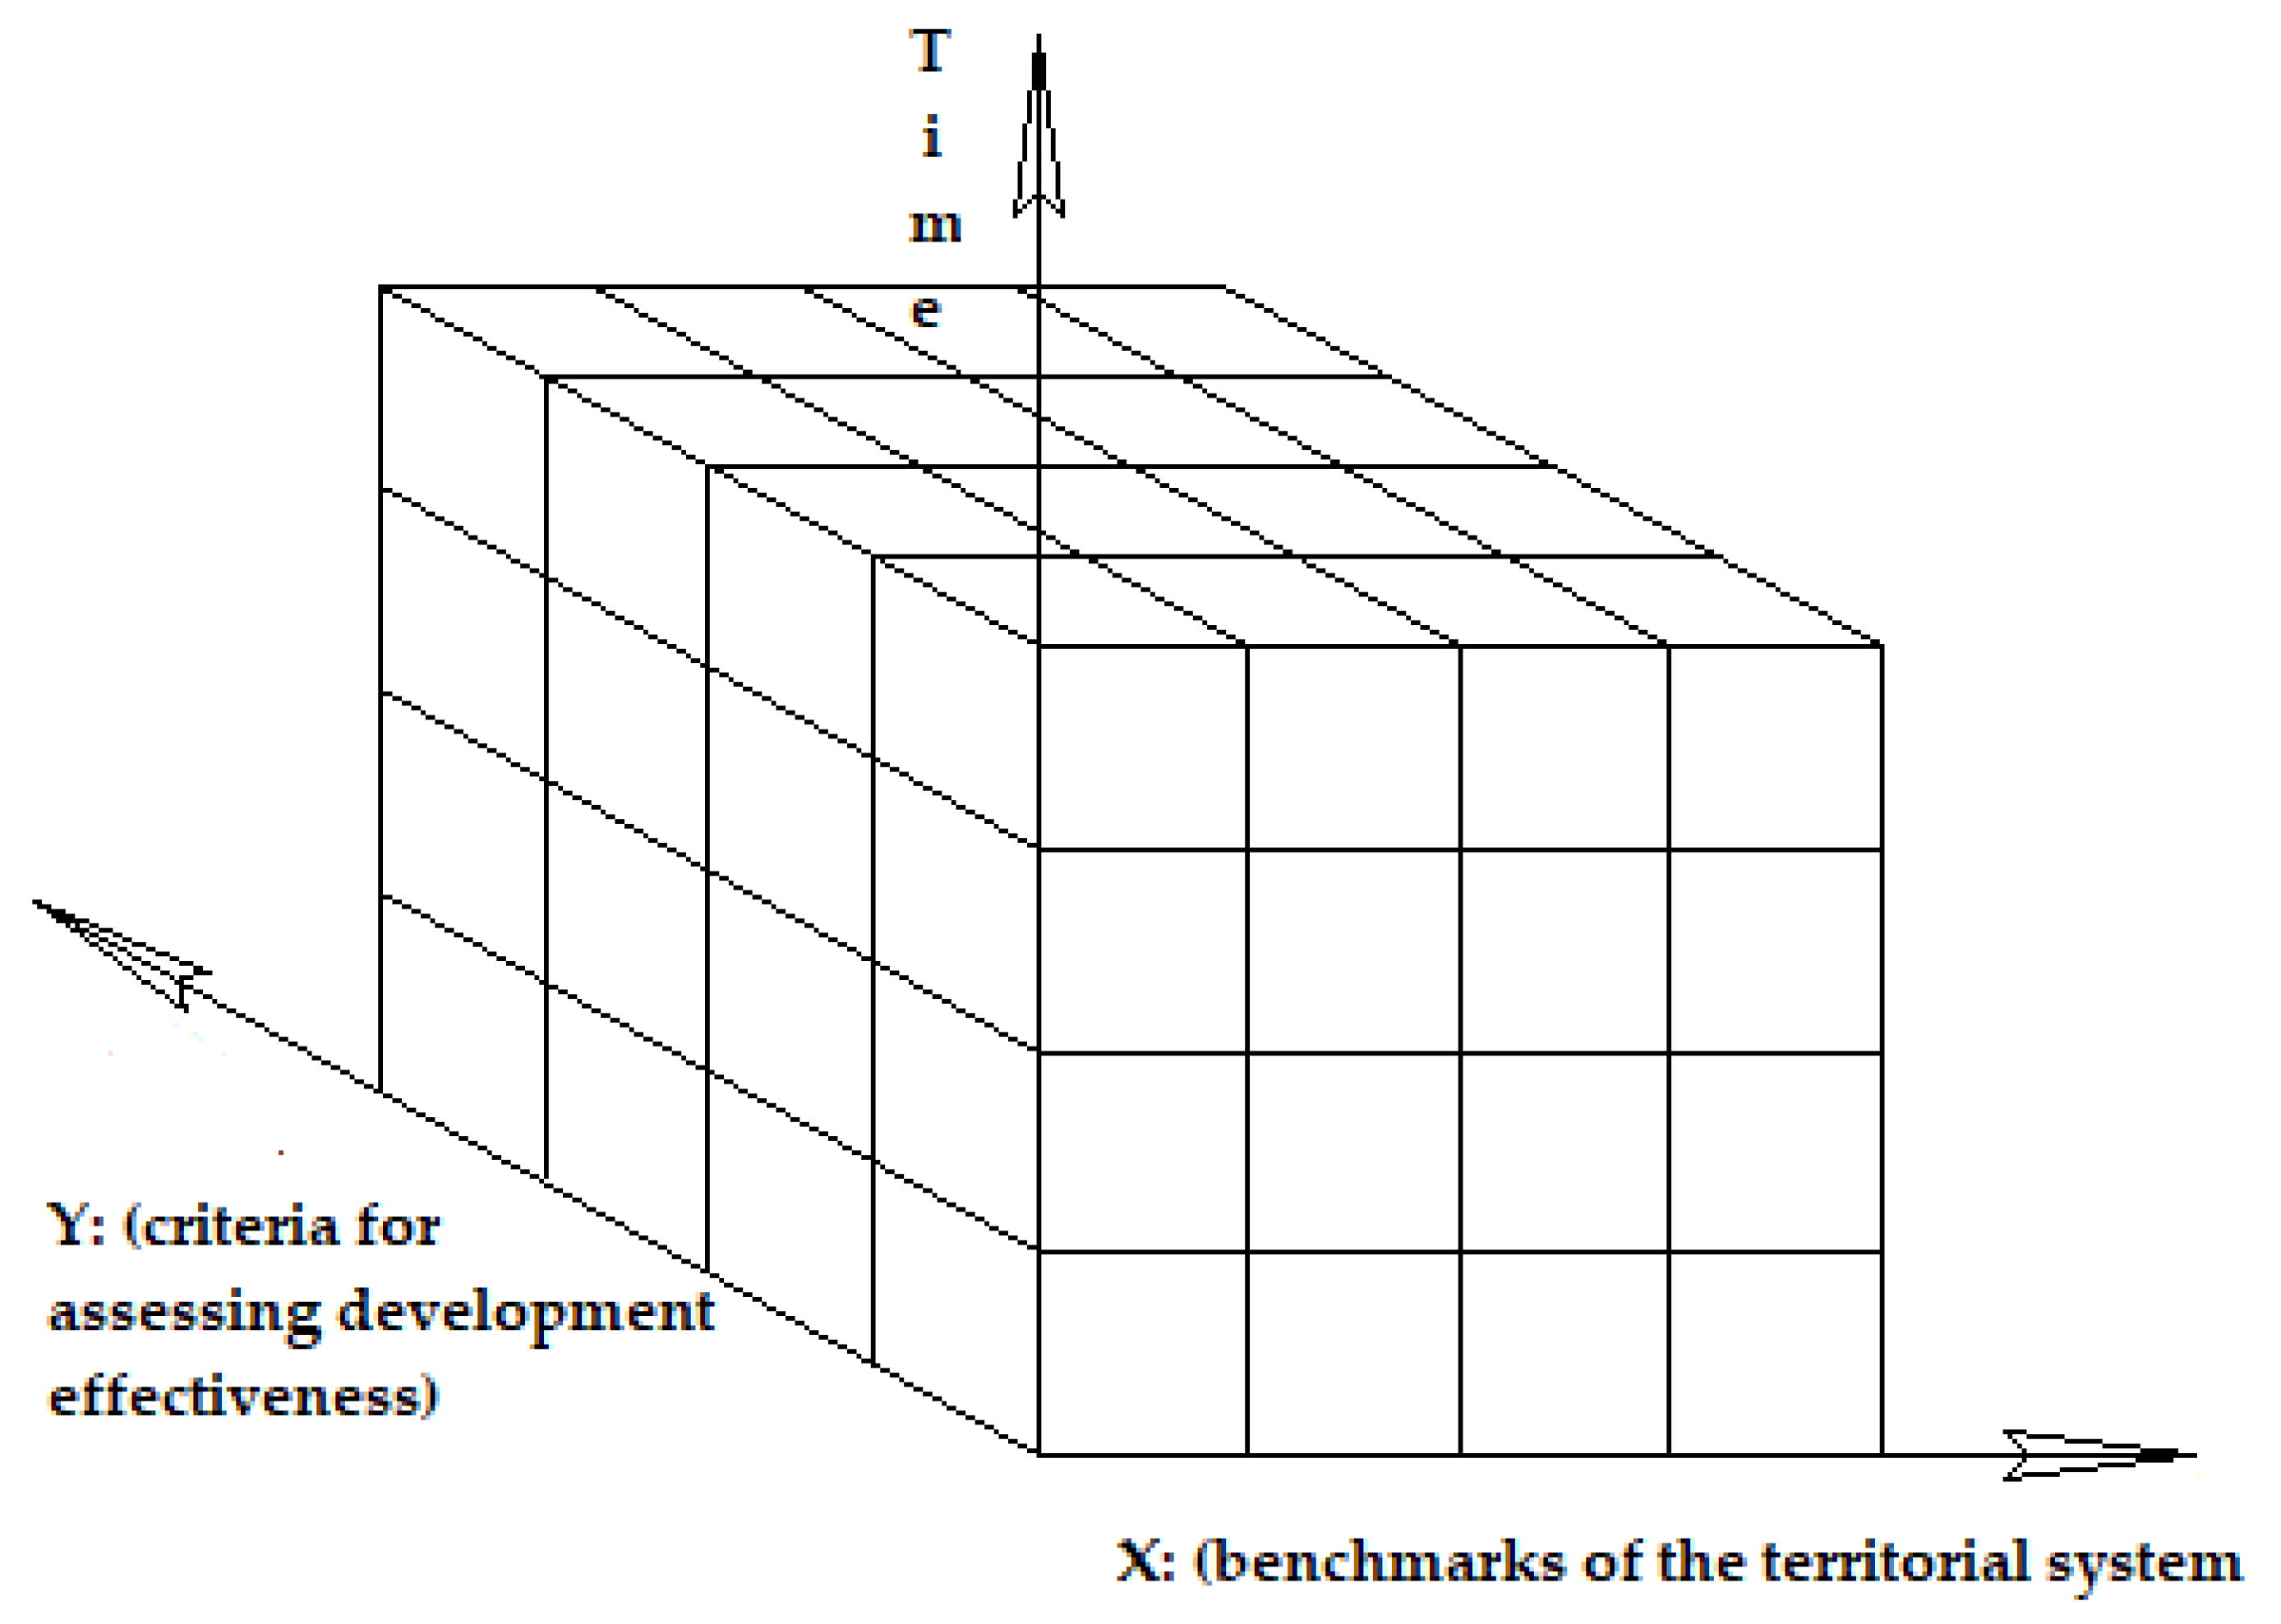
Y-Axis
(Criteria for Assessing Developmental Effectiveness)
X-Axis
(Benchmarks of the Territorial System)
Existence
Economic effectivenessEffectiveness
Technological effectivenessFreedom of action
Economic effectivenessSafety
Social effectivenessAdaptability
Coexistence
Table 3. Environmental results of the company in 2016–2022 [65].
YearCarbon Dioxide Equivalent Emissions (Million Tons of CO2)Emissions of Sulfur Oxides (Million Tons of SOx)Energy Consumption in the Extraction and Production of Crude Oil and Gas (GJ/Thousand BOE)Inventoried Areas with Possible Environmental Impact (ha)
201644900170.01284
201749655184.22041
201846648208.31599
201948880223.51233
2020661051183.81376
2021711305166.11386
2022681170155.71342
Table 4. Budget for the transition strategy to promote the use of cleaner technologies and fuels (million USD) [66].
YearTotal Hydrocarbon Production (BOE/day)Total Budget of PEMEX (Programmable Budget)All Resources for StrategyResources for Strategy at Petroleos MexicanosPercentage of Strategy at PEMEX per Composition of PEMEX ResourcesPercentage of Strategy at PEMEX as Part of Resource Strategy
2010 *375916,257.69438.8286.931.76%65.39%
2011 *368114,686.41432.3282.620.56%19.11%
2012 *367851,565.192385.99241.050.47%10.10%
2013 *366842,793.931353.08206.170.48%15.24%
2014 *349969,559.082375.18180.610.26%7.60%
2015 *332717,893.70632.5252.410.29%8.29%
2016 *28672138.20111.543.030.14%2.72%
2017259773,438.605082.48268.40.37%5.28%
2018243512,189.88890.2827.530.23%3.09%
201924286657.63421.082.150.03%0.51%
2020238519,228.831087.055.470.03%0.50%
2021247435,699.91588.181.110.00%0.19%
2022253430,912.19494.0119.630.06%3.97%
* Data from the pre-reform transition strategy to promote the use of cleaner technologies and fuels.
Table 5. Territorial development indicators for the case of Mexico [67].
YearCrude Oil Production
(1000 b/d)
Acquisition of Property and Equipment at PEMEX
(Million USD)
Active Rigs (Number of Rigs)Share of Oil Rent to Government Revenue
(Percentage)
201025779298.78034.69%
201125524788.610538.05%
2012254812,276.411439.45%
2013252210,802.79835.38%
201424299709.27230.66%
201522676188.04219.77%
201621533405.81916.29%
201719483863.01516.72%
201818104861.63119.13%
201916797977.44917.75%
202016639782.34111.35%
2021166516,505.64719.40%
202216229298.74722.44%
Table 6. Pairwise comparison matrix of factors affecting the functioning and development of the Mexican oil and gas industry.
Factors
FactorsPoliticalSocialEconomicEnvironmentalTechnicalEigen VectorNormalized Priority Vector Estimates
Political14345170.402
Social0.2510.333348.5830.203
Economic0.333314311.3330.268
Environmental0.250.250.25123.750.089
Technical0.20.250.3330.512.2830.054
Total of factors2.0338.54.91612.515
Table 7. Table of average consistencies.
Sample matrix12345
Random consistency000.580.901.12
Table 8. Results for assessment of factors’ impacts on the development of the Mexican oil and gas industry.
Factors
IndicatorPoliticalSocialEconomicEnvironmentalTechnical
Normalized Priority Vector Estimate0.4020.2030.2680.0890.054
λmax5.774
CR17.286
Table 9. Eigen vectors for each actor represented by factor concerning the functioning and development of the Mexican oil and gas industry.
VectorPoliticalSocialEconomicEnvironmentalTechnical
Secretariat of Energy0.4050.4230.3640.2980.378
Secretariat of Environment and Natural Resources0.2850.2470.2790.3390.257
Local governments0.0670.0710.0570.0720.074
PEMEX0.1380.1070.1160.1770.109
Private oil companies0.1050.1520.1840.1130.182
λmax5.7995.3935.8025.7185.513
CR17.8458.78317.91016.02611.460
Table 10. Goal comparison by actor in the oil industry in Mexico.
Secretariat of EnergySecretariat of Environment and Natural ResourcesLocal
Governments
PEMEXPrivate Oil Companies
Reduce electrical energy consumption due to extractive activities0.539
Improve hydrocarbon extraction in the country0.360
Manage other energy sources0.101
λmax3.292
CR13.033
Reduce the volume of emissions 0.469
Reduce the number of polluted areas 0.417
Promote clean energy generation 0.113
λmax 3.287
CR 12.797
Protect the coastal economic–environmental system 0.575
Create jobs 0.305
Improve access to energy resources 0.120
λmax 3.377
CR 16.820
Improve hydrocarbon production 0.607
Generate energy savings 0.287
Generate more resources from operation 0.107
λmax 3.292
CR 13.033
Maximize profits 0.314
Save energy from extractive activities 0.087
Comply with the country’s environmental rules 0.599
λmax 3.387
CR 17.276
Table 11. Summary of the pair-wise comparisons for the resulting goals and strategies.
StrategyReduce Electrical Energy
Consumption Due to
Extractive
Activities
Reduce the Volume of EmissionsProtect the Coastal Economic–Environmental SystemImprove
Hydrocarbon
Production
Comply with the Country’s
Environmental Rules
Infrastructure Approach0.3330.3060.3220.3410.299
Development of an Environmental Management System0.2850.2310.2800.2420.313
Introduction of New Progressive Technologies0.1900.2730.2390.2140.211
Reducing the Risk of Oil Spills During Production0.1180.1130.0990.1230.109
Prevention of Damage from Hurricanes0.0740.0760.0600.0800.068
Table 12. Strategic system of indicators for sustainable environmental and economic development.
DimensionOil and Gas Industry SubsystemEconomic SubsystemInfrastructure SubsystemSocial SubsystemControl SubsystemEnvironment and Resource Subsystem
1234567
ExistenceHydrocarbon production
Number of rigs
Refinery capacity
Gross domestic product
Share of national income in total budget
Volume of investments in fixed capital per capita
Provision of population with passenger transport
Share of well-equipped housing with hot and cold water, sewerage, and central heating
Share of population with incomes below subsistence level
Expenditures of regional budget on social policy per capita
Number of management staff
Total number of structural units
Percentage of specialists with basic education in management
Excess limits on emissions and discharges of pollutants and waste disposal by enterprise
Cost of internal natural resources
EffectivenessPatents in oil and gas sector
Maturity of oil fields
Share of high-quality oil
Share of engineers in workforce
Profit of economic entities per capita
Ratio of export volumes and gross national product
Unemployment rate
Share of respondents who consider functioning of infrastructure to be satisfactory
Commissioning of residential buildings
Share of citizens who received social services out of total number of applicants
Natural rate of increase (decrease) in population
Infant mortality rate
Target budget execution
Share of respondents who positively assess work of governing bodies
Number of days to open business
Share of cases in courts considered within established time frame
Share of territories in country that meet requirements
of environmental protection
Loss of fuel and energy resources
Share of recycled industrial and household wastes
Freedom of actionOil and gas reserves
Share of electric generation that depends on hydrocarbon sector
Country’s credit rating
Debt of country’s NOC
Share of economically active population
Share of entrepreneurs who have positive assessment
for improving entrepreneurial climate
Growth rate of disposable income of population
Share of respondents who consider health care system to be satisfactory
Share of respondents who positively assess level of education system
Share of extra-budgetary funds invested in development of region’s infrastructure
Share of household expenditures on purchasing goods and paying for services
Ratio of amount of accrued wages to cost of living (for working population)
Share of non-budgetary organizations in social sphere
Average length of time for issuing design/construction permits
Share in total volume of data information transmitted via modern communication channels
Investments in fixed capital aimed at environmental protection and rational use of natural resources
Costs of research and environmental accounting
Share of extra-budgetary funds allocated to solve environmental problems
SafetyNumber of oil spills by year
Polluted areas due to oil and gas activities
Tons of greenhouse emissions
Degree of depreciation of fixed assets
Volume of personnel shortage in economy
Share of respondents who positively assess system for guaranteeing business security and protection of property rights
Depreciation rate of fixed assets of region’s infrastructure
Obsolescence of main laboratory equipment at educational institutions
Suicide rate
Juvenile crime rate
Number of officially registered public organizations
Level of consent in society
Share of obsolete computer equipment used by management bodies
Concentration of pollutants in atmosphere
Number of people living in areas prone to natural disasters and emergencies
Increases (decreases) in air and water-related diseases in population
AdaptabilityUse of electricity efficiency in oil gas sector
Reuse of water in oil industry
Share of renewal of fixed assets of enterprises
Share of average number of employees of small enterprises in total average number of employees employed at enterprises and organizations
Share of working-age population employed in service sector
Variety of service businesses
Level of professional education of social workers
Introduction of new technologies to social sphere
Degree of decentralization of regional power
Level of informatization of management bodies
Number of sanctions for violation of environmental standards and requirements
Share of passenger and cargo transportation using environmentally friendly transport
CoexistenceImports and exports of energy
Share of oil and gas production by country’s NOC
Labor turnover
Share of organizations operating in country but registered in another territory
Number of rolling stock of passenger transport equipped for people with disabilities
Volume of paid services per capita
Income concentration index (Gini coefficient)
Number of refugees (internally displaced persons)
Ratio of repeated requests to total number of requests from citizens
Share of government agencies equipped for visits by persons with disabilities
Import–export of water pollutants in territory
Number of dying and destroyed green spaces
Table 13. Values of criteria and performance indicators for the oil industry’s environmental efficiency programs in Mexico.
Type of EfficiencyName of IndicatorCriteria WeightPointsCharacteristics of IndicatorsRecommended
Values of Indicators in Points
EnvironmentalEnvironmental impact of electric consumption from oil extraction activities (coefficient of anthropogenic pressure)0.410Indicator increases by 0.3 or morey ≥ 5
5Changes from 0 to 0.3
0Indicator increases
Degree of compliance with environmental standards set in Mexico’s transition strategy0.310Full compliance with environmental standardsy ≥ 5
5Minor deviation
0Significant deviation
Costs for funding energy transition at a company0.310Sufficient budget allocated to energy transition projectsy ≥ 5
5Average budget allocated to energy transition
0Insufficient budget to fund new projects of energy transition
Table 14. Recent IMP technologies and their environmental potentials [73].
Generation of Intellectual Property of IMPEnvironmental Potential
Seismic mapping technology for new petrophysics workflows integrated with rock physics and
petroelastic modeling
Deposits and their productive parts can be detected more efficiently, reducing the energy expenditure that would occur in more difficult extractions. Obtaining seismic attributes allows the mapping of geologically significant trends in data, correlation with wells, and use in geostatistical models.
Technological platform to improve oil production in wells by pneumatic pumpingThis method of enhanced oil recovery by adding pressure to the well is based on the use of petroleum gas to form a water–gas mixture that significantly reduces the amount of gas consumed irrationally and the carbon footprint.
Design of comprehensive solutions for flow assuranceFlow assurance is used to evaluate the effects of fluid hydrocarbon solids and their potential to disrupt production owing to deposition in the flow system. They have the potential to cause many problems, including asphaltene deposition, wax deposition, hydrate formation, corrosion and erosion, and emulsions.
Catalyst technology to produce ultralow sulfur diesel under medium- and high-pressure conditionsThe sulfur content of diesel fuel has been reduced to ultralow levels by environmental regulations in many countries with the aim of reducing harmful emissions from diesel engines and improving air quality. As a result, research on the production of ultralow sulfur diesel has gained enormous interest in the scientific community around the world.
Technological platform for pipelines based on real-time monitoring, thermography, and corrosion inhibitorsReal-time monitoring can produce more efficient outcomes for managing production and transport and reducing excess energy from these activities.
Gasoline additives with traceability propertiesAdditives can improve various properties of diesel fuel. Some can improve ignition and combustion and be catalysts for regeneration.
Table 15. Intellectual property indicators compiled by the Mexican Petroleum Institute [73].
YearPatents/Registrations of Models and Industrial DesignsPatent Applications/Applications for Registration of Utility Models and Industrial DesignsRegistered Trademarks/Notices and Trade NamesFree Use Requests and Public Domain Inventions
2010171517n.a.
2011161122n.a.
2012181625n.a.
20136132211
201411132813
20151422177
20161218281
20171216331
20181411187
20199163n.a.
20201214n.a.1
2021149n.a.n.a.
202296n.a.1
Disclaimer/Publisher’s Note: The statements, opinions and data contained in all publications are solely those of the individual author(s) and contributor(s) and not of MDPI and/or the editor(s). MDPI and/or the editor(s) disclaim responsibility for any injury to people or property resulting from any ideas, methods, instructions or products referred to in the content.

