Article

Efficiency of Low-Carbon Technologies Implementation at Non-Ferrous Metallurgy Enterprises under the Conditions of Carbon-Regulation Development in Russia

by
Alexey Cherepovitsyn
1,
Gennady Stroykov
1,* and
Alexander Nevolin
2
1
Organization and Management Department, Saint-Petersburg Mining University, 21 Line, 2, 199106 St. Petersburg, Russia
2
Luzin Institute for Economic Studies, The Kola Science Centre of the Russian Academy of Sciences, 24a Fersmana St., 184209 Apatity, Russia
*
Author to whom correspondence should be addressed.
Sustainability 2023, 15(24), 16640; https://doi.org/10.3390/su152416640
Submission received: 11 October 2023 / Revised: 4 December 2023 / Accepted: 4 December 2023 / Published: 7 December 2023
(This article belongs to the Special Issue Circular Economy and Mining Ecology Management)

Abstract

:
Carbon markets are highly relevant to the need to regulate man-made greenhouse gas emissions. As the world faces the dangerous effects of global warming, reducing greenhouse gas emissions has become a critical priority for governments, corporations and individuals around the world. Carbon markets offer a way to incentivize and encourage emissions reductions and facilitate a smooth transition to a low-carbon economy. Low-carbon development is possible by building transparent and understandable organizational and economic conditions for the operation of carbon regulation. This article considers the feasibility of introducing energy-efficient technologies at Polymetal International PLC enterprises located in Khabarovsk region, engaged in the mining and processing of non-ferrous and precious metals (gold, silver and copper) in light of the country’s growing attention to the regulation of carbon dioxide emissions. The objective of this study is to model the organizational and economic conditions of the carbon market and estimate the economic and climate outcomes from the implementation of energy-efficient technologies at Polymetal International PLC. This study analyzes the current energy-consumption structure of non-ferrous metallurgy enterprises in Russia and identifies potential areas for the use of energy-efficient technologies. An important aspect is the assessment of government policies and incentives that could facilitate the introduction of low-carbon technologies. It is important to assess the impact of prospective carbon-management plans in Russia on the economic performance of steel companies. The results of this study suggest that the introduction of low-carbon technologies has the potential to significantly reduce energy consumption, lower operating costs and reduce carbon dioxide emissions from non-ferrous metal companies in Russia. However, the successful implementation of these technologies will require significant investment, stakeholder cooperation and political support from the Russian government.

1. Introduction

Due to the ratification of the Paris Agreement, companies, government agencies, society and scientific experts have shown great interest in the problems of greenhouse gas emissions, as well as in the development of technologies to reduce them [1]. A variety of initiatives to decarbonize operations are being implemented at the level of individual companies, but the cumulative effect of ongoing environmental projects is still insufficient to achieve global climate goals. Low-carbon technologies, because of their innovative nature, tend to be technologically and economically challenging to implement. The use of government-regulation tools can increase the interest of companies in expanding decarbonization activities. One of the most common and promising methods of regulating emissions today is carbon pricing [2,3]. These instruments do not oblige emitters to directly reduce the mass of emissions, but at the same time, give them an economic impetus to reduce emissions. The emitters can decide either in favor of the ecological transformation of their economic activity or in favor of payment of the established rates for emissions. The effect of emission-pricing instruments is fundamental to companies’ investment decisions, incentivizing them to adopt low-carbon innovations. Conceptually, carbon pricing can represent both a way to mitigate climate change and the social costs of global warming [4].
Scientists from different countries conduct research on the impact of carbon-pricing systems on the level of national welfare, the rate of decarbonization and the development of individual industries [5,6,7]. However, the results of studies are often contradictory, which indicates, among other things, the presence of a large number of external factors affecting the effectiveness of the policy to reduce emissions within individual countries in different periods of time. The relevance of this topic in the Russian scientific field is explained by two reasons. First, in Russia, carbon regulation is at the stage of development. Secondly, international carbon-pricing systems in the future may have an impact on Russian industrialists. In this regard, it is important to generalize the world’s experience in the development of government initiatives in the field of carbon dioxide handling.
Currently, there are two main tools in the world in the field of price regulation of carbon dioxide emissions—a tax on carbon emissions and emissions trading systems (ETSs) [8]. Both instruments are based on material incentives for market participants to intensify investments in the best technologies that allow for the maximum reduction in greenhouse gas (GHG) emissions. At the same time, there is a fundamental difference between them.
Carbon tax implies the establishment of a certain tax rate and the subsequent collection of funds depending on the volume of gas emitted during the production process [9]. At the same time, the established tax rate for emissions can be applied at different stages of the value chain of products and can be focused both directly on the company–producer and on the final consumer.
Emissions trading systems are formed by establishing mandatory quantitative targets for emission reductions for all market participants (emitters of emissions) and the distribution of the corresponding emission quotas among them [10]. Participants in this market have the opportunity to buy allowances to compensate for their own excessive emissions or to sell previously purchased allowances to other participants, which also contributes to the overall efforts to reduce emissions.
The GHG tax has a fixed monetary levy rate, while the ETS fixes maximum emission rates. In the case of an emissions tax, an additional benefit to investors can be created by significantly higher and more predictable prices [11]. At the same time, higher energy prices can negatively affect the competitiveness of energy-intensive industries and promote the relocation of production to those countries where the policy of reducing CO2 emissions is less active. The economic effect of ETS operations is obtained due to savings on the purchase of quotas in case of their irrelevance, as well as the sale of free quotas by emitters who were able to reduce the amount of their actual emissions, due to the introduction of the best-achieved technologies.
As far as Russia is concerned, Federal Law No. 296-FZ dated 02.07.2021 “On limiting greenhouse gas emissions” came into force on 30 December 2021, and a number of related laws and bylaws are also in the process of development. The Russian Federation is a party to the Framework Convention (Federal Law “On Ratification of the UN Framework Convention on Climate Change”), the Kyoto Protocol (Federal Law “On Ratification of the Kyoto Protocol to the United Nations Framework Convention on Climate Change”) and the Paris Agreement (Russian Government Resolution No. 1228 of 21 September 2019 “On Adoption of the Paris Agreement”).
In 2020, the Russian Federation declared its first nationally determined contribution under the Paris Agreement. The state reported a target for limiting greenhouse gas emissions, which is a reduction in greenhouse gas emissions by 2030 to 70 percent relative to 1990 levels, taking into account the maximum possible absorption capacity of forests and other ecosystems and subject to the sustainable and balanced socioeconomic development of the Russian Federation.
The Russian Government Order No. 3052-r dated 29 October 2021 approved the strategy of socioeconomic development of the Russian Federation with low greenhouse gas emissions until 2050.
In addition, effective economic levers offered in the EU for the purposes of carbon regulation, such as the mechanism of transboundary carbon regulation, are emerging. In a situation when the sales of products will need to be reoriented to other markets, it is important to understand what structure of greenhouse gas accounting is proposed in the territory of the Russian Federation. In this regard, the objectives of introducing a cross-border carbon tax appear, preventing the withdrawal of carbon-intensive industries from the EU to countries where carbon fees are low or not charged and leveling the playing field for competition between EU companies that pay environmental fees and charges and companies from third countries where such charges are not levied.
When introducing a cross-border carbon tax for the Russian economy, there are key risks:
  • Loss of sales markets for traditional energy carriers—the raw material structure of the Russian economy and the dependence of budget revenues on the export of hydrocarbons make the Russian economy the most vulnerable to the consequences of global energy-transition processes;
  • Loss of competitiveness in the international division of labor—almost all of Russia’s key export partners are planning to abandon hydrocarbon fuel in the near future and replace it with “green energy”;
  • Technological lag. The lack of a regulatory system to incentivize the Russian industry to switch to new technologies may lead to a deep technological lag and the loss in foreign markets for Russian exports;
  • Direct losses of Russian exporters from the introduction of a cross-border carbon tax. According to various estimates, from the introduction of a border carbon tax, Russian exporters of carbon-intensive goods will lose annually from 0.5 to 7.5 billion euros, which will go to the EU economy, but not to the Russian budget.
Based on the above, the national system of carbon regulation in Russia should simultaneously provide the solution to several problems [12,13]:
  • Minimizing the costs of Russian exporters from the EU carbon tax. In accordance with Directive 2023/958/EU [14] and Regulation 2023/956/EU [15] on the carbon border adjustment mechanism, at the border, payments from the accrued amount of carbon tax will be deducted from the amount of carbon payments paid in the country of origin of the goods;
  • Elimination (minimization) of subsidies to EU industry at the expense of Russian exporters (environmental payments of Russian companies should be directed to the Russian budget, not to the EU budget);
  • Fulfillment of international climate agreements with minimal damage to Russian industry; stimulation of Russian industry to transition to a new technological mode and more energy-efficient technologies.
The aim of this study is to model the conditions of carbon regulation and scenarios of economic results for non-ferrous metallurgy enterprises in the implementation of low-carbon projects.
The objectives of this study are to assess the problems and prospects of carbon regulation in the Russian industry and in particular in non-ferrous metallurgy, to model the organizational and economic conditions of the carbon market and propose scenarios for the distribution of quotas for GHG emissions and to determine the economic and climate efficiency of Polymetal’s low-carbon development projects under the modeled scenarios.

2. Literature Review

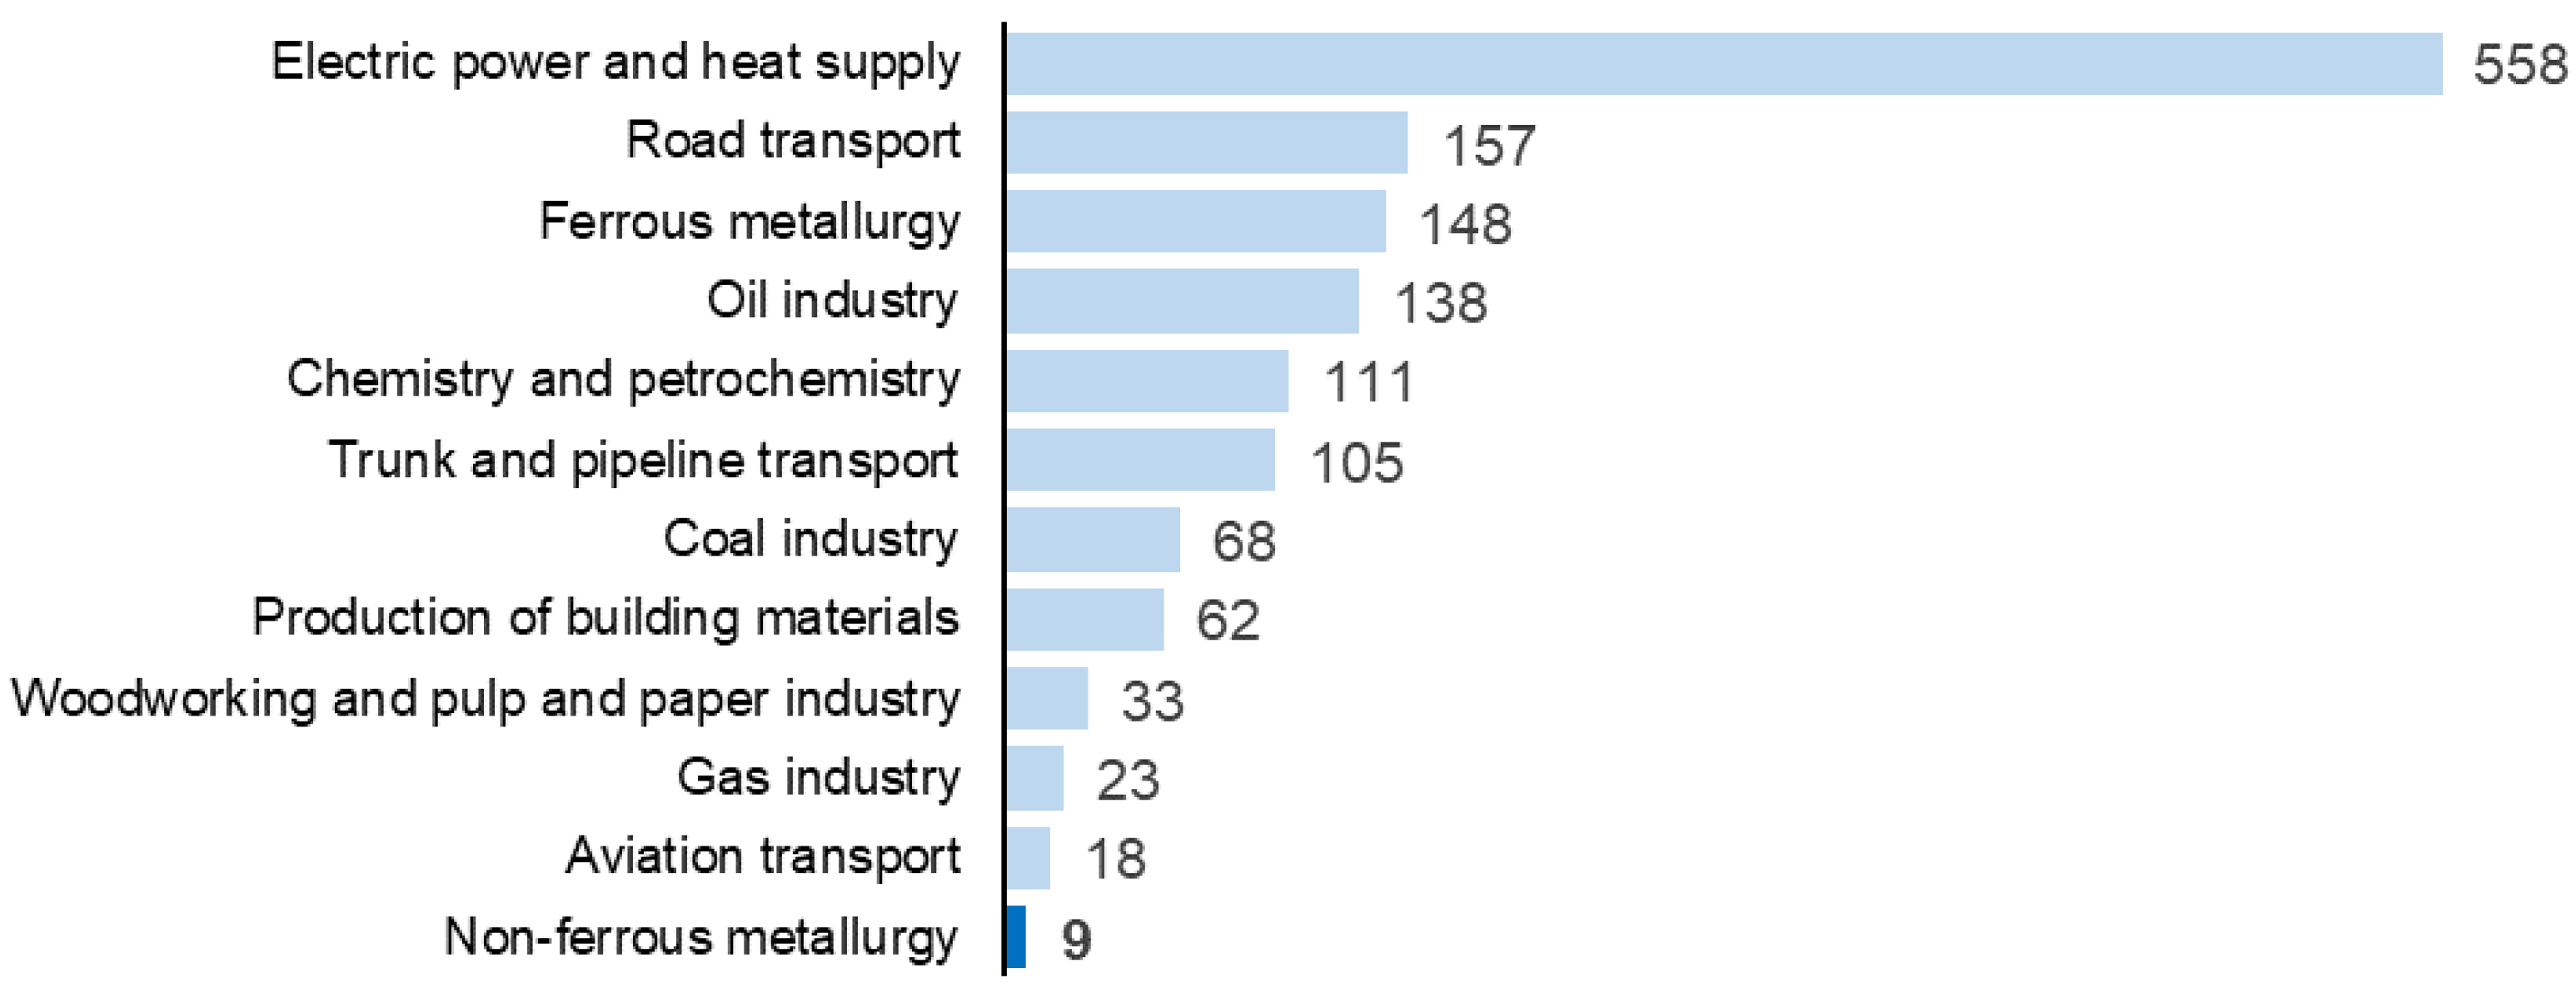
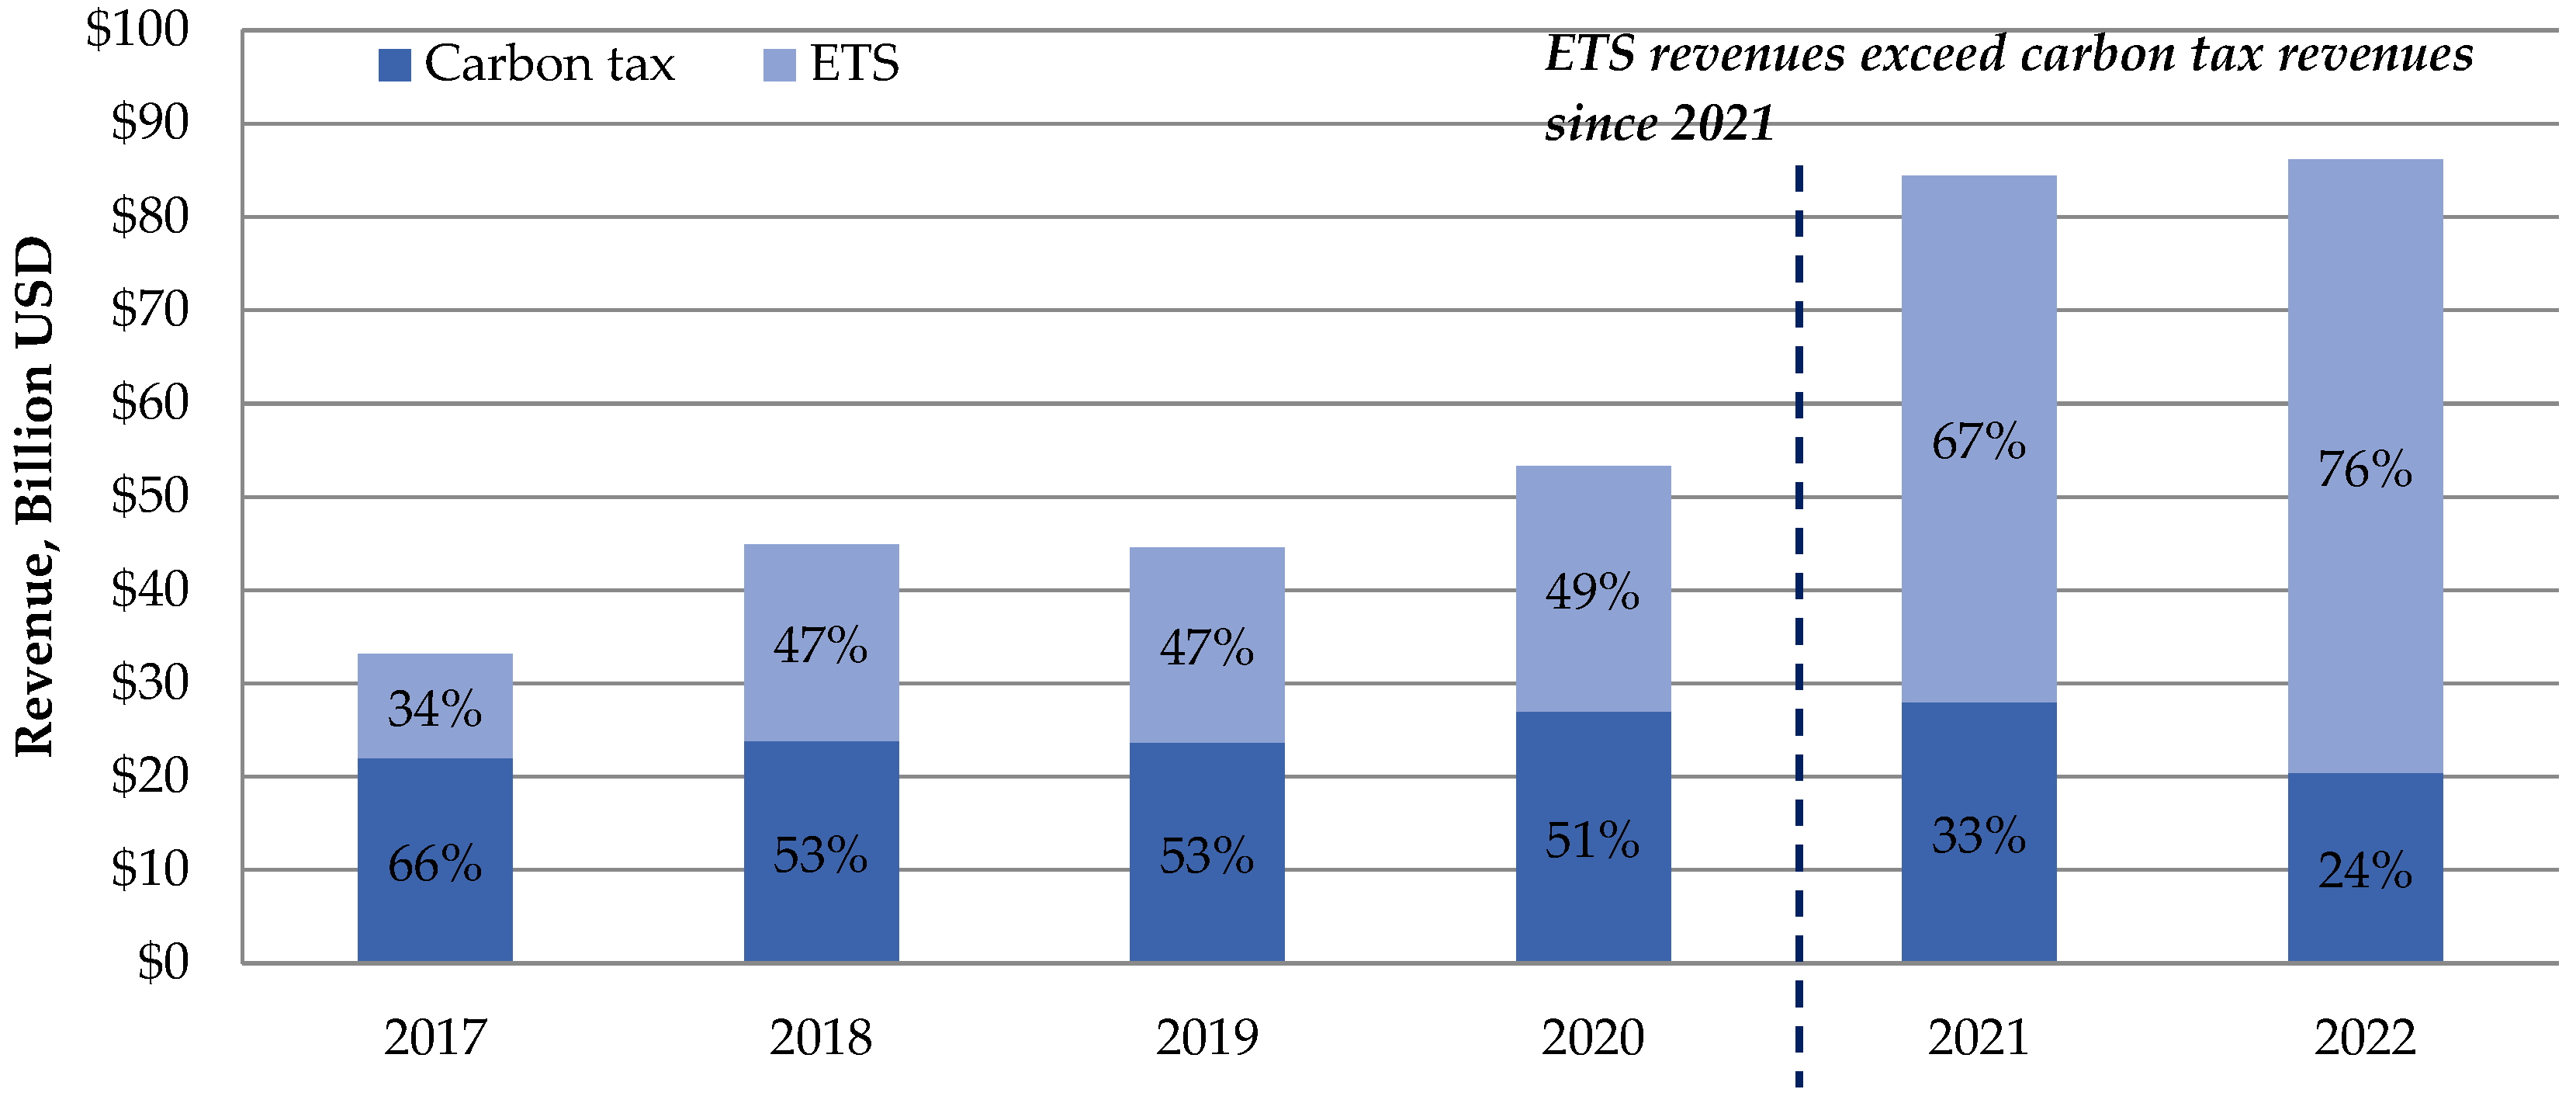
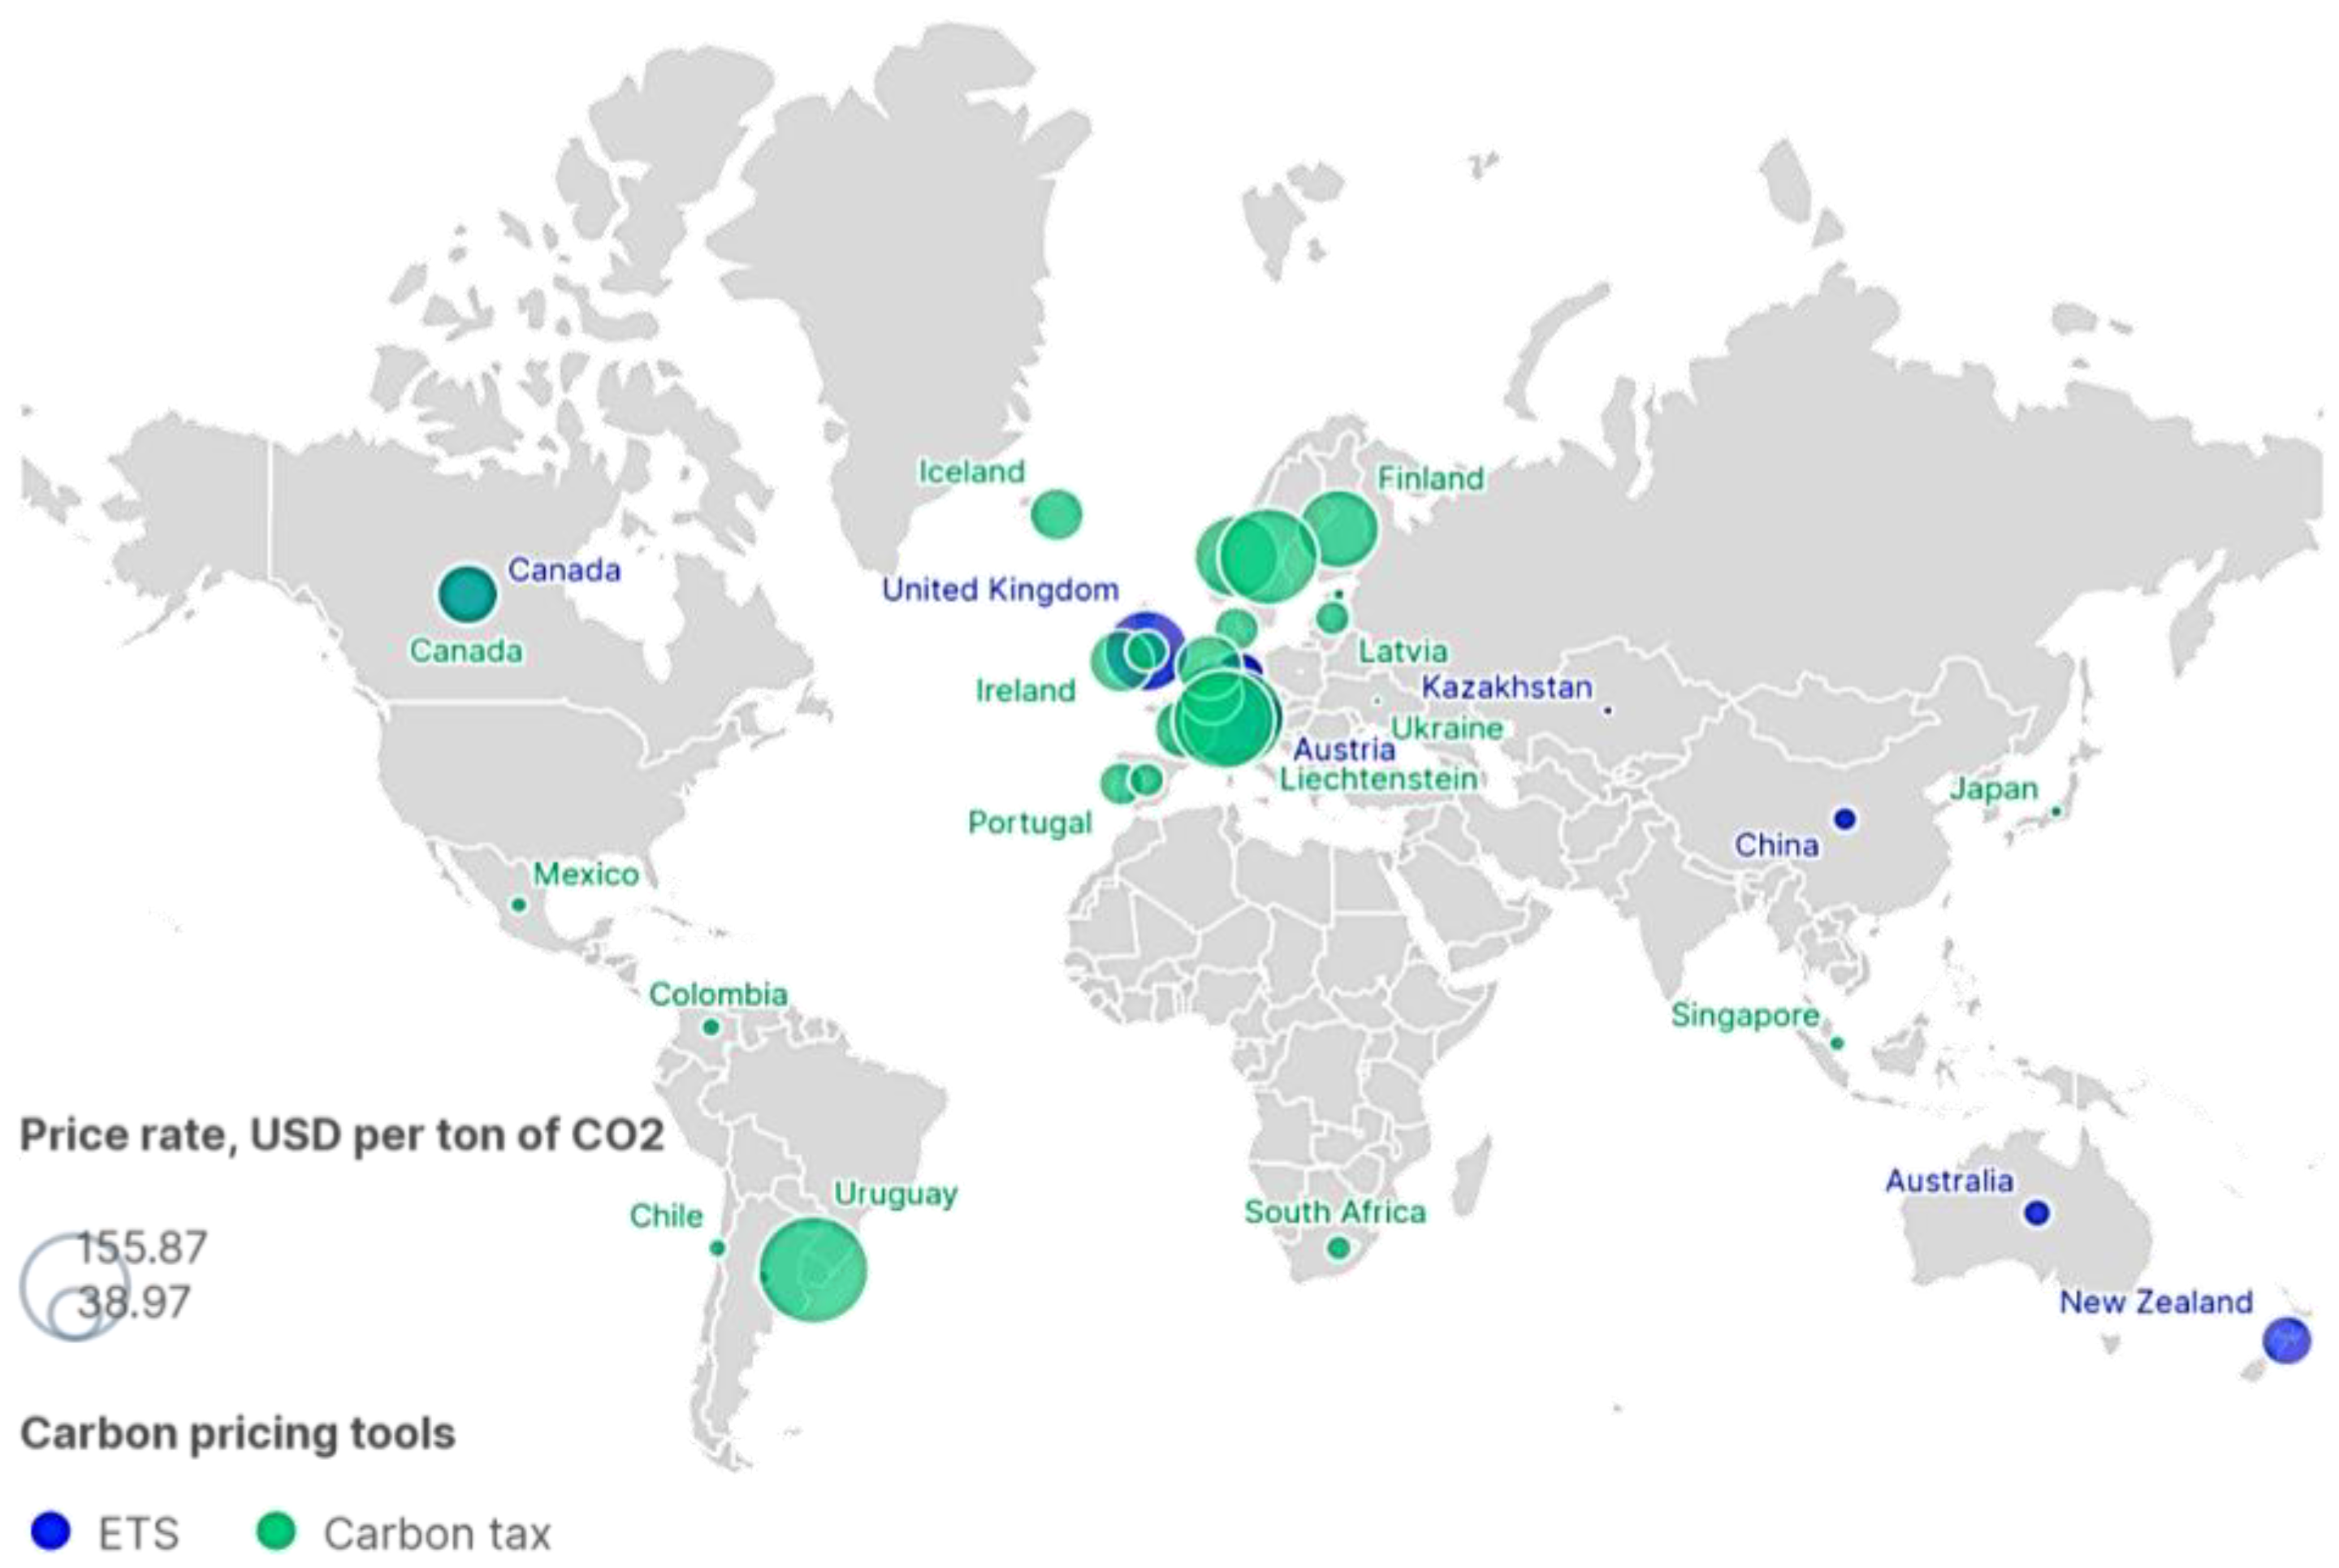
2.1. Brief Description of the Current Situation

Today, the topic of industrial decarbonization is particularly relevant in the context of the actualization of sustainable development trends, the transition to a circular economy and the choice of low-carbon development paths [16,17,18,19,20]. The priorities of industrial enterprises are related to improving energy efficiency and reducing the carbon intensity of production [21,22,23]. Enterprises of extractive industries need to make technical and economic assessments of the energy efficiency of the energy supply of their enterprises [24,25]. Of great importance for mining enterprises is the assessment and analysis of risks in the design [26], taking into account modern requirements for technology and the organization of the production process [27], which should be correlated with the solution of environmental problems in the conduct of industrial activities of enterprises [28]. When solving these problems for modern enterprises, it is necessary to be oriented to the conceptual framework of circular economy models in industry [29].
The issues of ensuring and the state regulation of the process of decarbonization of industrial enterprises are reflected in many Russian and foreign publications [30]. In the study by Tao et al. (2023), the role of renewable energy research and development expenditures in the framework of environmental regulation is defined [31]. Liu et al. (2022) developed the mechanism of environmental regulations on carbon-emission efficiency [32]. Zheng et al. (2023) considered regulatory projects in the context of corporate environmental performance [33]. The role of the state in these issues remains the most significant in the context of solving organizational and regulatory problems and challenges [34,35].
As of mid-2023, there are 73 active carbon-pricing instruments (CPI) in the world, and 4 more are planned for implementation, of which 39 are ETS and 38 are carbon taxes (including initiatives under consideration) [36]. Compared to 2021 and 2020, this is an increase of 10 and 16 instruments, respectively. The instruments in place cover approximately 23% (11.66 Gt CO2-eq) of the total global GHG emissions, which is a big jump compared to the 2020 value (15.1% of total emissions). The achieved increase is largely due to the start of the operation of China’s national ETS (+7.28% of total emissions).
The application of the carbon-pricing mechanism allows the government to not only incentivize entities to reduce CO2 emissions but also to receive additional income from tax revenues and emission fees. Carbon revenues can be redistributed both for specific climate goals (low-carbon innovation and infrastructure and mitigation programs) and directly to the general budget. Global experience suggests that revenues from the emissions trading system are more likely to be used for green investments (energy efficiency, low-carbon transportation and renewable energy) while carbon tax revenues are more likely to be used in general funds [37]. In some ETSs, financial revenues from trading can be used to support energy-intensive industries.
In 2021, revenues from the ETS system began to exceed revenues from the CO2 tax for the first time and continued the trend into 2022, with revenues totaling USD 86 billion. In 2022, revenues totaled USD 86 billion, a significant increase compared to 2020. Of this, revenues from taxes amounted to USD 20 billion, and from various ETSs about USD 66 billion. These revenues amounted to about USD 1.5 billion (Figure 1).
The structure of financial revenues from the two instruments has changed significantly over time. Up to and including 2016, carbon taxes accounted for more than 70% of revenues. In 2020, the revenue structure almost flattened out, with 51% of the revenue (about USD 27 billion) coming from carbon taxes and the remaining 49% (USD 25.9 billion) from emission allowances in the various ETSs. In 2021, revenues from the ETS exceeded revenues from carbon taxes for the first time. First, this indicates that prices in ETSs are rising faster than in fixed-price instruments. The second factor is the increasing share of allowances auctioned rather than allocated for free.
One of the obvious advantages of the state regulation of carbon dioxide in the form of an emissions tax is the simplicity of its implementation, as it does not require the creation of a completely new institutional infrastructure. The main task and problem of using this tool is the need to determine the optimal tax rate that would stimulate emissions reduction, rather than being an additional restriction on commercial activity. According to research by experts from The World Bank Group [39], in order to achieve the target set by the Paris Agreement as soon as possible, the minimum tax rate on carbon dioxide emissions should be in the range of 40 to 80 USD/t CO2e. The minimum carbon tax rate should be in the range of USD 40 to USD 80/t CO2e.
As of March 2023, direct carbon prices have reached record levels in many regions, but prices remain below the recommended level in most regions (Figure 2). Uruguay has the highest carbon tax rate at USD 155.87 per ton of carbon emissions, followed by Liechtenstein and Switzerland at USD 130.81 per ton of carbon emissions. The lowest tax rates are in Poland at USD 0.08, Ukraine at USD 0.82 and Japan (USD 2.17) [36].
While carbon tax rates remained relatively unchanged in 2020, they increased by an average of about USD 4.6/t CO2e in 2021. In 2022, they increased by a further USD 5/t CO2e, and in 2023, they increased by a further USD 5/t CO2e. The rate for March 2023 was USD 27.8/t CO2e, an increase of USD 12.2/t CO2e. The rate for March 2022 was USD 12.2/t CO2e higher than in 2020. Most of the observed price increases are due to previously planned changes and the phase-in of tax-rate increases (e.g., Canadian provinces, Ireland, Singapore and South Africa). In other cases, the rate revision was part of a broader fiscal reform (e.g., Norway). At the same time, the reaction of many countries to price hikes in energy commodities, due to the war in Ukraine, may affect the timing of the plans. For example, in April 2022, Indonesia announced that it would postpone the introduction of a carbon tax due to the economic impact of high energy prices, and Mexico announced exemptions from the carbon tax applied to gasoline and diesel.
The magnitude of the financial revenues from the ETS depends on several factors at once: the reach of the ETS itself (the number of market participants), the amount of auctioned allowances available and current allowance prices. By the end of 2022, systems around the world collectively collected more than USD 161 billion [41]. The significant increase in the value of cash receipts from ETS operations is mainly due to a significant increase in the average price of carbon dioxide emission allowances in most of the operating ETSs (Figure 2 and Figure 3).
The increase in the price of allowances has been observed in all initiatives since 2016 [41]. Over the last two years, the average value of emission allowances has increased significantly. The annual average value increased almost three times from 9.92 to 25.7 USD/t CO2e. The average annual value has increased almost three-fold from 9.92 to 25.7 USD/t CO2e. At the same time, in all ETSs, there is a large variation between the maximum and minimum values of the price of allowances during the year. Thus, in 2016, in the EU ETS, the minimum price was fixed at USD 4.4/t CO2e. The minimum price was fixed at USD 4.4/t CO2e (05.09.2016), while the maximum price reached USD 8.7/t CO2e (04.09.2016). The minimum price was USD 4.4/t CO2e (04.01.2016); i.e., the relative price change was about 99%. In 2020, with a minimum price of USD 16.8/t CO2e (04.01.2016), the relative price change was about 99% USD/t CO2e (18.03.2020) and a maximum price of USD 36.2/t CO2e (18.03.2020). At a minimum price of USD 16.8/t CO2e (14.09.2020), the change reached the 115.1% mark. The same pattern is observed in South Korea, where the relative change between the maximum and minimum price increased from 79.4% to 123.6%. This phenomenon can be primarily attributed to the significant decline in output across many industries resulting from the COVID-19 pandemic that began in early 2020. The general economic downturn caused a decrease in demand for free allowances, and this led to a significant drop in the price of allowances. In the EU ETS, the price has fallen to USD 16.8/t CO2e (18.03.2020) from USD 26.7/t CO2e (18.03.2020). The price was expected to fall to USD 26.7/t CO2e at the end of 2019 (19.12.2019). Starting in late 2020, average emission allowance prices began to rise again and rose to historical highs in several systems in 2021. The largest share of this increase was observed in the ETS, where prices respond to market conditions (advanced economies). Since the end of February 2022, the price situation has been highly volatile in many systems.
The effectiveness of the ETS in the power sector and industry is confirmed by statistics [36,38,41]. For example, CO2 emissions from power plants under the Regional Greenhouse Gas Initiative (RGGI) have fallen by 47% since 2008, and in the UK, coal supplied only 5% of electricity in 2018, down from 39% in 2012. In California, industrial emissions fell by 4.6% between 2013 and 2017, despite a GDP growth of nearly 17%. In the cases examined, carbon pricing was the main (though not the only) driver of policy.

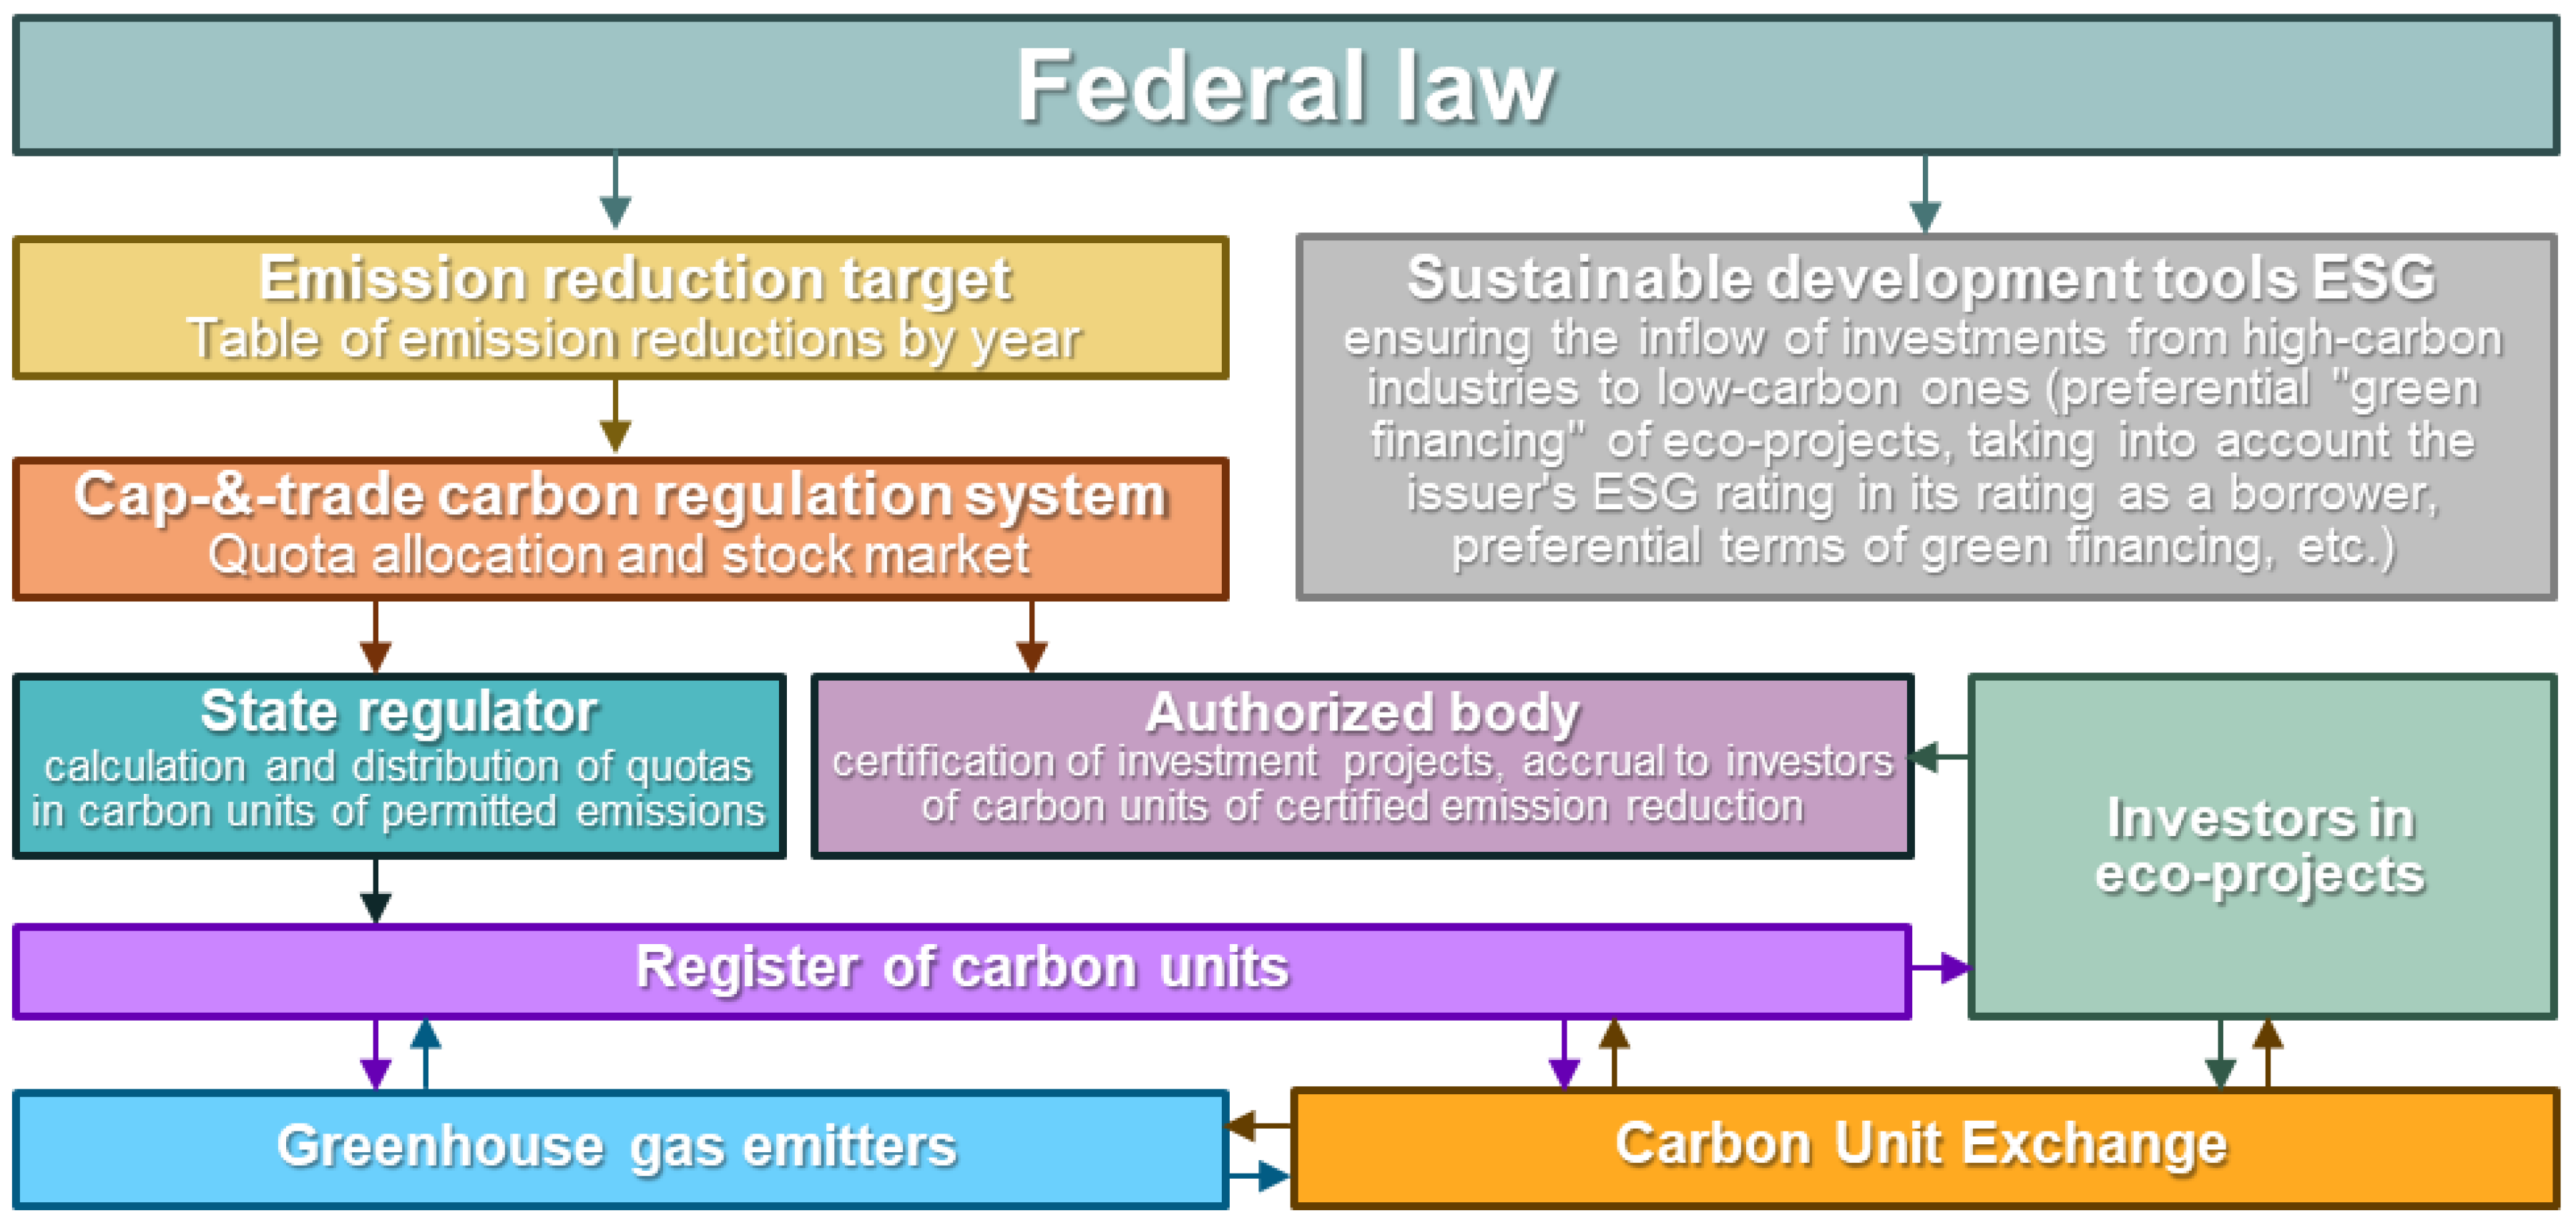
2.2. Carbon Regulation in Russia

To date, the Russian government has already begun to take concrete steps to implement its own national system of carbon regulation. The RF Government Order No. 3052-r dated 29 October 2021 approved the strategy of the socioeconomic development of the Russian Federation with a low level of greenhouse gas emissions until 2050, which defines measures to ensure by 2030 the reduction in greenhouse gas emissions to 70% relative to the 1990 level, taking into account the maximum possible absorption capacity of forests and other ecosystems and subject to the sustainable and balanced socioeconomic development of the Russian Federation [42,43]. Since 30 December 2021, the Federal Law No. 296-FZ “On limiting greenhouse gas emissions” dated 2 July 2021 has come into force [44], and a number of related laws and bylaws are also in the process of development.
The Federal Law “On limiting greenhouse gas emissions” provides for the maintenance of a greenhouse gas inventory as a systematized set of data based on official statistical information. The list of greenhouse gases for which accounting is carried out includes carbon dioxide, methane, nitrous oxide, sulfur hexafluoride, nitrogen trifluoride, some hydrofluorocarbons and perfluorocarbon [44]. When preparing the inventory, data from the greenhouse gas emissions register containing reports of regulated organizations on GHG emissions are used. For this purpose, in the period up to 1 January 2024, legal entities and individual entrepreneurs (regulated organizations), whose economic and other activities are accompanied by greenhouse gas emissions of 150 and a thousand more tons of CO2e per year, are obliged to provide reports on greenhouse gas emissions. Starting from 1 January 2024, regulated organizations, whose economic and other activities are accompanied by greenhouse gas emissions of 50 and a thousand more tons of CO2e per year, are also obliged to submit a report [45]. The resolution of the Government of the Russian Federation “On Approval of Criteria for Classifying Legal Entities and Individual Entrepreneurs as Regulated Organizations” somewhat narrows the range of regulated organizations. [46]
The Federal Law also provides for the validation of climate projects and carbon units. Under the climate project, a set of measures to reduce (prevent) greenhouse gas emissions or increase the absorption of greenhouse gases is understood. The project executor is a legal entity, an individual entrepreneur or an individual implementing a climate project. The criteria for classifying projects as climate projects are established by the Order of the Ministry of Economic Development of the Russian Federation [47].
A carbon unit is understood as a verified result of the implementation of the climate project, expressed in the mass of greenhouse gases equivalent to 1 ton of carbon dioxide; i.e., one unit corresponds to 1 ton of the reduction, prevention or increase in the absorption of greenhouse gases [44]. The value of a carbon unit in this case can be recognized in the amount of 2000 rubles, and if carbon units are traded at organized trades, the weighted average price determined by the trade organizer is according to the last 20 trading days, but not less than 2000 rubles [44]. Carbon units can be transferred or offset. However, at the moment, there is no information in the Law on Greenhouse Gas Emissions or in the Federal Law of 21 November 2011 № 325-FZ “On Organized Trading” that states that carbon units are recognized as a commodity for the purposes of circulation at organized trading.
Thus, the Federal Law “On limiting greenhouse gas emissions” creates the contours of the regulation of activities accompanied by GHG emissions: it introduces mandatory carbon reporting and sets the basis for the national system of trading in carbon units, but it does not specify targets and penalties for exceeding quotas for GHG emissions. These aspects are planned to be disclosed in separate regulations. Thus, the Ministry of Economic Development of the Russian Federation is developing a draft government decree on the approval of targets for reducing greenhouse gas emissions for sectors of the Russian economy [46]. If we consider the limit indicators for the industries for 2030, the following values are tentatively indicated in the draft (Figure 4).
The draft decree also outlines targets for economic sectors. Thus, the limit of net greenhouse gas emissions for 2030 for the energy sector is 894 million tons of eq. CO2: 558 million tons for the power and heat supply, 138 million tons for the oil industry, 105 million tons for the main pipeline transport, 68 million tons for the coal industry and 23 million tons for the gas industry [47,48].
The following standards are set for the industrial production sectors: ferrous metallurgy—148 million tons of eq. CO2; non-ferrous metallurgy—9 million tons; production of construction materials—62 million tons; chemistry and petrochemistry—111 million tons; and forestry, woodworking and the pulp and paper industry—33 million tons. In total, including emissions from fuel combustion, industrial production accounts for 405 million tons of eq. CO2 [49,50].
The transport industry needs to meet 186 million tons of eq. CO2: road transport—157 million tons, aviation—18 million tons, railway—9 million tons and maritime and inland waterway transport—2 million tons.
Figure 4. Emission targets for 2030 by industry sector, million tons of CO2. Source: compiled by the authors based on [49,50].
Sustainability 15 16640 g004
In general, the picture of carbon regulation in Russia can be depicted schematically (Figure 5).

3. Materials and Methods

In March 2022, the State Duma of the Russian Federation adopted the Federal Law providing for the experiment on reducing greenhouse gas emissions and achieving “carbon neutrality” in the territory of certain regions of the country [51]. At the initial stage, the experiment is supposed to be conducted only on the territory of the Sakhalin Region, from 1 September 2022 to 31 December 2028, but the law allows one to further expand the geography of its application to other subjects of the Russian Federation. The location of the first climate experiment was not chosen by chance according to the inventory of greenhouse gas emissions conducted by the Izrael Institute of Global Climate and Ecology. According to the inventory of greenhouse gas emissions conducted by the Y.A. Izrael Institute of Global Climate and Ecology (IGCE), in the Sakhalin Region, the difference between emission and absorption is small and amounts to 1 million 265 thousand tons of CO2-eq of greenhouse gases (12.3 million tons vs. 11.1 million tons) [50].
The draft provides for the payment for greenhouse gas emissions in the case of exceeding the quota. The fee for exceeding the quota is calculated by the regional regulated organization independently by multiplying the amount of greenhouse gas emissions in excess of the quota, taking into account the offset of carbon units and (or) units of quota fulfillment by the appropriate rate of the fee. The rates of payment for exceeding the quota shall be established by the Government of the Russian Federation.
It is proposed to assign the calculation of annual quota exceedances to companies. At the same time, if in the reporting year the company exceeded its quota, its limit for the next year is reduced by the amount of allowed uncovered “register” carbon units in excess. It is proposed that company payments be credited to the budget of the relevant subjects participating in the experiment and used to achieve the goals of the experiment.
Within the framework of the Sakhalin experiment, quotas for each issuer will be set individually based on the reporting provided by companies and the region’s targets for reaching “zero”. It is assumed that the quota for the regional regulated organization will be calculated by using formula 1 in accordance with the methodology for determining projected greenhouse gas emission quotas [52]:
Q i j = M j * S i * k 1 * k 2 + Q j i
  • Q i j —quota for the j-th organization for the next i-th year (tons of CO2e);
  • M j —mass of greenhouse gas emissions of the organization for the base year (tons of CO2e);
  • S i —coefficient of specific reduction in greenhouse gas emissions in the i-th year, determined by taking into account the goal of achieving carbon neutrality by the subject of the Russian Federation (fractions of units);
  • k 1 —coefficient taking into account the technological level of the j-th organization;
  • k 2 coefficient taking into account the ratio of the amount of taxes and fees to the revenue of the j-th organization;
  • Q j i —mass of increase in GHG emissions of the j-th organization in the i-th year, determined by taking into account the best available technologies (tons of CO2).
Thus, when determining the quota, the specifics of the technologies used, sales revenue and the amount of revenue to the budget of the Russian Federation in the relevant sector of the economy, the balance of actual emissions and removal of greenhouse gases and the planned rate of their reductions are taken into account. To fulfill quotas, regional regulated organizations have the right to use their own carbon units and units of quota fulfillment (provided that such units are offset in the register of carbon units).
Thus, the Russian system of emissions regulation is still at the stage of development. Despite this, already in 2023, carbon regulation will have entered an active phase: the first reporting campaign will have been held in the summer of 2023, and the approval of quotas will be on 1 December 2023.
Proposed model: the methodology should provide for the free allocation of a certain share of the quota, the value of which should gradually decrease. At the same time, the carbon units that companies have obtained through the implementation of their climate projects aimed at capturing and reducing emissions should be counted as offsets (companies that implement investment projects aimed at reducing emissions or increasing their absorption have the right to certify their investment project in the authorized body and receive a charge of carbon units on their account in the Registry).
Thus, a gradual reduction in the share of allocated quotas will encourage companies to focus on their own projects to reduce emissions in order to reduce possible additional costs and overpayments for the purchase of missing carbon units to cover their own actual emissions (Figure 6 and Figure 7).
Based on the assumed emission-reduction targets by 2030, the volume of initial allocated allowances for emitting companies will be high (about 85% is allocated to companies, and the remaining 15% is freely traded on the stock exchange). However, it is worth assuming different scenarios for the planned reduction in this share with different steps (from a more gradual reduction in the share—1.5–2% per year to an accelerated version of up to 5% per year).
The cost of carbon units is proposed to be recognized as equal to 2000 rubles, and if carbon units are traded in organized trading, then the weighted average price is determined by the organizer of trade according to the last 20 trading days, but not less than 2000 rubles [53].
It should also be assumed that the amount of payment for excess emissions will increase every year, starting from 2000 rubles per ton. The increase is possible either due to a special increase coefficient for exceeding the quota or another option: fixed rates for each year (e.g., 2025—2 thousand rubles per ton of CO2 equivalent, for 2026—3 thousand rubles, for 2027—4 thousand rubles and for 2028 and further—10 thousand rubles) [54,55].
The indicators considered in the model should demonstrate the feasibility of implementing a climate program in the company’s strategy. The main calculation indicators are:
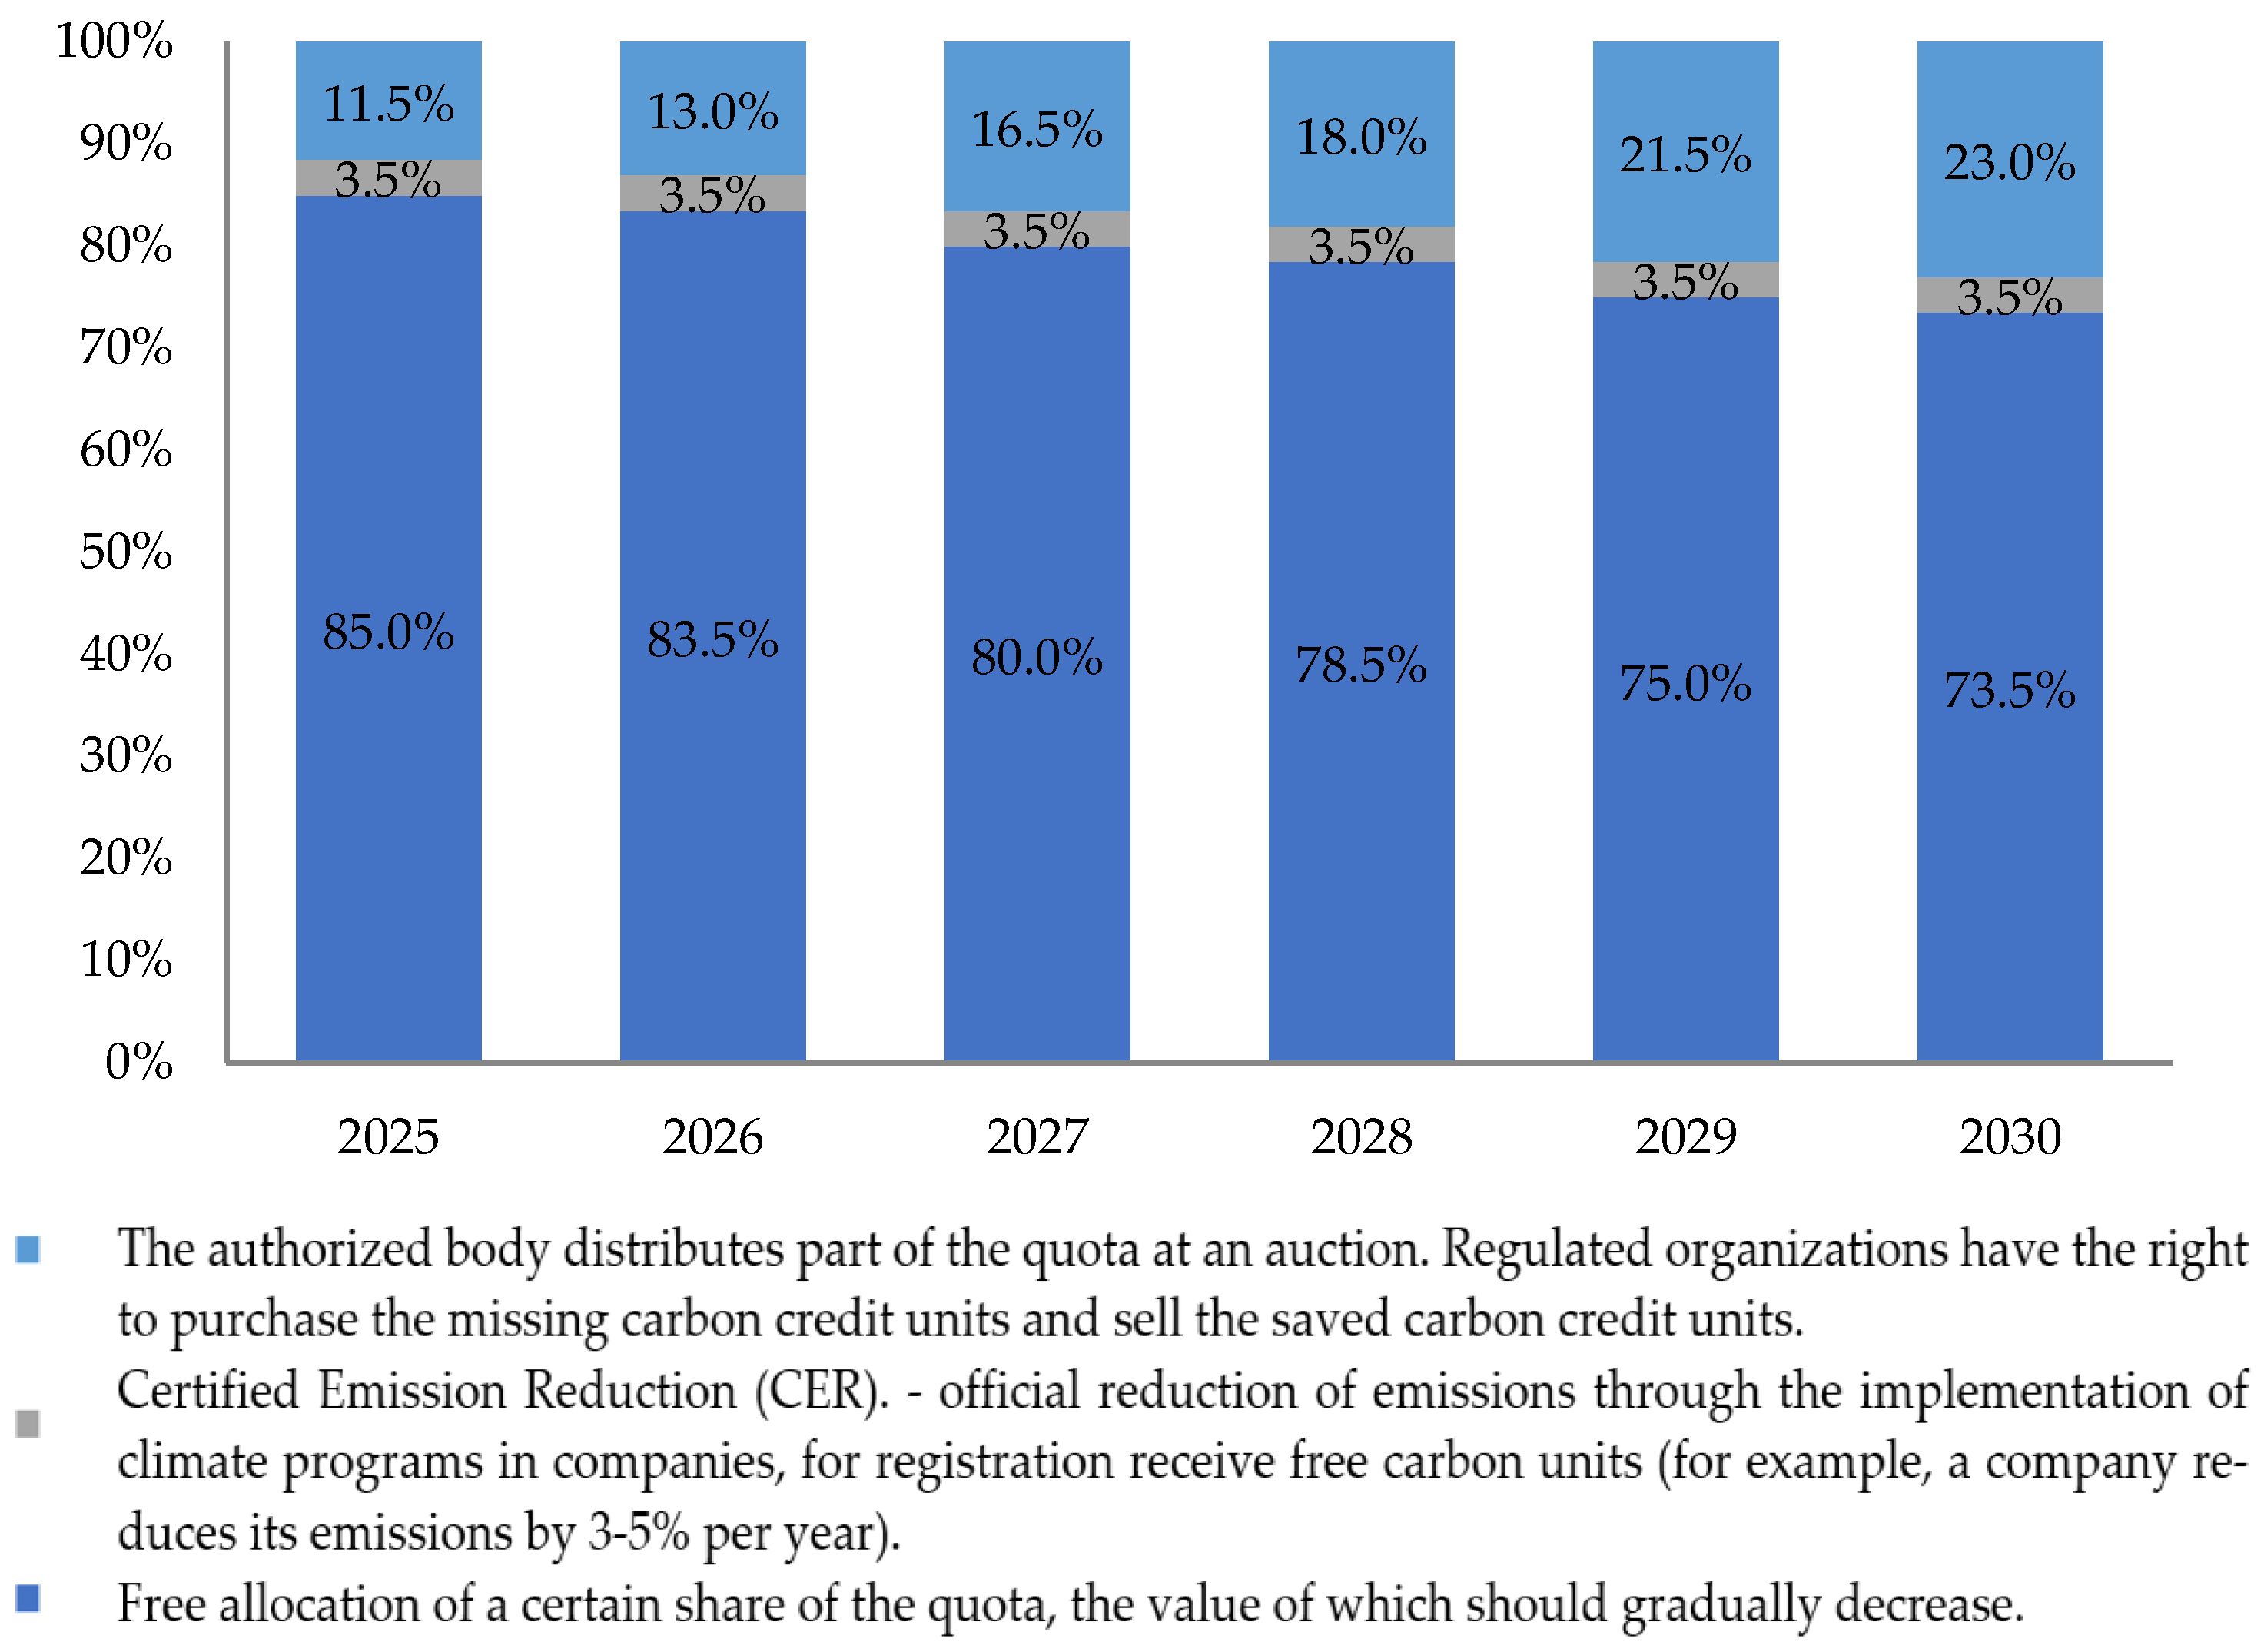
  • Planned emission-reduction indicators: shows the planned annual and total emission-reduction values set according to the company’s strategy (a thousand tons of CO2 per year and total by 2030).
  • Potential carbon tax savings due to own certified carbon units: shows the value of one’s own carbon units registered within the framework of climate-investment projects and registered in the Registry and is assumed to be at least 2000 rubles per carbon unit.
  • Share and volume of uncovered emissions per year: is determined based on the difference between the initial value of allocated quotas and one’s own registered carbon units (the annual value of this indicator varies depending on the degree of the implementation of climate programs and the registered carbon units of the company and the initial quota).
  • Potential payment of carbon units on the exchange: is defined as the value of the cost of buying carbon units on the market to cover the actual emissions of the company (the volume of uncovered emissions multiplied by the cost of carbon units taken at at least 2000 rubles per carbon unit).
  • Cost savings for electricity supply from the grid or fuel for diesel power plants: takes into account savings in operating costs due to the introduction of new equipment (e.g., savings in diesel fuel when replacing with generation from renewable energy sources, etc.).
  • Difference between cost savings and potential carbon unit payments for 2025–2030. Calculated as the difference between operating cost savings, potential carbon tax savings from own certified carbon units and potential payment for uncovered emissions (purchases of carbon units on the market).
  • Critical indicator of the share of free allowances at the beginning of the calculation. An indicator showing the critical value of allocated allowances for the company at which the company, in the case of the calculation scenario, is able to cover potential payments for emissions (i.e., at the identified value of this indicator, the difference between cost savings and potential payments will be equal to 0).
  • Necessary reduction indicator for the leveling of potential costs. Indicators of the necessary value of emissions reduction for the company, at which the company, through the implementation of its own climate programs, will avoid additional financial burden, in the case of the adoption of carbon regulation under the assumed scenarios.

4. Results

4.1. Example of Calculation of a RES-Only Model

The first estimation example was calculated based on the company’s targets, where the reduction in the total emissions through the implementation of RES at its facilities will reach 10% of the 2019 level of about 100 thousand CO2, resulting in total CO2 emissions of about 1080 thousand CO2 (Table 1).
According to the results of the model building, it is clear that with the current goals of reducing emissions through RES, the company will not cover the potential payments for carbon units. Savings in the cost of supplying electricity from the grid or fuel for diesel power plants would range from USD 5.3 to USD 6 million per year (up to USD 28.1 million over the period). The savings would be between USD 5.3 million and USD 6 million per year (up to USD 28.1 million over the period 2025–2030), with potential payments for the purchase of carbon units ranging from USD 5.2 million at the beginning of the period to USD 28.1 million by the end of the calculation period. The potential payments for the purchase of carbon units would start at USD 5.2 million at the beginning of the period and could reach up to USD 12.5 million by the end of the calculation period (where the share of free allocated carbon units will decrease). In addition, the share of free allocated carbon units could reach up to USD 12.5 million. Thus, even in spite of the potential carbon tax savings from its own certified carbon units, which could reach USD 370 thousand per year (USD 1.937 million for the period 2025–2030), the difference between cost savings and potential payments for carbon units for 2025–2030 will be negative, i.e., the company will have to spend additional funds for excess carbon emissions. The cumulative value of the additional burden for the company could reach USD 28.5 million. The total additional burden for the company could reach USD 28.5 million over 2025–2030.
The calculations also showed that under this company policy, none of the scenario options for the company avoids additional payments. For the company in this case, everything will depend on the initial allocation of the share of free allowances and setting emission-reduction targets for the company so that the company will be able to offset potential payments The critical indicator of the share of free allowances at the beginning of the calculation should be at least 89% (Figure 8, Table 2).
Other scenario variants were modeled in a similar manner.

4.2. Example of Model Calculation for a Set of Company Measures

The action plan that the company plans to implement as part of its climate policy includes a wide range of projects:
  • Transition to low-carbon technologies and connection to grid electricity;
  • Building our own solar and wind farms at our facilities (where possible) and ensuring efficient electricity generation;
  • Switching to grid-electricity sources with the smallest carbon footprint;
  • Electrification of the mining-equipment fleet;
  • Improving the energy efficiency of technological processes.
The second example assessment was calculated based on a set of planned actions by the company in terms of its climate policy, where the reduction in total emissions will reach 35% of the 2019 level of about 415 thousand t CO2, resulting in total company CO2 emissions of about 765 thousand t CO2 by 2030—Table 3.
The model results show that the measures currently being taken at Polymetal International PLC can offset future potential environmental payments. Savings in the cost of supplying electricity from the grid or fuel for diesel power plants would range from USD 8.6 million to USD 12 million per year (up to USD 59.3 million over the period 2025–2020). The savings would be between USD 4.6 million and USD 12 million per year (up to USD 59.3 million over the period 2025–2030), with potential payments for the purchase of carbon units ranging from USD 4.6 million at the beginning of the period to USD 5.5 million by the end of the calculation period. This could range from USD 4.6 million at the beginning of the period to up to USD 10.7 million by the end of the settlement period (where the share of free distributed carbon units will decrease). This could be as high as USD 10.7 million. Thus, due to the additional potential carbon tax savings from its own certified carbon units, which could reach USD 1.47 million per year (USD 8.39 million for the period 2025–2030), the difference between cost savings and potential payments for carbon units for 2025–2030 will be positive, i.e., the company will be able to offset future potential environmental payments and offset some of its significant investments in climate projects through savings. The difference between cost savings and potential carbon unit payments for 2025–2030 could reach USD 36.8 million. The difference between the cost savings and potential payments for carbon units could reach USD 36.8 million.
The calculations also showed that under this integrated policy, all scenario options are acceptable to the company. The critical indicator of free allowance shares at the beginning of the calculation should be at least 62.8%, and the emission-reduction target should be 22.6–29.4% of the 2019 level, thereby reducing about 250,000–300,000 tons of CO2, achieving a rate not exceeding the total emissions of 840–930 thousand tons of CO2 per year, while the company’s adopted climate program aims to reduce its emissions baseline by 35% and achieve a total emissions target of 765 kt of CO2 per year (Figure 9).

5. Discussion

The development of carbon regulation, improved systems of accounting and quotas for greenhouse gas emissions, as well as the growing share of renewable energy sources can significantly slow down climate change. However, the regulation of these aspects may carry certain risks for business.
As stated earlier, given the mandatory reporting of carbon emissions, as well as the launch of the pilot in the Sakhalin Region, there may be a transition period for companies emitting CO2 emissions, during which they can prepare and assess the benefits and risks of the introduction of a greenhouse gas accounting system and adjust their business operations.
Polymetal International PLC [56] has already started to assess the risks from the introduction of national and cross-border greenhouse gas emission taxes and allowances. In the medium and long term, the company expects the introduction of national carbon-regulation systems in Russia and Kazakhstan, as well as cross-border carbon regulation, which will have an impact on concentrate exports.
Actions that the company is considering implementing in its climate program include phasing out carbon-based energy sources, including through the introduction of renewable energy sources at its facilities, improving energy efficiency as well as water management and waste management. All of these actions are aimed at reducing a range of possible risks [57]:
  • Risks associated with national and international carbon regulation—reducing risks by reducing carbon footprints;
  • Risks associated with the increasing cost of carbon-intensive resources—reducing risks by reducing the consumption of carbon-intensive fuels;
  • Risks associated with the requirements to use renewable energy sources—risk reduction through the introduction of one’s own renewable energy sources;
  • Physical risks associated with supply disruptions at remote production facilities—risk mitigation by reducing dependence on logistics and fuel supplies;
  • Risks related to obligations to apply the best available technologies and stricter construction standards—risk mitigation through the introduction of advanced energy-efficient technologies;
  • Risks associated with the increasing cost of carbon-intensive resources—reducing risks by reducing the consumption of carbon-intensive fuels.
Polymetal’s key climate goal is to reduce specific greenhouse gas emissions per gold equivalent ounce by 30% by 2030 (relative to 2019 levels in Scopes 1 and 2) and to reduce greenhouse gas emissions in absolute terms by 35% by 2030 (relative to 2019 levels, including Scopes 1 and 2) (Figure 10) [57].
Targets in absolute terms are important in a broad context for analyzing the company’s environmental impact, but they do not allow for tracking and analyzing the efficiency of resource use in the production of the final product. On the contrary, specific emission indicators allow for tracking the reduction in the carbon intensity of technological processes but do not always make it possible to analyze the volume of emissions in absolute terms.
The company plans to reduce the total emissions from 1180 thousand tons to 765 thousand tons of CO2 (according to the program until 2030, −35% of the 2019 figures). The company plans to reduce most of its emissions by generating energy produced by its own power systems (see Figure 1); this group plans to reduce 176 thousand tons of CO2 by 2030, which is more than 60% of the current indicators of this group.
According to the company’s report, today a significant share of electricity generation at remote production facilities is provided by diesel power plants, which significantly increases greenhouse gas emissions in volume 1. Therefore, the company recognizes this problem as a key one, and the most important task is to reduce dependence on diesel fuel by connecting to grid-electricity sources and/or developing its own projects based on renewable energy sources.
With increased resilience to power outages, the use of solar, wind and hydro power becomes one of the most promising tools for reducing greenhouse gas emissions at remote production facilities. At the current stage of development in the field of renewable energy, technologies and opportunities for the application of RES in the extreme conditions of the Far North are emerging.
Polymetal International PLC plans to attract major investments in projects that utilize low-carbon energy and increase resilience to climate change, as well as support the efficient use of waste and water resources. The main objectives of these investments are to reduce the climate impact through energy efficiency and renewable energy and to reduce environmental impact by reducing waste and fresh water consumption.
In 2021, Polymetal International PLC raised USD 400 million under loan agreements, the terms of which include the company’s commitments to target reductions in specific greenhouse gas emissions. These agreements include two loans from Raiffeisenbank and UniCredit, which represent a significant portion of our green financing portfolio of USD 680 million, or approximately 40% of the total debt [57].
According to the company’s overall strategy, the main environmental initiatives are aimed at reducing the carbon footprint and improving energy efficiency through grid connection, electrification of the equipment fleet and utilization of renewable energy sources at remote sites. The company itself is projected to raise about USD 1.1 bn for climate change adaptation activities by 2030.
According to the company’s management, green lending is now a very important tool for financing the transition to a low-carbon and more-sustainable production model, as it helps to align the company’s financial capacity with ESG indicators and, as a result, contributes to sustainable development. At the same time, it is worth noting that this instrument synchronizes the interests of the company and society as a whole, contributing to the further development of responsible subsoil use.
Polymetal International PLC looks forward to expanding its investor pool by attracting like-minded investors who are committed to investing in sustainable projects.
In general, the company’s chosen strategy can be fully justified, as the company started attracting green investments and implementing various emission-reduction projects in advance. And, calculations of risks from the potential expansion of carbon regulation in Russia prove it.
Currently, Polymetal International PLC is not the only company in the industry that has included in its strategy various programs for technological modernization and improvement in production in order to reduce greenhouse gas emissions. For example, PJSC MMC Norilsk Nickel is implementing a long-term sustainable development strategy aimed at creating environmentally oriented production. The strategy envisages the modernization of the company’s production assets by using the best available technologies and green solutions and maintaining carbon dioxide emissions at one of the lowest levels among the world’s diversified mining and metallurgical companies. The share of low-carbon energy in Nornickel’s total energy consumption is one of the highest in the industry. The company’s main RES is hydropower. The company attaches great importance to improving the energy efficiency of production sites under construction and in operation. As part of this program, investments of over USD 8 billion are planned for 2021–2030 to modernize and improve the industrial safety of the company’s energy infrastructure. The investments include a wide range of projects related to equipment replacement at thermal and hydroelectric power plants, the modernization of fuel tank storage facilities and power grid and gas pipeline systems [58].
Nord Gold PLC, which has numerous gold mining and processing sites both in Russia and around the world, has also set targets in its strategy to achieve a near-zero GHG emissions balance by 2050 [59]. The company is said to be focused on developing a robust scientific approach to estimating and reducing GHG emissions. At the moment, one of the company’s achieved targets is a 35% share of its industrial facilities’ energy supply from renewable energy sources.
Under only the most-conservative baseline scenario, RUSAL (parent organization: EN+ GROUP International PJSC) intends to reduce specific greenhouse gas emissions from all production facilities in Scopes 1 and 2 by at least 25% by 2032, and by at least 47% by 2050. All targets stated in the strategy until 2032 are related to technological decarbonization projects. The company plans to achieve the goals set out in the strategy primarily through further implementation of advanced electrolysis technologies, energy-efficiency programs at all stages of production, further conversion of enterprises to carbon-free energy sources and implementation of closed-loop economy principles (increased involvement of secondary aluminum) [60].

6. Conclusions

Adherence to the concept of sustainable development is an integral aspect of building a company’s strategy for effective functioning. Non-ferrous metallurgy companies need to implement “green” projects to maintain their investment attractiveness and product competitiveness. The modernization of companies and reduction in the carbon intensity of production requires substantial investments and high-tech solutions, which is expressed in the need to attract foreign investments and scientific and technological experience. A promising area of cooperation at the moment for domestic companies may be the countries of the Asia–Pacific region, the Middle East and Central Asia, so first of all, it is necessary to rely on their criteria when creating their own taxonomy.
As part of the development of carbon regulation in the territory of the Russian Federation, we have a number of recommendations and procedures for both future participants in the carbon market and the state. At this stage, for the authorized authorities, it is necessary that they:
  • Develop, coordinate with market participants and approve target values for reducing greenhouse gas emissions by emitters in the region by year until the subject of the Federation reaches the level of carbon neutrality (the equality of emissions and carbon absorption).
  • Develop and approve methods of assessment, accounting for the results of the implementation and certification of climate projects and the procedure for the accrual of carbon units of certified emission reductions.
  • Develop, coordinate and approve with market participants the methodology for the calculation and allocation of quotas for greenhouse gas emissions in accordance with the approved target values, including the procedure for the correction of allocated quotas.
  • Approve the authorized body responsible for the calculation of emission volumes, absorption volumes, certification of climate projects, calculation of carbon units of certified emissions and allocation of quotas.
After the completion of the Sakhalin experiment and the introduction of emission targets by sectors and regions, and as a consequence, the introduction of CO2 emission charges throughout the Russian Federation, and taking into account the possible spread of a transboundary carbon tax, Russian businesses need to assess for themselves the benefits and risks of the introduction of state and transboundary regulators in order to make adjustments to their carbon-emission strategies during 2023–2025.
For industrial companies, in order to minimize the risks associated with the introduction of international and national carbon-regulation programs, it is necessary to:
  • Form a working group responsible for the creation, organization and submission of reporting on greenhouse gas emissions, containing information on the mass of greenhouse gas emissions generated as a result of the company’s economic and other activities during the reporting period;
  • Allocate a working group for the company’s participation in coordinating with market participants and approving target values for the reduction in greenhouse gas emissions by issuers with representatives of the state authorities (authorized body—market regulator);
  • Develop and agree on the action plan and development strategy for the company’s climate programs in order to minimize the risks associated with the introduction of international and national programs to regulate carbon emissions by reducing the company’s carbon footprint;
  • Allocate and include an investment program in the company’s strategy aimed at reducing risks by reducing the consumption of carbon-intensive fuels through the use of the best available technologies and advanced energy-efficient technologies.

Author Contributions

Conceptualization, A.C. and A.N.; methodology, G.S.; software, G.S.; validation, G.S.; formal analysis, A.N. and G.S.; investigation, A.C., G.S. and A.N.; resources, G.S.; data curation, A.N.; writing—original draft preparation, G.S.; writing—review and editing, A.C.; visualization, G.S.; supervision, A.C. and A.N. All authors have read and agreed to the published version of the manuscript.

Funding

This research received no external funding.

Institutional Review Board Statement

Not applicable.

Informed Consent Statement

Informed consent was obtained from all subjects involved in this study.

Data Availability Statement

The data presented in this study are available on request from the corresponding author.

Conflicts of Interest

The authors declare no conflict of interest.

References

  1. Skobelev, D.O.; Cherepovitsyna, A.A.; Guseva, T.V. Carbon capture and storage: Net zero contribution and cost estimation approaches. J. Min. Inst. 2023, 259, 125–140. [Google Scholar] [CrossRef]
  2. Boyce, J.K. Carbon Pricing: Effectiveness and Equity. Ecol. Econ. 2018, 150, 52–61. [Google Scholar] [CrossRef]
  3. Tost, M.; Hitch, M.; Lutter, S.; Feiel, S.; Moser, P. Carbon Prices for Meeting the Paris Agreement and Their Impact on Key Metals. Extr. Ind. Soc. 2020, 7, 593–599. [Google Scholar] [CrossRef]
  4. Tvinnereim, E.; Mehling, M. Carbon Pricing and Deep Decarbonisation. Energy Policy 2018, 121, 185–189. [Google Scholar] [CrossRef]
  5. Zhang, W.; Li, J.; Li, G.; Guo, S. Emission Reduction Effect and Carbon Market Efficiency of Carbon Emissions Trading Policy in China. Energy 2020, 196, 117117. [Google Scholar] [CrossRef]
  6. Martin, R.; de Preux, L.B.; Wagner, U.J. The Impact of a Carbon Tax on Manufacturing: Evidence from Microdata. J. Public Econ. 2014, 117, 1–14. [Google Scholar] [CrossRef]
  7. Xie, J.; Dai, H.; Xie, Y.; Hong, L. Effect of Carbon Tax on the Industrial Competitiveness of Chongqing, China. Energy Sustain. Dev. 2018, 47, 114–123. [Google Scholar] [CrossRef]
  8. Zakeri, A.; Dehghanian, F.; Fahimnia, B.; Sarkis, J. Carbon Pricing versus Emissions Trading: A Supply Chain Planning Perspective. Int. J. Prod. Econ. 2015, 164, 197–205. [Google Scholar] [CrossRef]
  9. Aghion, P.; Dechezleprêtre, A.; Hémous, D.; Martin, R.; Van Reenen, J. Carbon Taxes, Path Dependency, and Directed Technical Change: Evidence from the Auto Industry. J. Political Econ. 2016, 124, 1–51. [Google Scholar] [CrossRef]
  10. Pietzcker, R.C.; Osorio, S.; Rodrigues, R. Tightening EU ETS Targets in Line with the European Green Deal: Impacts on the Decarbonization of the EU Power Sector. Appl. Energy 2021, 293, 116914. [Google Scholar] [CrossRef]
  11. Stroykov, G.A.; Cherepovitsyn, A.E.; Romasheva, N.A. Current state and prospects for the development of carbon regulation in Russia. Econ. Entrep. 2022, 10, 295–303. [Google Scholar] [CrossRef]
  12. Carbon Regulation and Carbon Market Concept in Russia: Global Experience, Participants, Road Map. Available online: https://kt.tatarstan.ru/rus/file/pub/pub_3191213_enc_167420.pdf (accessed on 30 May 2023).
  13. Cherepovitsyn, A.; Solovyova, V.; Dmitrieva, D. New challenges for the sustainable development of the rare-earth metals sector in Russia: Transforming industrial policies. Resour. Policy 2023, 81, 103347. [Google Scholar] [CrossRef]
  14. Directive 2023/958. Available online: https://www.eumonitor.eu/9353000/1/j9vvik7m1c3gyxp/vm3485iwsuzv (accessed on 30 May 2023).
  15. Regulation 2023/956—Carbon Border Adjustment Mechanism. Available online: https://www.eumonitor.eu/9353000/1/j9vvik7m1c3gyxp/vm3485iwsmzu (accessed on 15 November 2023).
  16. Dmitrieva, D.M.; Skobelev, D.O. Decarbonization of the oil and gas sector in the context of sustainable development: Key directions and possible scenarios for the Arctic region. North Mark. Form. Econ. Order 2023, 2, 7–23. [Google Scholar] [CrossRef]
  17. Blinova, E.; Ponomarenko, T.; Knysh, V. Analyzing the Concept of Corporate Sustainability in the Context of Sustainable Business Development in the Mining Sector with Elements of Circular Economy. Sustainability 2022, 14, 8163. [Google Scholar] [CrossRef]
  18. Ilyinsky, A.A.; Kalinina, O.V.; Khasanov, M.M.; Afanasiev, M.V.; Saitova, A.A. Decarbonization of the oil and gas complex: Priorities and organizational models of development. North Mark. Form. Econ. Order 2022, 1, 33–46. [Google Scholar] [CrossRef]
  19. Kuznetsova, E.A.; Cherepovitsyna, A.A. Carbon dioxide utilization and circular economy: The world, Russia and the Arctic. North Mark. Form. Econ. Order 2021, 4, 42–55. [Google Scholar] [CrossRef]
  20. Ulanov, V.L.; Skorobogatko, O.N. Impact of EU carbon border adjustment mechanism on the economic efficiency of Russian oil refining. J. Min. Inst. 2022, 257, 865–876. [Google Scholar] [CrossRef]
  21. Ilyushin, Y.V. Development of a Process Control System for the Production of High-Paraffin Oil. Energies 2022, 15, 6462. [Google Scholar] [CrossRef]
  22. Yu, Y.; Shi, J. Environmental regulation, low-carbon technology progress and energy efficiency. Front. Environ. Sci. 2022, 10, 1012229. [Google Scholar] [CrossRef]
  23. Ilyushin, Y.V.; Kapostey, E.I. Developing a Comprehensive Mathematical Model for Aluminium Production in a Soderberg Electrolyser. Energies 2023, 16, 6313. [Google Scholar] [CrossRef]
  24. Semenova, T.; Al-Dirawi, A.; Al-Saadi, T. Environmental Challenges for Fragile Economies: Adaptation Opportunities on the Examples of the Arctic and Iraq. Agronomy 2022, 12, 2021. [Google Scholar] [CrossRef]
  25. Pshenin, V.V.; Zakirova, G.S. Improving the efficiency of oil vapor recovery units in the commodity transport operations at oil terminals. J. Min. Inst. 2023. [Google Scholar] [CrossRef]
  26. Semenov, A.S.; Kruk, M.N. Project risk analysis and management decision-making in determining the parameters of ore quarries. J. Ind. Pollut. Control 2017, 33, 1024–1028. [Google Scholar]
  27. Kazanin, O.I.; Sidorenko, A.A.; Meshkov, A.A.; Sidorenko, S.A. Reproduction of the longwall panels: Modern requirements for the technology and organization of the development operations at coal mines. Eurasian Min. 2020, 2, 19–23. [Google Scholar] [CrossRef]
  28. Romasheva, N.V.; Babenko, M.A.; Nikolaichuk, L.A. Sustainable development of the Russian Arctic region: Environmental problems and ways to solve them. Min. Inf. Anal. Bull. 2022, 2022, 78–87. [Google Scholar] [CrossRef]
  29. Marinina, O.; Kirsanova, N.; Nevskaya, M. Circular Economy Models in Industry: Developing a Conceptual Framework. Energies 2022, 15, 9376. [Google Scholar] [CrossRef]
  30. Li, L.; Wang, Y.; Tan, M.; Sun, H.; Zhu, B. Effect of Environmental Regulation on Energy-Intensive Enterprises’ Green Innovation Performance. Sustainability 2023, 15, 10108. [Google Scholar] [CrossRef]
  31. Tao, Y.; Destek, M.A.; Pata, U.K.; Khan, Z. Environmental Regulations and Carbon Emissions: The Role of Renewable Energy Research and Development Expenditures. Sustainability 2023, 15, 13345. [Google Scholar] [CrossRef]
  32. Liu, L.; Li, M.; Gong, X.; Jiang, P.; Jin, R.; Zhang, Y. Influence Mechanism of Different Environmental Regulations on Carbon Emission Efficiency. Int. J. Environ. Res. Public Health 2022, 19, 13385. [Google Scholar] [CrossRef]
  33. Zheng, L.; Omori, A.; Cao, J.; Guo, X. Environmental Regulation and Corporate Environmental Performance: Evidence from Chinese Carbon Emission Trading Pilot. Sustainability 2023, 15, 8518. [Google Scholar] [CrossRef]
  34. Litvinenko, V.S.; Petrov, E.I.; Vasilevskaya, D.V.; Yakovenko, A.V.; Naumov, I.A.; Ratnikov, M.A. Assessment of the role of the state in the management of mineral resources. J. Min. Inst. 2023, 259, 95–111. [Google Scholar] [CrossRef]
  35. Solovyova, V.; Ilinova, A. Complex use of mineral raw materials: Formation of organizational and economic mechanism. E3S Web Conf. 2021, 266, 06012. [Google Scholar] [CrossRef]
  36. Carbon Pricing Dashboard. The World Bank. Available online: https://carbonpricingdashboard.worldbank.org (accessed on 28 May 2023).
  37. ICAP Allowance Price Explorer. Available online: https://icapcarbonaction.com/en/ets-prices (accessed on 28 May 2023).
  38. The World Bank. State and Trends of Carbon Pricing 2022; World Bank: Washington, DC, USA, 2022; Available online: https://openknowledge.worldbank.org/entities/publication/a1abead2-de91-5992-bb7a-73d8aaaf767f (accessed on 29 August 2023).
  39. World Bank. State and Trends of Carbon Pricing 2021; World Bank: Washington, DC, USA, 2021; Available online: https://openknowledge.worldbank.org/handle/10986/35620 (accessed on 25 September 2023).
  40. Scimago Graphica. Available online: https://graphica.app/ (accessed on 28 August 2023).
  41. Emissions Trading Worldwide. Status Report 2022. ICAP. Available online: https://icapcarbonaction.com/system/files/document/220408_icap_report_rz_web.pdf (accessed on 21 June 2023).
  42. Rasporyazhenie Pravitel’stva RF Ot 29.10.2021 № 3052-r. Available online: http://static.government.ru/media/files/ADKkCzp3fWO32e2yA0BhtIpyzWfHaiUa.pdf (accessed on 24 June 2023).
  43. Romasheva, N.; Dmitrieva, D. Energy Resources Exploitation in the Russian Arctic: Challenges and Prospects for the Sustainable Development of the Ecosystem. Energies 2021, 14, 8300. [Google Scholar] [CrossRef]
  44. Federal Law No. 296-FZ Dated July 2, 2021. On Limiting Greenhouse Gas Emissions. Available online: http://publication.pravo.gov.ru/Document/View/0001202107020031 (accessed on 30 July 2023).
  45. Order of the Government of the Russian Federation Dated October 22, 2021 No. 2979-r. Available online: http://publication.pravo.gov.ru/Document/View/0001202110260021 (accessed on 30 July 2023).
  46. Project on Amendments to the Federal Law. On Limiting Greenhouse Gas Emissions. Available online: https://regulation.gov.ru/projects#npa=120026 (accessed on 1 August 2023).
  47. Decree of the Government of the Russian Federation Dated March 14, 2022 No. 355. On the Criteria for Classifying Legal Entities and Individual Entrepreneurs as Regulated Organizations. Available online: http://publication.pravo.gov.ru/Document/View/0001202203150019 (accessed on 15 September 2023).
  48. Order of the Ministry of Economic Development of Russia Dated May 11, 2022 N 248. On Approval of the Criteria and Procedure for Classifying Projects Implemented by Legal Entities, Individual Entrepreneurs or Individuals as Climate Projects, the Form and Procedure for Submitting a Report on the Implementation of a Climate Project. Available online: http://www.consultant.ru/document/cons_doc_LAW_418257/81190896e9feeffbdbff3b233505fe7903d303e5 (accessed on 3 August 2023).
  49. Draft on Approval of the Procedure for Determining Fees for the Provision by the Operator of Services for Conducting Operations in the Register of Carbon Units. Available online: https://regulation.gov.ru/projects#npa=121676 (accessed on 5 August 2023).
  50. The Ministry of Economic Development Has Set Targets for Reducing Greenhouse Emissions by 2030. Available online: https://www.interfax.ru/russia/855520 (accessed on 8 August 2023).
  51. Federal Law. On Conducting an Axperiment to Limit Greenhouse Gas Emissions in Certain Constituent Entities of the Russian Federation. Dated 03/06/2022 N 34-FZ. Available online: http://www.consultant.ru/document/cons_doc_LAW_411051 (accessed on 16 September 2023).
  52. Order of the Ministry of Economic Development of the Russian Federation N 452 dated 24 August 2022. On Approval of the Methodology for Determining Projected Quotas of Greenhouse Gas Emissions within the Framework of an Experiment to Limit Greenhouse Gas Emissions in Certain Constituent Entities of the Russian Federation. Available online: https://base.garant.ru/405220553 (accessed on 19 August 2023).
  53. Golysheva, A.V.; Okorochkova, A.A.; Semencov, S.P. Energy Transition: Sakhalin Experiment. Available online: http://inveb-docs.ru/attachments/article/901/бюллетень_Сахалинск~.pdf (accessed on 19 August 2023).
  54. The Fee for Exceeding CO2 Emissions Quotas in 2024 May Amount to 1 Thousand Rubles per Ton. Available online: https://peretok.ru/news/worldenergy/24532 (accessed on 22 September 2023).
  55. Decree of the Government of the Russian Federation of March 30, 2022 No. 518. On the Procedure for Determining Fees for the Provision by the Operator of Services for Conducting Operations in the Register of Carbon Units. Available online: http://government.ru/docs/all/140153 (accessed on 12 September 2023).
  56. Polymetal International PLC. Available online: https://www.polymetalinternational.com/en (accessed on 5 August 2023).
  57. Polymetal International PLC. Integrated Annual Report & Accounts 2022. Available online: https://www.polymetalinternational.com/upload/ib/5/23-05-24/Polymetal_integrated-report-2022-eng.pdf (accessed on 5 August 2023).
  58. Norilsk Nickel Climate Change Strategy. Available online: https://nornickel.ru/sustainability/climate-change/strategy (accessed on 15 November 2023).
  59. Nord Gold. PLC Sustainability Report 2020. Available online: https://nordgold.com/upload/iblock/568/ALL_NRDGLD_2020_RU_compressed.pdf (accessed on 15 November 2023).
  60. RUSAL Has Approved the Company’s Climate Targets for 2032 and 2050. Available online: https://rusal.ru/press-center/press-releases/rusal-utverdil-klimaticheskie-tseli-kompanii-na-2032-i-2050-gody (accessed on 15 November 2023).
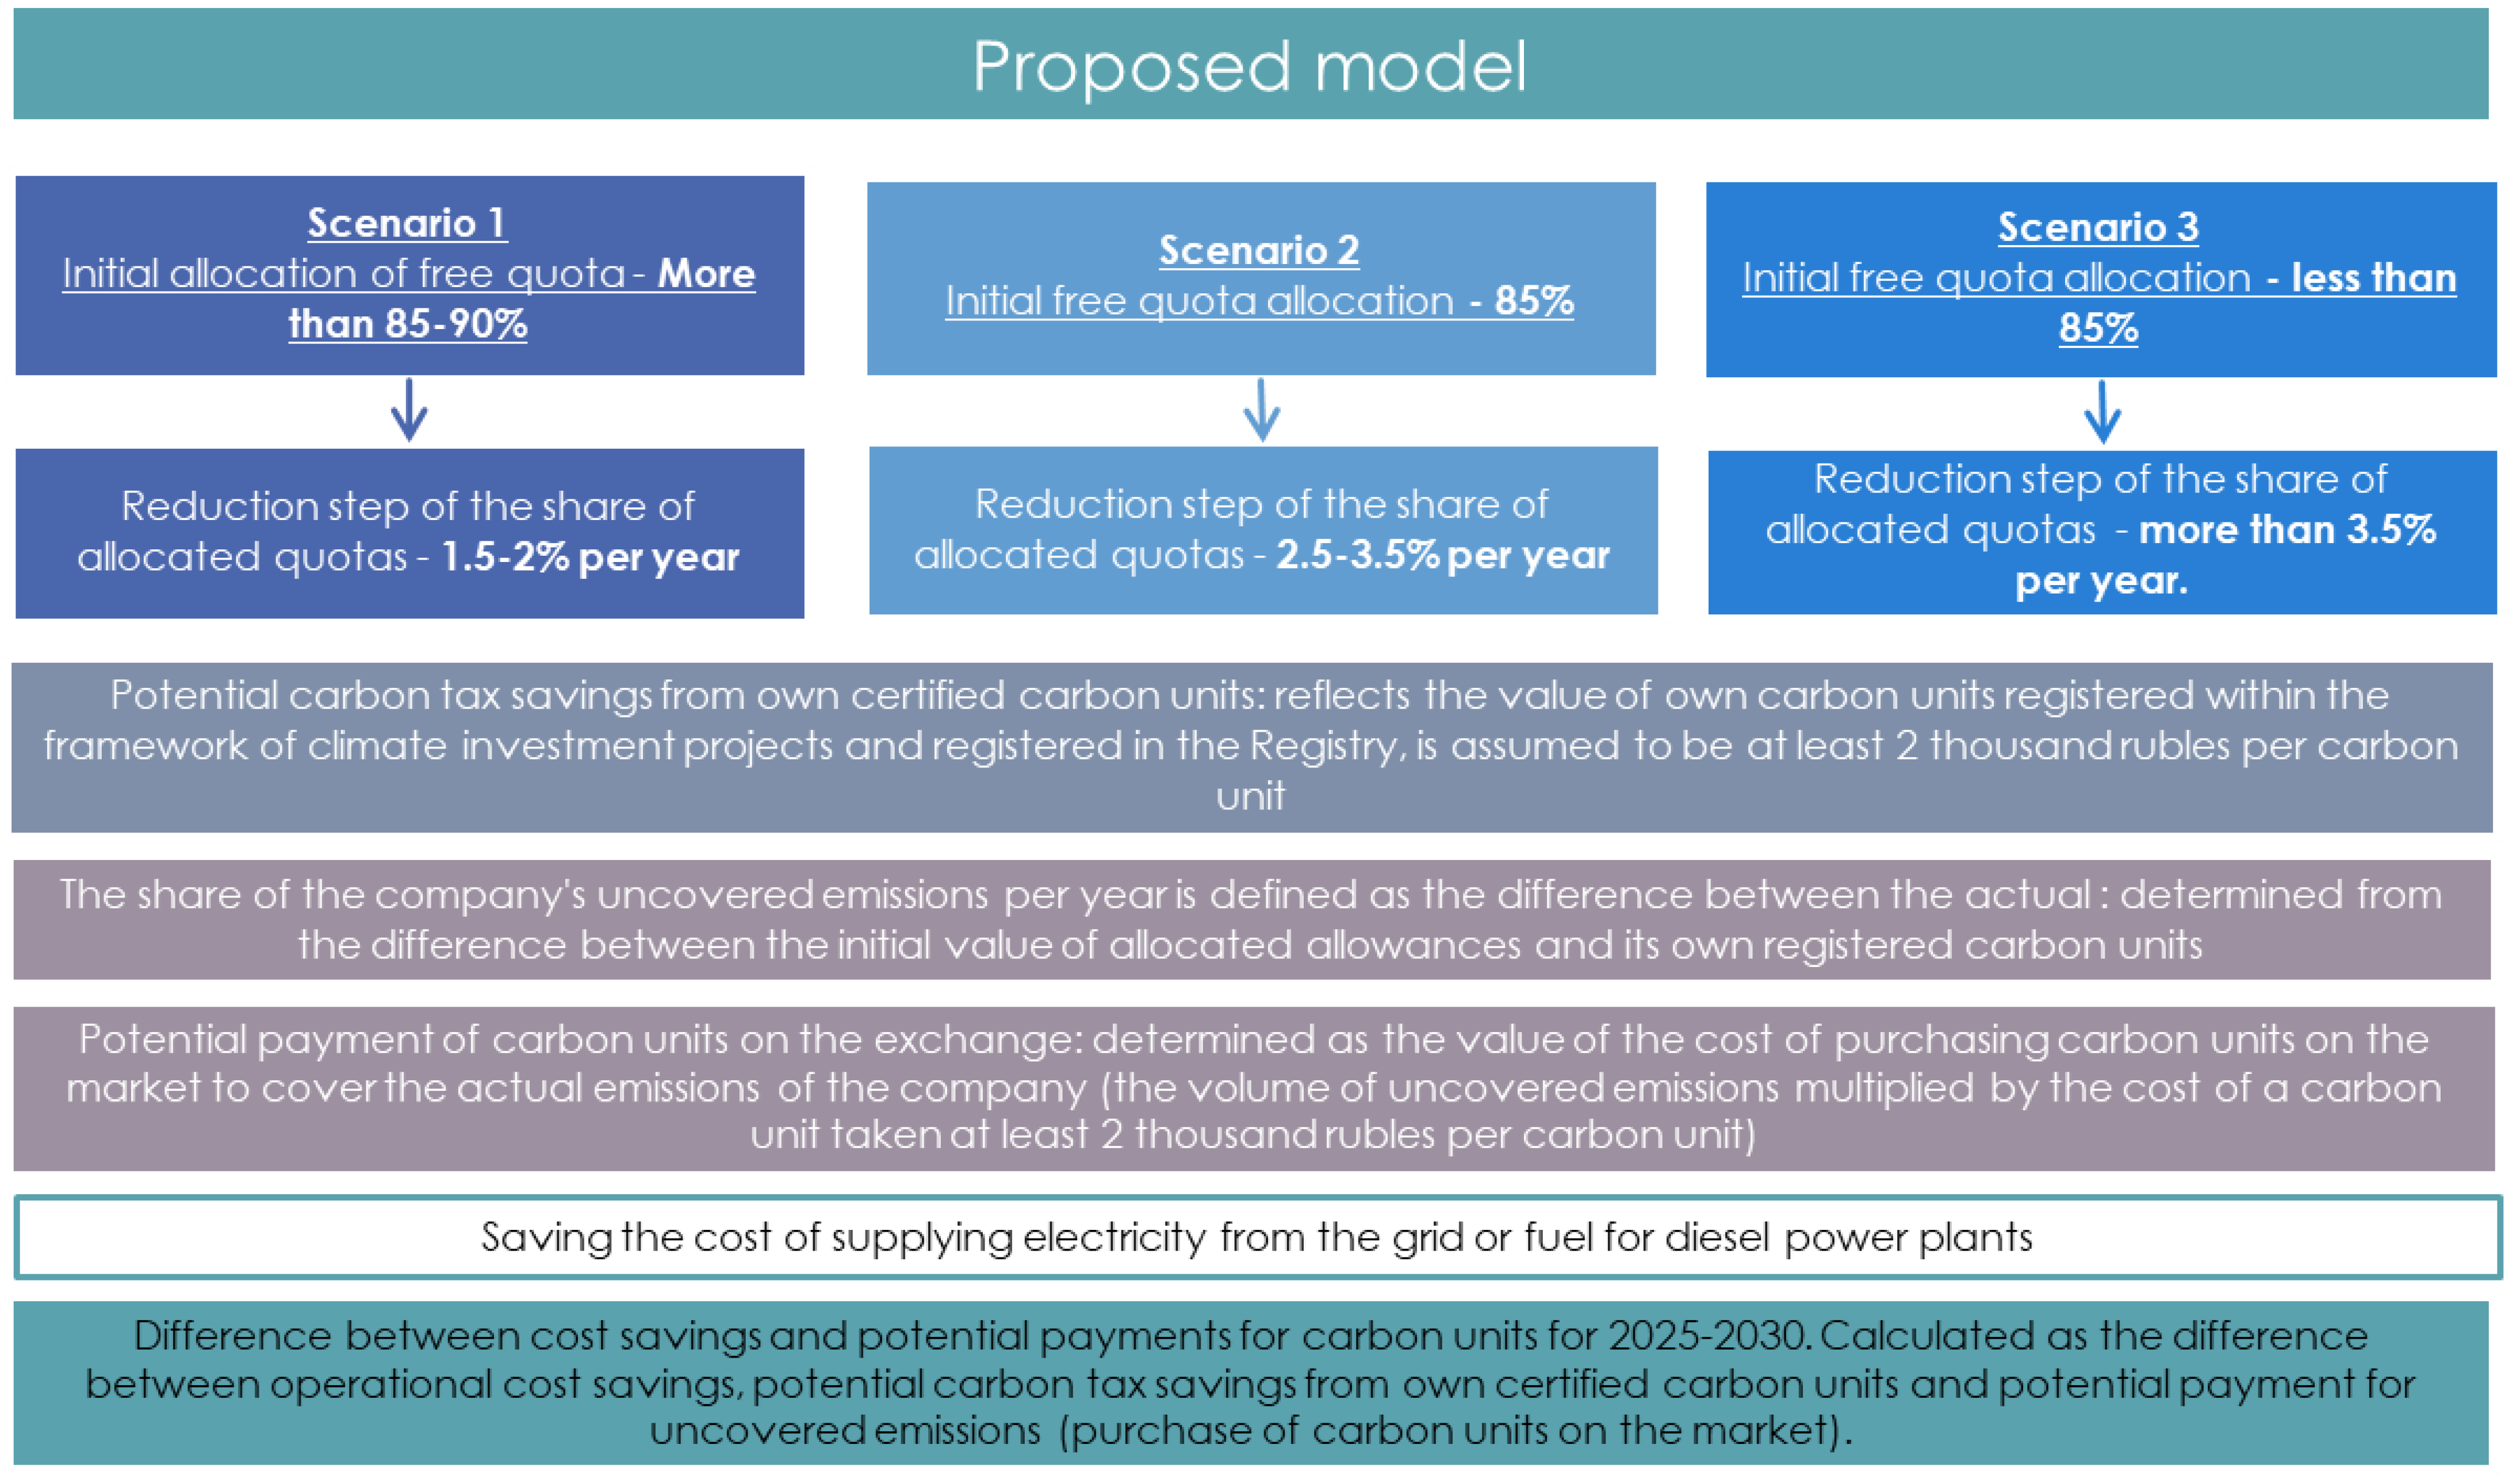
Figure 1. Structure of revenues from realized carbon-pricing instruments by year. Source: compiled by the authors based on [38].
Sustainability 15 16640 g001
Figure 2. Cost per ton of CO2 by country for March 2023. Compiled by the authors in the program Scimago graphica [40] according to data [36].
Sustainability 15 16640 g002
Figure 3. Dynamics of average annual quota price in different ETSs. Adapted from [36,37].
Sustainability 15 16640 g003
Figure 5. General scheme of carbon regulation in the Russian Federation. Source: compiled by the authors based on [12].
Sustainability 15 16640 g005
Figure 6. Quota allocation option.
Sustainability 15 16640 g006
Figure 7. Scenario design.
Sustainability 15 16640 g007
Figure 8. Quota allocation option for Scenario 2 (example for RES).
Sustainability 15 16640 g008
Figure 9. Estimated quota allocation figures for Scenario 2 (example of a set of measures).
Sustainability 15 16640 g009
Figure 10. Polymetal International PLC 2030 emission targets, absolute CO2 emissions, thousand tons of CO2. Source: compiled by the authors based on [57].
Sustainability 15 16640 g010
Table 1. Summary table of scenarios when assessing the implementation of RES.
Scenario 1Scenario 2Scenario 3
Initial allocation of free quotasMore than 85–90%85%Less than 85%
Step of reducing the share of allocated quotas1.5–2% per year2.5–3.5% per yearMore than 3.5% per year
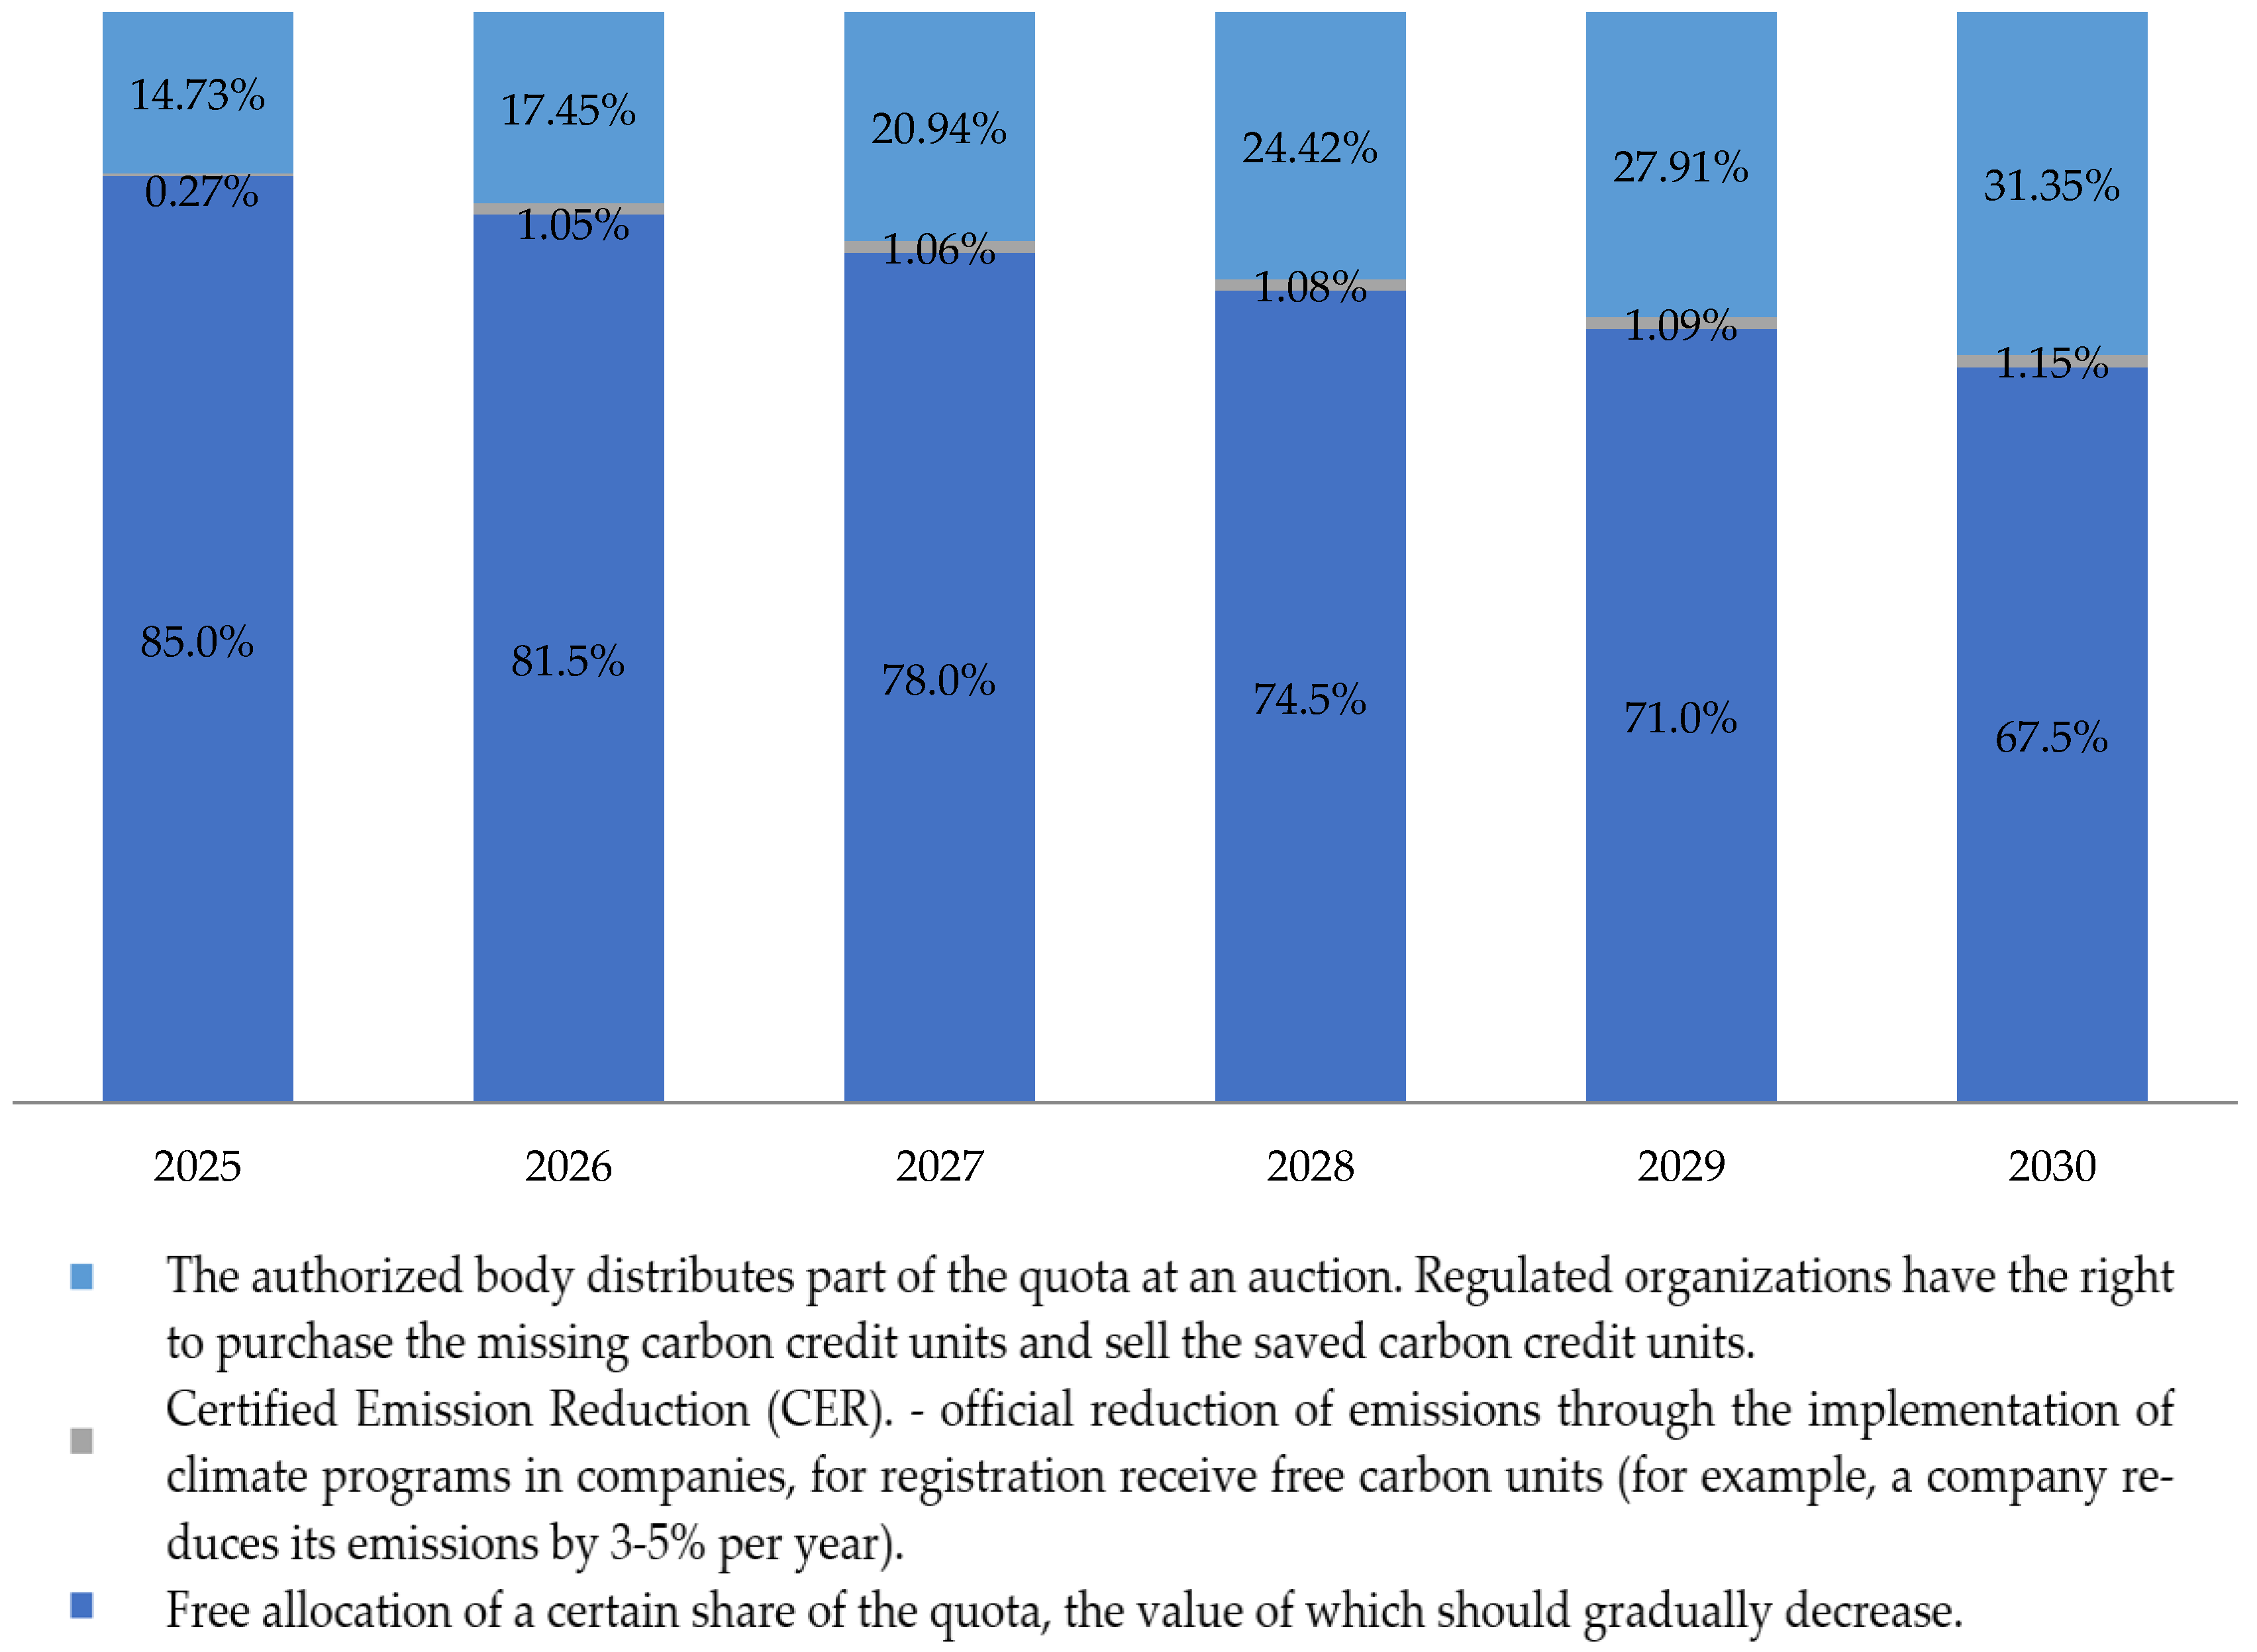
Example for RES (calculation for 2025–2030), 10% emission reduction from RES
Emission-reduction targetsAbout 11,984 tons per year (about 1.1% per year)
Up to 1078 thousand tons of CO2 (10% from 2019 level of about 100 thousand tons of CO2)
InvestmentTotal investment volume of USD 40 mln.
By 2025, it is planned to build RES-based plants at six facilities, including Omolon, Varvarinskoye, Kyzyl, Svetloye (second stage), Prognoz and Kutyn, with a total capacity of more than 30 MW
The program for further development of power generation from renewable sources, which runs until 2030, includes the construction of five new RES-based power plants with a total capacity of more than 45 MW
Potential carbon tax savings from own certified carbon unitsFrom USD 0.1 to 0.37 million.
USD 1.937 million (over the period 2025–2030)
Percentage and volume of emissions not covered per yearFrom 14 to 21.5%
From 170 to 242 thousand tons of CO2
From 14 to 31.5%
From 170 to 350 thousand tons of CO2
From 14 to 36.5%
From 227 to 404 thousand tons of CO2
Potential payment of carbon units on the exchange, mln. dollars USDFrom 5.2 to 7.5 per year
Up to 38.2 (for the period 2025–2030)
From 5.2 to 10.7 per year
Up to 48.3 (for the period 2025–2030)
7 to 12.5 per year
Up to 58.5 (over the period 2025–2030)
Saving the cost of supplying electricity from the grid or fuel for diesel power plantsFrom 5.3 to 6 million dollars. USD 5.3 to 6 million per year
Up to 28.1 (for the period 2025–2030)
The difference in cost savings and potential payments for carbon units over 2025–2030.USD −8.15 million −USD 18.25 million−USD 28.49 million
Critical indicator of free quota shares at the beginning of calculationNot less than 89%Not less than 93.9%Not less than 97.6%
Table 2. Calculation of the difference between cost savings and potential payments for carbon units for Scenario 1.
Emission indicator for 2030, t CO2e1,078,5811,065,0001,055,0001,045,0001,035,000
Percentage of reduction from 2019 baseline due to RES−10.0%−11.1%−12.0%−12.8%−13.6%
Total volume of reduction from 2019 baseline, t CO2e−119,842−133,423−143,423−153,423−163,423
Initial share of allocated quotas, %Difference in cost savings and potential payments for carbon units over 2025–2030, million USD
90%991.2−5584.1−10,425.7−15,267.2−20,108.8
89%3037.7−3541.8−8386.4−13,231.0−18,075.7
88%5084.3−1499.4−6347.1−11,194.8−16,042.5
87%7130.8543.0−4307.8−9158.6−14,009.4
86%9177.32585.3−2268.5−7122.4−11,976.3
85%11,223.94627.7−229.3−5086.2−9943.1
84%13,270.46670.01810.0−3050.0−7910.0
83%15,316.98712.43849.3−1013.8−5876.9
82%17,363.510,754.75888.61022.4−3843.8
81%19,410.012,797.17927.93058.6−1810.6
80%21,456.614,839.59967.15094.8222.5
Table 3. Summary table of scenarios, when evaluating a set of measures.
Scenario 1Scenario 2Scenario 3
Initial allocation of free quotasMore than 85–90%85%Less than 85%
Step of reducing the share of allocated quotas1.5–2% per year2.5–3.5% per yearmore than 3.5% per year
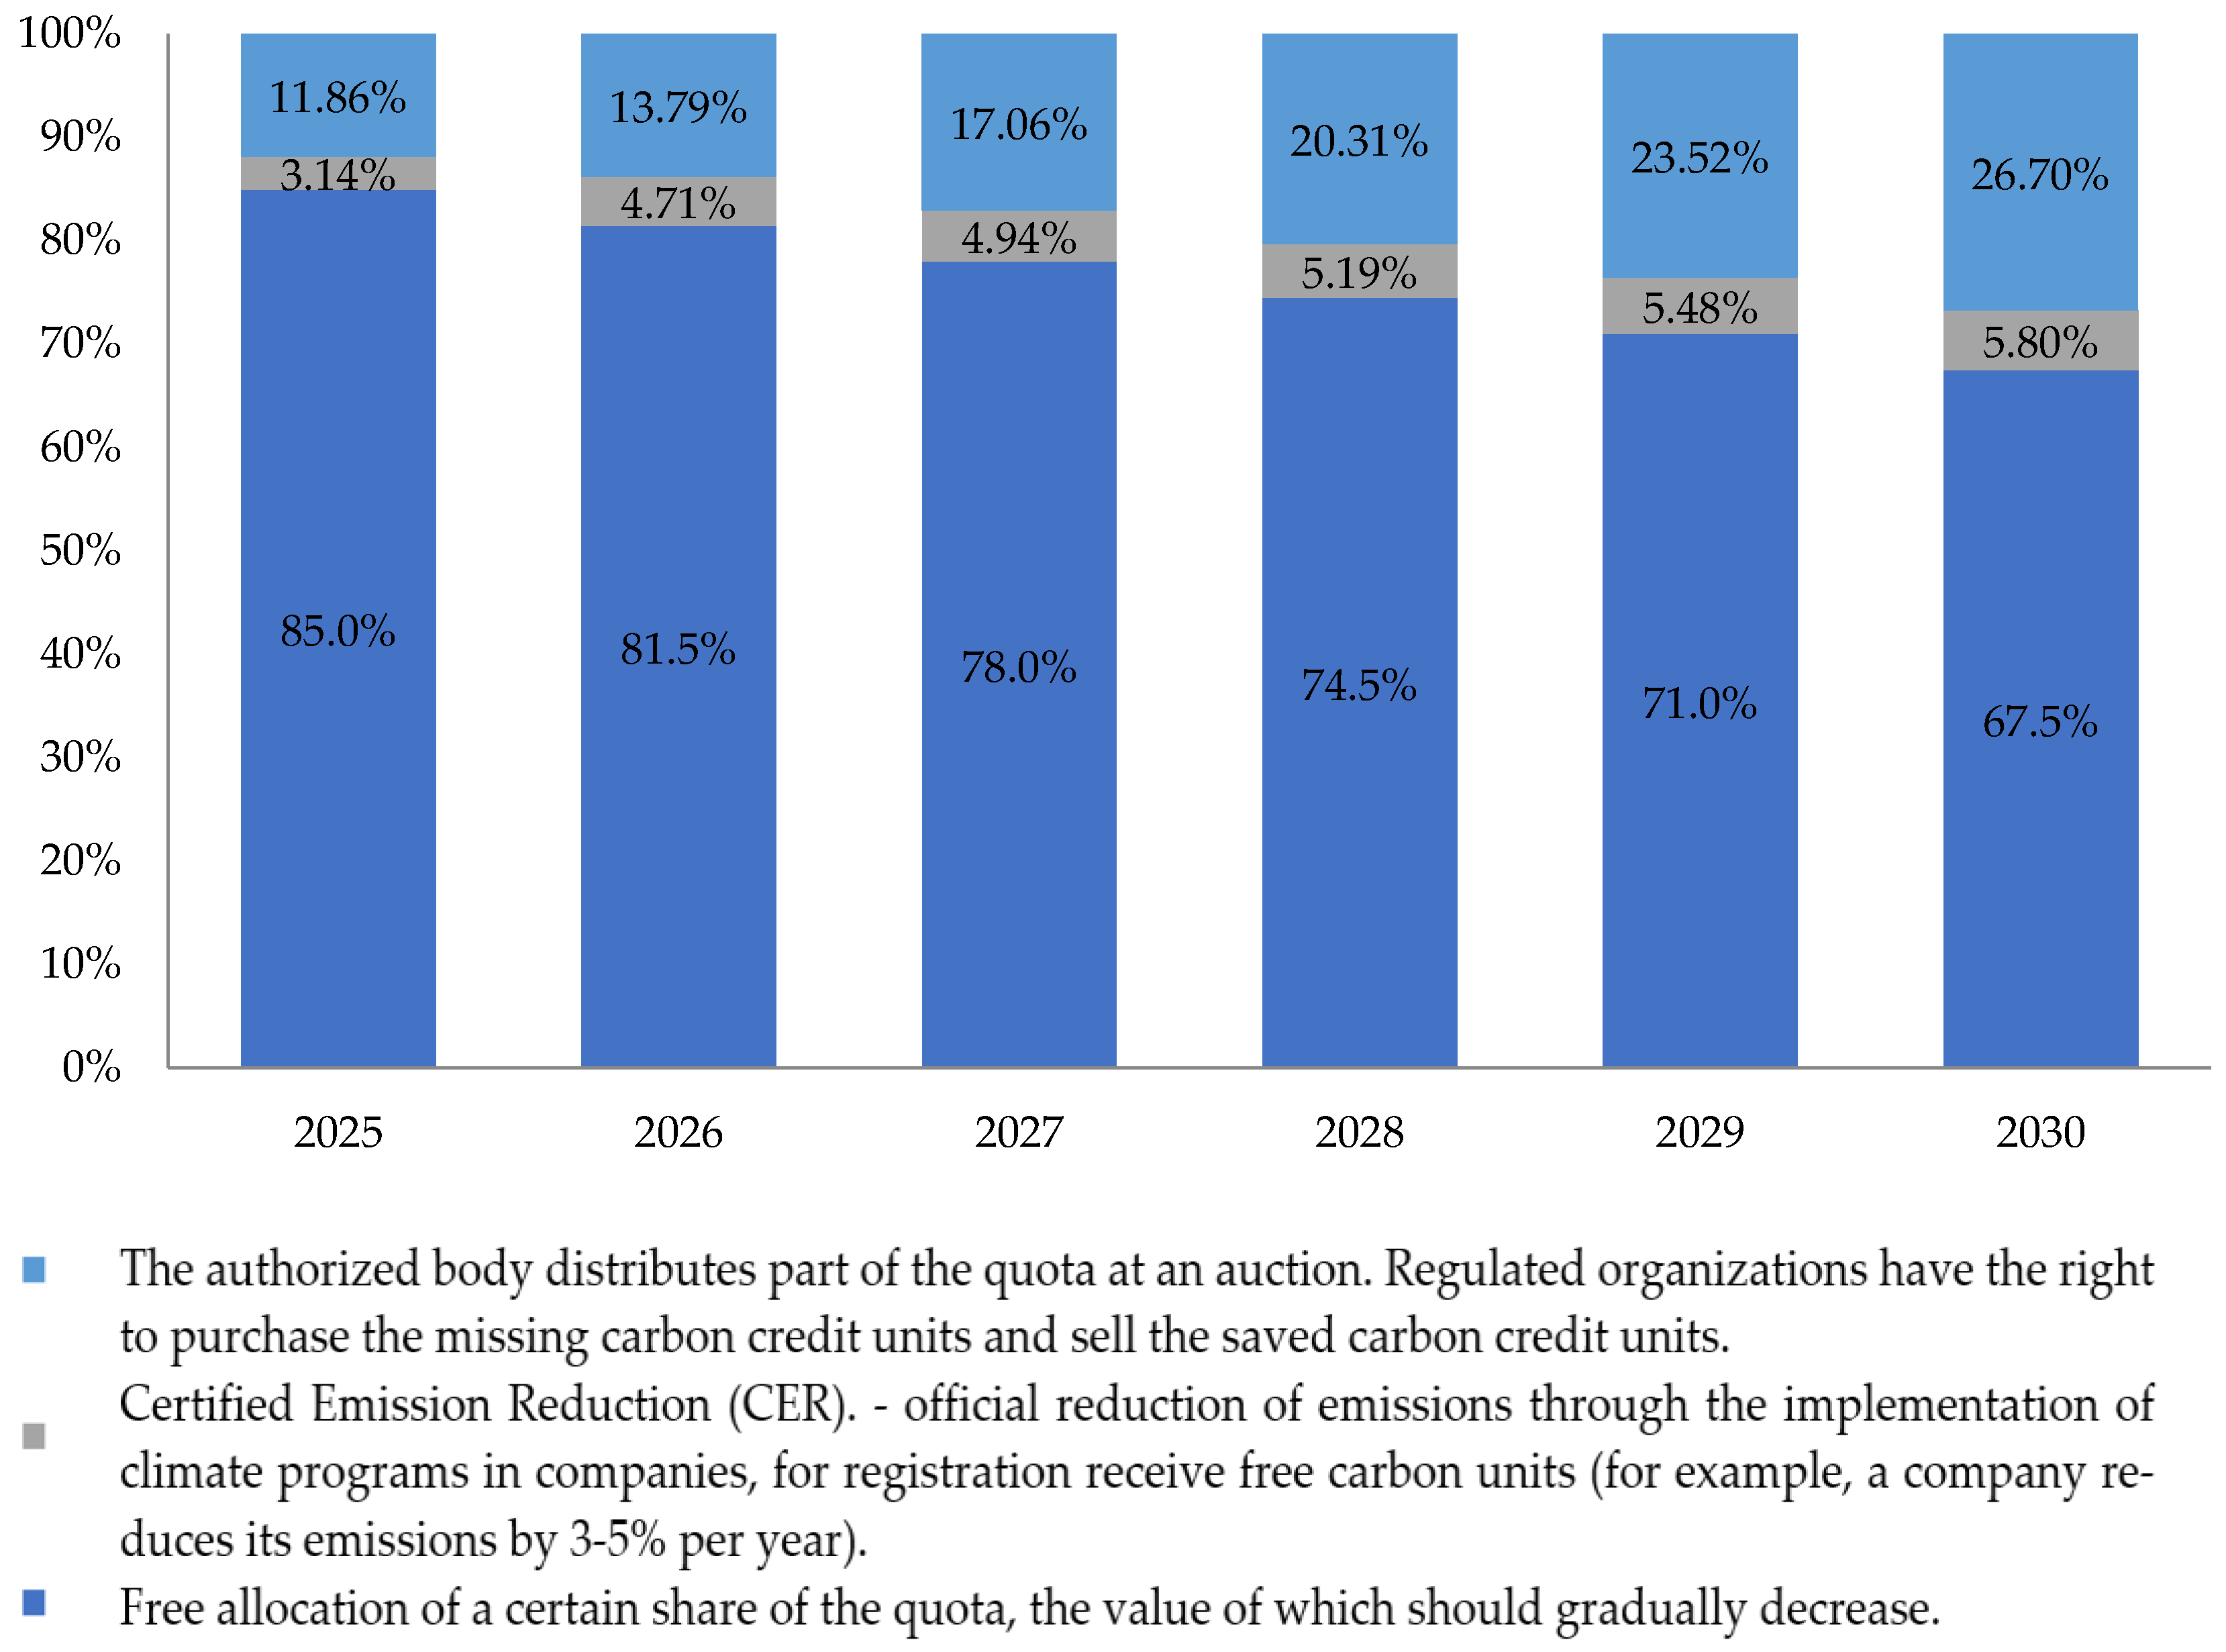
Example for the company’s set of measures (calculation for 2025-2030), 35% reduction in emissions.
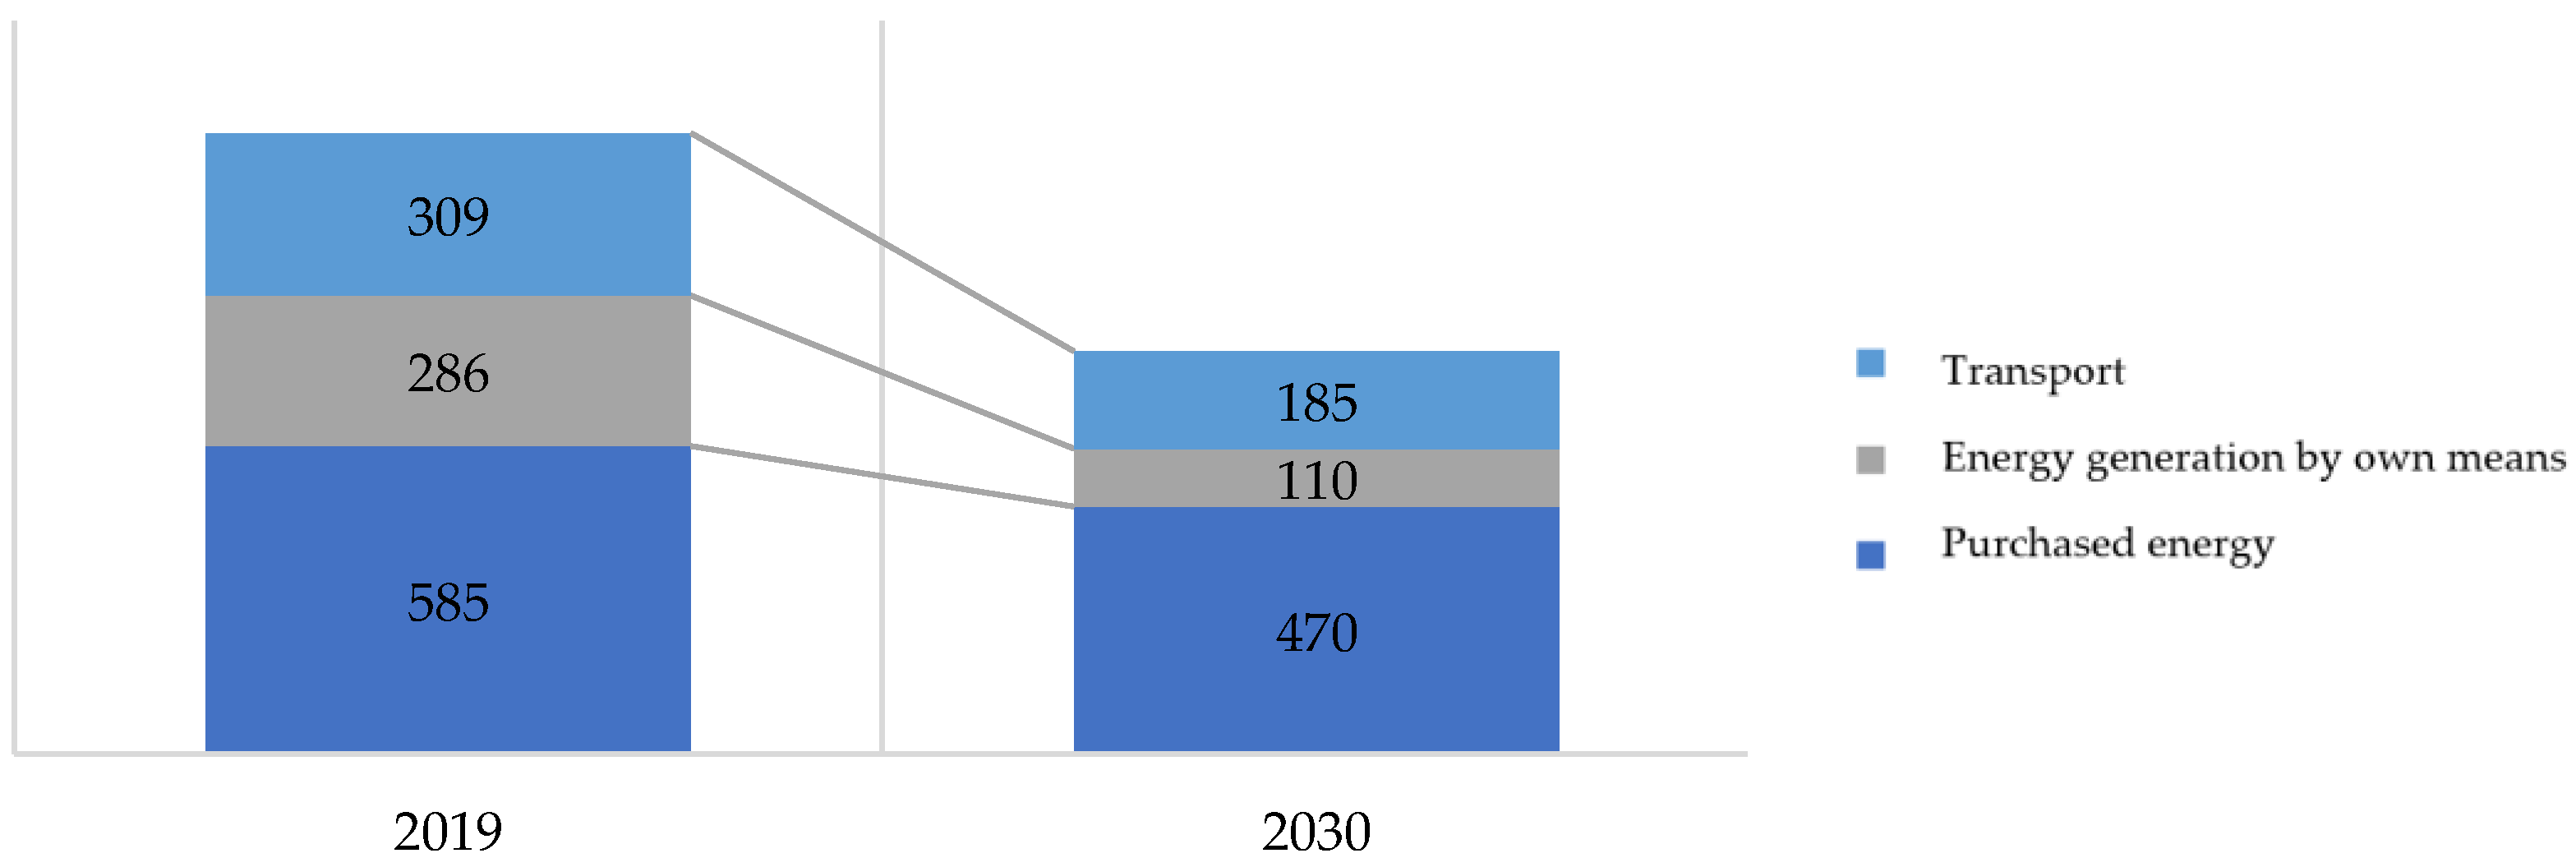
Emission-reduction targetsAbout 47,937 tons per year (about 3.8–5% per year)
Up to 765,000 tons of CO2 (up 35% from 2019 levels of about 415,000 tons of CO2)
InvestmentKey environmental initiatives are aimed at reducing carbon footprint and improving energy efficiency by connecting to grid electricity, electrifying the equipment fleet and utilizing renewable energy sources at remote facilities
The baseline scenario assumes utilization of USD 400 million raised in 2021 under loan agreements. The baseline scenario assumes utilization of USD 400 million raised under loan agreements in 2021
Additional capital expenditures in the amount of USD 450 million are possible. Additional capital expenditures of USD 450 million are possible, as well as off-balance-sheet capital expenditures of up to USD 250 million. The total capital expenditures are estimated to be USD 400 million
The total estimate of capital expenditures on climate change adaptation measures for 2021–2030 may amount to USD 1.1 billion
Potential carbon tax savings from own certified carbon unitsFrom USD 1.1 million to USD 1.47 million per year
USD 8.39 million (over the period 2025–2030)
Percentage and volume of emissions not covered per yearFrom 11.8 to 16.7%
151 to 173 thousand tons of CO2
From 11.8 to 26.7%
151 to 251 thousand tons of CO2
From 16.6 to 39.2%
From 202 to 349 thousand tons of CO2
Potential payment of carbon units on the exchange, mln. dollars USDFrom 4.6 to 5.4 per year
Up to 30.4 (for the period 2025–2030)
From 4.6 to 7.7 per year
Up to 38.2 (for the period 2025–2030)
6 to 10.7 per year
Up to 52.3 (over the period 2025–2030)
Saving the cost of supplying electricity from the grid or fuel for diesel power plantsFrom USD 8.6 million to USD 12.5 million per year
Up to 59.3 (for the period 2025–2030)
The difference in cost savings and potential payments for carbon units over 2025–2030.USD 36.85 millionUSD 29.02 millionUSD 14.89 million
Critical indicator of free quota shares at the beginning of calculationNot less than 62.8%Not less than 67.5%Not less than 76%
Required reduction rate to levelize potential costs by 2030Up to 930 thousand tons of CO2
(by 22.9% of the 2019 level)
Up to 895 thousand tons of CO2
(by 25.3% of the 2019 level)
Up to 840 thousand tons of CO2
(by 29.4% of the 2019 level)
Disclaimer/Publisher’s Note: The statements, opinions and data contained in all publications are solely those of the individual author(s) and contributor(s) and not of MDPI and/or the editor(s). MDPI and/or the editor(s) disclaim responsibility for any injury to people or property resulting from any ideas, methods, instructions or products referred to in the content.

