Abstract
The sustainability of cities often changes as rapid urban developments and population growth affect the carrying capacity. Understanding the dynamics of carrying capacity becomes crucial for tourist-oriented cities. This study focused on Baguio City, the “Summer Capital of the Philippines”, attracting large crowds on holidays and actively promoting various events on other days, thus having temporal context variations classified as regular days, days with events, and holidays. Using the enhanced urban carrying capacity load number (EUCCLN) model, the changes in the load number (LN) are calculated for different temporal contexts based on spatial indicators grouped into air, traffic, economy and waste. The city experiences the worst pressures on air quality during holidays, with 99.23% of the districts at very high to critical levels, followed by regular days and days with events. However, the total LN during holidays is balanced by favorable economic conditions with only 9.23% of the districts at the critical level. EUCCLN effectively pinpoints areas that are at critical states at any given time, advocating targeted government monitoring. We demonstrate that nighttime light, for places with no available economic data, can be used as a proxy to highlight areas requiring improved urban vibrancy. This work suggests that monitoring urban pressures using EUCCLN can easily be extended to real time with nowcasting indicator data.
1. Introduction
The rapid pace of globalization and economic growth has brought urban development to the forefront, necessitating a paradigm shift towards sustainability in urban settlements [1,2,3]. Sustainability in this context encompasses thoughtful consideration of Environmental, Social, and Governance (ESG) elements and examines various components of demographic, environmental, social, economic, transportation, and ecologic features of an area [4,5,6], acknowledging their intricate interplay and their far-reaching impact on the urban ecosystem on both short- and long-term horizons. Ultimately, sustainability in urban development aims to create livable and friendly places that are not only habitable but also nurturing for current and future generations. This pursuit aligns with the Sustainable Development Goals (SDGs) of the United Nations that recognize cities to be centers of innovation and hubs of growth, underscoring the imperative to make them sustainable, inclusive, safe, and resilient [7].
In response to the call for action on the Sustainable Development Goals, there has been a growing demand for initiatives that advance sustainable city planning, management, and capacity building. The urgency comes from the realization that urban ecosystems are vulnerable to irrevocable damage, particularly from challenges such as pollution, resource depletion, and overconsumption, when the pressures exerted on them exceed their inherent capacities [1,3,8]. Within this context, the Urban Carrying Capacity (UCC) concept emerges as an essential metric, offering thresholds that delineate the limits of human activities, population growth, per capita consumption, waste production, land utilization, and physical infrastructure development before urban ecosystems reach potential devastation [1,2,3,9,10,11,12,13].
Several descriptive-analytical and numerical models have been introduced in the past few years to measure UCC. These methods typically involve the selection of indicators and their categories, the evaluation of the limits of indicators, and the calculation of their weights or relative contribution to UCC. Wei et al. proposed using mean-variance analysis to determine the weight of each of their chosen indicators based on five categories of variables: economic, resources, environmental, infrastructure, and transportation [10]. They further evaluated the comprehensive UCC conditions of megacities and determined that environmental and infrastructural aspects, followed by resources, economic factors, and transportation, contribute the most to UCC. To incorporate the ecological dimension of an urban ecosystem in the selection of indicators, Irankhani et al. proposed the use of Geographic Information System Fuzzy Modeling (GISFM) in gradating the carrying capacities of the ecological indicators according to the maximum accepted and desirable limits [14]. Combined with the Technique for Order of Preference by Similarity to the Ideal Solution (TOPSIS) method in identifying the limits of socioeconomic indicators, they showed that no districts in Shemiran City, Tehran, Iran had desirable UCCs. The selection of their indicators was based on the Driving forces-Pressures-States-Impacts-Responses (DPSIR) framework, which describes interactions and causal relationships between human activities and the environment [5,14]. Esfandi and Nourian also assessed the UCC of Tehran’s districts in the context of the development of mega malls based on economic, social, environmental, and traffic indices in their proposed UCC Assessment Framework (UCCAF), which calculates the Degree of Carrying Capacity (DCC) of each district concerning each indicator [9]. The DCC consists of six categories that are used to evaluate the level of pressure with respect to the indicators—from desirable to critical [2,3]. Their results revealed that some districts have very low carrying capacity levels for mega malls and that site selection for mall construction neglected urban planning principles. Li et al. proposed a “Pressure-Capacity-Potential” framework to calculate the Urban Comprehensive Carrying Capacity (UCCC) using multifactor weighted summation, graded assignment, stepwise correction, and subsection variable weight [13]. Their framework evaluates the urban carrying pressure, capacity, and potential indices based on their particular indicators, which are then used to calculate the UCCC of an area. The researchers identified three development zones (priority, key, moderate) from the calculated UCCC with their recommended actions for sustainable urban development.
Recently, Tehrani et al. proposed the Enhanced Urban Carrying Capacity Load Number (EUCCLN) model [1] as an improvement to the Urban Carrying Capacity Load Number (UCCLN) model [2,3]. Both models use weighted indicators and DCCs to calculate the study area load numbers (LN), which represent the combined impact of the pressure that an indicator places on an urban ecosystem based on DCCs and the perceived importance of that indicator by experts. Although the UCCLN model aims to estimate the UCC of an area based on indicators in the contracted DPSIR framework called Pressures-States-Impacts-Responses (PSIR), the EUCCLN model focuses on monitoring human-induced impacts and thus only uses human impact indicators. It also integrates remote sensing and the Geographic Information System (GIS) for better data management and monitoring. With this simplification, the authors concluded that impact pressures alone, such as waste production, air pollution, and traffic congestion, can cause irreversible damage to the urban ecosystem [1].
The urban economic, social, and environmental criteria comprise a holistic description of sustainable urban development [4], which can then be used as indicators to calculate the UCCLN. Some studies also indicate the addition of infrastructure and transportation as separate criteria for the assessment of carrying capacity indices [9,10]. Examples of indicators that characterize the socio-environmental conditions of an area are waste production and air pollution indicators, while traffic congestion is an example indicator that characterizes transportation. The impact indicators that the EUCCLN model used are not related to the urban economy [1].
Although prior research [1,2,3,5,8,9,10,14,15] was proven to be useful in assessing the UCC of an area, rapid urban development, tourism-related activities, and population growth make the UCC very dynamic, implying the need for it to be recalculated for various temporal contexts, such as for regular days, for holidays, and during days with locally-organized events. Several works have previously recognized this dynamicity [8,16]. Wang et al. conducted dynamic assessments of the Tourism Carrying Capacity (TCC) of some of the leading Chinese urban tourism destinations [8]. They evaluated their TCC under various simulation scenarios based on the focus of different policies, which highlighted the significant role of environmental management strategies for TCC. Although this study explored different scenarios, thus exhibiting the dynamicity of TCC, it overlooked daily fluctuations. Zhang et al. also used TCC to monitor the impact of visitor attendance in theme parks. They distinguished between busy and non-busy days, noting its influence on visitor experiences, satisfaction, and behavioral intentions [17]. While the TCC provides thorough attention to the conditions in tourist hotspot settlements, calculating the TCC requires extensive tourism data from the study area, which may not be available to developing countries. A notable research gap lies in the exploration of advanced techniques, particularly the utilization of satellite data, to improve the precision and efficiency of UCC and TCC assessments.
Nighttime light (NTL) intensity data, collected by satellites, is publicly available daily data that provides a unique way to track urban growth. These data show us where and how people use artificial light at night, revealing human activity or urban vibrancy in cities and communities. Studies suggest the use of Nighttime Light (NTL) data to effectively capture urban activity [18,19,20,21]. NTL can be used as a proxy for urbanization within a city, as it exhibits a robust correlation with socioeconomic factors, making it a good candidate for modeling and monitoring spatial variables [21]. This aids in understanding temporal and spatial patterns of socioeconomic activities that are crucial for developing sustainable strategies for urban planning.
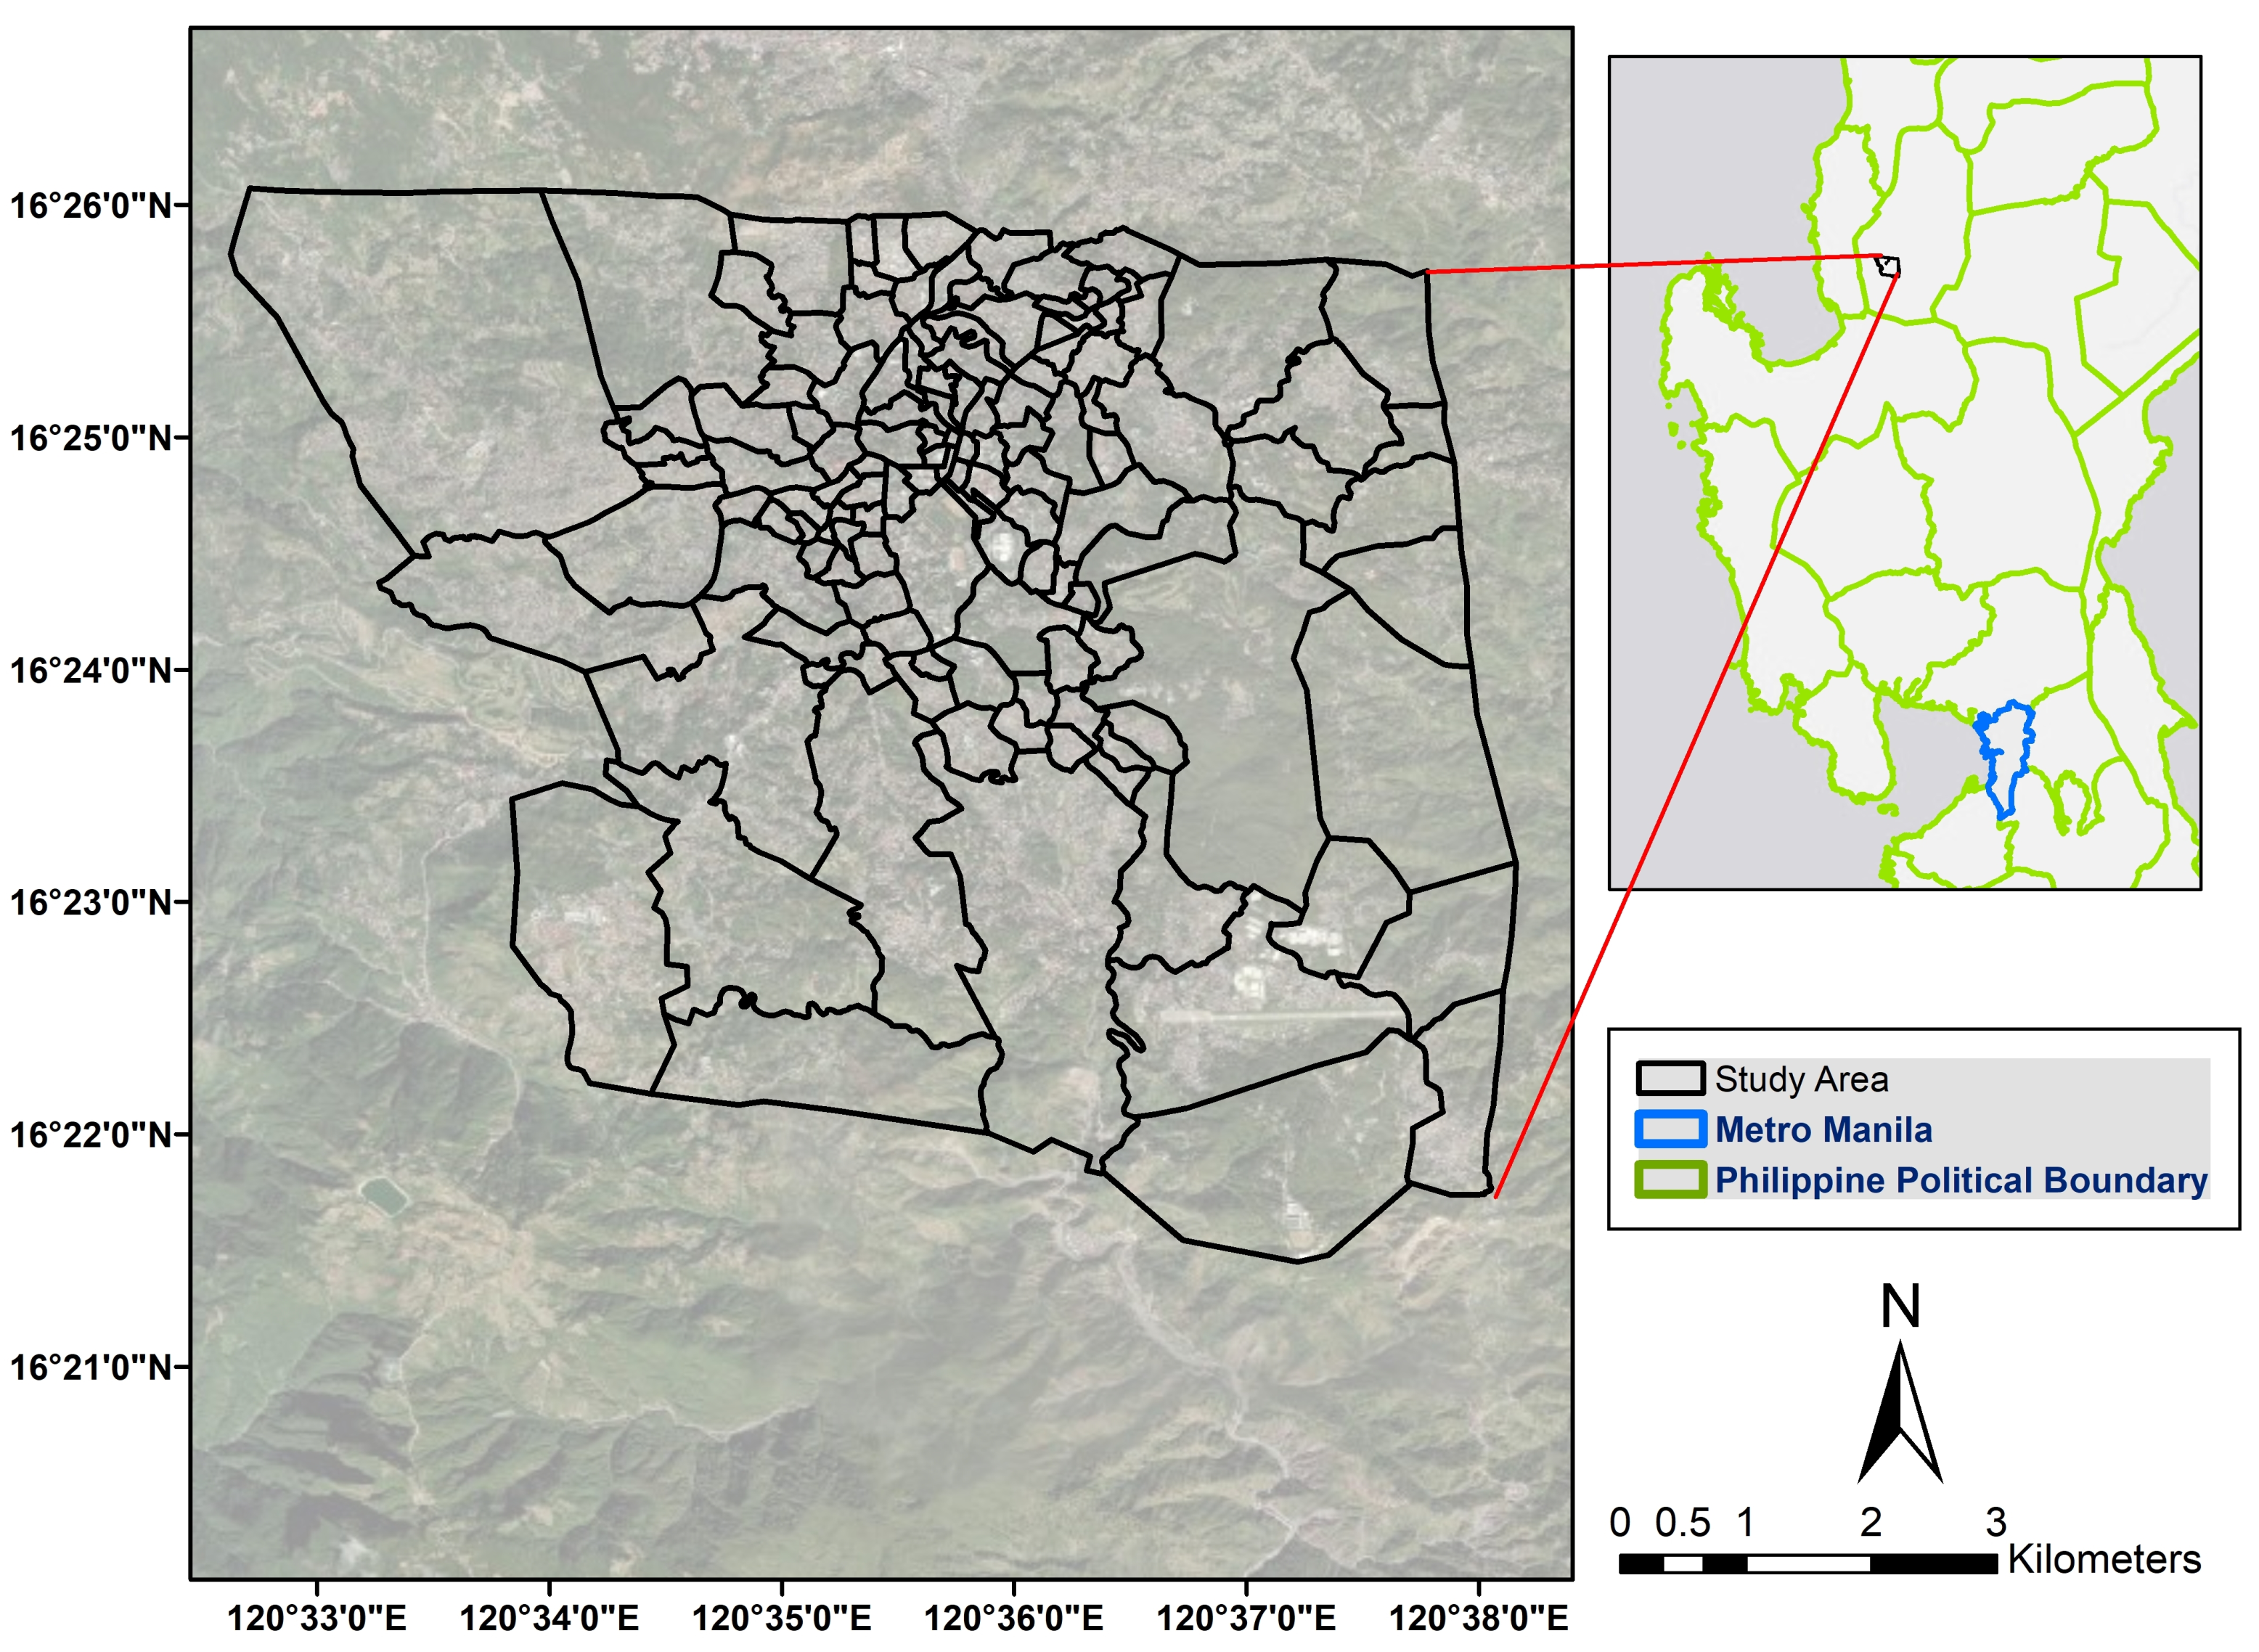
This work focuses on Baguio City, Philippines, a city that has a unique position as both a highly urbanized center and a tourist hotspot: it is known as the “Summer Capital” of the Philippines [22]. Although tourism is an important contributor to its economy, there are various sources of income in addition to tourism-related sectors. Shoppers are attracted to its retail businesses, especially flea markets, where price negotiations are encouraged. Baguio also plays a crucial role in the processing and distribution of agricultural products from the province of Benguet where it is geographically located, to the point that the vegetables traded here are commonly referred to as “Baguio” vegetables. Industries for knitted clothing, electronics, and outsourcing are also prominent in the city.
The city’s local festivals and special events attract tens of thousands of tourists, far exceeding the regular influx on typical days [23], and thus contributing significantly to its economic activities. However, this surge in tourism and population movement has brought significant challenges to the city. Traffic congestion is a prevalent problem, especially during peak seasons and holidays, leading to inconveniences and increased air pollution due to congested narrow roads and the resulting delays. Furthermore, the increase in tourists strains waste management systems, resulting in increased waste generation from hotels and restaurants. Therefore, the UCC load number is expected to be dynamic for this city. Even its local government [24] has recognized the need to measure UCC regularly, which can be used as a basis to develop customized solutions to support and maintain tourism activities.
This paper measures the UCCLN of Baguio City using the EUCCLN model updated with an economic indicator and contextualized on varying days. Due to the lack of data on economic indicators for the city’s districts, NTL is a proxy indicator of economic activity and urban vibrancy. Using this extended model, the changes in load number for various temporal contexts are investigated. The resulting insights into the dynamics of UCCLN are especially useful in assessing the pressures in highly urbanized tourist hotspots, where LN fluctuates. The same framework can then be applied to less urbanized tourist hotspots or urbanized cities that are not tourist hotspots.
2. Materials and Methods
2.1. Study Area
Baguio City, often known as “Baguio,” is an attractive mountain city nestled in the Cordillera mountain range on the island of Luzon (Figure 1). It is located approximately 270 km north of Manila, the capital of the Philippines, at an elevation that varies between 900 and 1600 m above sea level [25]. Classified as a highly urbanized city within the CAR (Cordillera Administrative Region), Baguio consists of 129 smaller administrative divisions known as barangays—analogous to districts in other cities—and covers a land area spanning 57 square kilometers. According to the Philippine Census of Population and Households 2020 [26], it has an urban population of 366,358.
Figure 1.
Administrative boundary of Baguio City.
The high altitude of Baguio contributes to its pleasantly cool climate. In contrast to most of the country, which has a tropical climate, Baguio enjoys a subtropical highland climate characterized by consistently lower temperatures throughout the year. Additionally, the city boasts more than 50 tourist attractions exhibiting distinct historical, cultural, religious, scenic natural geographic features and man-made leisure areas. These favorable climatic attributes and diverse tourist attractions make Baguio an attractive destination for residents and tourists looking to avoid the sweltering tropical heat.
2.2. Data
Similar to the impact indicators used in the EUCCLN model [1], which consisted of three criteria (air quality, traffic, waste), nine indicators were used in this study: six for air quality (average concentration of carbon monoxide (CO), carbon dioxide (), nitrogen dioxide (), sulfur dioxide (), particulate matter smaller than m (), particulate matter smaller than m ()), two for traffic (intra-barangay trips and inter-barangay trips), and one for waste (waste generation). In addition to the three criteria, we added economic, which used nighttime light (NTL) intensity data as a proxy for GDP and economic activities. This brings the total number of indicators in our model to ten. All data are geolocated to their corresponding barangays when available. Table 1 summarizes the indices used for each criterion and their corresponding spatial granularity.
Table 1.
Different criteria with their corresponding indices that were considered for the load number (LN) calculation. Due to data availability, the spatial granularity is either at barangay-level or city-level.
The following sections discuss the details of temporal contexts, data collection and processing, the importance coefficient (IC), and the limits for each indicator’s degree of carrying capacity (DCC). Finally, each criterion’s load number (LN) calculation is presented.
2.2.1. Temporal Context Variation
The time series data in this study were divided into three categories of varying contexts: regular days, holidays, and days with events. Each category in Table 2 comprises twelve days chosen throughout the year 2023, including some days in December 2022.
Table 2.
List of dates used for the different temporal context variations, based on events in Baguio City.
The regular days, which serve as the control group, consist of randomly chosen dates from a pool of non-holiday dates and without locally organized events. Only dry days were considered, as wet waste collected during rainy days increases its measured weight, which could skew the data analyzed. In the Philippines, the rainy season runs from June to November, while the dry season runs from December to May [27]. The holidays included nationally mandated holidays, such as the week-long Holy Week from Palm Sunday on the 2nd of April to Easter Sunday on the 9th of April. The 10th of April was the Philippines’ Day of Valor holiday, while the days in December included the weekend leading up to Christmas Day on the 25th of December. The days with events column in Table 2 refer to locally organized events in Baguio. The 22nd, 27th, and 29th of January were events celebrating Chinese New Year in Baguio City. The listed days in March were events celebrating the Panagbenga Flower Festival and Strawberry Festival, while the listed days in September celebrated the Baguio Country Fair.
2.2.2. Air Quality
Air quality data was taken from three air quality sensors in the city’s central area, where most tourists flock. These data were representative of the whole city, except for and . Data for and were collected by placing 80 Atmotube Pro units in volunteers whose nature of work requires them to move around the city at most times of the day. Each unit has an assigned device name and MAC address, which serves as a unique identifier for the device during pairing with a smartphone. Atmotube Pro offers real-time detection of / concentrations (g/m) and latitude and longitude values every 10 min. It is self-calibrating and certified to have accurate and acceptable measures for and , both in controlled settings and in field tests [28]. The air quality data collected from each Atmotube Pro device were geolocated to their respective barangays, and the resolution was downsampled to the daily average. Here, the outliers for each barangay, defined to be data points greater than three standard deviations from the mean, were removed [29]. Since not all places can be visited by volunteers, missing data was imputed with the daily average of neighboring barangays if available; otherwise, by the average of all barangays. With Atmotube Pro, the ambient air quality of each barangay can be detected.
2.2.3. Traffic
As part of a partnership with the Baguio City Local Government Unit, 500 GPS sensors were installed in public and private vehicles throughout the city, most (80%) of which were taxis, as probe vehicles in this study. Vehicle trip data collected includes vehicle speed, date, time, and longitude and latitude coordinates, which were geolocated. For each of the temporal variations described in Section 2.2.1 (events, holidays, regular), the average number of inter-barangay and intra-barangay trips within 100 m were obtained from the daily origin-destination (OD) matrices normalized by the total area of the barangays.
2.2.4. Waste
The Solid Waste Management Division of the Baguio City General Services Office provided the daily waste collection report. The data provided include the total weights of the waste produced and recycled for each day for the city. Missing data on some regular days in the records were due to power outages and waste collection personnel holidays, and were imputed with the average data under the same temporal context. In 2022, a waste analysis characterization study (WACS) was conducted to determine the average per capita solid waste generation (PCG), and it was found that the PCG in Baguio City was 0.49017 kg per person, including tourists. This is 22.54% higher than the average per capita generation rate for the Philippines [30], but 33.76% lower than the average per capita generation rate of the world [31].
2.2.5. Nighttime Light (NTL)
The Black Marble VIIRS/NPP Gap-Filled Lunar BRDF-Adjusted Nighttime Lights dataset, provided by NASA’s EOSDIS, is a high-quality global dataset of nighttime lights derived from observations made by the VIIRS instrument on the Suomi NPP satellite. It offers a spatial resolution of 500 m and provides daily data, making it suitable for monitoring changes over short periods. To improve accuracy, the dataset has undergone preprocessing, including BRDF adjustment, gap filling, and lunar correction. Although it is considered one of the most accurate sources of global nighttime light data, factors such as cloud cover, atmospheric conditions, and local light pollution can still influence the accuracy of the data in specific regions or time frames [32]. This study downloaded and extracted NTL data for 2018–2023 in Baguio City. The HDF5 file format of NTL was converted to GeoTIFF using Python. The total intensity was geolocated considering the total areas of each intensity value given per barangay.
2.3. Importance Coefficients
The Importance Coefficient (IC) matrix is a framework for weighing indicators according to their importance in evaluating the UCC. In this work, seven experts in the fields of systems management, transportation development, city planning, tourism, smart city, and air quality were interviewed to determine the weights of each indicator chosen following the Analytical Hierarchy Process (AHP) [1,3]. This method is a multi-criteria evaluation of quantitative and qualitative information that can be designed at two levels of hierarchy: criteria and sub-criteria [33,34,35]. Experts were asked to complete questionnaires following the template of Saaty’s pairwise comparison table [1] as shown in Table 3.
Table 3.
Template of the comparison matrix for the AHP indicators in the study.
Each row criteria/sub-criteria in Table 3 is compared against the column criteria/sub-criteria and scored in fixed values according to its relative importance to the other. These values are described in Table 4. Once the comparison table is filled out and checked for consistency [36], the overall weight of each indicator is taken as the Priority Vector (PV) calculated from the normalized eigenvector of the matrix. To obtain the overall IC matrix, each sub-criterion indicator PV is multiplied by the criteria indicator PV to which it belongs.
Table 4.
AHP scoring values and their corresponding description based on Tehrani et al. (2023) [1].
2.4. Degree of Carrying Capacity Indicators
Each indicator’s Degree of Carrying Capacity (DCC) is determined among six classes with corresponding interval levels particular to the indicator. This classification is widely used for UCC studies and is adopted from the Pressures-States-Impacts-Responses (PSIR) framework commonly used in environmental indicators. Each class represents a DCC value and a pressure degree. Previously accepted classifications for each indicator (e.g., air pollution) were applied, otherwise, the values were equally divided into six classes. Table 5 presents the six classes and their characterization [1,2,3].
Table 5.
Six classes of DCC and their characterization.
The ranges of values for each class of and follow the World Health Organization (WHO) guidelines [37] in terms of the values of the minimum desirable limit and the maximum acceptable limit, and are constant for all variations in the temporal context. Meanwhile, the DCC of the average concentration for CO, , , and , intra-barangay and inter-barangay trips, NTL intensity, and waste were considered based on equal intervals of their values [2,9] from the raw data. As a pioneering study for Baguio City, there is a lack of knowledge on the minimum desirable limits and maximum acceptable limits for these indicators.
Note that the raw data for , , intra-barangay trips, inter-barangay trips, and NTL intensity were distinguished by barangay, whereas the CO, , , , and waste indicators were classified for the whole city, mainly due to data availability. Given the lack of previous studies on the thresholds of indicators for Baguio City, the DCC limits for each of the different temporal contexts were calculated separately with the aim of investigating the fluctuations of the DCC levels in each of the periods.
2.5. Load Number Calculation
The Load Number (LN) of an indicator represents the pressure the indicator places on an urban ecosystem based on the degree of carrying capacity and the importance of that indicator [1,2,3]. It is the product of its DCC and its IC,
In this work, we calculate the LN of each indicator for each barangay for different temporal contexts.
3. Results
This section is organized starting with the presentation of the importance coefficients (IC), followed by the calculated DCCs, and finally with the visualization of LNs for different temporal contexts. Although the main goal of this work is to present how the impacts of indicators (LNs) change for different temporal contexts, we first present the distribution of the different levels of DCC for the entire city to understand how much of the city is at desirable or critical levels for each indicator.
3.1. Importance Coefficients
The Importance Coefficient values of the ten indicators in this study are ranked and shown in order from highest to lowest importance in Figure 2. Indicators of travel, specifically inter-barangay trips (IC = 26.98), economy (IC = 25.48) and waste (IC = 8.26) rank above all other indicators for air, which is further ranked in order of (IC = 7.40), (IC = 6.92), CO (IC = 6.44), (IC = 5.98), (IC = 4.64) and (IC = 4.16). The intra-barangay trips show the lowest importance with IC = 3.73.
Figure 2.
Importance Coefficient (IC) values of indicators used for assessing the UCCLN of Baguio City. The total IC for all air quality indicators has the highest IC value, followed by the total IC values for the travel indicators and the NTL. Lastly, the IC value for waste generation is the smallest.
3.2. Distribution of DCC Indicator Levels
The data obtained for each indicator per temporal context and barangay were classified into DCC levels following Table A1, Table A2 and Table A3. Histograms of the levels of the DCC indicator per temporal context are generated and distinguished by the granularity of the indicator, whether city-level or barangay-level. Based on the calculated DCC of indicators for each temporal context (see Table A1, Table A2 and Table A3), among the indicators that have no previously applied classifications, only three out of seven indicators (, , and NTL) have largely varying DCC levels for the temporal context. Due to the lack of ground truth and modeling studies on the actual DCC levels of NTL and , the succeeding analyses and calculations of load numbers (LN) are based on the DCC levels per temporal context.
3.2.1. City-Level DCC Indicators
The city-level indicators in this study include carbon monoxide (CO), carbon dioxide (), nitrogen dioxide (), sulfur dioxide (), and waste indicators. In Figure 3, CO and appear consistently at high to critical levels of DCC for most days in all temporal contexts. These gases are commonly emitted by combustion of fuels such as diesel, kerosene, and charcoal used in cooking and transportation [38]. The levels have a similar distribution on most regular days and holidays, but drop on most days with events. Some man-made sources of include the refinery and manufacturing industries [39], so locally mandated events can cause interruptions in their operation.
Figure 3.
DCC levels distribution of city-level indicators on (a) regular days, (b) holidays, and (c) days with events. Among the indicators, is at the critical DCC level (level 5) for most days during holidays and even on regular days, albeit for slightly fewer days.
is at the critical DCC level (level 5) for most days during holidays and even on regular days, albeit for slightly fewer days. On days with events, the number of days when is at a critical level drops despite an expected influx of tourists. Regular activities and human mobility may be controlled during these times depending on the events organized by Baguio City. In contrast, waste generation levels range from medium to critical on most regular days while low on most holidays and days with events. A possible reason may be that the collection of waste during these times is interrupted.
3.2.2. Barangay-Level DCC Indicators
The , , intra-barangay trips, inter-barangay trips, and NTL intensity indicator levels were averaged over all days of each temporal context to obtain their corresponding DCC levels for each barangay. In Figure 4, most barangays have high DCC levels on regular days and very high to critical levels of on holidays and days with events. Similarly, most of the barangays show increasing DCC levels from regular days (desirable to low) to days with events (medium to high) to holidays (high to very high). Intra- and inter-barangay trips on most barangays are consistently at desirable levels despite consistently high to critical levels of DCC of CO and on most days in Figure 3. Perhaps other sources of emission contribute to the soaring average concentration of CO and . The levels of NTL DCC, representative of economic activities in the city, range from desirable to critical in different barangays.
Figure 4.
DCC levels distribution of barangay-level indicators on (a) regular days, (b) holidays, and (c) days with events. While most barangays have increased DCC levels for both and from regular days to holidays and days with events, traffic is consistently at desirable levels.
3.3. Load Number
Load number (LN) represents the human-induced impacts or pressure resulting from the indicators. It incorporates the DCC levels and the ICs from expert opinions. The results of this section are presented for each context of temporal variation and organized as follows: (a) evaluation of the LNs of the city for each indicator criteria under different temporal contexts and (b) visualizations showing the maps of the total LN, LN per criteria (air quality, economic activity, traffic, waste generation), and (c) the maps of the difference in LN between the temporal variations.
Based on the thresholds established from the results of the DCC calculations, the proportion of barangays with critical LN for each criterion is shown in Table 6. On regular days, only of barangays suffer from very high to critical levels of air pollution, while and of barangays face the same levels on days with events and holidays, respectively. Regarding economic activities and urban vibrancy using NTL as a proxy, it is observed that on regular days, of barangays have very high to critical levels while it improves to and of barangays on days with events and holidays, respectively, even accounting for the influx of visitors. The results of LN for traffic are consistent for all temporal contexts, indicating that only one barangay suffers from high to critical traffic levels. This result may indicate the need for more data, as only 500 GPS trackers were deployed. Additionally, the DCC levels based on the maximum values from these limited GPS data may need further verification on the ground. Finally, the city is at a very high to critical level of waste generation on regular days, on average. While this is calculated, the ratio of the total barangays classified under very high to critical levels of LN is not obtained due to the lack of spatial information.
Table 6.
Ratio of barangays with critical LN. The air quality of almost the whole city is critical on holidays. However, the more barangays at desirable economic conditions simultaneously balances it.
In general, the human-induced impacts in Baguio City shown in Figure 5a, as represented by the total load number, are greatest during holidays, followed by regular days and days with events. Looking at each criterion, the air quality in Figure 5b is worst during holidays, while the days of events have the best air quality, which could be attributed to the closure of main roads in the city’s central area. In terms of NTL data as a proxy for economic activity in Figure 5d, the central area of the city consistently has the highest intensity during holidays, followed by days with events, with regular days having the least NTL intensity. Furthermore, it is observed that most barangays on the north and east sides of the city are consistently active during holidays and days with events. Regarding traffic in Figure 5c, the city’s central area always generates the highest number of trips regardless of the temporal context. Interestingly, more places have worse traffic during days with events compared to regular days and holidays. These results are possibly because the outflux of residents may balance the influx of tourists into the city on holidays. Meanwhile, during days of events, tourists enter the city, while residents will likely go about their usual lives there. Finally, traffic is worse during regular days than during holidays, which could be supported by the idea that most residents stay in their homes during the holidays or have less movement compared to regular days. Regarding waste generation (Figure 5e), it is observed that the largest amount of waste is generated during regular days, while the least amount of waste is generated during days with events. This result is counter-intuitive, and a more detailed inspection of the possible suspension of garbage collection during holidays should be investigated.
Figure 5.
Visualization of LN levels for all barangays of Baguio City. (a) Total LN map and LN maps for the indicators: (b) air, (c) traffic, (d) NTL, and (e) waste; under different temporal contexts, days with events, holidays, and regular days. Higher total LN numbers are found close to the central and eastern regions of the city. Notably, the LN for air is highest on holidays, indicating that the city experiences the worst pollution levels.
These results demonstrate the usefulness of monitoring and assessing the impacts of human-induced activities for different temporal contexts using EUCCLN. The same approach can be used to nowcast human-induced impact, provided that there is real-time data collection by sensors, which will be a powerful tool for decision-makers and emergency response teams.
4. Discussion
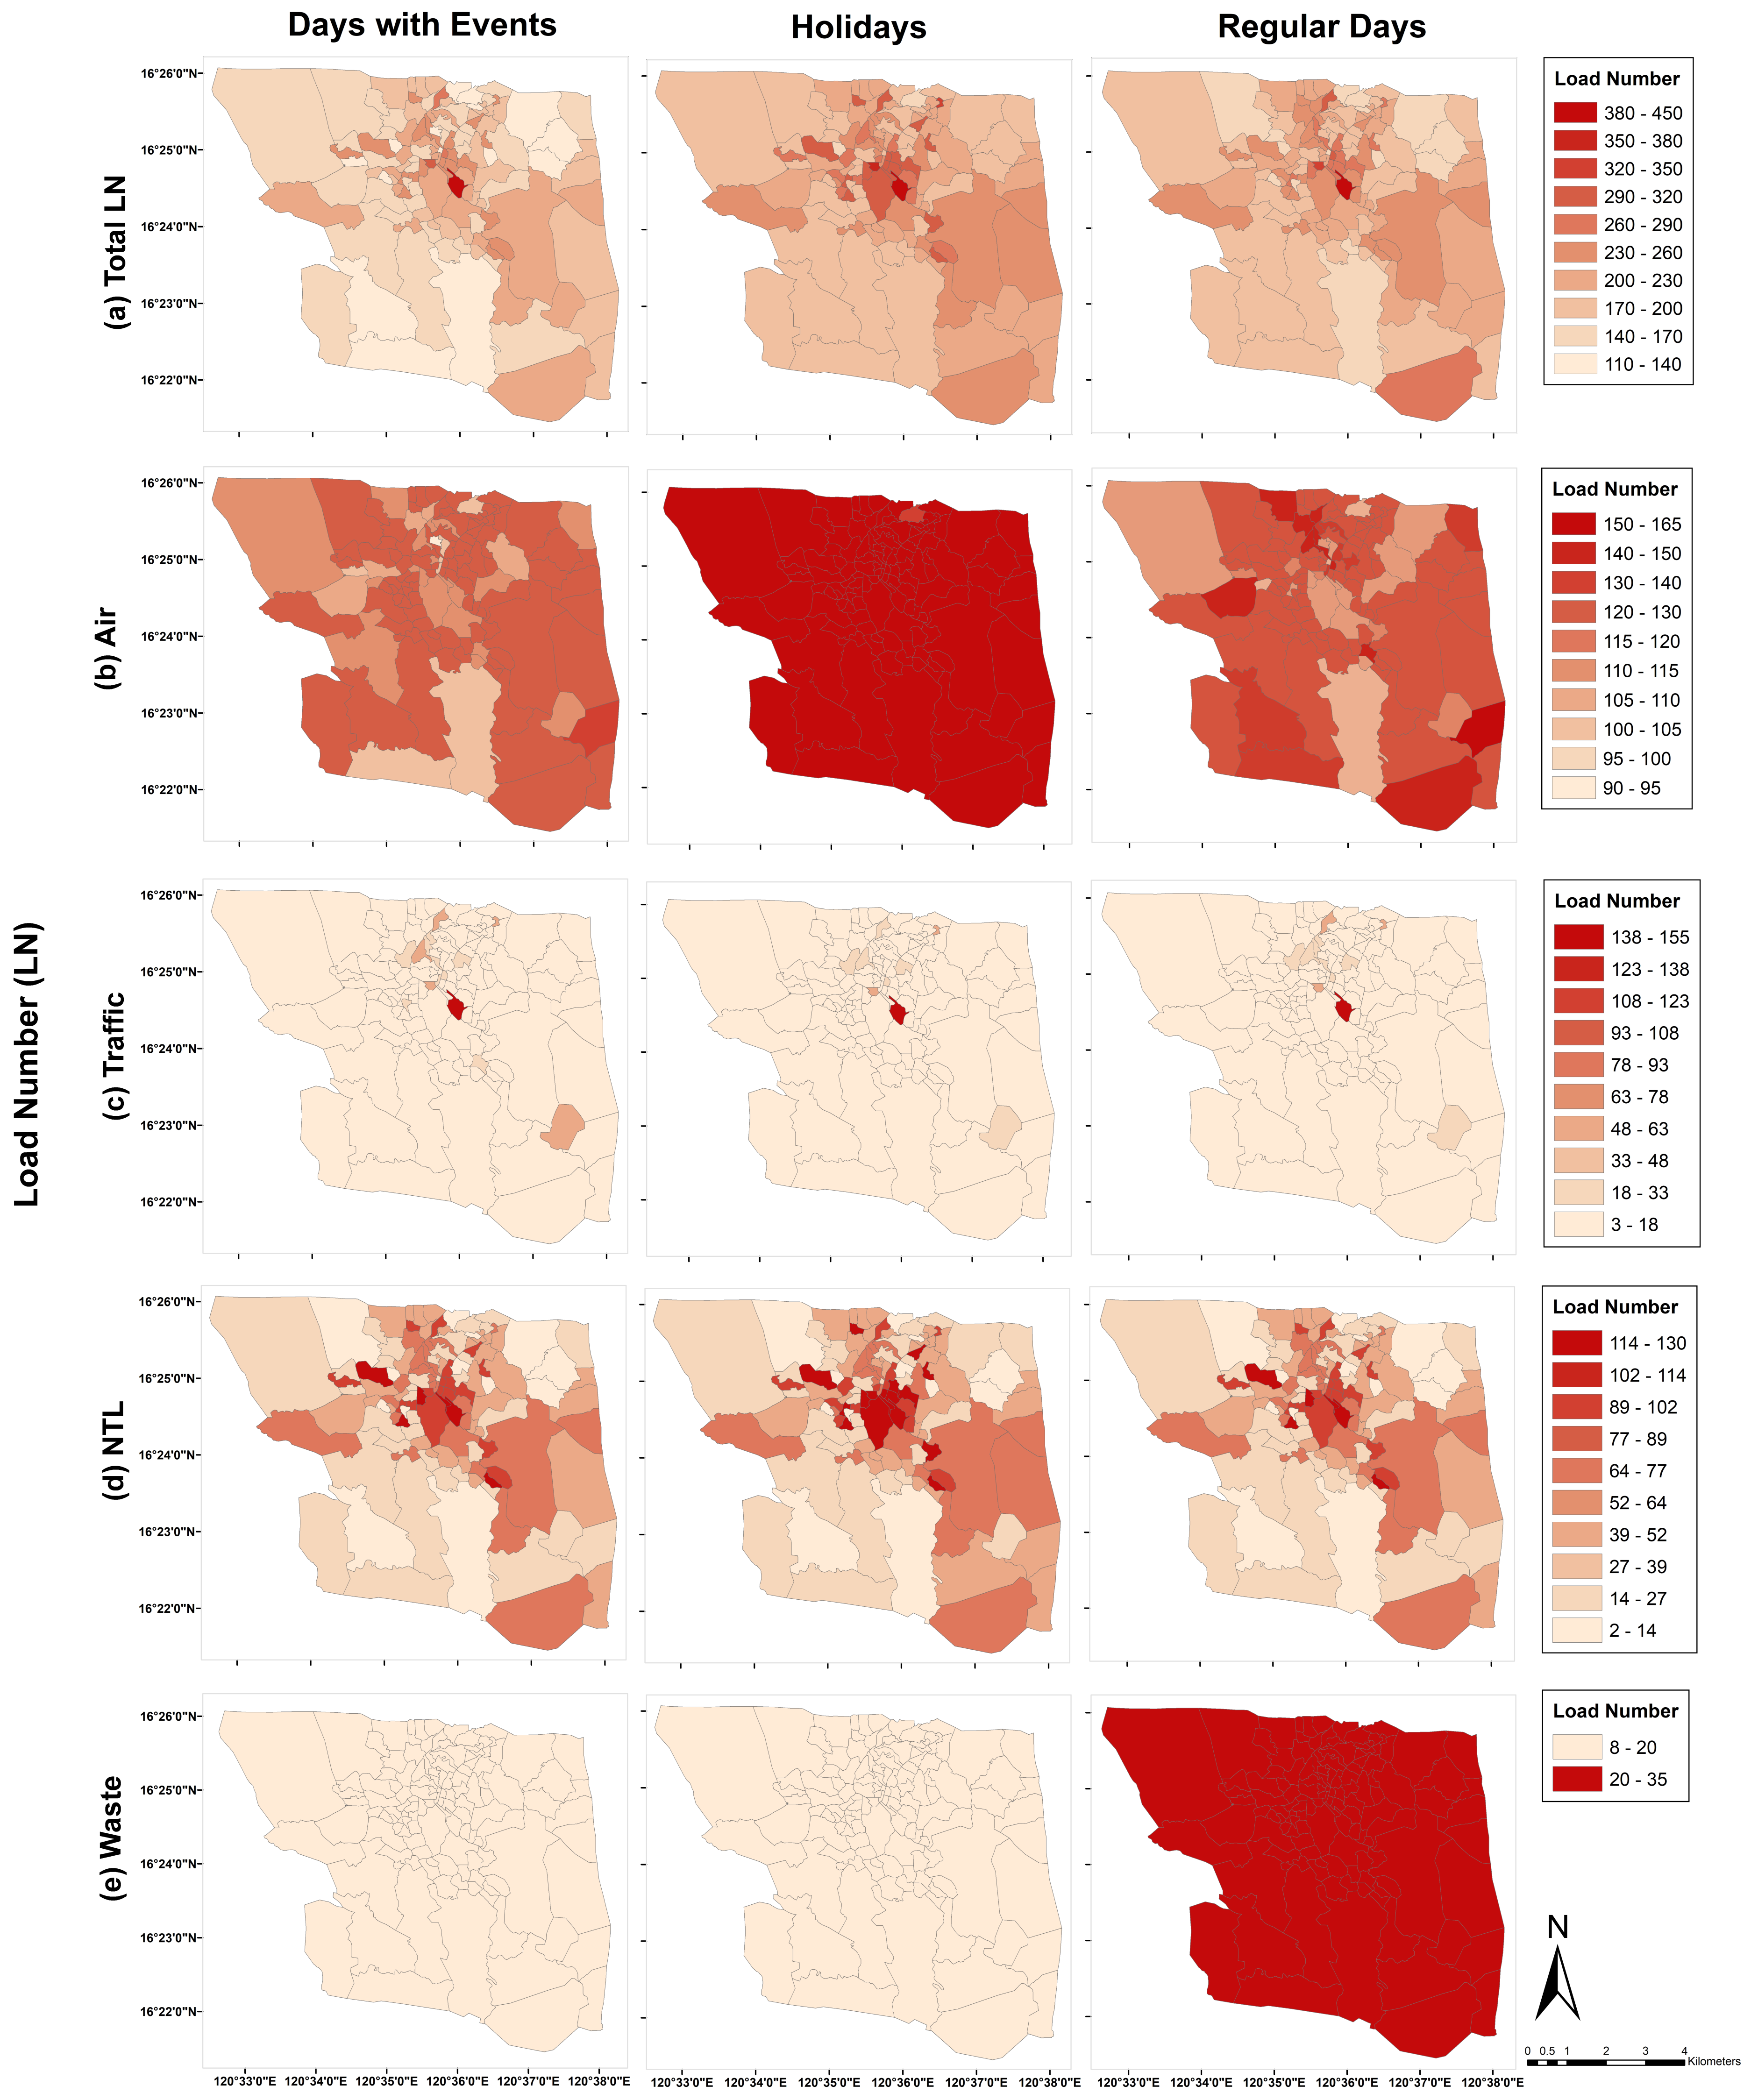
Our results above show that EUCCLN used with GIS spatial visualization provides useful insights about the total load number that a city experiences during different temporal contexts. Looking at the LN per indicator, the model results identify areas that need more attention on days with events and during holidays. Additionally, by examining the independent impacts of each indicator on the overall UCCLN, we can see in Figure 5 that UCCLN is substantially influenced by the concurrent values and weights assigned to each indicator, rather than being determined by a singular factor. The presence of a sub-optimal indicator does not necessarily translate to an overall unfavorable UCCLN. This underscores the orthogonality of our chosen criteria for indicator groups. This distinction arises because the expert-driven Analytical Hierarchy Process (AHP) determines each indicator’s weight. Therefore, it should be noted that the results for UCCLN are subjective to some extent, since it is based on opinions of experts that may be influenced by the specific visions or goals of their respective fields or by the local government itself.
Due to the subjectivity described above, one potential application of our findings lies in the prospect of reverse engineering the urban development process. Rather than calculating UCCLN after the construction of a city, our approach enables the customization of a city based on predetermined UCCLN goals and the government’s vision before its inception. Nearly 70% of the population is expected to live in cities in 2050, implying that we have to build cities for approximately 3 billion more people [40]. Thus, there is a need to build cities properly, as so much depends on how we build cities, encompassing their citizens’ general well-being and sustainability. Fundamentally, our work can be potentially useful in the construction of new cities. For example, a city planner could prioritize aspects such as traffic conditions and robust economic activities during the establishment of a city. Subsequently, by monitoring various design elements, including the number of floors in buildings, permissible amenities within specific areas, distances between structures, and the planning of land-use zones, among other factors, the maximum UCC and load numbers can be identified. This approach provides a proactive means to shape a city in alignment with predefined criteria and goals.
For a better understanding of the change in impact from regular days to days with events and holidays, differences in human-induced impacts between (a) regular and days with events, (b) regular and holidays, and (c) events and holidays are analyzed. Figure 6 shows the maps of the LN differences for each criterion between temporal variations. Positive difference values in brown indicate that the first temporal context in the comparison has higher LN values than the second temporal context (e.g., regular days-holidays in brown indicates that LN is higher on regular days than on holidays for the specific barangay). Green indicates otherwise. For instance, Figure 6a substantiates the interpretation that the LN for different barangays are highest for holidays, followed by regular days, and lowest for days with events.
Figure 6.
Visualization of the differences in LN levels for (a) total LN, (b) air, (c) traffic, (d) NTL, and (e) waste, between different temporal contexts regular days-events, regular days-holidays, and events-holidays. A positive difference in brown indicates that the impact is greater in the first temporal context in the comparison, while a negative difference in green indicates otherwise. The differences highlight which barangays suffer from increased LN or worse impacts for each indicator and captured actual observations on the ground (e.g., the worsened pollution level at the main gateway of Baguio City (Camp 7 in Figure 1) on holidays.
In Figure 6b under regular days-holidays, the results captured the severely increased levels of pollution in barangay Camp 7 (see Figure 1) during holidays compared to regular days. This area includes Kennon road which is infamous for being congested with vehicles during the holidays [41,42], as it serves as one of the gateways of Baguio. However, we do not see any similar result in terms of traffic in Figure 6c, since most GPS trackers are connected to taxis whose travel is mostly limited within the city. However, through these graphs showing the differences in total trips in each barangay, one can see which areas suffer the worst traffic during days with events (for example, the barangays in the vicinity of the Loakan Airport, where tourists also enter the city). More evidently, with the different plots, the central city area becomes less traffic during holidays than during days of events, as discussed in the previous section. This may be due to the idea that tourists mainly move around the city on holidays, while residents prefer to rest. This coincides with the result of [43] in which resting activity was observed to increase during vacations, with a more pronounced magnitude if the duration of vacation is four days or more. The holidays included in Table 2 are more or less a week long.
Although the results from the number of trips may not capture the complete effect of events on holidays in most parts of the city, the use of NTL may be more informative in terms of measuring the change in load number of human-induced impacts on non-regular days from regular days (Figure 6d) since NTL has been shown to capture information regarding economic activities and human movements [21]. Finally, the differences in waste generation in Figure 6e may provide insight into the improvements needed in the city. The high difference in waste generation between regular days and non-regular days may be indicative of the suspension of waste collection as workers may also be having their breaks on holidays or may not be able to collect waste on days with events because of a lack of access to collection sites due to several roads being closed and blocked during events.
5. Conclusions
Globalization and the rapid growth of cities require sustainable development of urban areas. Sustainability in this context is the examination of the various dynamic components called indicators that interact and impact the urban environment in the short and long term. This study focuses on Baguio City, the “Summer Capital of the Philippines”, which attracts large crowds on holidays and whose local government actively promotes various events on non-holidays, thus having temporal context variations classified as regular days, days with events, and holidays. Here, changes in urban pressures for different temporal contexts based on spatial indicators grouped into air, traffic, economy, and waste were investigated using the enhanced urban carrying capacity load number (EUCCLN) model. The enhanced urban carrying capacity load number model has successfully assessed the pressures of human activities for different cities with its advantage of incorporating spatial information.
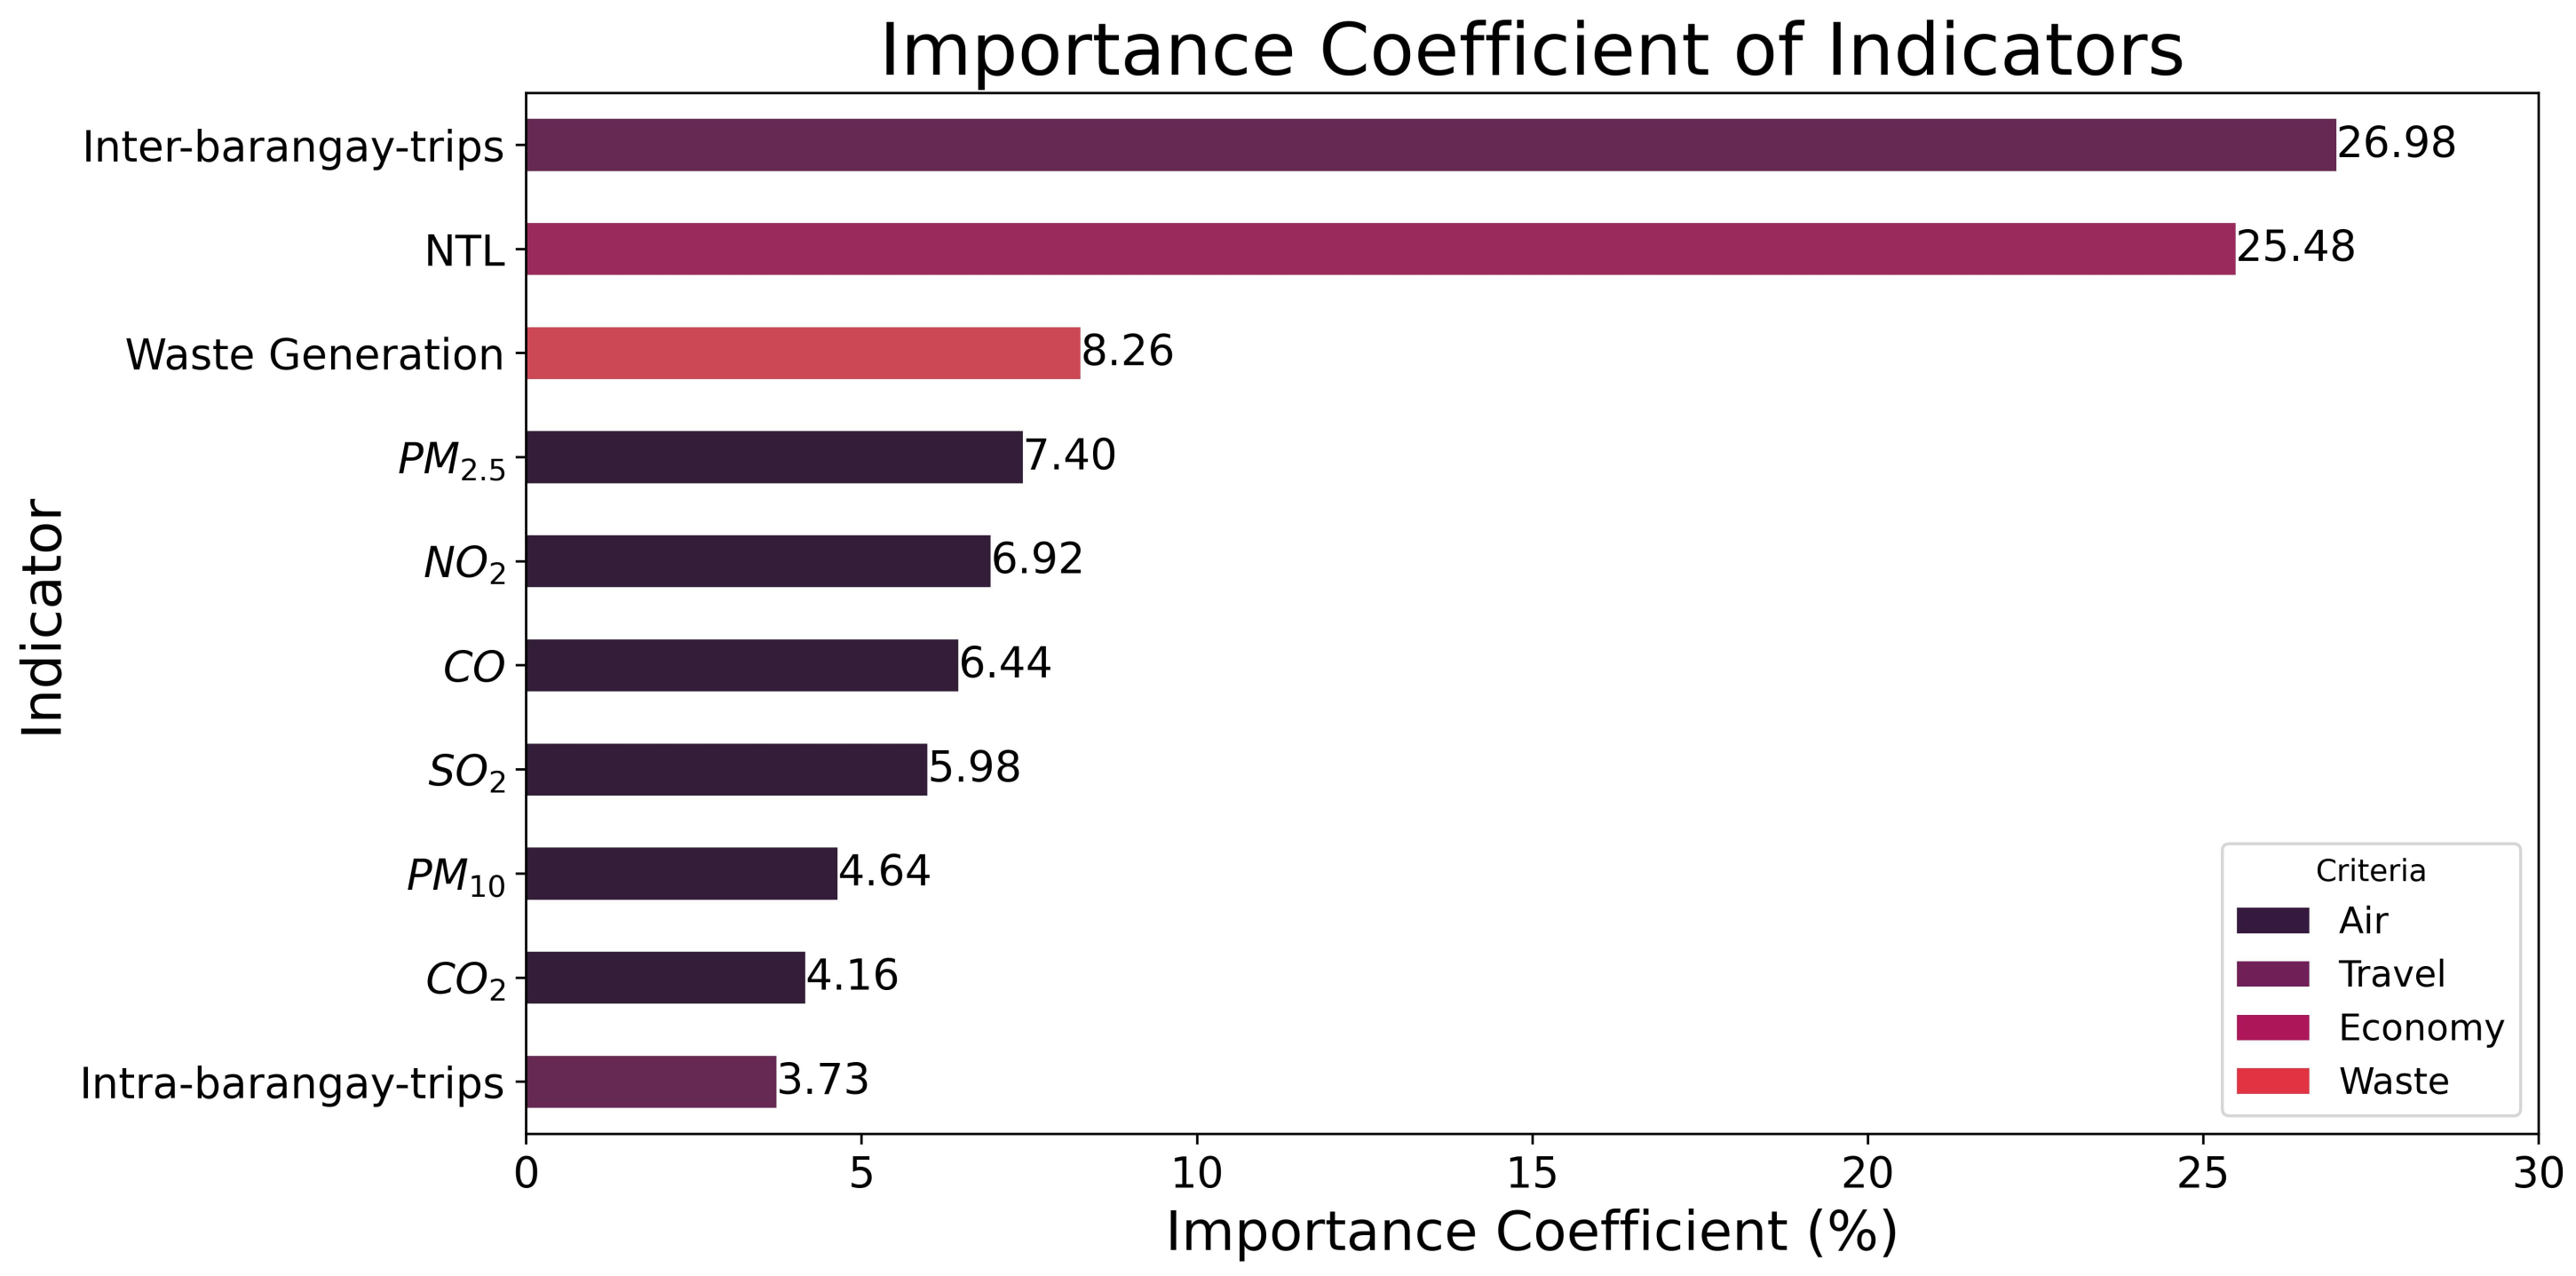
In this work, the EUCCLN was used with a three-step calculation of load number: (1) calculation of importance coefficients using AHP, (2) calculation of DCC levels, and (3) calculation of the load number (LN). An improvement to this model incorporates a proxy economic indicator called the nighttime light (NTL). Our results showed that human-induced impacts, as represented by the LN, are generally most significant during holidays, followed by regular days and days with events. Specifically, of barangays in Baguio City experience very high to critical levels of poor air quality during holidays. The intensity of economic activity in the central area is also highest during holidays with the city having only of the total barangays experiencing very high to critical economic pressures. On regular days, more barangays experience very high to critical levels of economic forces, having the least NTL intensity in the central area. For air pollution levels, only of barangays in Baguio City are critical on regular days. However, the largest amount of waste is generated on this temporal variation. On the other hand, air quality and economic conditions are consistently moderate during days with events. Traffic conditions are worst during days with events, although concentrated in the central area for all temporal variations. In this work, the ability of EUCCLN to effectively pinpoint areas experiencing critical states at any time has been demonstrated, suggesting the need for targeted government monitoring.
A possible application of this work is customizing city building according to the desired UCCLN and government goals. Identifying the maximum UCC and load number can be used to monitor, for example, the design of the buildings to be built in the city (e.g., number of floors), the amenities to be allowed within an area, and the planning of land-use zones, among others. Furthermore, the possibility of expanding this work to include the effects of local climate conditions on urban carrying capacity may be explored. Local weather variables may have frequent intra-day changes (in intervals of minutes to hours). However, its effects on indicators and ultimately on the UCC and UCCLN may not be significant as changes in UCC in a short time may be zero or negligible at best. Nevertheless, we deem that the effects of local climate conditions may be more significant after a year or decades. Therefore, we recommend exploring this effect of local climate conditions for long-term cases, as more data are collected over time. Finally, another possible powerful expansion of EUCCLN is nowcasting it using real-time data.
Author Contributions
Conceptualization, M.L.; methodology, M.L.; software, M.L., G.F. and A.V.; validation, M.L., G.F. and A.V.; formal analysis, M.L. and G.F.; investigation, M.L. and A.V.; resources, M.L., G.F. and A.V.; data curation, M.L. and A.V.; writing—original draft preparation, M.L., G.F. and A.V.; writing—review and editing, M.L., G.F., A.V., C.A. and C.M.; visualization, G.F. and A.V.; supervision, C.A. and C.M.; project administration, M.L. and C.M.; funding acquisition, C.M. All authors have read and agreed to the published version of the manuscript.
Funding
This research was funded by the Philippine Department of Science and Technology (DOST) with Project No. 10237. The funding agency has no involvement in the preparation of the manuscript.
Data Availability Statement
The data presented in this study are available on request from the corresponding author. The data are not publicly available due to privacy and internal agreements made with the local government of Baguio City.
Acknowledgments
The authors thank Jesus Felix Valenzuela, John Peter Antonio, Shan-ry Roberts, and Jomar Tampoc for the valuable discussions and insights into this work. The authors are also grateful for the assistance and support provided by the Local Government Unit of Baguio City, the City Police Office and their officers, and the Rehabilitation Action for Baguio (RAB) volunteers.
Conflicts of Interest
The authors declare no conflict of interest. The funders had no role in the design of the study; in the collection, analyses, or interpretation of data; in the writing of the manuscript; or in the decision to publish the results.
Appendix A
Table A1, Table A2 and Table A3 show the DCC classes of all indicators in different temporal contexts. In all tables, the and indicators have the same ranges for all classes while the rest of the other indicators vary.
Table A1.
Indicators DCC on regular days.
Table A1.
Indicators DCC on regular days.
| Regular Days | |||||||
|---|---|---|---|---|---|---|---|
| DCC | |||||||
| Indices | Measuring Unit | 0.1 (Desirable) | 1 (Low) | 2 (Medium) | 3 (High) | 4 (Threshold) | 5 (Critical) |
| g/m | 0–5 | 5.01–10 | 10.01–15 | 15.01–20 | 20.01–25 | 25< | |
| g/m | 0–15 | 15.01–20 | 20.01–30 | 30.01–40 | 40.01–50 | 50< | |
| CO | mol/m | 0–0.129 | 0.130–0.258 | 0.259–0.387 | 0.388–0.516 | 0.517–0.645 | 0.646–0.774 |
| mol/m | 0–24.06 | 24.07–48.12 | 48.13–72.18 | 72.19–96.24 | 96.25–120.3 | 120.31–144.361 | |
| mol/m | 0–0.008 | 0.009–0.016 | 0.017–0.024 | 0.025–0.032 | 0.033–0.04 | 0.041–0.046 | |
| mol/m | 0–0.0035 | 0.0036–0.007 | 0.0071–0.0105 | 0.0106–0.014 | 0.0141–0.0175 | 0.0176–0.021 | |
| Intra-barangay | number of trips per 100 m | 0–20.58 | 20.59–41.16 | 41.17–61.74 | 61.75–82.32 | 82.33–102.9 | 103.0–123.46 |
| Inter-barangay | number of trips per 100 m | 0–107.44 | 107.45–214.88 | 214.89–322.32 | 322.33–429.76 | 429.77–537.2 | 537.21–644.64 |
| NTL (GDP) | W/m | 0–86.11 | 86.12–172.22 | 172.23–258.33 | 258.34–344.44 | 344.45–430.55 | 430.55–516.67 |
| Waste generation | kgs/ha | 0–25 | 25.01–30.5 | 30.51–35.5 | 35.51–40.5 | 40.51–45.5 | 45.51–52.62 |
Table A2.
Indicators DCC on holidays.
Table A2.
Indicators DCC on holidays.
| Holidays | |||||||
|---|---|---|---|---|---|---|---|
| DCC | |||||||
| Indices | Measuring Unit | 0.1 (Desirable) | 1 (Low) | 2 (Medium) | 3 (High) | 4 (Threshold) | 5 (Critical) |
| g/m | 0–5 | 5.01–10 | 10.01–15 | 15.01–20 | 20.01–25 | 25< | |
| g/m | 0–15 | 15.01–20 | 20.01–30 | 30.01–40 | 40.01–50 | 50< | |
| CO | mol/m | 0–0.133 | 0.134–0.266 | 0.267–0.399 | 0.4–0.532 | 0.533–0.665 | 0.666–0.795 |
| mol/m | 0–3.86 | 3.87–7.72 | 7.73–11.58 | 11.59–15.44 | 15.45–19.3 | 19.31–23.18 | |
| mol/m | 0–0.008 | 0.009–0.016 | 0.017–0.024 | 0.025–0.032 | 0.033–0.04 | 0.041-0.049 | |
| mol/m | 0–0.002 | 0.0021–0.004 | 0.0041–0.006 | 0.0061–0.008 | 0.0081–0.01 | 0.0101–0.013 | |
| Intra-barangay | number of trips per 100 m | 0–20.58 | 20.59–41.16 | 41.17–61.74 | 61.75–82.32 | 82.33–102.9 | 103.0–123.46 |
| Inter-barangay | number of trips per 100 m | 0–105.00 | 105.01–210 | 210.01–315 | 315.01–420 | 420.01–525 | 525.01–630.03 |
| NTL (GDP) | W/m | 0–73.88 | 73.89–147.76 | 147.77–221.64 | 221.65–295.52 | 295.53–369.4 | 369.41–443.25 |
| Waste generation | kgs/ha | 0–25 | 25.01–35 | 35.01–40 | 40.01–50 | 50.01–60 | 60.01–78.51 |
Table A3.
Indicators DCC on days with events.
Table A3.
Indicators DCC on days with events.
| Days with Events | |||||||
|---|---|---|---|---|---|---|---|
| DCC | |||||||
| Indices | Measuring Unit | 0.1 (Desirable) | 1 (Low) | 2 (Medium) | 3 (High) | 4 (Threshold) | 5 (Critical) |
| g/m | 0–5 | 5.01–10 | 10.01–15 | 15.01–20 | 20.01–25 | 25< | |
| g/m | 0–15 | 15.01–20 | 20.01–30 | 30.01–40 | 40.01–50 | 50< | |
| CO | mol/m | 0–0.12 | 0.121–0.24 | 0.241–36 | 0.361–0.48 | 0.481–0.60 | 0.601–0.717 |
| mol/m | 0–21.04 | 21.05–42.08 | 42.09–63.12 | 63.13–84.16 | 84.17–105.2 | 105.31–126.239 | |
| mol/m | 0–0.007 | 0.008–0.014 | 0.015–0.021 | 0.022–0.028 | 0.029–0.035 | 0.036–0.0445 | |
| mol/m | 0–0.008 | 0.009–0.016 | 0.017–0.024 | 0.025–0.032 | 0.033–0.04 | 0.041–0.049 | |
| Intra-barangay | number of trips per 100 m | 0–20.58 | 20.59–41.16 | 41.17–61.74 | 61.75–82.32 | 82.33–102.9 | 103.0–123.46 |
| Inter-barangay | number of trips per 100 m | 0–83.32 | 83.33–166.64 | 166.65–249.96 | 249.97–333.28 | 333.29–416.6 | 416.61–499.92 |
| NTL (GDP) | W/m | 0–83.72 | 83.73–167.44 | 167.45–251.16 | 251.17–334.88 | 334.89–418.6 | 418.7–502.29 |
| Waste generation | kgs/ha | 0–25 | 25.01–30 | 30.01–35 | 35.01–40 | 40.01–45 | 45.01–50.23 |
References
- Abbaszadeh Tehrani, N.; Farhanj, F.; Janalipour, M. Monitoring the Impacts of Human Activities on Urban Ecosystems Based on the Enhanced UCCLN (EUCCLN) Model. ISPRS Int. J. Geo-Inf. 2023, 12, 170. [Google Scholar] [CrossRef]
- Abbaszadeh Tehrani, N.; Makhdoum, M. Implementing a spatial model of Urban Carrying Capacity Load Number (UCCLN) to monitor the environmental loads of urban ecosystems. Case study: Tehran metropolis. Ecol. Indic. 2013, 32, 197–211. [Google Scholar] [CrossRef]
- Shayesteh, K.; Ghandali, M. Evaluation of the Carrying Capacity of Semnan Using Urban Carrying Capacity Load Number Model. ECOPERSIA 2017, 5, 1941–1953. Available online: http://ecopersia.modares.ac.ir/article-24-1531-en.html (accessed on 26 October 2023).
- Ren, Y.; Shen, L.; Wei, X.; Wang, J.; Cheng, G. A guiding index framework for examining urban carrying capacity. Ecol. Indic. 2021, 133, 108347. [Google Scholar] [CrossRef]
- Zhao, R.; Fang, C.; Liu, H.; Liu, X. Evaluating urban ecosystem resilience using the DPSIR framework and the ENA model: A case study of 35 cities in China. Sustain. Cities Soc. 2021, 72, 102997. [Google Scholar] [CrossRef]
- Kyriazopoulos, A.P.; Skre, O.; Sarkki, S.; Wielgolaski, F.E.; Abraham, E.M.; Ficko, A. Human–environment dynamics in European treeline ecosystems: A synthesis based on the DPSIR framework. Clim. Res. 2017, 73, 17–29. [Google Scholar] [CrossRef]
- Sustainable Cities and Human Settlements. Available online: https://sdgs.un.org/topics/sustainable-cities-and-human-settlements (accessed on 4 October 2023).
- Wang, J.; Huang, X.; Gong, Z.; Cao, K. Dynamic assessment of tourism carrying capacity and its impacts on tourism economic growth in urban tourism destinations in China. J. Destin. Mark. Mark. 2020, 15, 100383. [Google Scholar] [CrossRef]
- Esfandi, S.; Nourian, F. Urban carrying capacity assessment framework for mega mall development. A case study of Tehran’s 22 municipal districts. Land Use Policy 2021, 109, 105628. [Google Scholar] [CrossRef]
- Wei, Y.; Huang, C.; Li, J.; Xie, L. An evaluation model for urban carrying capacity: A case study of China’s mega-cities. Habitat Int. 2016, 53, 87–96. [Google Scholar] [CrossRef]
- Wei, Y.; Huang, C.; Lam, P.T.I.; Sha, Y.; Feng, Y. Using urban-carrying capacity as a benchmark for sustainable urban development: An empirical study of Beijing. Sustainability 2015, 7, 3244–3268. [Google Scholar] [CrossRef]
- Tian, Y.; Sun, C. Comprehensive carrying capacity, economic growth and the sustainable development of urban areas: A case study of the Yangtze River Economic Belt. J. Clean. Prod. 2018, 195, 486–496. [Google Scholar] [CrossRef]
- Li, B.; Guan, M.; Zhan, L.; Liu, C.; Zhang, Z.; Jiang, H.; Zhang, Y.; Dong, G. Urban Comprehensive Carrying Capacity and Development Order: A “Pressure-Capacity-Potential” Logical Framework. Front. Environ. Sci. 2022, 10, 935498. [Google Scholar] [CrossRef]
- Irankhahi, M.; Jozi, S.A.; Farshchi, P.; Shariat, S.M.; Liaghati, H. Combination of GISFM and TOPSIS to evaluation of Urban Environment Carrying Capacity (Case study: Shemiran City, Iran). Int. J. Environ. Sci. Technol. 2017, 14, 1317–1332. [Google Scholar] [CrossRef]
- Vandarakis, D.; Malliouri, D.; Petrakis, S.; Kapsimalis, V.; Moraitis, V.; Hatiris, G.A.; Panagiotopoulos, I. Carrying Capacity and Assessment of the Tourism Sector in the South Aegean Region, Greece. Water 2023, 15, 2616. [Google Scholar] [CrossRef]
- Ye, F.; Park, J.; Wang, F.; Hu, X. Analysis of early warning spatial and temporal differences of tourism carrying capacity in China’s island cities. Sustainability 2020, 12, 1328. [Google Scholar] [CrossRef]
- Zhang, Y.; Li, X.; Su, Q.; Hu, X. Exploring a theme park’s tourism carrying capacity: A demand-side analysis. Tour. Manag. 2017, 59, 564–578. [Google Scholar] [CrossRef]
- Croft, T. Nighttime Images of the Earth from Space, 1st ed.; Scientific American: New York, NY, USA, 1978; pp. 86–101. [Google Scholar]
- Chen, J.; Zhuo, L.; Shi, P.J.; Toshiaki, I. The study on urbanization process in China based on DMSP/OLS data: Development of a light index for urbanization level estimation. J. Remote Sens. 2003, 7, 168–175. [Google Scholar]
- Zheng, Q.; Seto, K.C.; Zhou, Y.; You, S.; Weng, Q. Nighttime light remote sensing for urban applications: Progress, challenges, and prospects. ISPRS J. Photogramm. Remote Sens. 2023, 202, 125–141. [Google Scholar] [CrossRef]
- Doll, C.N.H.; Muller, J.P.; Morley, J.G. Mapping regional economic activity from night-time light satellite imagery. Ecol. Econ. 2006, 57, 75–92. [Google Scholar] [CrossRef]
- Department of Tourism, Cordillera Administrative Region. Available online: https://dotcar.tourism.gov.ph/tourism-attractions/baguio-city/ (accessed on 4 October 2023).
- 14,000 Tourists Flock to Baguio City for Panagbenga Festival 2023. Available online: https://www.philstar.com/lifestyle/travel-and-tourism/2023/02/25/2247620/14000-tourists-flock-baguio-city-panagbenga-festival-2023 (accessed on 4 October 2023).
- Studying Baguio’s Carrying Capacity for Future Planning. Available online: https://www.sunstar.com.ph/baguio/feature/studying-baguios-carrying-capacity-for-future-planning (accessed on 19 October 2023).
- Chepenlianskaia, O.; Khan, A. Regional: Establishing a Platform for Climate-Resilient and Low-Carbon Urban Development. Available online: https://www.adb.org/sites/default/files/project-documents/52304/52304-001-tacr-en_2.pdf (accessed on 19 October 2023).
- Highlights on Household Population, Number of Household, and Average Household Size of Baguio City (2020 Census of Population and Housing). Available online: https://rssocar.psa.gov.ph/Benguet/releases/Highlights (accessed on 4 October 2023).
- Climate of the Philippines. Available online: https://www.pagasa.dost.gov.ph/information/climate-philippines (accessed on 9 October 2023).
- Atmo Certification. Available online: https://atmotube.com/atmotube-support/certification (accessed on 19 October 2023).
- Madley-Dowd, P.; Hughes, R.; Tilling, K.; Heron, J. The proportion of missing data should not be used to guide decisions on multiple imputation. J. Clin. Epidemiol. 2019, 110, 63–73. [Google Scholar] [CrossRef]
- National Solid Waste Management Status Report. Available online: https://emb.gov.ph/wp-content/uploads/2019/08/National-Solid-Waste-Management-Status-Report-2008-2018.pdf (accessed on 19 October 2023).
- Trends in Solid Waste Management. Available online: https://www.worldbank.org/en/topic/urbandevelopment/brief/solid-waste-management (accessed on 26 October 2023).
- Roman, M.O.; Wang, Z.; Sun, Q.; Kalb, V.; Miller, S.D.; Molthan, A.; Schultz, L.; Bell, J.; Stokes, E.C.; Pandey, B.; et al. NASA’s Black Marble nighttime lights product suite. Remote Sens. Environ. 2018, 210, 113–143. [Google Scholar] [CrossRef]
- Taherdoost, H. Decision Making Using the Analytic Hierarchy Process (AHP); A Step by Step Approach. Int. J. Econ. Manag. Syst. 2017, 2, 2017. Available online: https://ssrn.com/abstract=3224206 (accessed on 26 October 2023).
- The Analytic Hierarchy Process (AHP). Available online: https://www.mindtools.com/a7y139c/the-analytic-hierarchy-process-ahp (accessed on 5 October 2023).
- Illustrative Example of Analytic Hierarchy Process. Available online: https://people.revoledu.com/kardi/tutorial/AHP/AHP-Example.htm (accessed on 5 October 2023).
- Consistency Index and Consistency Ratio. Available online: https://people.revoledu.com/kardi/tutorial/AHP/Consistency.htm (accessed on 16 October 2023).
- World Health Organization Team. WHO Global Air Quality Guidelines: Particulate Matter (PM2.5 and PM10), Ozone, Nitrogen Dioxide, Sulfur Dioxide and Carbon Monoxide; World Health Organization: Geneva, Switzerland, 2021; pp. 74–111. [Google Scholar]
- Ambient (Outdoor) Air Pollution. Available online: https://www.who.int/news-room/fact-sheets/detail/ambient-(outdoor)-air-quality-and-health (accessed on 12 October 2023).
- Sulfur Dioxide. Available online: https://www.dhs.wisconsin.gov/chemical/sulfurdioxide.htm (accessed on 12 October 2023).
- Urban Development. Available online: https://www.worldbank.org/en/topic/urbandevelopment/overview (accessed on 15 November 2023).
- Camp 7. Available online: https://new.baguio.gov.ph/barangay/camp-7/about (accessed on 19 October 2023).
- Alternate, Faster Road to Baguio Now Open to All Vehicles. Available online: https://www.pna.gov.ph/articles/1057273 (accessed on 19 October 2023).
- Ferguson, T.; Curtis, R.; Fraysse, F.; Olds, T.; Dumuid, D.; Brown, W.; Esterman, A.; Maher, C. How do 24-h movement behaviours change during and after vacation? A cohort study. Int. J. Behav. Nutr. Phys. Act. 2023, 2, 24. [Google Scholar] [CrossRef]
Disclaimer/Publisher’s Note: The statements, opinions and data contained in all publications are solely those of the individual author(s) and contributor(s) and not of MDPI and/or the editor(s). MDPI and/or the editor(s) disclaim responsibility for any injury to people or property resulting from any ideas, methods, instructions or products referred to in the content. |
© 2023 by the authors. Licensee MDPI, Basel, Switzerland. This article is an open access article distributed under the terms and conditions of the Creative Commons Attribution (CC BY) license (https://creativecommons.org/licenses/by/4.0/).