Article

Cotton Cultivation in Greece under Sustainable Utilization of Inputs

1
Hellenic Agricultural Organization DIMITRA, Plant Breeding and Genetic Resources Institute, 57001 Thessaloniki, Greece
2
CIRAD, UPR AIDA, Cotonou 05BP1604, Benin
3
AIDA, Univ Montpellier, CIRAD, 34398 Montpellier, France
4
IRC, Cotonou 05BP1604, Benin
5
SODEFITEX, Tambacounda BP 211, Senegal
6
CIRAD, UPR AÏDA, 34398 Montpellier, France
*
Author to whom correspondence should be addressed.
Sustainability 2024, 16(1), 347; https://doi.org/10.3390/su16010347
Submission received: 17 November 2023 / Revised: 22 December 2023 / Accepted: 28 December 2023 / Published: 29 December 2023
(This article belongs to the Section Sustainable Agriculture)

Abstract

:
Cotton, a high-value crop of primary financial importance for Greece, is directly affected by a wide range of environmental parameters, and water scarcity threatens the sustainability of irrigated cotton production in many regions around the world. Reducing inputs with an appropriate cultivar may not decrease cotton production and fiber quality while improving sustainability. To investigate cotton varietal responses to water stress and lack of nutrients, in the climate of north Greece, a three-year experiment was conducted in Thessaloniki, Greece. Four cotton cultivars (three of Greek origin and one from Africa) were cultivated under four irrigation (normal and reduced by 75%, 50%, and 25%) and two fertilization levels (normal and 50%). The effect of these treatments on productivity and quality were estimated, with the final objective being the reduction of inputs and more sustainable cotton production. Cotton producers are dealing with a cost price squeeze and the present study demonstrates that reducing the fertilization inputs even by half and the reduction of irrigation by 25% has no significant effect neither on yield nor on the main technological characteristics. This highlights the fact that a more sustainable use of inputs, contrary to common management, will have almost the same yield and even increase the farmer’s income.

1. Introduction

Cotton (Gossypium hirsutum L.) is an industrial crop cultivated in a wide range of climates and environments around the world, mainly for fiber production [1]. These environments have a large impact on the growth, development, and quality of the crop [2,3].
Water is often the most limiting factor in cotton production as it is essential for promoting all growth functions from emergence to harvest [4], and changing environmental conditions call for efficient irrigation-water management in cotton-production systems [5]. Cotton is very sensitive to water deficit during the various stages of its growth and development, with daily water use being greatest during the stages of flowering and first boll opening [6]. Furthermore, the growth period from crop establishment to flowering is sensitive to excess water and may induce excessive vegetative growth [7]. Water deficit stress has negative impact on yield because it reduces the plants’ ability to establish and retain blooms and fruiting structures [2]. Water stress will also result in plants that are stunted in growth with reduced leaf area and limited transpiration rate, commonly resulting in the shedding of leaves and fruiting structures [8]. Irrigation management is an optimum strategy to address water shortage [9,10], resulting in considerable water savings with little impact on the quantity and quality of the harvested yield, and several studies showed that 20 or 25% reduction from full irrigation level did not significantly affect cotton yield [11,12].
On the other hand, nitrogen is a critical element for cotton growth and development [13] and nitrogen fertilization has significant impacts on cotton growth, boll development, lint yield, and fiber quality [14]. Nitrogen fertilizer has been shown to significantly impact cotton growth, affect the physiological characteristics of cotton, and eventually determine the final yield and quality. The number of bolls, individual boll weight, yield, and fiber quality are also consistently affected by nitrogen, and it is required more consistently and in larger amounts than other elements [15].
It is important to determine the response of different genotypes to deficit irrigation and fertilization [16] in an effort to promote cultivation cultivars adapted to water-limited and/or low fertilization needs in the growing environment of Greece, because it has been predicted that in Greece, by the mid-twenty-first century, droughts will become more frequent, the minimum average temperature will increase, and the average precipitation will decrease [17]. Although agricultural systems depend on fertilizer and inputs to obtain and/or maintain high productivity, the excessive application of these inputs increases agriculture’s environmental impact without increasing yields or farmer profits [18], and for this reason, an important element of sustainable agriculture is not only the appropriate use of fertilizers but also the reduction of environmental impact from agricultural fertilization practices.
Cotton cultivation is the main source of income for more than 100,000 Greek households and the production of cotton-based textiles is included amongst the most important industrial sectors in terms of employment [19]. Greece is the main cotton grower in Europe, with 85% of European cotton area and accounting for more than 8% of total Greek agricultural output [20]. According to [21], the world average blue water used to produce a kilogram of fiber was 1931 L and the world average cost of fertilizers was 218 USD ha−1 in 2021. In the same year in Greece, 2563 L of blue water was needed to produce a kilogram of lint and the cost of fertilizers was 241 USD ha−1. As a result, irrigation water is becoming increasingly scarce and expensive, and it is of great importance for Greece to reduce the above costs with proper crop management in the fields without affecting fiber quality. Furthermore, all countries around the Mediterranean region are currently dealing with the challenge of new approaches to water resource management [22,23], and focused research on local field studies [24] for cotton productivity with reduced irrigation and fertilization inputs is undoubtedly a need.
Therefore, the aim of this study is to evaluate the contribution of cultivars to seed cotton yield and the fiber quality of cotton under more efficient fertilizer utilization and irrigation, which ensure better economic returns for farmers along with reduced environmental impact.

2. Materials and Methods

2.1. Genetic Material and Experimental Design

The cultivars evaluated were the Greek cotton cultivars Zeta 2, Assos, and Select, and an African cultivar (Stam 129A from Togo) which has a continuous flowering period and mid/early maturity. The cultivar Zeta 2 is an Acala type created by the Institute of Plant Breeding and Genetic Resources (IPBGR) of the Hellenic Agricultural Organization—DIMITRA. Select is an early cultivar with high potential of productivity and Assos is a mid/early cultivar with drought tolerance. All Greek cultivars are commercial, registered in the Greek National Catalogue and cultivated by many farmers.
The four different cotton cultivars were grown in the experimental fields of IPBGR in Thermi, Greece (40°32′08.75″ and longitude 23°00′21.47″), under four irrigation levels and two fertilization levels in 2018, 2019, and 2020. The two fertilization levels (normal and low) were the main plots, and the irrigation levels comprised the subplots. The cultivars, the sub-sub-plots, were established in randomized blocks with three replicates. The previous crop was wheat, and the soil was silty loam (Table 1).
Plots consisting of six rows 10 m long with 0.80 m spacing between rows were planted on 24 April 2018, 9 May 2019, and 7 May 2020. The average plants were 12.5 plants m−2. The herbicide pendimethalin was applied to the soil surface at the time of planting (5 dm3 ha−1 with 33% active ingredients), and 30 days later the herbicide Fluazifop-P-butyl 12.5 (1.5 dm3 ha−1 with 12.5% active ingredient) was applied in combination with the adhesive Ethoxylated Isodecyl Alcohol (0.15 dm3 ha−1 with 15% active ingredient). Pest pressure was monitored, and no pesticide was applied during the whole study.

2.2. Cultivation Practices

The total monthly rainfall data were recorded near the experimental area (over approximately 1000 m).
The global Growing Degree Days (GDDs) for the crop were calculated as the sum of the GDDs of each day (GDDd):
GDDd = (Tmax,d + Tmin,d)/2 − Tbase
where Tmax,d and Tmin,d are the daily maximum and minimum temperature of the day, respectively.
The base temperature (Tbase) was 10 °C [25].
The fertilizers monoammonium phosphate (12-52-0), ammonium sulphate (21-0-0), and potassium sulphate (0-0-30) were applied prior to soil preparation, as a broadcast fertilizer application and incorporated into topsoil with a disk harrow machine, to the quantities described in Table 1. At the squaring stage (floral bud initiation) of plants, granular ammonium nitrate fertilizer with total nitrogen 33.5% was applied. In the low fertilization plots of the field, half dose of the recommended fertilizers was applied in the same way as for normal dose (Table 2).
Sprinkle irrigation (120 m3 ha−1), for crop vegetation, was applied to all plots and then five drip irrigations during the flowering stage. As previously proposed for cotton [26], a total of 4000 m3 ha−1 for the subplot of 100% irrigation was applied and, for the other subplots, the irrigation schedules were programmed to be 75%, 50%, and 25%, respectively.

2.3. Cotton Harvesting and Evaluation of Technological Characteristics

Seed cotton yield was estimated by hand harvesting 5 m from the central rows away from the border of the plots. Harvesting was performed on 3 October 2018 (163 days after planting (DAP)), on 30 September 2019 (145 DAP), and on 27 September 2020 (144 DAP). The seed cotton was ginned to experimental roller gin (Platt Ginning Equipment, Ltd., Surrey, UK) and lint percentage (%) calculated as the ratio of lint weight to the total seed plus lint weight [27].
After ginning, fiber quality traits were evaluated using the High-Volume Instrument (HVI) 1000 (Uster Technologies, Knoxville, TN, USA) according to international standards [28]. Quality traits were micronaire, the indirect measurement of fiber fineness and maturity, the strength reported in grams of force per tex (g tex−1), and the percentage of elongation (%). Referring to length parameters, the upper half mean length (UHML) in mm and uniformity (UI) percentage were measured. The color parameters of reflectance (Rd) and yellowness (+b) were also recorded, because they are critical for textile processing and the value of the end product [29].

2.4. Statistical Analysis

For each variable, a linear mix model was used to represent the experimental design and the structure of the error. All interactions between cultivar, irrigation level, fertilization level, and the year were considered as fixed effects, while block in year and irrigation in block in year were considered as random effects (whole-plot error). The denominator degrees of freedom were estimated according to the method of Kenward and Roger. For each dependent variable, the residuals were graphically checked to ensure the validity of the model.
For all variables, post hoc tests were performed on the highest levels of interaction and on all main effects. Then, graphical representation of the estimates was plotted on raw data points with a confidence interval of 95% and post hoc grouping with Bonferroni correction for multicomparison.
All the statistical analysis and the graphical representations were performed using R version 4.2.2 [30]. The main packages used for mixed-model analysis and post hoc tests were library lmerTest [31], emmeans [32], and multcomp [33]. Main packages used for data manipulation were data.table [34] and dplyr [35]. Finally, ggplot2 was used for graphical representation [36].
The dataset is available in a publicly accessible repository [37].

3. Results

3.1. Growth Conditions

Cotton is a crop grown in tropical and subtropical regions and thus its yield and fiber characteristics respond to variations in daily mean temperature and temperature range. Extreme temperatures are associated with low and variable cotton yields [38].
The climate in the experimental area is characterized as the typical Mediterranean with warm dry summer and cool humid winter. In 2018, the GDDs of the cotton growing period were greater (2270.5) than those in 2019 (2128.5) and 2020 (1956.2). The rainfall from May to September in 2018 was also higher (189.9 mm) than that recorded during the same period in 2019 (97.5 mm) or 2020 (134.2 mm) (Figure 1). Also, according to Figure 2, May 2018 had the highest minimum temperature in comparison to the other growing years, while in September 2018 the lowest minimum temperature was observed.

3.2. Evaluation of Effects

Cultivars affected seed cotton yield and all the technological parameters (Table 3). The levels of fertilization used did not affect taken measurements and seed cotton yield. Length parameters were affected by irrigation level but not from year. Irrigation affected all parameters except the micronaire and elongation.

3.3. Seed Cotton Yield

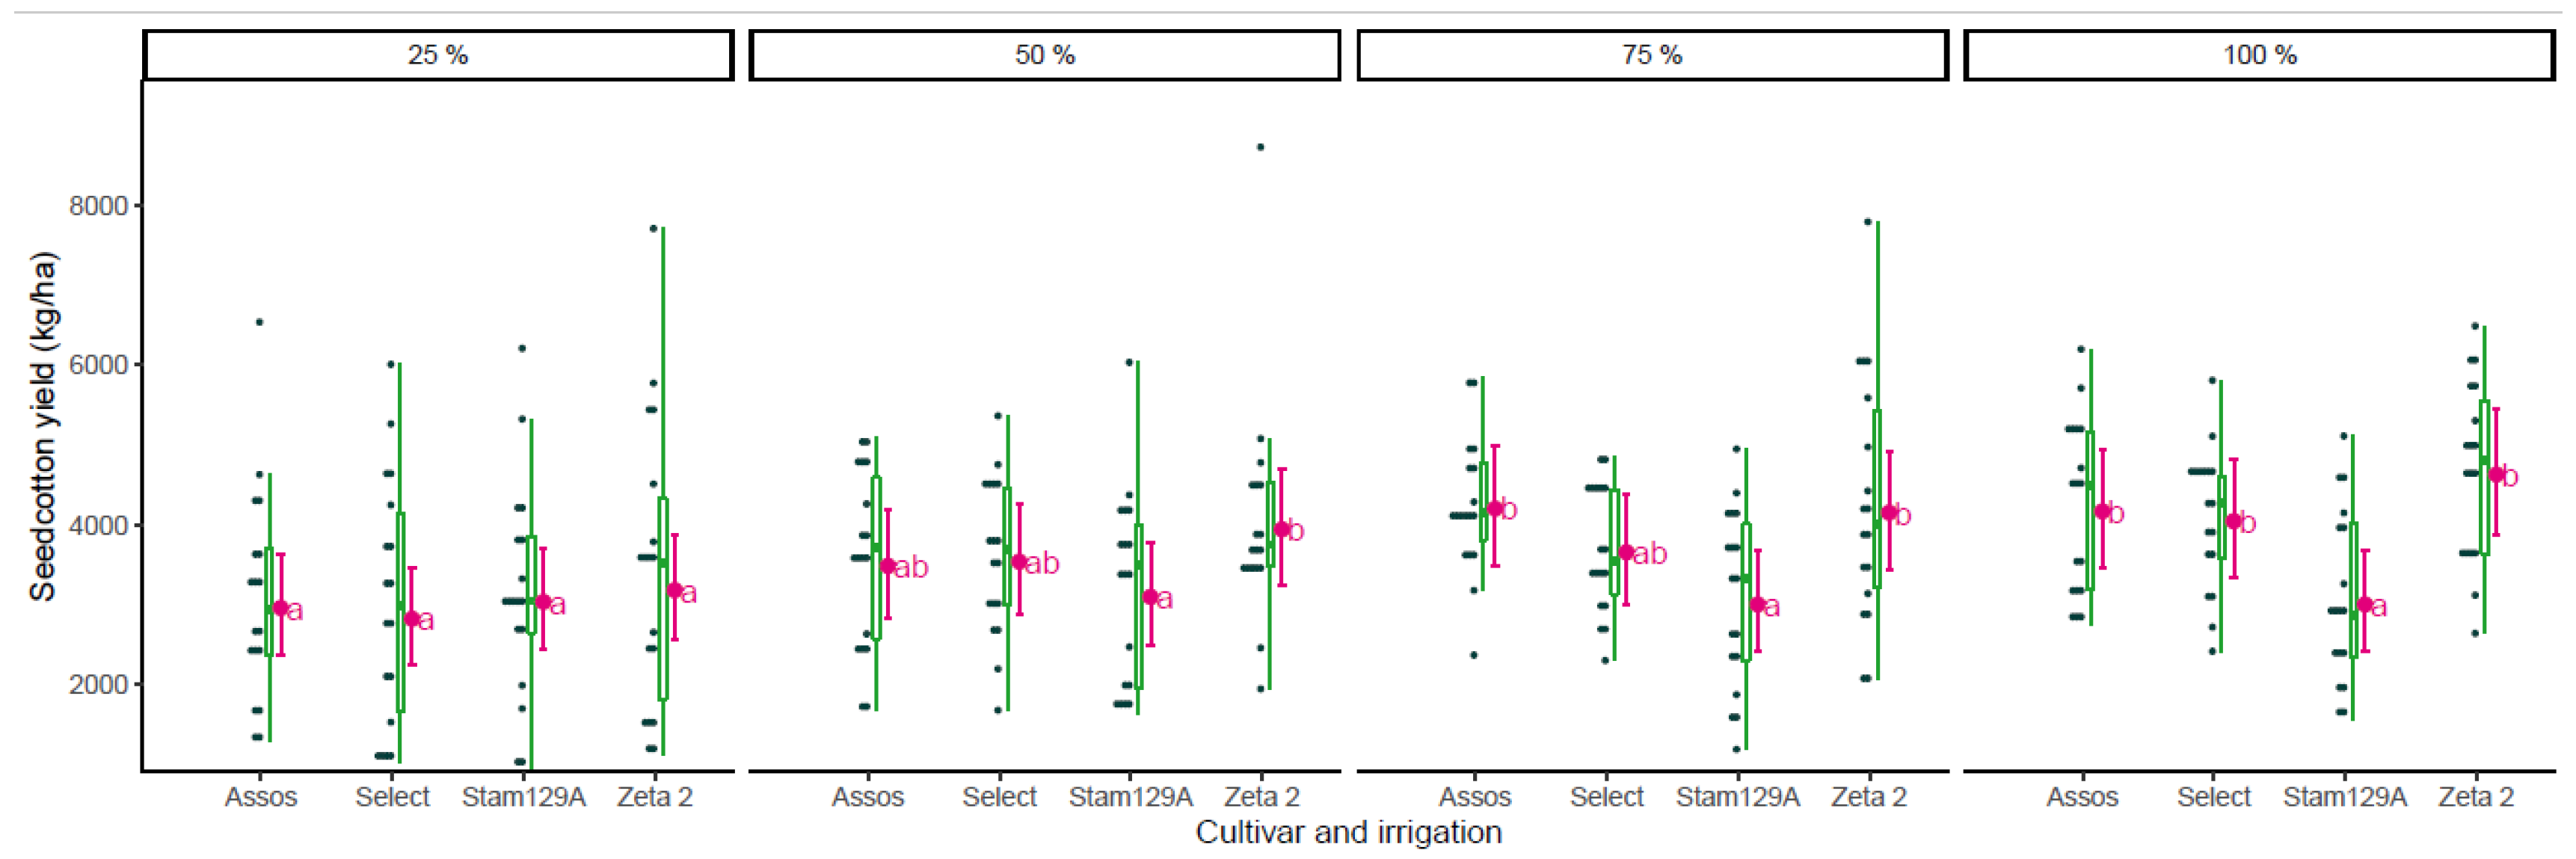
At 25% irrigation, the seed cotton yield varied from 2824 kg ha−1 for the cultivar Select to 3183 kg ha−1 for the cultivar Zeta 2 (Figure 3). Zeta 2 was the variety with the most fluctuation in the yields at low irrigation input and this is probably due to its genetic background, as previously reported by [8]. At 50% irrigation, the cultivar Zeta 2 had the maximum yield (3944 kg ha−1) while the cultivar Stam 129A was the least productive (3099 kg ha−1). The increase of irrigation at 75% resulted in 4203 kg ha−1 production for the cultivar Assos, Zeta 2 reached 4154 kg ha−1, Select 3658 kg ha−1, and Stam 129A 3005 kg ha−1. The normal irrigation greatly increased the yield of Zeta 2 (4631 kg/ha) and Select (4047 kg/ha) while Assos (4170 kg ha−1) and Stam 129A (3005 kg ha−1) were less productive.
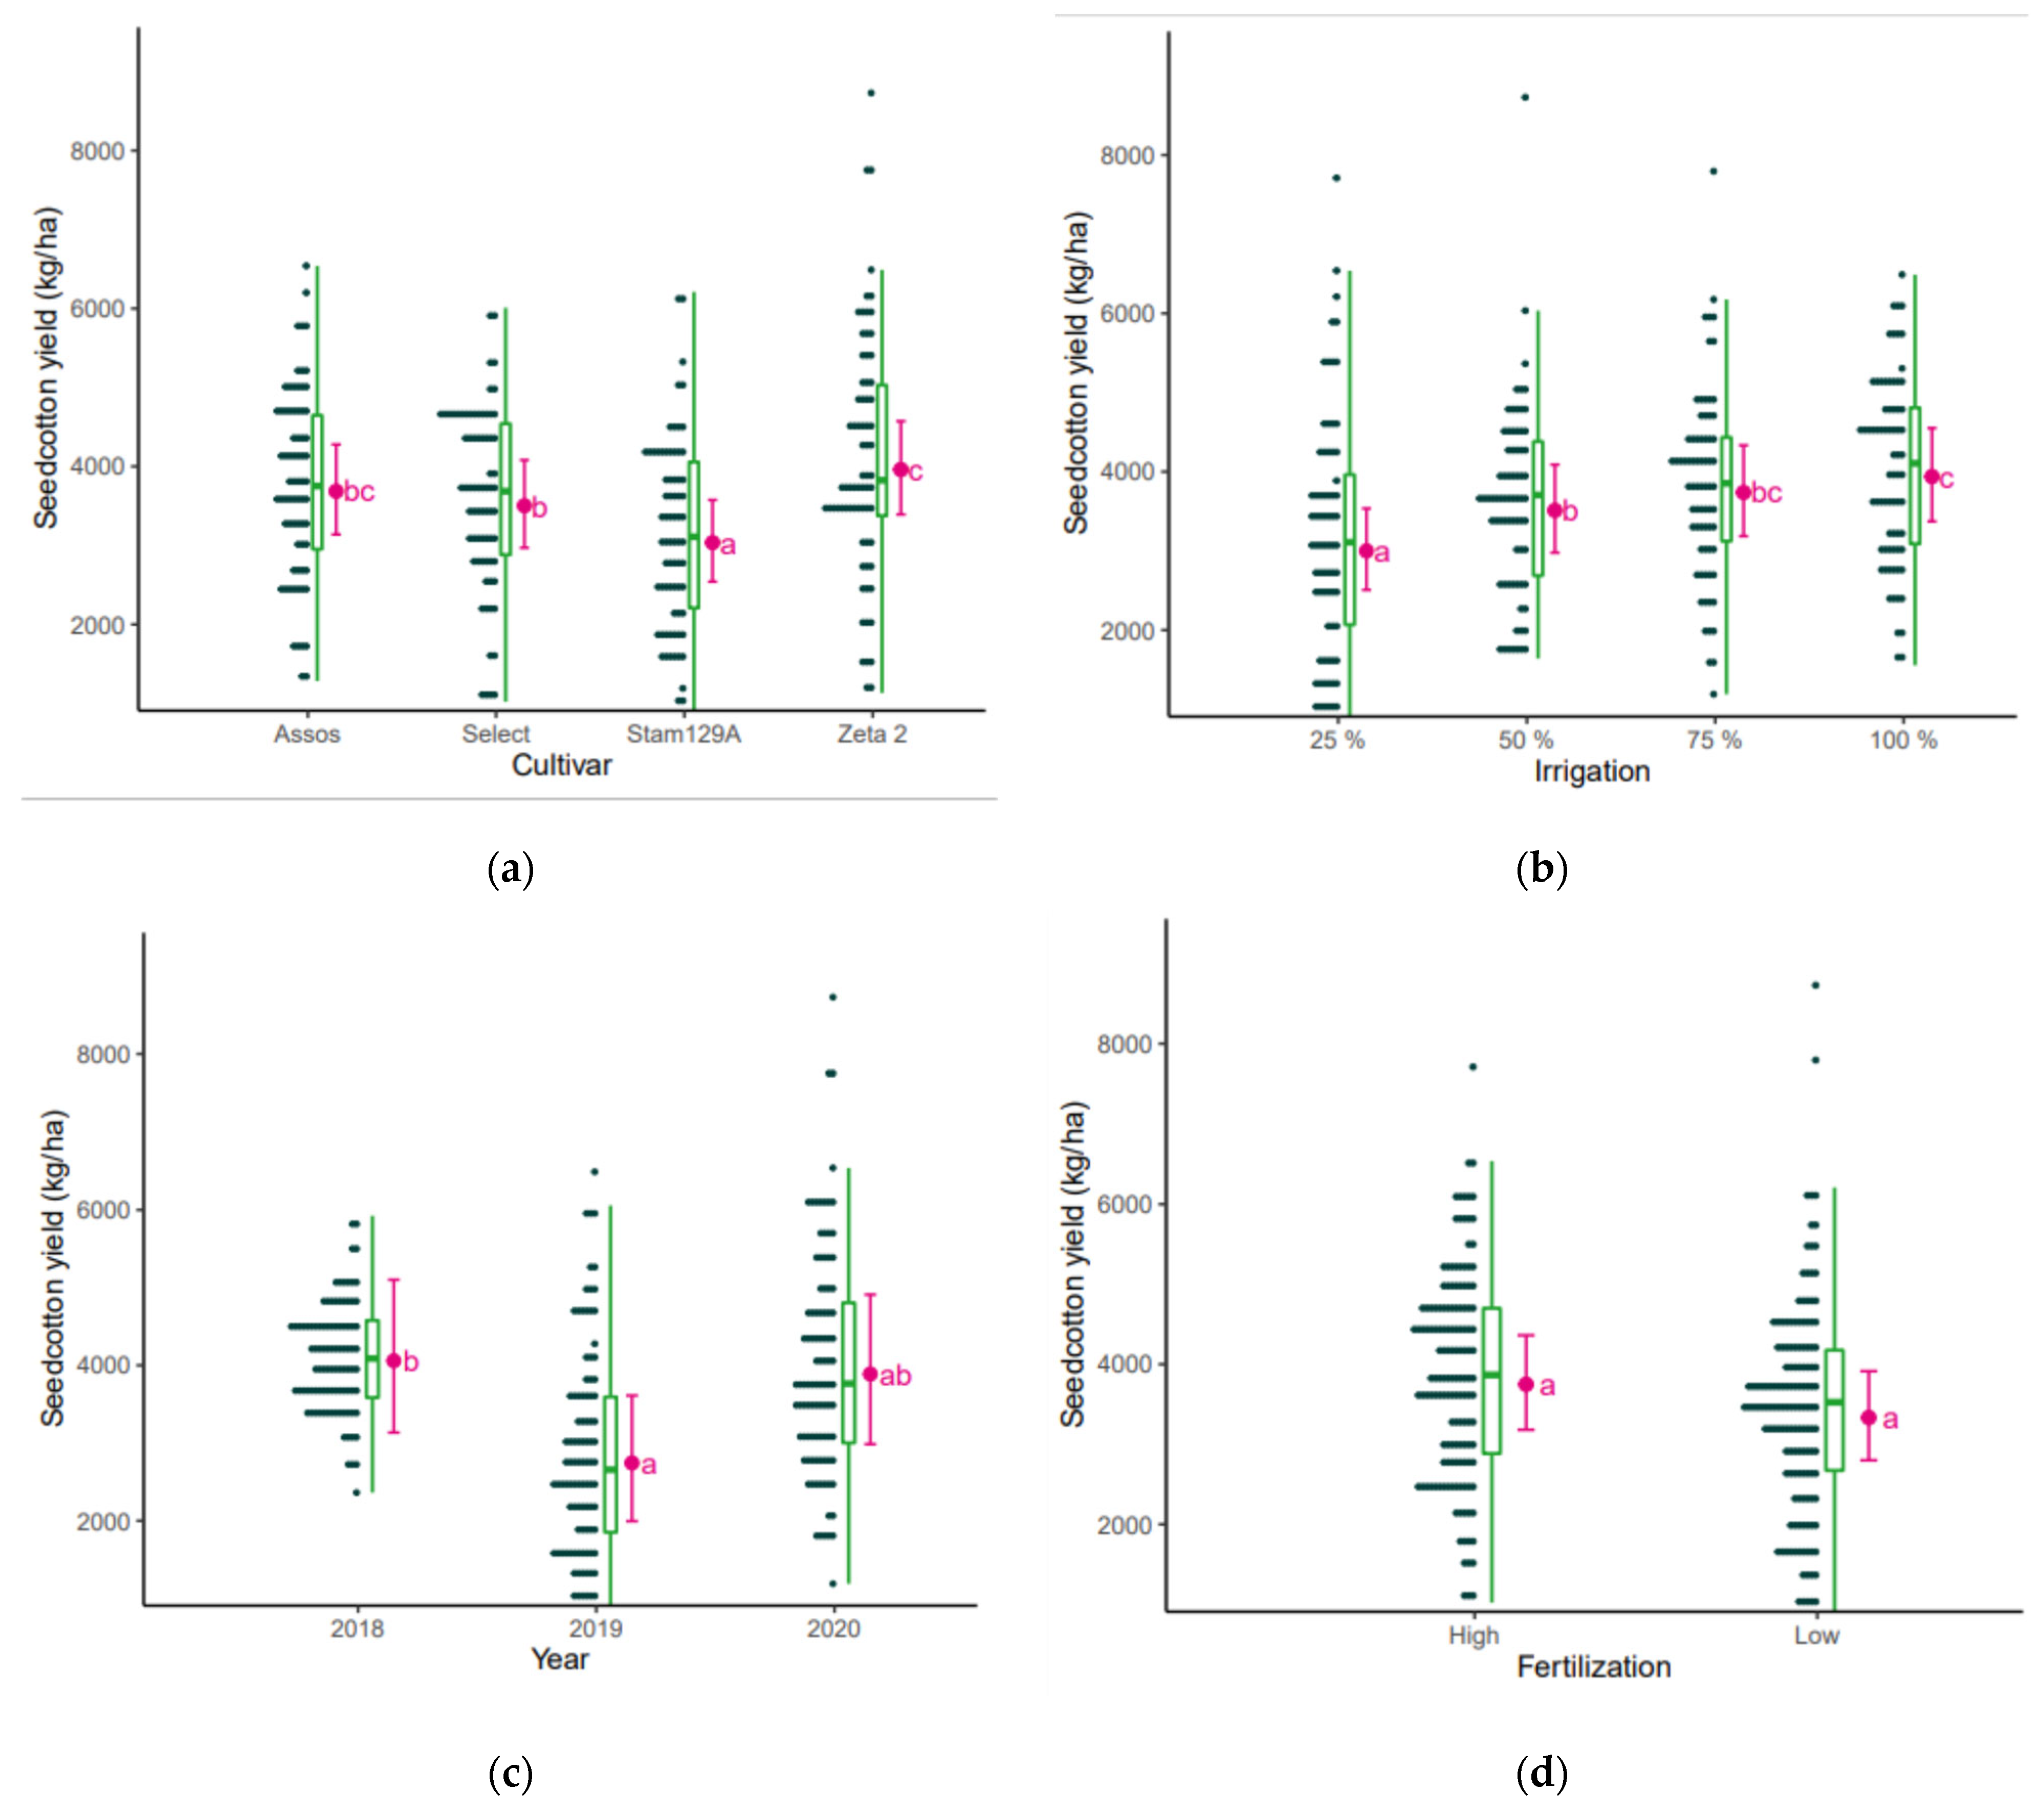
Fertilization had no effect (F = 1.41) on productivity (Table 3), while in 2019 the yield (2744 kg ha−1) was lower compared to that of 2018, which was 4059 kg ha−1, but not significantly different from the 2020 yield, which reached 3888 kg ha−1 (Figure 4). All cultivars had the lowest yield with 25% irrigation and the highest with 100% irrigation, but there was no statistical difference between 100% and 75% irrigation. Cultivar Zeta 2 had the highest seed cotton yield (3960 kg ha−1) that was not statistically different from Assos’s (3686 kg ha−1). The cultivar Stam 129A with 3036 kg ha−1 remained lower than other cultivars’ yield, even with increased water availability, and did not respond to increased levels of irrigation.

3.4. Fiber Content

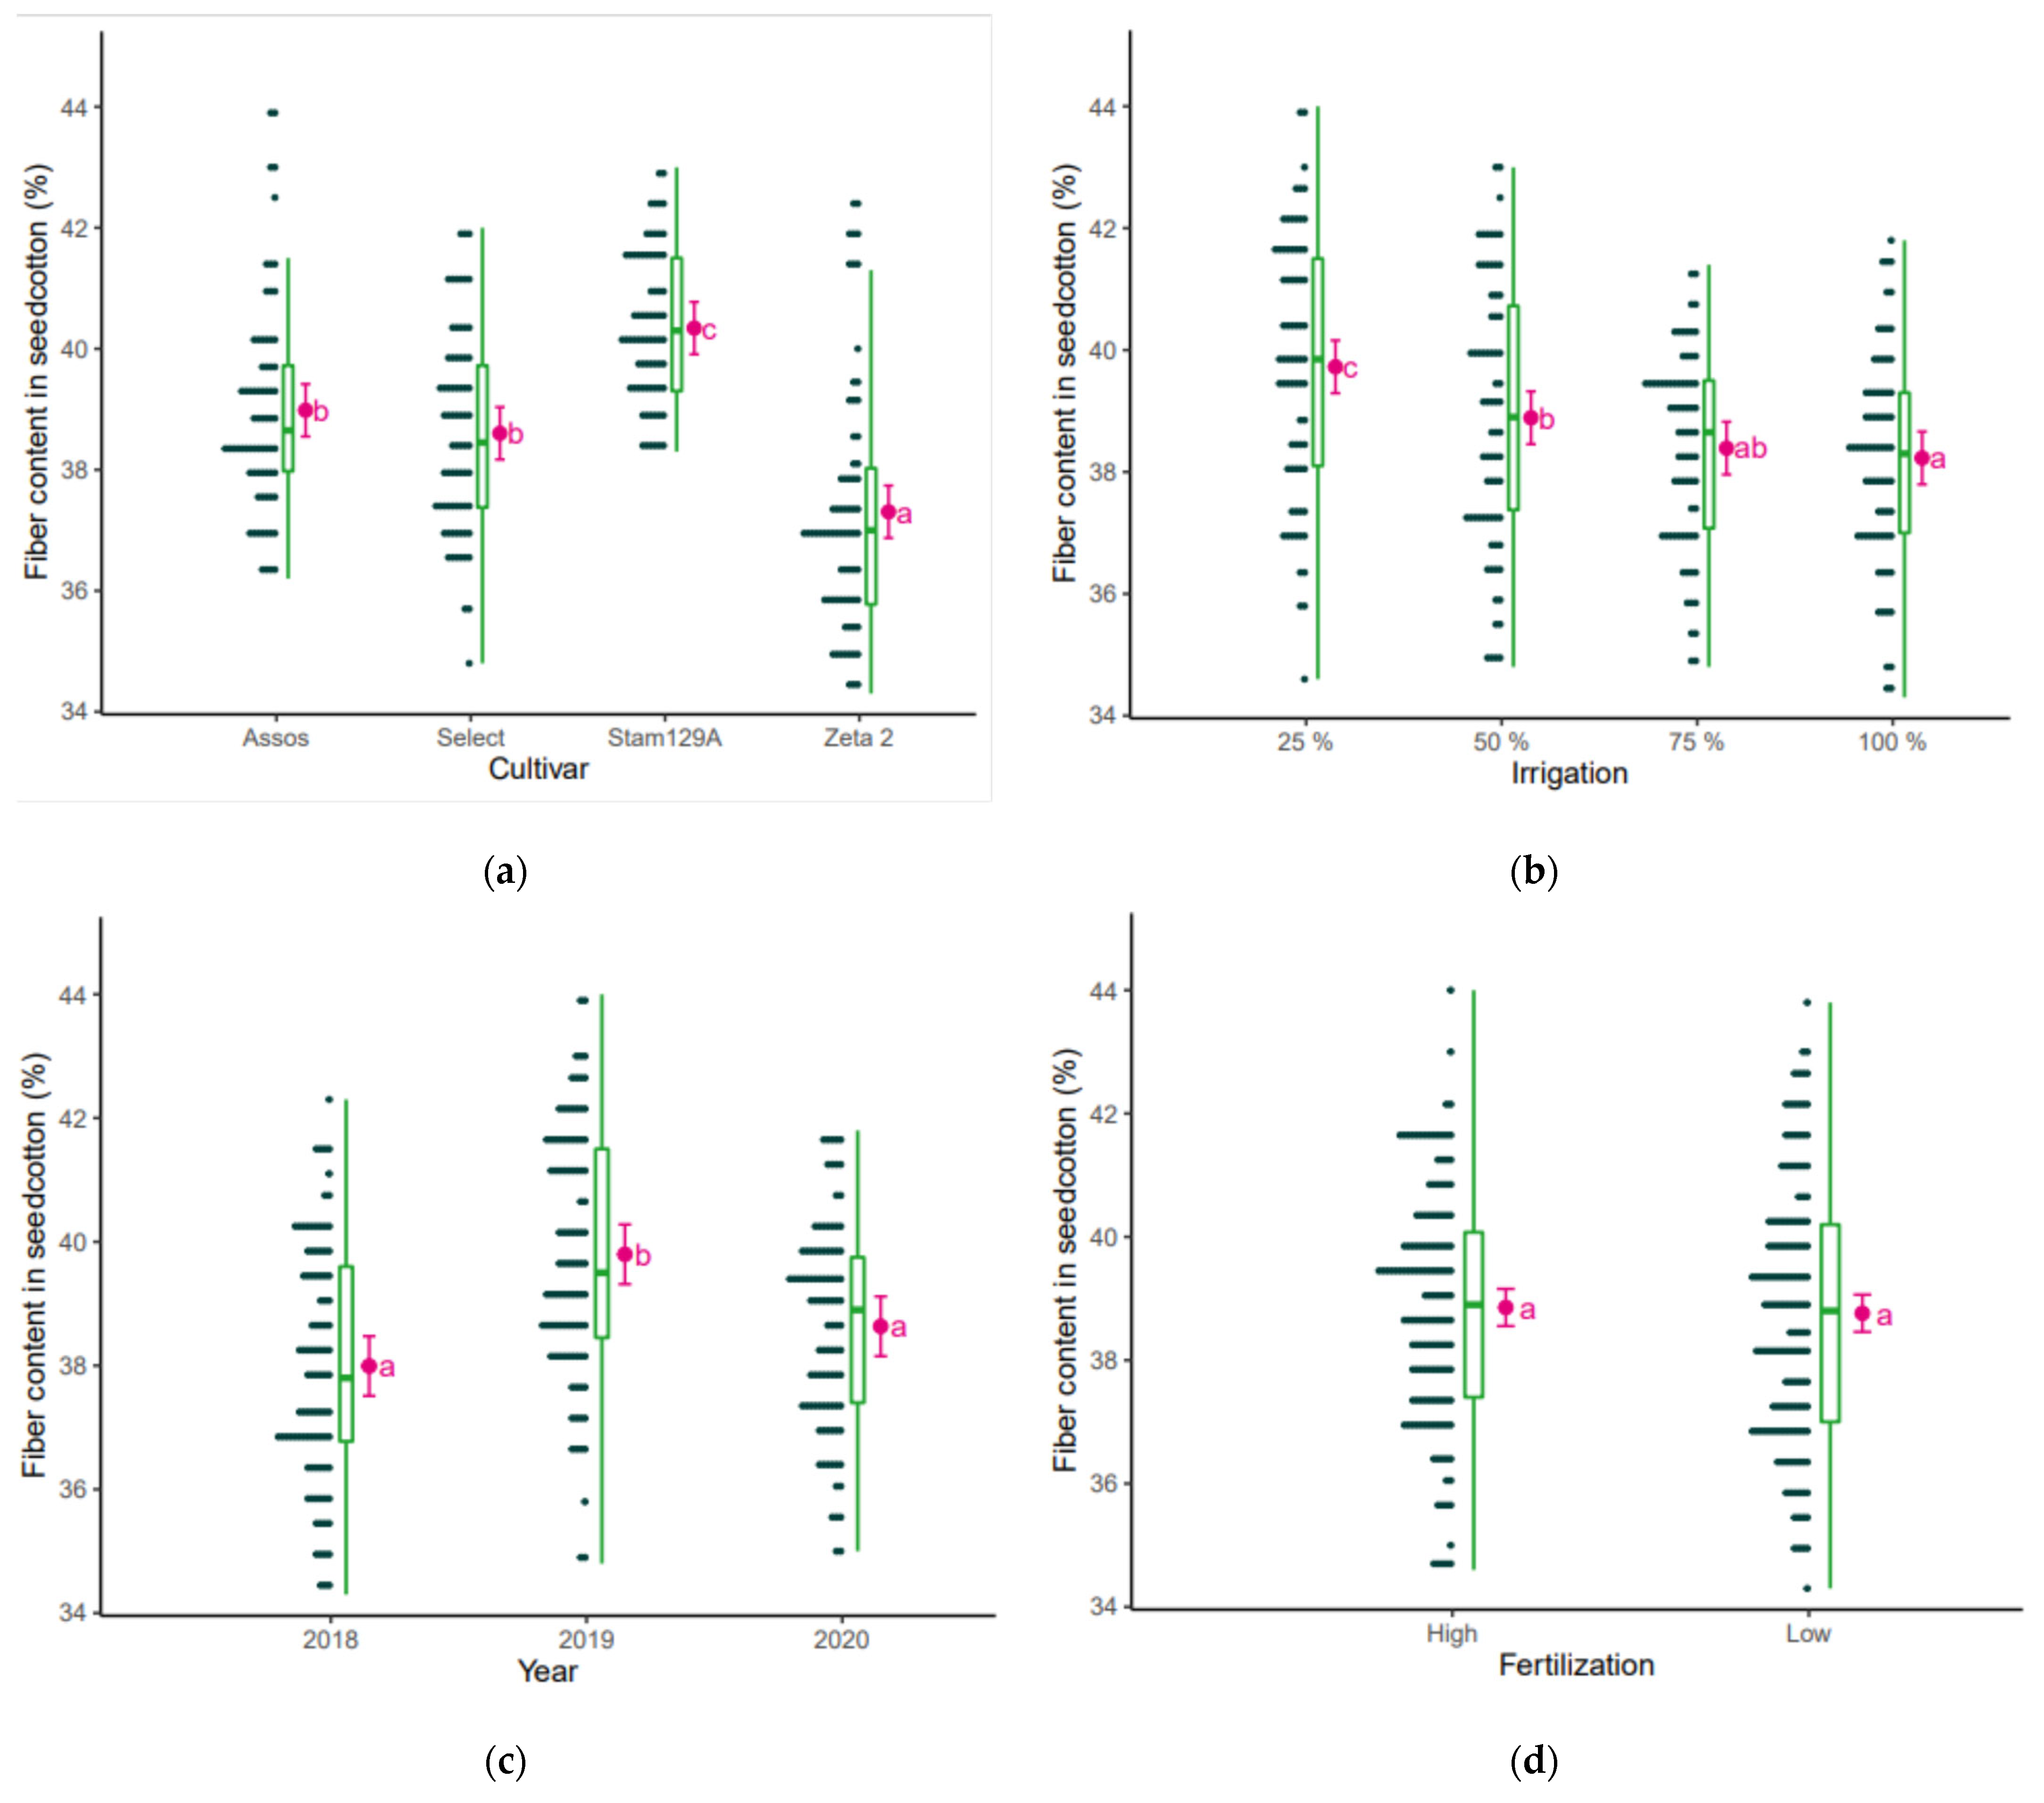
The fertilization level (F = 0.31) had no effect on fiber content, but the irrigation level did (Table 3). A reduction in irrigation resulted in an increase in fiber content (Figure 5). At 25% irrigation, the fiber content was 39.7% and it was reduced as irrigation increased up to 100% irrigation with 38.2%. Cultivar Stam 129A had the highest fiber content (40.3%), while Zeta 2 had the lowest (37.3%). Between years, 2019 had the highest fiber content (39.8%), while 2018 the lowest (38%).

3.5. Length Parameters

Cultivar Stam 129A had the highest length (29.4 mm), and although the Greek cultivars had no significant differences in length, cultivar Zeta 2 reached 28.8 mm compared to Assos (28.7 mm) and Select (28.5 mm) (Figure 6). Full and 75% irrigation produced longer fibers than 50% and 25% irrigation. More specifically, at 25% irrigation the length was 27.7 mm and at 100% irrigation it was 29.8 mm. There was no effect of fertilization and year on fiber length.
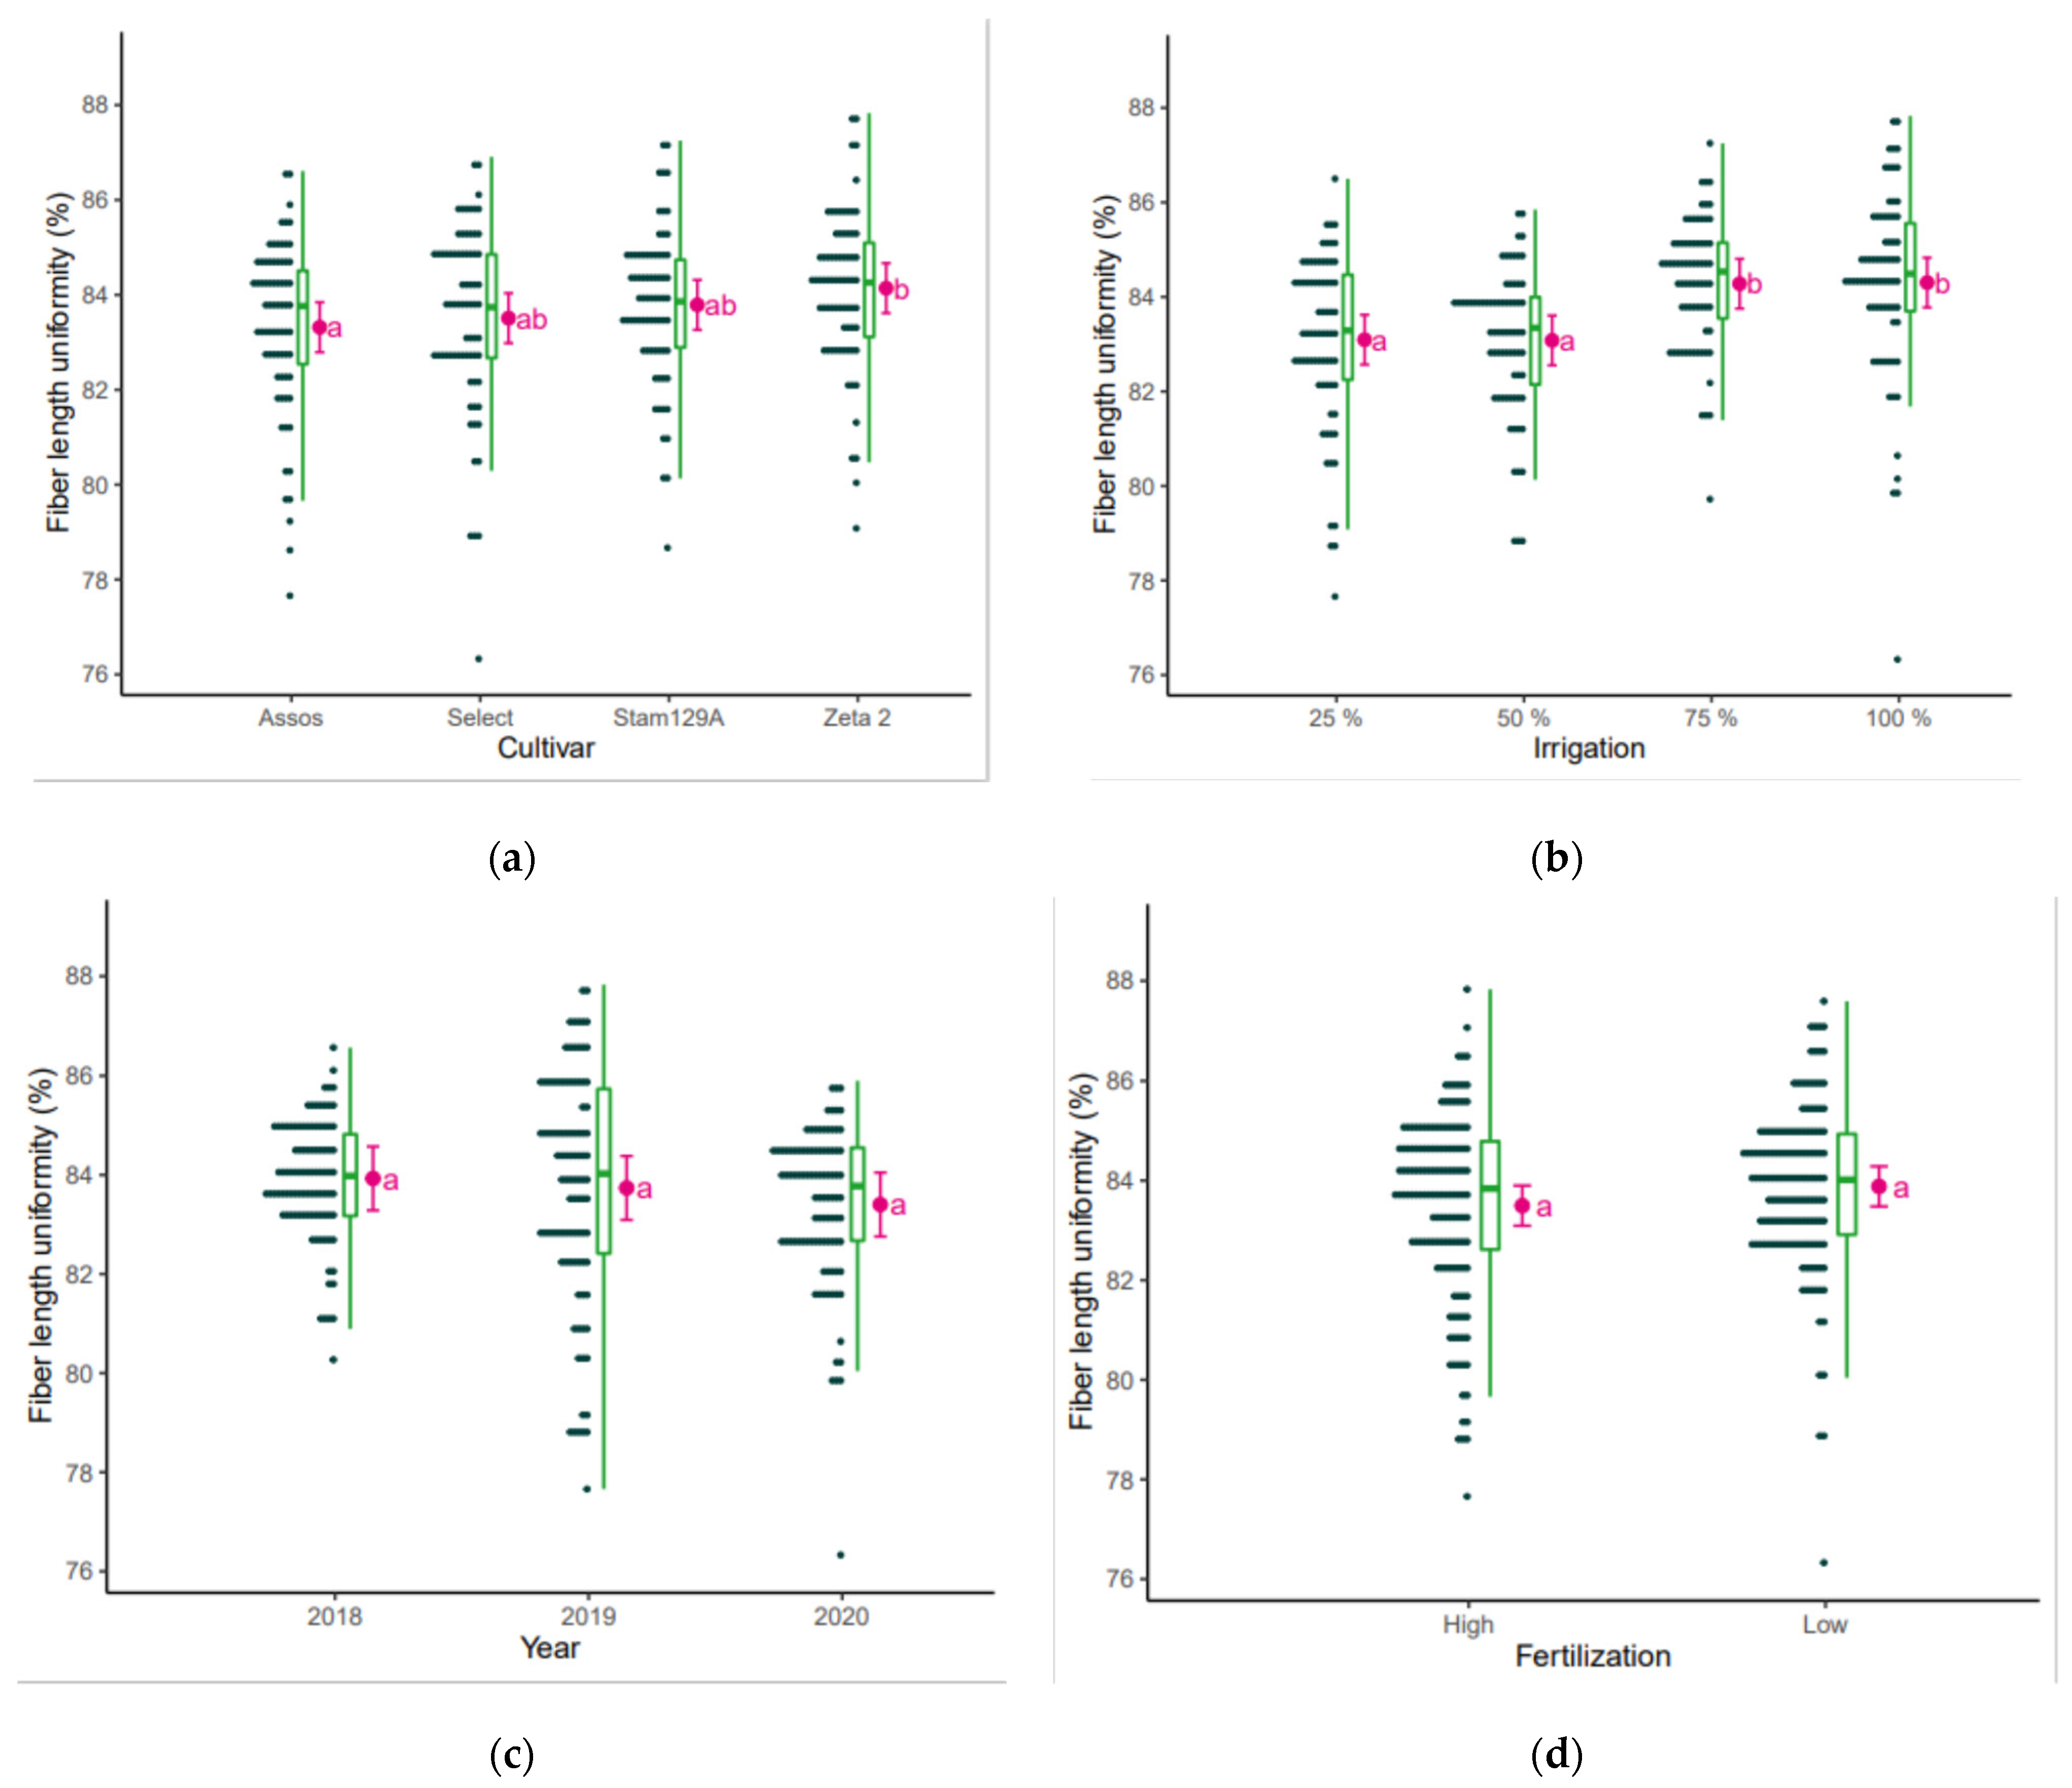
Uniformity, measured as the ratio of the average length of the entire sample to the average length of the sample’s upper 50th percent [39]. The cultivar Zeta 2 had the highest fiber length uniformity (84.1%) and the cultivar Assos had the lowest (83.1%, Figure 7). The irrigation levels of 25% and 50% gave the lowest uniformity of 83.0% and increasing irrigation both to 75% and 100% resulted in 84.3% uniformity. Among the years and fertilization levels, there were no statistical differences.

3.6. Micronaire

Fiber micronaire is used as an indicator of fiber maturity and surface area [40]. The year 2020 resulted in the highest micronaire (4.5) of all tested cultivars, while in the year 2018 the micronaire value was 3.7 and in the year 2019 it was 4.0, respectively (Figure 8). The cultivar Assos had the lowest micronaire (3.8), while the others gave micronaire values of around 4.1–4.2. Fertilization (F = 0.67) and irrigation (F = 2.5) had no effect on micronaire.

3.7. Elongation and Strength

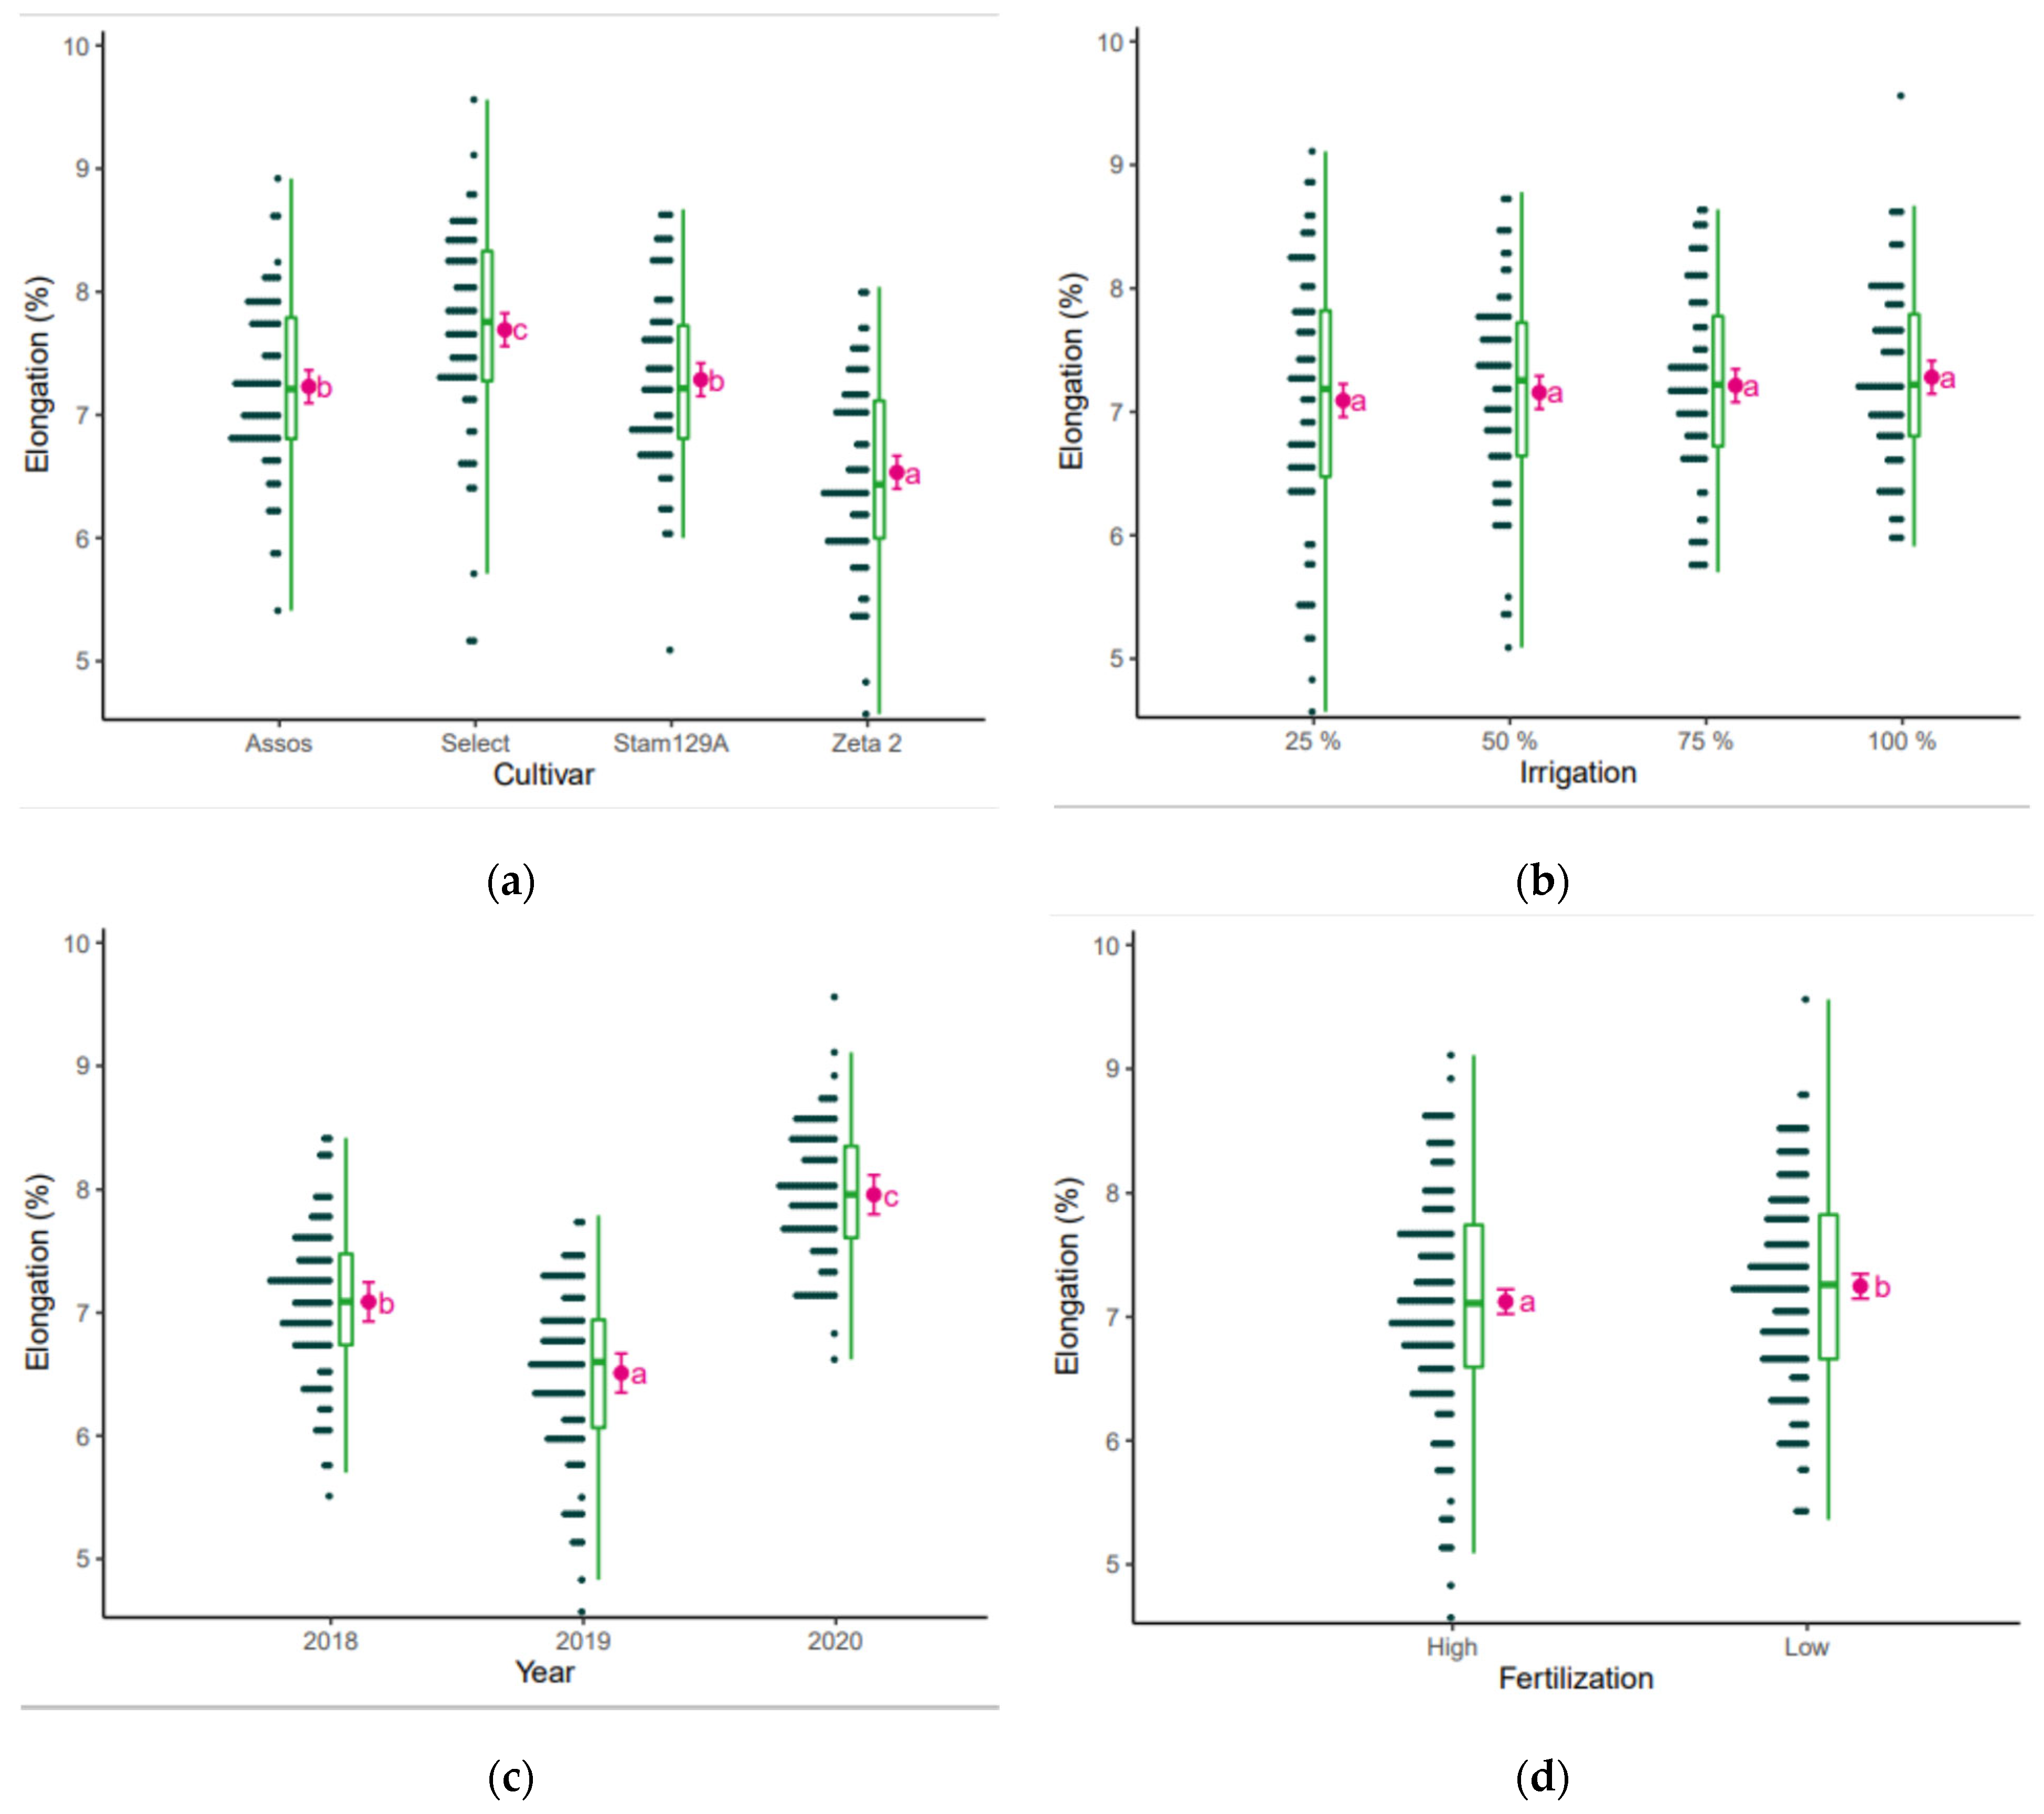
Elongation is the amount that a fiber will stretch before rupture, expressed as a percentage. Strength is the force needed to break a sample measured in grams per tex [41]. The cultivar Select had the highest elongation (7.7%) and Zeta 2 the lowest (6.5%, Figure 9), even though there was an interaction between cultivars and fertilization. Differences were observed between years and level of fertilization but not between levels of irrigation.
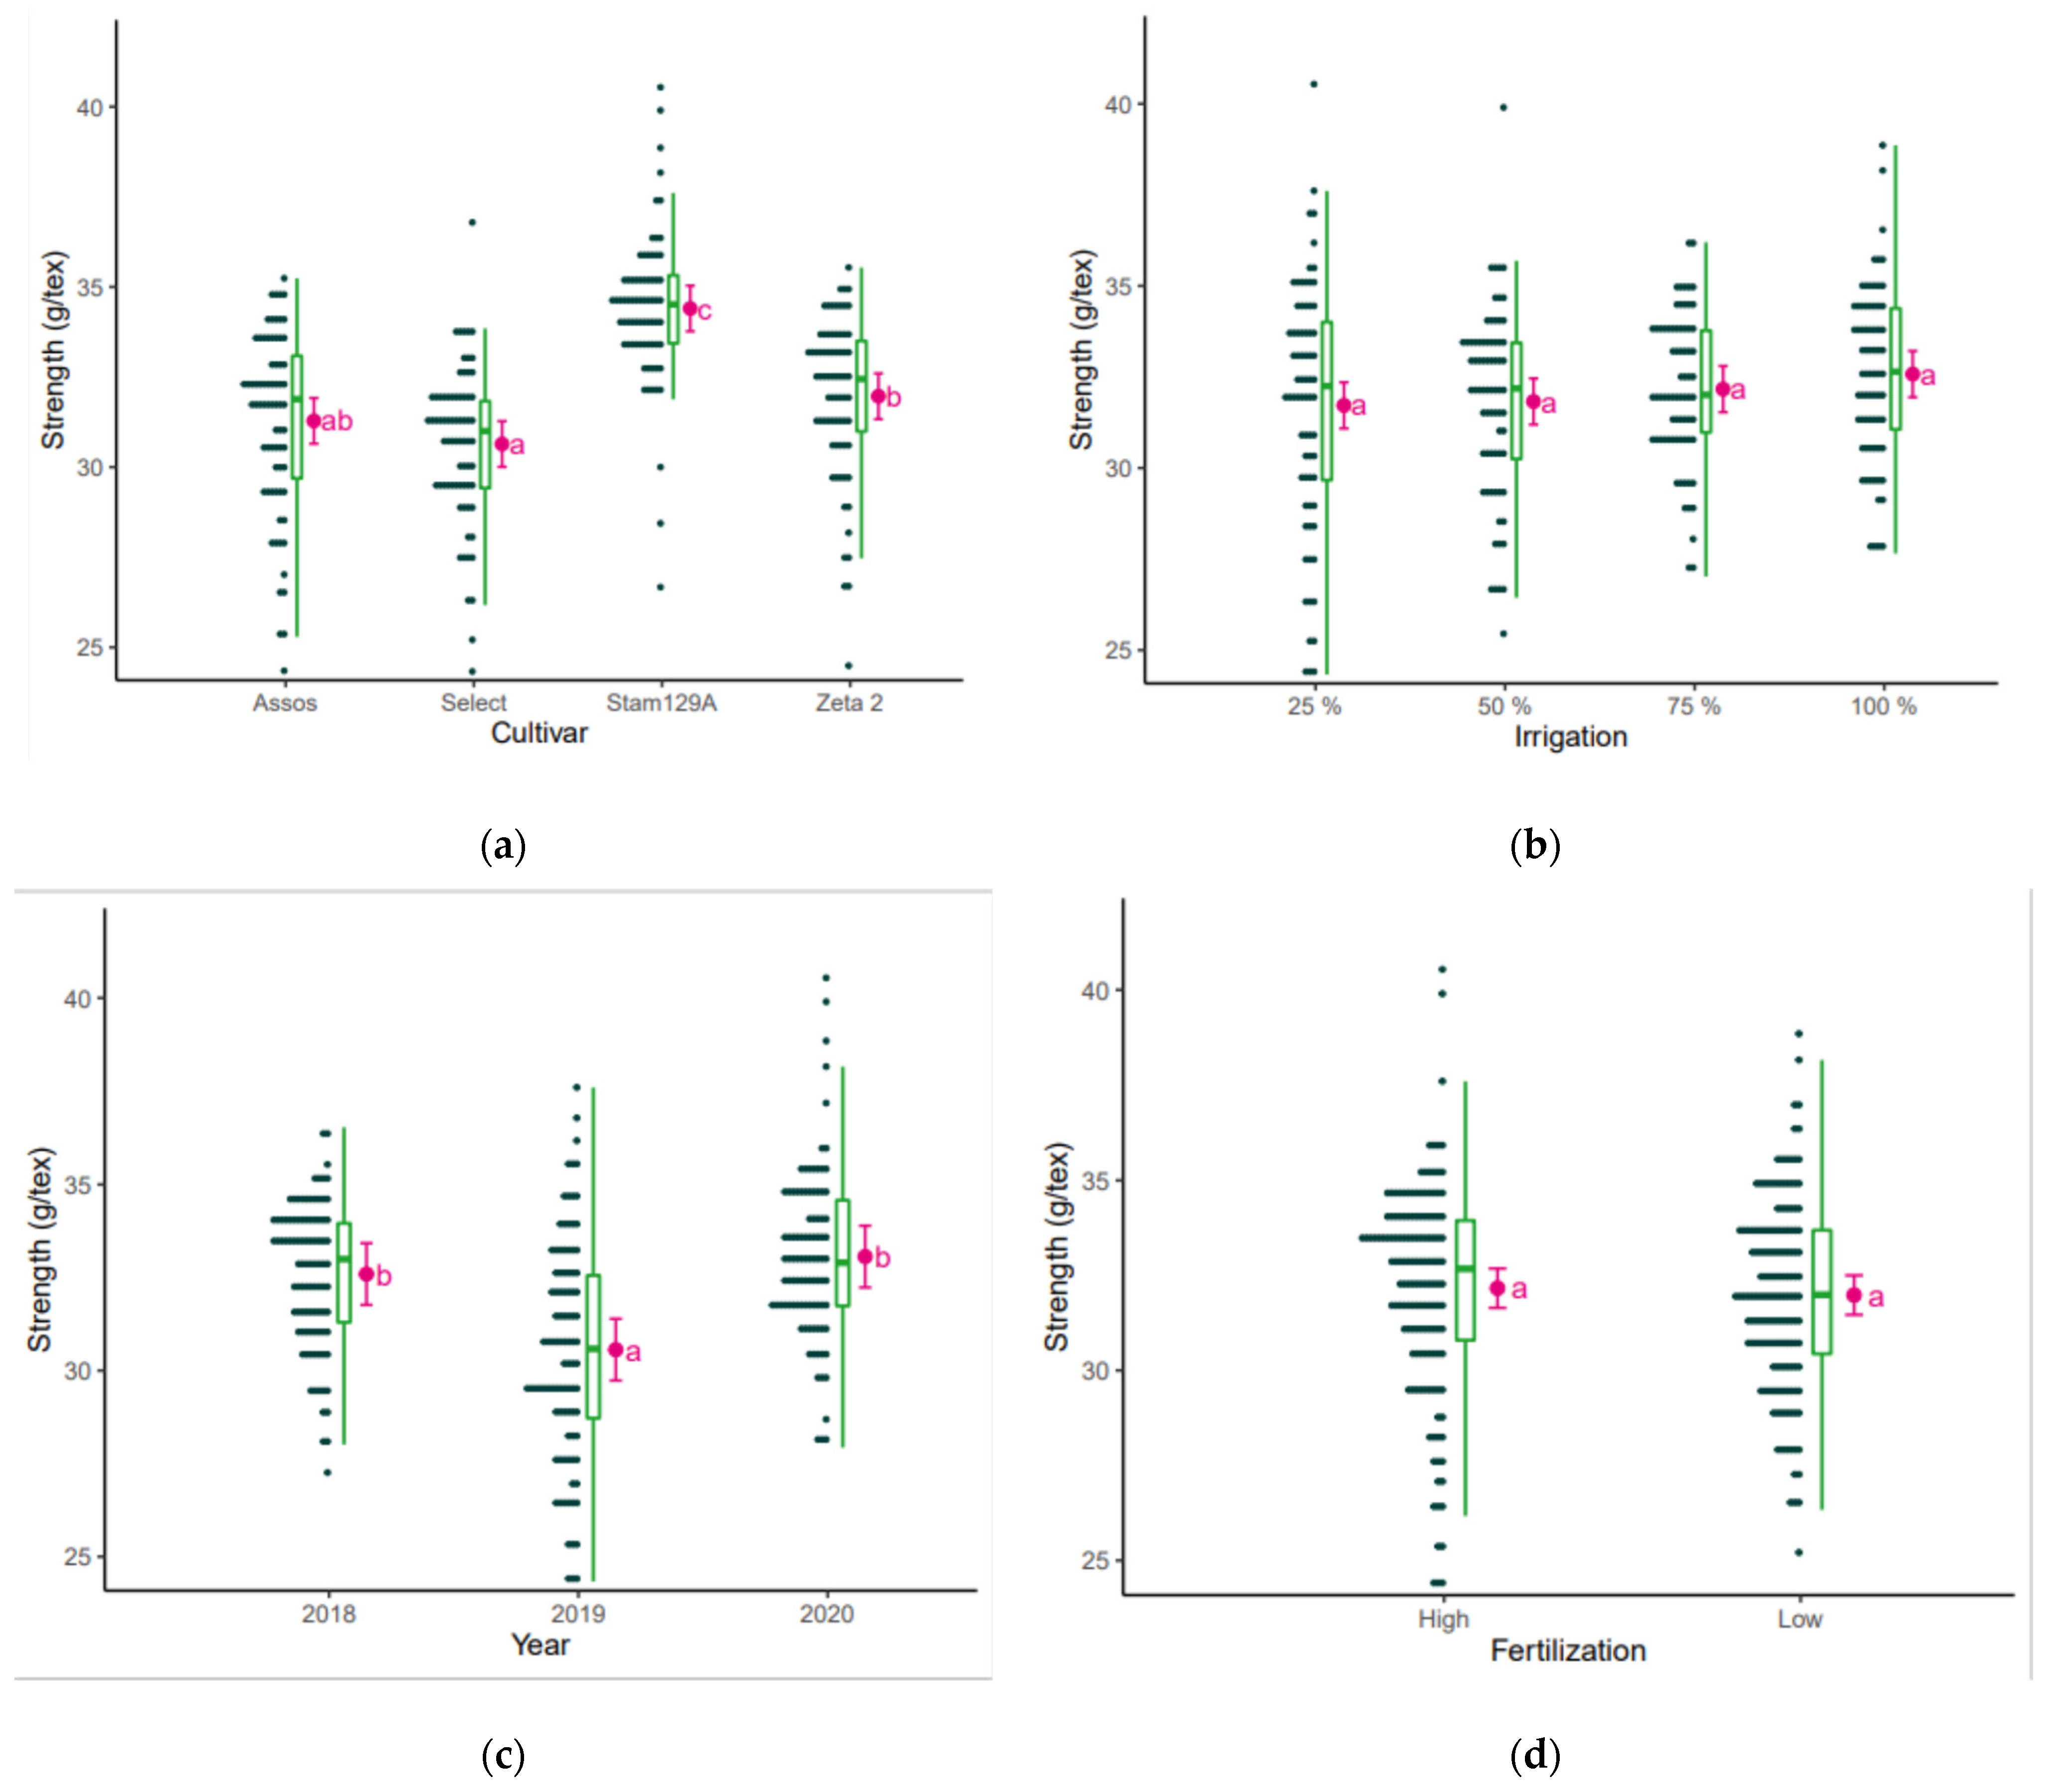
The cultivar Stam 129A had the highest fiber strength (34.4 g tex−1) and Select the lowest (30.6 g tex−1, Figure 10). The year 2019 gave the lowest fiber strength (30.6 g tex−1). The irrigation and fertilization levels did not affect fiber strength.

3.8. Color Parameters

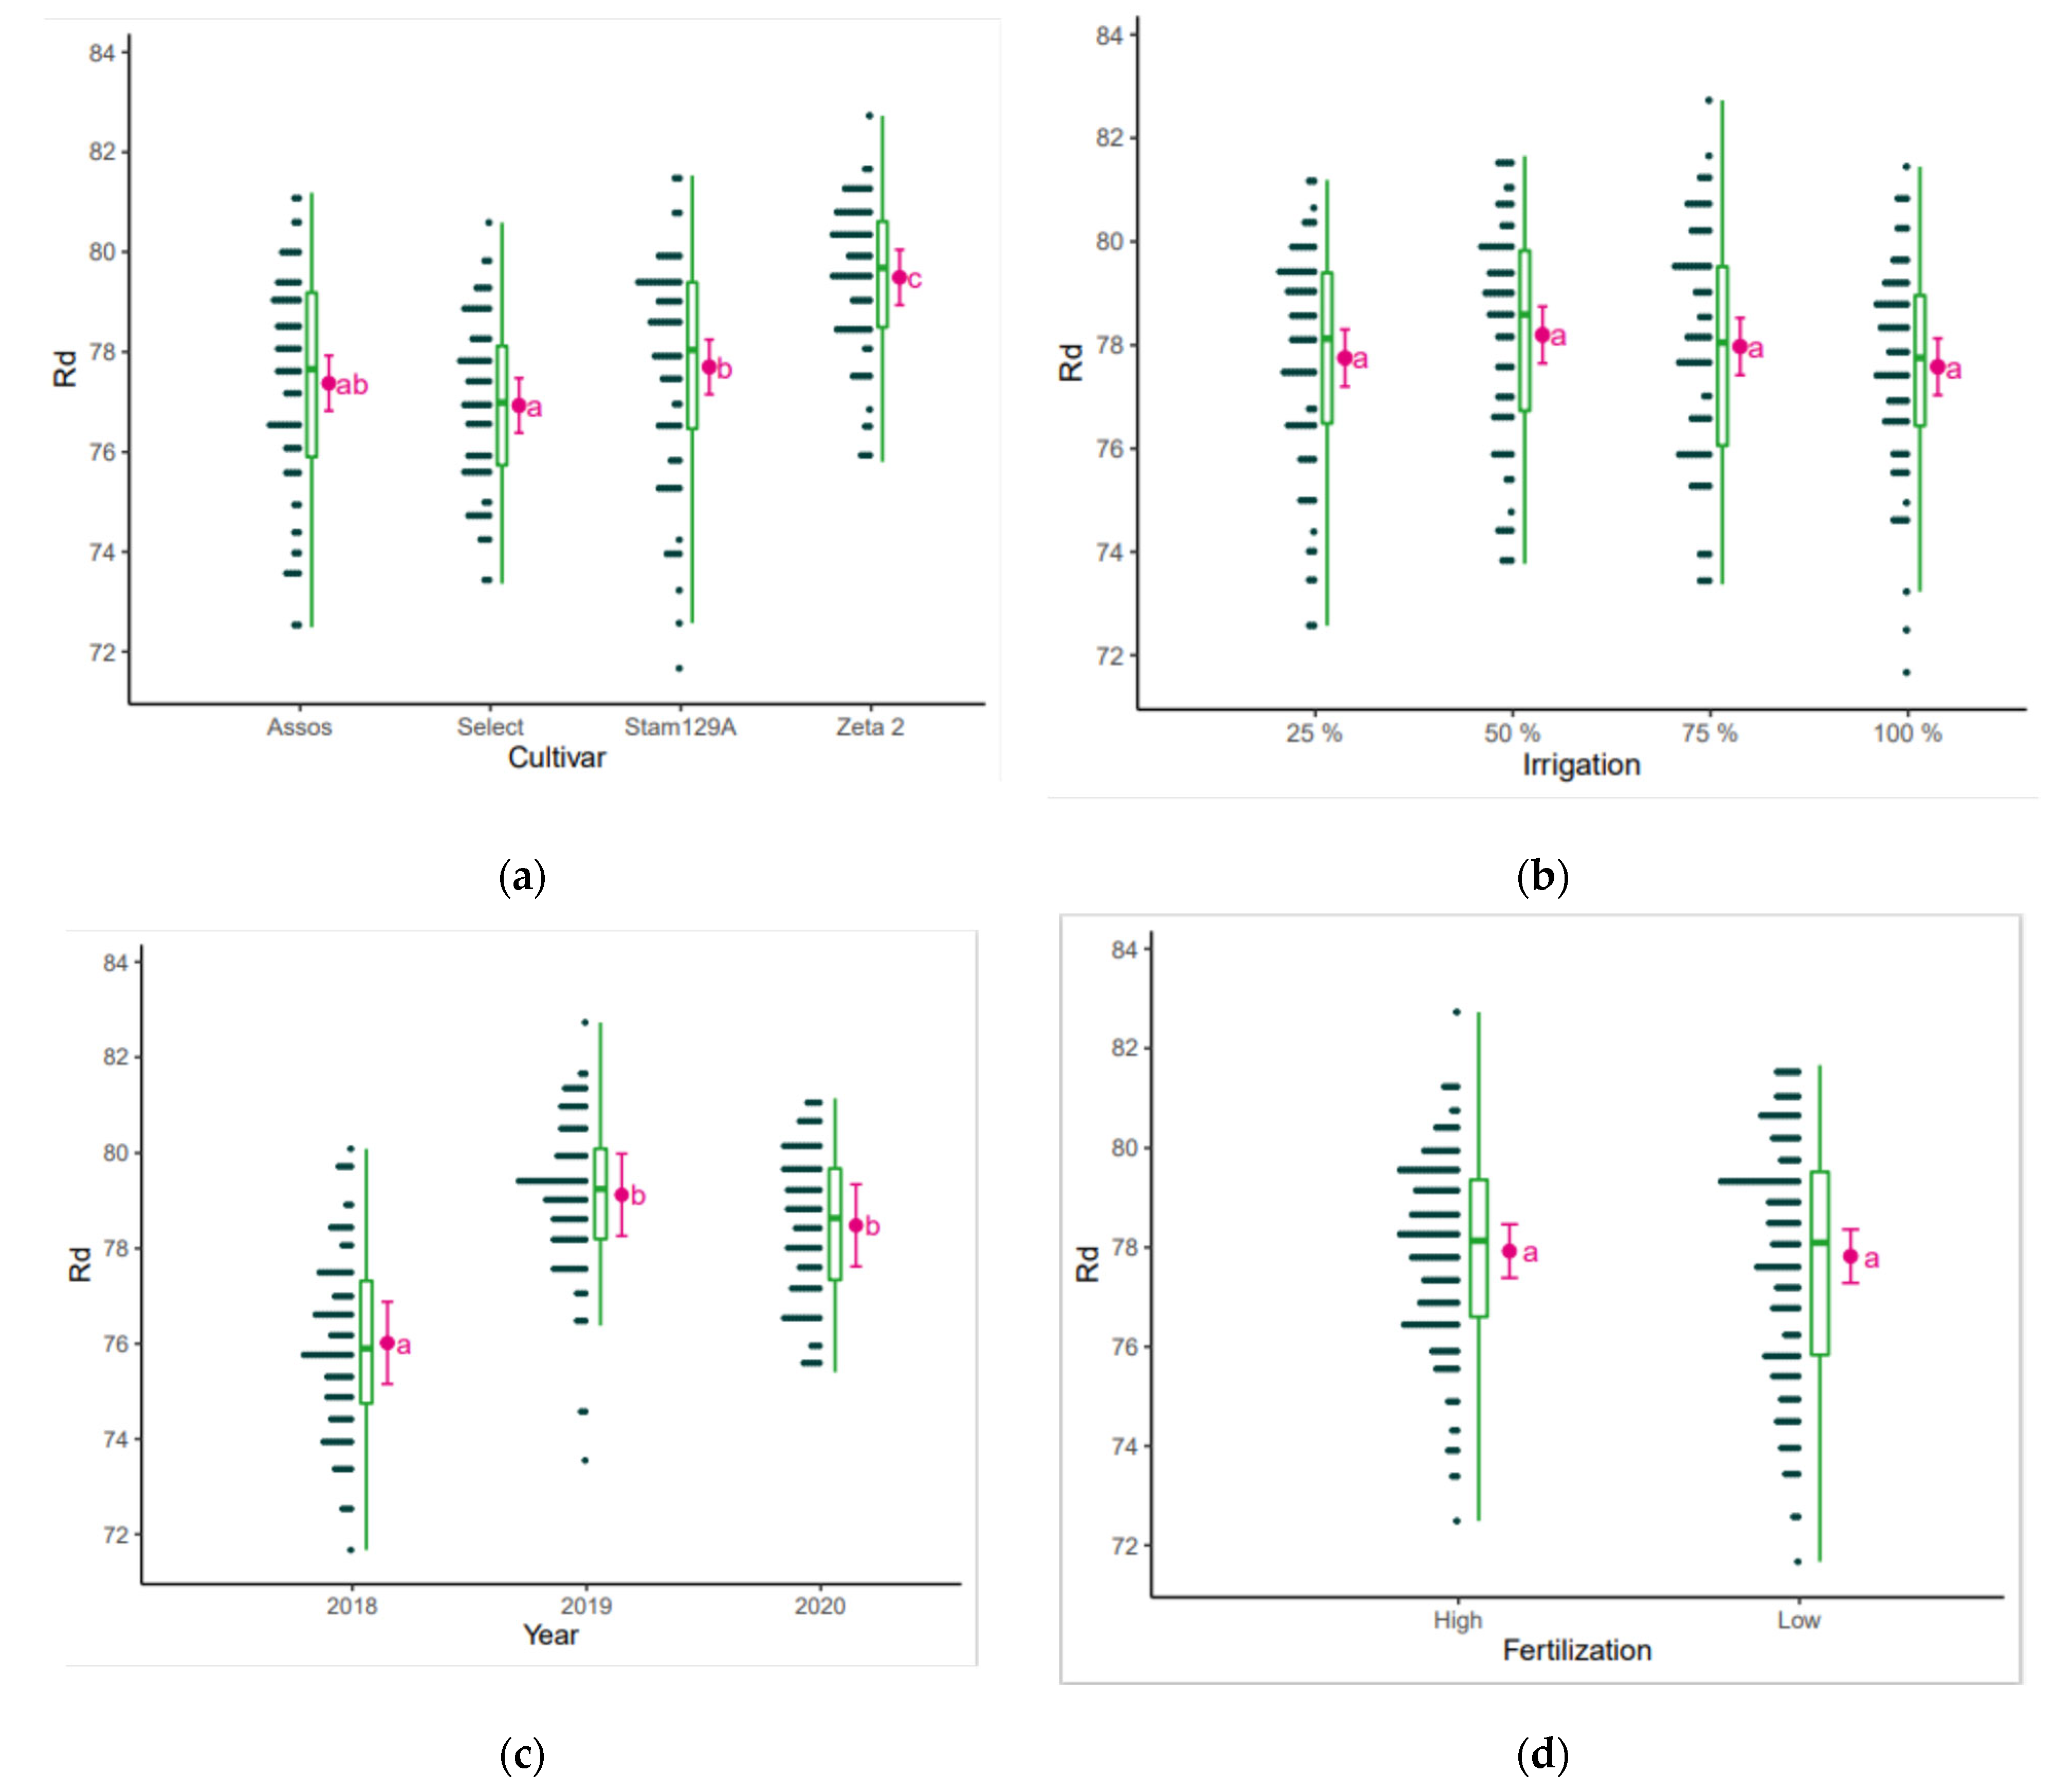
Color grade is based on measured reflectance (Rd) and yellowness (+b). The Rd indicates how bright or dull a sample is and the +b indicates the degree of color pigmentation [42]. The year 2018 resulted in the lowest Rd (76.0, Figure 11). The cultivar Zeta 2 had the highest Rd (79.5) and Select the lowest Rd (76.9). When compared, irrigation and fertilization had no effect on Rd.
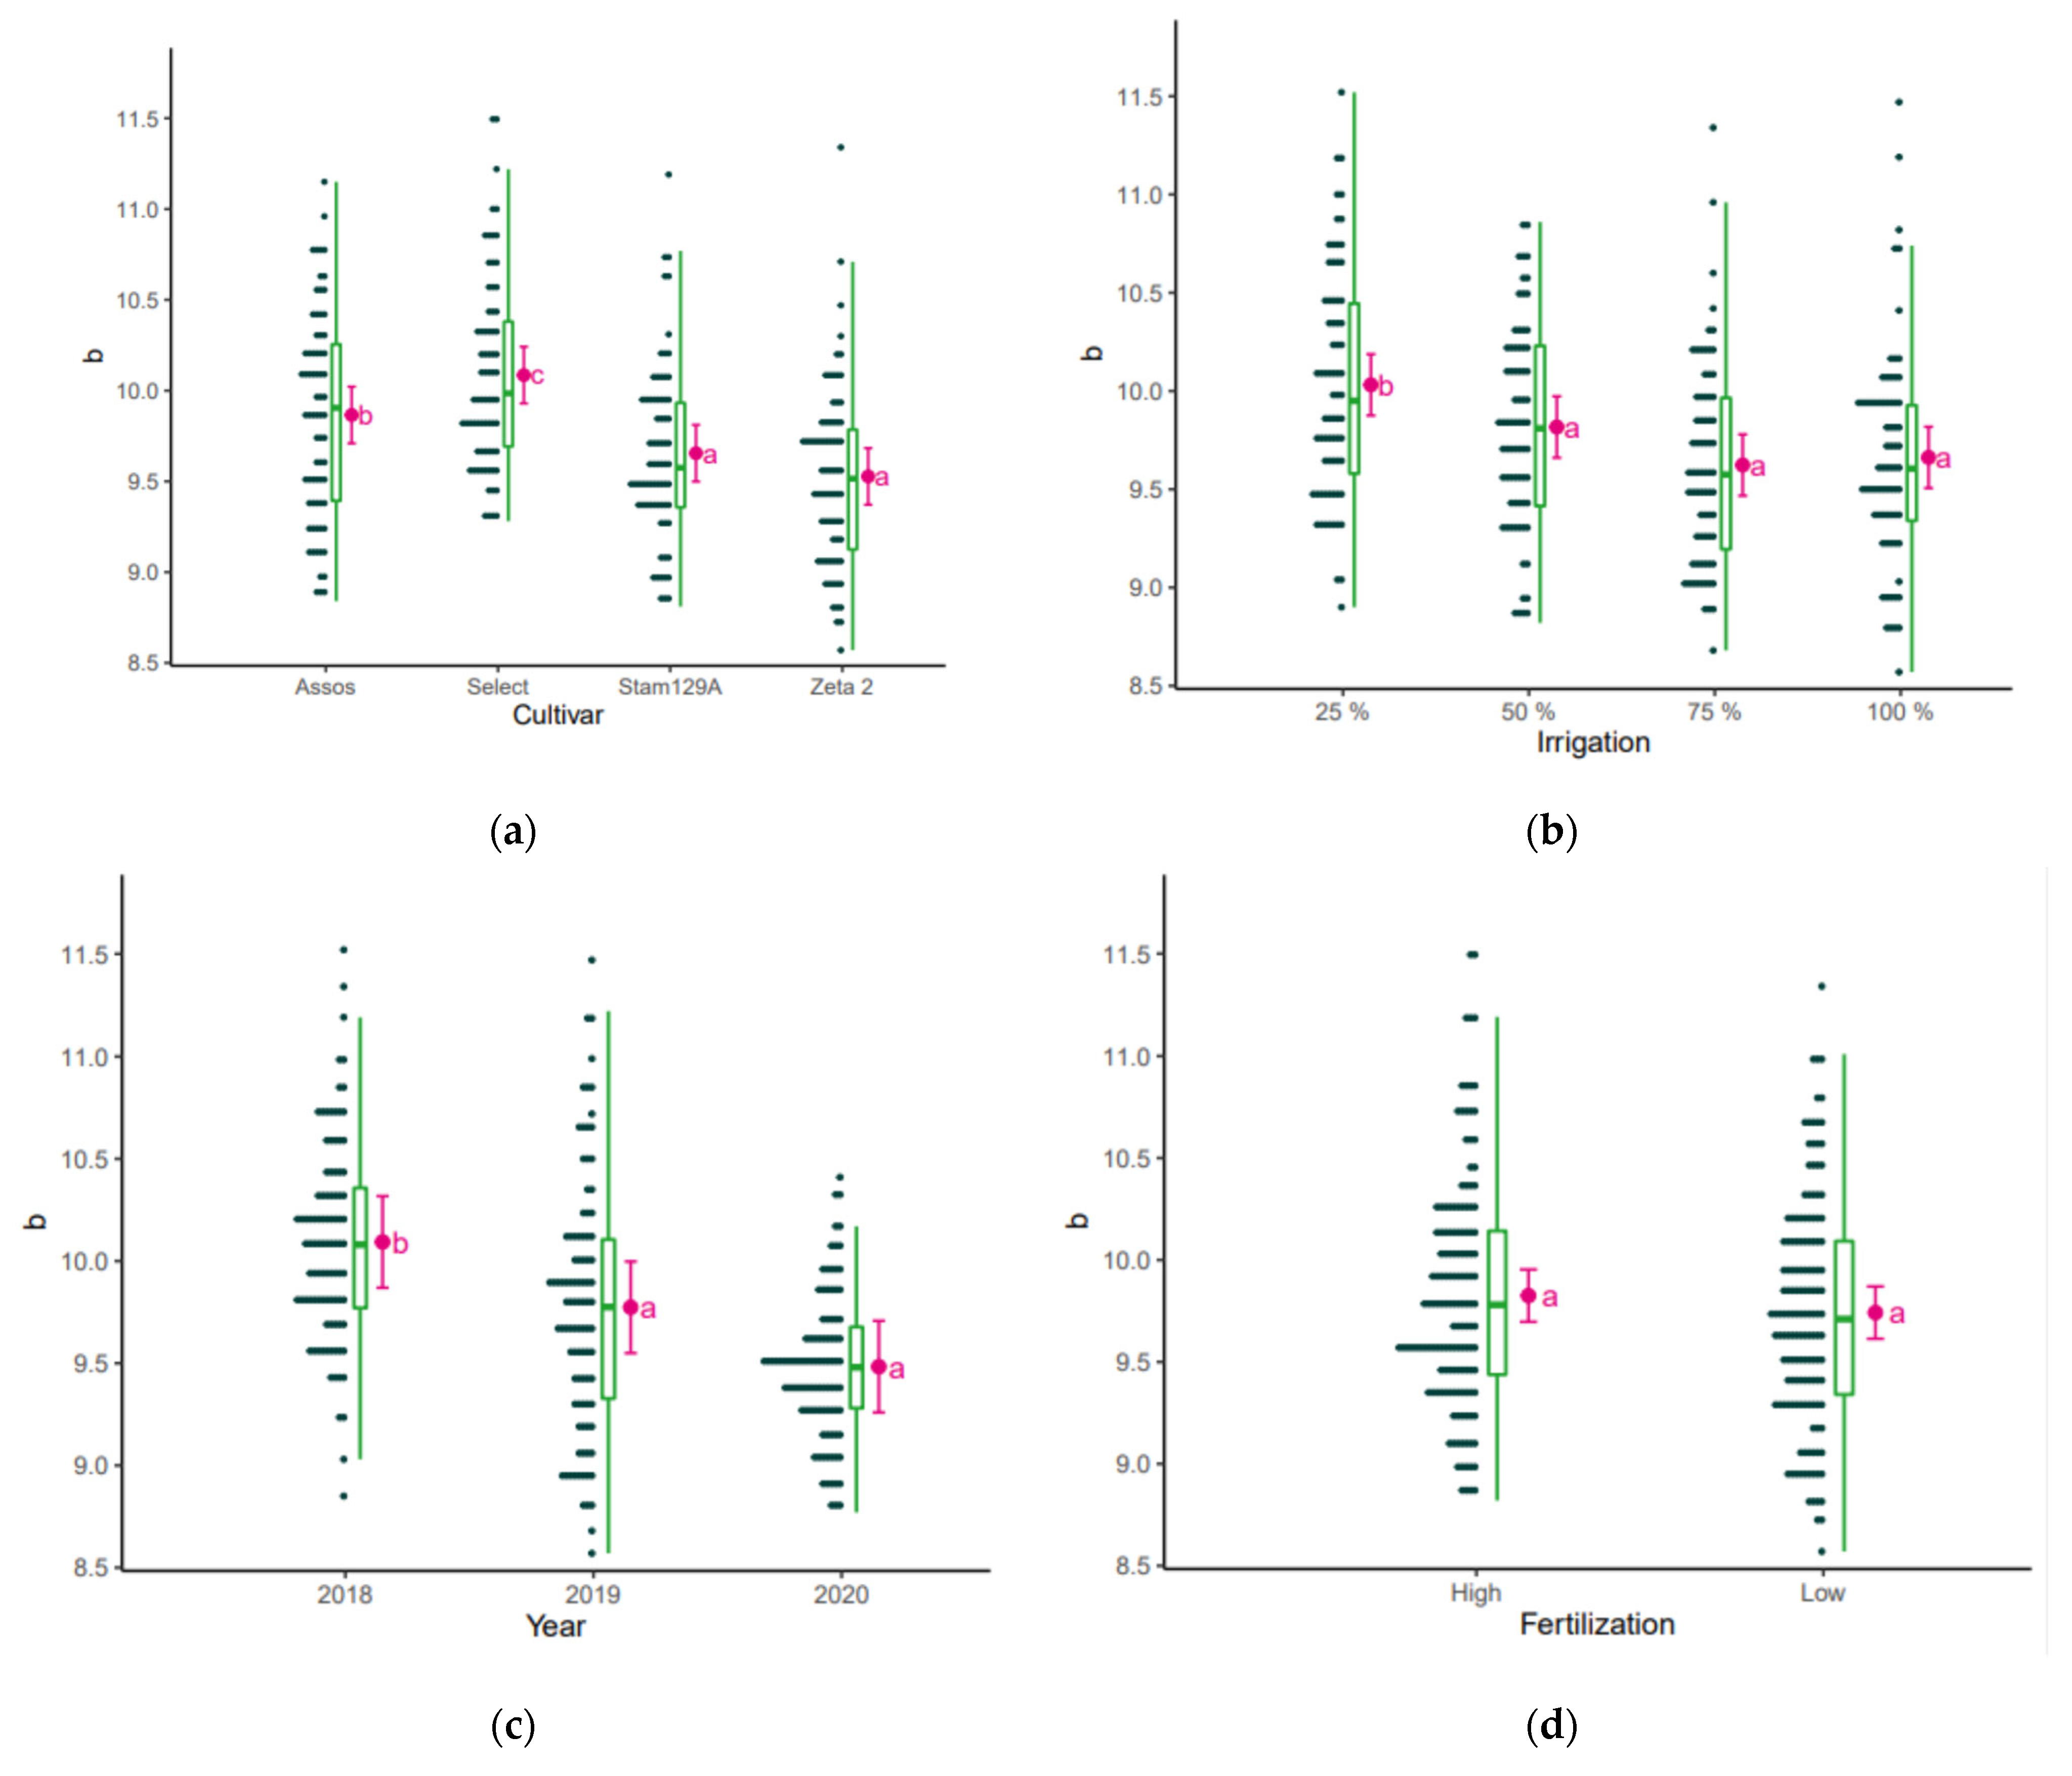
The b parameter of color was not affected by fertilization but differed between years, with 2018 resulting in high b (10.1, Figure 12). The irrigation of 25% also increased the value b to 10.0, and of the tested cultivars, Select had the highest value (10.1) followed by Assos (9.9).

4. Discussion

Cotton fibers carry a wide variability of properties, and it was stated that corresponding fiber characteristics depend on many factors such as cultivation area and soil parameters, weather conditions, inputs, and methods of harvesting and ginning [43,44,45]. Average yields of cotton vary widely [46], although as global climate changes continue, water shortage and drought have become an increasingly serious constraint limiting crop production worldwide [47].
During this study, year-to-year variability among the climatic factors of 2018–2020 growing seasons provided three distinct growing environments for testing the objectives (Figure 1). The range of GDDs in all the years studied was between the range of 1600 and 2900, which have been reported as optimum for Greece [25], but the accumulated growing degree days in 2018 were 7% higher than those in 2019 and 14% than those in 2020. In 2018, the GDDs reached 2270, resulting in higher yields in the first year of experimentation (Figure 4c) because GDDs and yields are positively correlated [39].
Furthermore, soil moisture has a significant effect on cotton growth; refs. [5,48] summarized mixed results concerning the response of cotton yield and yield components to different irrigation regimes. In the presented experiments, it was observed that from 25% to 50% irrigation levels, Assos yield increased by 18%, Select by 25%, and Zeta2 by 24%, while the yield of Stam 129A was almost the same even when irrigation increased. For the Greek cultivars, from 50% to 75% irrigation, only Assos yield increased by 17% while Select and Zeta 2 yield increased by only 3% and 5% accordingly. From 75% to 100% irrigation, there was no further increase in Assos, and only 12.5% and 14.8% increase in yield for the Select and Zeta2 cultivars, accordingly. Generally, the irrigation treatments had a statistically significant effect (F = 12.19) on seed cotton yield, as also previously reported from [49] in Turkey, but no effect of fertilization was observed (F = 1.41). The cultivar Zeta 2 was the most productive, followed by the other two Greek commercial cultivars. This was in accordance with the findings of [8] that Zeta 2 provides a significant advantage to the grower when planted under conditions of high water availability. However, in Oklahoma, USA, [45] found that lint and seed cotton yields under full and reduced irrigation did not differ significantly. The authors moreover reported no significant differences in fiber quality among the irrigation treatments, such as full irrigation, reduced irrigation (75%), and no irrigation. The cultivar Stam 129A performed better compared to other cultivars under a high level of fertilization and the lowest level of irrigation (25%), which somehow mimicked the toughest conditions where this kind of cultivar is evaluated during the breeding process in west Africa.
Typically, cotton yield increases with an increase in N fertilizer until it reaches an optimum level, beyond which additional N fertilizer does not affect yield and most probably results in wasted expenses and negatively impacts soil health [50,51]. The obtained data of the study showed that the reduction of the fertilizers to the half dose recommended did not affect either yield or technological parameters and are in accordance with [13,52], who proposed that cotton productivity is highly dependent on a cultivar’s genetics and highlighted that N fertilizer application rates could be reduced based on updated crop requirements, without yield penalty due to the different requirements of newer cotton cultivars.
The lowest quantities of water gave the maximum fiber percentage (Figure 5), also mentioned by [24,53], while the fertilization had no effect. According to [54], this is probably because of genotype differences and the degree of moisture deficit stress that developed. Ref. [24] stated that this could be a result of the irrigated plants having more vegetative growth and immature bolls.
Fiber quality is a key element in the profitability of cotton, and many researchers have studied the effect of water stress on the quality of cotton fiber [55]. Fiber length and uniformity were shortened under water-stressed conditions, as also reported by [49]. Ref. [56] observed that fiber length was shortened 2–3% from irrigated to dryland cotton plants, but no irrigation effect was assessed on length uniformity, as confirmed by [40] who reported that fiber length was shortened under water-stressed conditions, and more short and immature fibers were produced. On the other hand, fertilization and year had no effect on length parameters, emphasizing the previously published review [14] addressing that fiber responses to N rate vary substantially from one experiment to another and even from site-year to site-year within the same study, while in many instances, no N rate effects are observed.
Micronaire value increased in the year 2020 but was not affected by irrigation and fertilization, contrary to [57], who reported that out of the four HVI fiber quality parameters assessed, only fiber micronaire was significantly affected by N application rate. This means that the moisture deficit conditions were not so severe as to produce immature fibers and move it out of the optimum range of 3.8~4.5, as mentioned by [58] but mainly environmental conditions, as also reported in [59]. Also, according to [60], growing cotton under non-irrigated conditions resulted in the production of shorter and weaker fiber with reduced micronaire, a condition that did not apply in the present experiment.
Fiber strength and elongation did not respond to irrigation deficit in accordance with [48], while [61] reported that there was a negative correlation between fiber strength and elongation, and soil water deficit. Furthermore, [62] found no differences in fiber quality properties between the control well-irrigated treatment and 75% irrigation levels, but fiber length and strength were significantly reduced in the 50 and 25% irrigation levels.
Grayness (HVI Color Rd) indicates how light or dark the sample is, and yellowness (HVI Color +b) indicates how much yellow color is in the sample [63]. The results showed that the color parameters were not affected by fertilization level but by cultivar and mostly by year. In 2018, the cotton was darker (Rd 76.01) and more yellow (b 10.09) than the other years and of the testing cultivars, Zeta 2 had the highest Rd (79.5) and lower b (9.5). This is probably due to weather conditions and the delayed harvesting in 2018. Although not a lot of research work has correlated cotton color with inputs, [55] reviewed that humid conditions or rainfall increase microbial damage, thereby potentially reducing color grades.
Generally, data showed that the reduction in irrigation from 100% to 75% had no effect on yield or the technological parameters of length, fineness, and strength when compared to the normal crop management, while a reduction in water to 25% had a negative impact not only on yield but also on length parameters and color. The results emphasize the need for continual assessment of cotton inputs for cultivated varieties for more sustainable cotton production.
Therefore, although there are numerous earlier works [5,26,49,64] showing the close response of cotton to water deficit on yield attributes, the high production of cotton crops in relation to reduced inputs remains a major issue for sustainability today and the ideal irrigation should significantly reduce water consumption [65] without sacrificing crop yield. This also demonstrates the need for more experimental work providing better management options for cotton ecosystems, ensuring sustainability in the special environmental conditions of each cotton-producing country.

5. Conclusions

The results of this three-year study showed that even with reduced fertilization, all tested cultivars had high seed cotton yield and almost no effect on the main technological characteristics. On the other hand, irrigation reduction to 50% or 75% of the normal level had a significant impact on the yield, while a reduction of 25% of the irrigation appeared to be an effective approach to more sustainable cotton production, with no effect on yield and on length parameters and micronaire. This research is crucial for reassessing the best nutrient inputs for farmers and producers, particularly considering the frequent introduction of new cultivars and the constant changes in environmental conditions. In addition, Greek farmers nowadays face a continual rise of production costs, and these results demonstrated that a reduction in the fertilization inputs by 50% and irrigation by 25% not only benefit the environment with the sustainable use of inputs but also stabilize or even increase their net income, without having impact on seed cotton yield and quality of fiber.

Author Contributions

E.T. conceptualized, designed, and supervised the experiments; R.L. designed the experiment and performed statistical analysis; A.K. supervised the growing experiments; I.G. and I.P. carried out the field experiments and measurements; A.T. reviewed and edited the manuscript; E.T., J.-P.G. and R.L. wrote and reviewed manuscript preparation. All authors have read and agreed to the published version of the manuscript.

Funding

This research has been supported by the ARIMNet2 2017 Transnational Joint Call through the TomorrowS project “Designing cotton (Gossypium hirsutum L.) and durum wheat (Triticum durum) crop management ideotypes (cultivars, fertilization, salinity and irrigation) by simulation under current and projected future climate: A comparative study in Greece and Tunisia” and was co-funded by the Hellenic Agricultural Organization DIMITRA of Greece, the Institut National de la recherche Agronomique de Tunisie, Republic of Tunisia, and the Agence Nationale de la Recherche, France. The project ANR-17-ARM2-0001 ARIMNet2 (ERA-NET) received funding from the European Union’s Seventh Framework Program for research, technological development, and demonstration, under grant agreement no. 618127.

Institutional Review Board Statement

Not applicable.

Informed Consent Statement

Not applicable.

Data Availability Statement

Data available in a publicly accessible repository.

Acknowledgments

We would like to thank BIOS Agrosystems S.A. for providing free of charge the seeds of cotton cultivars Select and Assos.

Conflicts of Interest

The authors declare no conflicts of interest.

References

  1. Pabuayon, I.L.B.; Kelly, B.R.; Mitchell-McCallister, D.; Coldren, C.L.; Ritchie, G.L. Cotton Boll Distribution: A Review. Agron. J. 2021, 113, 956–970. [Google Scholar] [CrossRef]
  2. Wiggins, M.S.; Leib, B.G.; Mueller, T.C.; Main, C.L. Investigation of Physiological Growth, Fiber Quality, Yield, and Yield Stability of Upland Cotton Varieties in Differing Environments. J. Cotton Sci. 2013, 17, 9. [Google Scholar]
  3. Wu, B.; Zuo, W.; Yang, P.; Zhang, W. Optimal Water and Nitrogen Management Increases Cotton Yield through Improving Leaf Number and Canopy Light Environment. Field Crops Res. 2023, 290, 108745. [Google Scholar] [CrossRef]
  4. Loka, D.; Oosterhuis, D.M. Water Stress and Reproductive Development in Cotton. In Flowering and Fruiting in Cotton; Oosterhuis, D.M., Cothren, J.T., Eds.; Cotton Foundation: Memphis, TN, USA, 2012; pp. 51–57. [Google Scholar]
  5. Koudahe, K.; Sheshukov, A.Y.; Aguilar, J.; Djaman, K. Irrigation-Water Management and Productivity of Cotton: A Review. Sustainability 2021, 13, 10070. [Google Scholar] [CrossRef]
  6. Snowden, M.C.; Ritchie, G.L.; Simao, F.R.; Bordovsky, J.P. Timing of Episodic Drought Can Be Critical in Cotton. Agron. J. 2014, 106, 452–458. [Google Scholar] [CrossRef]
  7. Pettigrew, W.T. The Effect of Higher Temperatures on Cotton Lint Yield Production and Fiber Quality. Crop Sci. 2008, 48, 278–285. [Google Scholar] [CrossRef]
  8. Voloudakis, A.E.; Kosmas, S.A.; Tsakas, S.; Eliopoulos, E.; Loukas, M.; Kosmidou, K. Expression of Selected Drought-Related Genes and Physiological Response of Greek Cotton Varieties. Funct. Plant Biol. 2002, 29, 1237–1245. [Google Scholar] [CrossRef] [PubMed]
  9. Shukr, H.H.; Pembleton, K.G.; Zull, A.F.; Cockfield, G.J. Impacts of Effects of Deficit Irrigation Strategy on Water Use Efficiency and Yield in Cotton under Different Irrigation Systems. Agronomy 2021, 11, 231. [Google Scholar] [CrossRef]
  10. Ahmad, H.S.; Imran, M.; Ahmad, F.; Rukh, S.; Ikram, R.M.; Rafique, H.M.; Iqbal, Z.; Alsahli, A.A.; Alyemeni, M.N.; Ali, S.; et al. Improving Water Use Efficiency through Reduced Irrigation for Sustainable Cotton Production. Sustainability 2021, 13, 4044. [Google Scholar] [CrossRef]
  11. Kang, Y.; Wang, R.; Wan, S.; Hu, W.; Jiang, S.; Liu, S. Effects of Different Water Levels on Cotton Growth and Water Use through Drip Irrigation in an Arid Region with Saline Ground Water of Northwest China. Agric. Water Manag. 2012, 109, 117–126. [Google Scholar] [CrossRef]
  12. Papastylianou, P.T.; Argyrokastritis, I.G. Effect of Limited Drip Irrigation Regime on Yield, Yield Components, and Fiber Quality of Cotton under Mediterranean Conditions. Agric. Water Manag. 2014, 142, 127–134. [Google Scholar] [CrossRef]
  13. Pabuayon, I.L.B.; Mitchell-McCallister, D.; Lewis, K.L.; Ritchie, G.L. Yield and Economic Response of Modern Cotton Cultivars to Nitrogen Fertilizer. Agronomy 2021, 11, 2149. [Google Scholar] [CrossRef]
  14. Pokhrel, A.; Snider, J.L.; Virk, S.; Sintim, H.Y.; Hand, L.C.; Vellidis, G.; Parkash, V.; Chalise, D.P.; Lee, J.M. Quantifying Physiological Contributions to Nitrogen-Induced Yield Variation in Field-Grown Cotton. Field Crops Res. 2023, 299, 108976. [Google Scholar] [CrossRef]
  15. Chen, J.; Liu, L.; Wang, Z.; Sun, H.; Zhang, Y.; Bai, Z.; Song, S.; Lu, Z.; Li, C. Nitrogen Fertilization Effects on Physiology of the Cotton Boll–Leaf System. Agronomy 2019, 9, 271. [Google Scholar] [CrossRef]
  16. Clement, J.D.; Constable, G.A.; Stiller, W.N.; Liu, S.M. Negative Associations Still Exist between Yield and Fibre Quality in Cotton Breeding Programs in Australia and USA. Field Crops Res. 2012, 128, 1–7. [Google Scholar] [CrossRef]
  17. Giannakopoulos, C.; Kostopoulou, E.; Varotsos, K.V.; Tziotziou, K.; Plitharas, A. An Integrated Assessment of Climate Change Impacts for Greece in the near Future. Reg. Environ. Change 2011, 11, 829–843. [Google Scholar] [CrossRef]
  18. Clark, M.; Tilman, D. Comparative Analysis of Environmental Impacts of Agricultural Production Systems, Agricultural Input Efficiency, and Food Choice. Environ. Res. Lett. 2017, 12, 064016. [Google Scholar] [CrossRef]
  19. Engonopoulos, V.; Kouneli, V.; Mavroeidis, A.; Karydogianni, S.; Beslemes, D.; Kakabouki, I.; Papastylianou, P.; Bilalis, D. Cotton versus Climate Change: The Case of Greek Cotton Production. Not. Bot. Horti Agrobot. Cluj-Napoca 2021, 49, 12547. [Google Scholar] [CrossRef]
  20. Tsaliki, E.; Kalyvas, A. Cotton Research Aspects in Greece. In Proceedings of the 12th Meeting of Inter-Regional Research Network on Cotton, Sharm El Sheikh, Egypt, 6–10 October 2015; Available online: https://staging.icac.org/getattachment/tech/Regional-Networks/Inter-Regional-Cooperative-Research-Network-on-Cot/Twelfth-Regional-Meeting-Documents/E-Tsaliki.pdf (accessed on 9 November 2023).
  21. ICAC Cotton Data Book. 2021. Available online: https://Icac.org/Content/PublicationsPdf%20Files/941868ca_bd5c_406f_9a0c_3d5862fa1539/Contents-DataBook.Pdf.Pdf (accessed on 9 November 2023).
  22. Katerji, N.; Mastrorilli, M.; Rana, G. Water Use Efficiency of Crops Cultivated in the Mediterranean Region: Review and Analysis. Eur. J. Agron. 2008, 28, 493–507. [Google Scholar] [CrossRef]
  23. Cramer, W.; Guiot, J.; Fader, M.; Garrabou, J.; Gattuso, J.-P.; Iglesias, A.; Lange, M.A.; Lionello, P.; Llasat, M.C.; Paz, S.; et al. Climate Change and Interconnected Risks to Sustainable Development in the Mediterranean. Nat. Clim. Change 2018, 8, 972–980. [Google Scholar] [CrossRef]
  24. Feng, L.; Mathis, G.; Ritchie, G.; Han, Y.; Li, Y.; Wang, G.; Zhi, X.; Bednarz, C.W. Optimizing Irrigation and Plant Density for Improved Cotton Yield and Fiber Quality. Agron. J. 2014, 106, 1111–1118. [Google Scholar] [CrossRef]
  25. Tsiros, E.; Domenikiotis, C.; Dalezios, N.R. Assessment of Cotton Phenological Stages Using Agroclimatic Indices: An Innovative Approach. Ital. J. Agrometeorol. 2009, 1, 50–55. [Google Scholar]
  26. Zhang, D.; Luo, Z.; Liu, S.; Li, W.; Dong, H. Effects of Deficit Irrigation and Plant Density on the Growth, Yield and Fiber Quality of Irrigated Cotton. Field Crops Res. 2016, 197, 1–9. [Google Scholar] [CrossRef]
  27. Kalivas, A.; Xanthopoulos, F.; Kehagia, O.; Tsaftaris, A.S. Agronomic Characterization, Genetic Diversity and Association Analysis of Cotton Cultivars Using Simple Sequence Repeat Molecular Markers. Genet. Mol. Res. 2011, 10, 208–217. [Google Scholar] [CrossRef]
  28. ASTM D 5867 “Standard Test Methods for Measurement of Physical Properties of Cotton Fibers by High Volume Instruments” (Current Version: 2012). Available online: https://cdn.standards.iteh.ai/samples/5743/d40628537bfe41f6b5e2953b22df9562/ASTM-D4604-95.pdf (accessed on 9 November 2023).
  29. Delhom, C.D.; Martin, V.B.; Schreiner, M.K. Textile Industry Needs. J. Cotton Sci. 2017, 21, 210–219. [Google Scholar] [CrossRef]
  30. R Core Team. R: A Language and Environment for Statistical Computing; R Foundation for Statistical Computing: Vienna, Austria, 2022. [Google Scholar]
  31. Kuznetsova, A.; Brockhoff, P.B.; Christensen, R.H.B. lmerTest Package: Tests in Linear Mixed Effects Models. J. Stat. Softw. 2017, 82, 1–26. [Google Scholar] [CrossRef]
  32. Lenth, R.V. Emmeans: Estimated Marginal Means, Aka Least-Squares Means. 2022. Available online: https://cran.r-project.org/web/packages/emmeans/emmeans.pdf (accessed on 9 November 2023).
  33. Hothorn, T.; Bretz, F.; Westfall, P. Simultaneous Inference in General Parametric Models. Biom. J. 2008, 50, 346–363. [Google Scholar] [CrossRef]
  34. Dowle, M.; Srinivasan, A. Data.Table: Extension of ‘data.Frame’. 2022. Available online: https://rdrr.io/cran/data.table/ (accessed on 9 November 2023).
  35. Wickham, H.; François, R.; Henry, L.; Müller, K. Dplyr: A Grammar of Data Manipulation. 2022. Available online: https://cran.r-project.org/web/packages/dplyr/index.html (accessed on 9 November 2023).
  36. Wickham, H. Ggplot2: Elegant Graphics for Data Analysis; Springer: New York, NY, USA, 2016; ISBN 978-3-319-24277-4. [Google Scholar]
  37. Tsaliki, E.; Panoras, Y.; Grigoriadis, I.; Loison, R. Cotton Experimental Dataset for Modeling Cultivar * Irrigation * Fertilization Interactions in Greece from 2018 to 2020. 2022. Available online: https://dataverse.cirad.fr/dataset.xhtml?persistentId=doi:10.18167/DVN1/XQU8ZF (accessed on 9 November 2023).
  38. Sharma, R.K.; Kumar, S.; Vatta, K.; Dhillon, J.; Reddy, K.N. Impact of Recent Climate Change on Cotton and Soybean Yields in the Southeastern United States. J. Agric. Food Res. 2022, 9, 100348. [Google Scholar] [CrossRef]
  39. Mauget, S.; Ulloa, M.; Dever, J. Planting Date Effects on Cotton Lint Yield and Fiber Quality in the U.S. Southern High Plains. Agriculture 2019, 9, 82. [Google Scholar] [CrossRef]
  40. Lokhande, S.; Reddy, K.R. Reproductive and Fiber Quality Responses of Upland Cotton to Moisture Deficiency. Agron. J. 2014, 106, 1060–1069. [Google Scholar] [CrossRef]
  41. Delhom, C.D.; Kelly, B.; Martin, V. Physical Properties of Cotton Fiber and Their Measurement. In Cotton Fiber: Physics, Chemistry and Biology; Fang, D.D., Ed.; Springer International Publishing: Cham, Switzerland, 2018; pp. 41–73. ISBN 978-3-030-00871-0. [Google Scholar]
  42. Matusiak, M. Digieye Application in Cotton Colour Measurement. Autex Res. J. 2015, 15, 77–86. [Google Scholar] [CrossRef]
  43. Liakatas, A.; Roussopoulos, D.; Whittington, W.J. Controlled-Temperature Effects on Cotton Yield and Fibre Properties. J. Agric. Sci. 1998, 130, 463–471. [Google Scholar] [CrossRef]
  44. Zimniewska, M.; Frydrych, I.; Mankowski, J.; Trywianska, W. Process and Quality Control in Cultivating Natural Textile Fibres. In Process Control in Textile Manufacturing; Elsevier: Amsterdam, The Netherlands, 2013; pp. 81–108. ISBN 978-0-85709-027-0. [Google Scholar]
  45. Masasi, B.; Taghvaeian, S.; Boman, R.; Moriasi, D.N.; Starks, P.J. Impacts of Variable Irrigation Regimes on Cotton Yield and Fiber Quality. Agric. Env. Lett. 2020, 5, e20031. [Google Scholar] [CrossRef]
  46. Constable, G.A.; Bange, M.P. The Yield Potential of Cotton (Gossypium hirsutum L.). Field Crops Res. 2015, 182, 98–106. [Google Scholar] [CrossRef]
  47. Karademir, C.; Karademir, E.; Ekinci, R.; Berekatoğlu, K. Yield and Fiber Quality Properties of Cotton (Gossypium hirsutum L.) under Water Stress and Non-Stress Conditions. Afr. J. Biotechnol. 2011, 10, 12575–12583. [Google Scholar]
  48. Li, M.; Xiao, J.; Bai, Y.; Du, Y.; Zhang, F.; Cheng, H.; Wang, H. Response Mechanism of Cotton Growth to Water and Nutrients under Drip Irrigation with Plastic Mulch in Southern Xinjiang. J. Sens. 2020, 2020, 2575162. [Google Scholar] [CrossRef]
  49. Ünlü, M.; Kanber, R.; Koç, D.L.; Tekin, S.; Kapur, B. Effects of Deficit Irrigation on the Yield and Yield Components of Drip Irrigated Cotton in a Mediterranean Environment. Agric. Water Manag. 2011, 98, 597–605. [Google Scholar] [CrossRef]
  50. Dong, H.; Li, W.; Eneji, A.E.; Zhang, D. Nitrogen Rate and Plant Density Effects on Yield and Late-Season Leaf Senescence of Cotton Raised on a Saline Field. Field Crops Res. 2012, 126, 137–144. [Google Scholar] [CrossRef]
  51. Main, C.L.; Barber, L.T.; Boman, R.K.; Chapman, K.; Dodds, D.M.; Duncan, S.; Edmisten, K.L.; Horn, P.; Jones, M.A.; Morgan, G.D.; et al. Effects of Nitrogen and Planting Seed Size on Cotton Growth, Development, and Yield. Agron. J. 2013, 105, 1853–1859. [Google Scholar] [CrossRef]
  52. Pabuayon, I.L.B.; Lewis, K.L.; Ritchie, G.L. Dry Matter and Nutrient Partitioning Changes for the Past 30 Years of Cotton Production. Agron. J. 2020, 112, 4373–4385. [Google Scholar] [CrossRef]
  53. Onder, D.; Akiscan, Y.; Onder, S.; Mert, M. Effect of Different Irrigation Water Level on Cotton Yield and Yield Components. Afr. J. Biotechnol. 2009, 8, 1536–1544. [Google Scholar]
  54. Kuppu, S.; Mishra, N.; Hu, R.; Sun, L.; Zhu, X.; Shen, G.; Blumwald, E.; Payton, P.; Zhang, H. Water-Deficit Inducible Expression of a Cytokinin Biosynthetic Gene IPT Improves Drought Tolerance in Cotton. PLoS ONE 2013, 8, e64190. [Google Scholar] [CrossRef] [PubMed]
  55. Luo, Q.; Bange, M.; Johnston, D. Environment and Cotton Fibre Quality. Clim. Change 2016, 138, 207–221. [Google Scholar] [CrossRef]
  56. Pettigrew, W.T. Moisture Deficit Effects on Cotton Lint Yield, Yield Components, and Boll Distribution. Agron. J. 2004, 96, 377. [Google Scholar] [CrossRef]
  57. Snider, J.; Harris, G.; Roberts, P.; Meeks, C.; Chastain, D.; Bange, M.; Virk, G. Cotton Physiological and Agronomic Response to Nitrogen Application Rate. Field Crops Res. 2021, 270, 108194. [Google Scholar] [CrossRef]
  58. Bange, M.; Nunn, C.; Mahan, J.; Payton, P.; Milroy, S.; Finger, N.; Caton, J.; Dodge, W.; Quinn, J. Improving Temperature-Based Predictions of the Timing of Flowering in Cotton. Agron. J. 2022, 114, 2728–2742. [Google Scholar] [CrossRef]
  59. Snowden, C.; Ritchie, G.; Cave, J.; Keeling, W.; Rajan, N. Multiple Irrigation Levels Affect Boll Distribution, Yield, and Fiber Micronaire in Cotton. Agron. J. 2013, 105, 1536–1544. [Google Scholar] [CrossRef]
  60. Mert, M. Irrigation of Cotton Cultivars Improves Seed Cotton Yield, Yield Components and Fibre Properties in the Hatay Region, Turkey. Acta Agric. Scand. Sect. B—Soil Plant Sci. 2005, 55, 44–50. [Google Scholar] [CrossRef]
  61. Johnson, R.M.; Downer, R.G.; Bradow, J.M.; Bauer, P.J.; Sadler, E.J. Variability in Cotton Fiber Yield, Fiber Quality, and Soil Properties in a Southeastern Coastal Plain. Agron. J. 2002, 94, 1305–1316. [Google Scholar] [CrossRef]
  62. Dağdelen, N.; Başal, H.; Yılmaz, E.; Gürbüz, T.; Akçay, S. Different Drip Irrigation Regimes Affect Cotton Yield, Water Use Efficiency and Fiber Quality in Western Turkey. Agric. Water Manag. 2009, 96, 111–120. [Google Scholar] [CrossRef]
  63. Cui, X.; Cai, Y.; Rodgers, J.; Martin, V.; Watson, M. An Investigation into the Intra-Sample Variation in the Color of Cotton Using Image Analysis. Text. Res. J. 2014, 84, 214–222. [Google Scholar] [CrossRef]
  64. Neupane, J.; Guo, W.; West, C.P.; Zhang, F.; Lin, Z. Effects of Irrigation Rates on Cotton Yield as Affected by Soil Physical Properties and Topography in the Southern High Plains. PLoS ONE 2021, 16, e0258496. [Google Scholar] [CrossRef] [PubMed]
  65. Schaefer, C.R.; Ritchie, G.L.; Bordovsky, J.P.; Lewis, K.; Kelly, B. Irrigation Timing and Rate Affect Cotton Boll Distribution and Fiber Quality. Agron. J. 2018, 110, 922–931. [Google Scholar] [CrossRef]
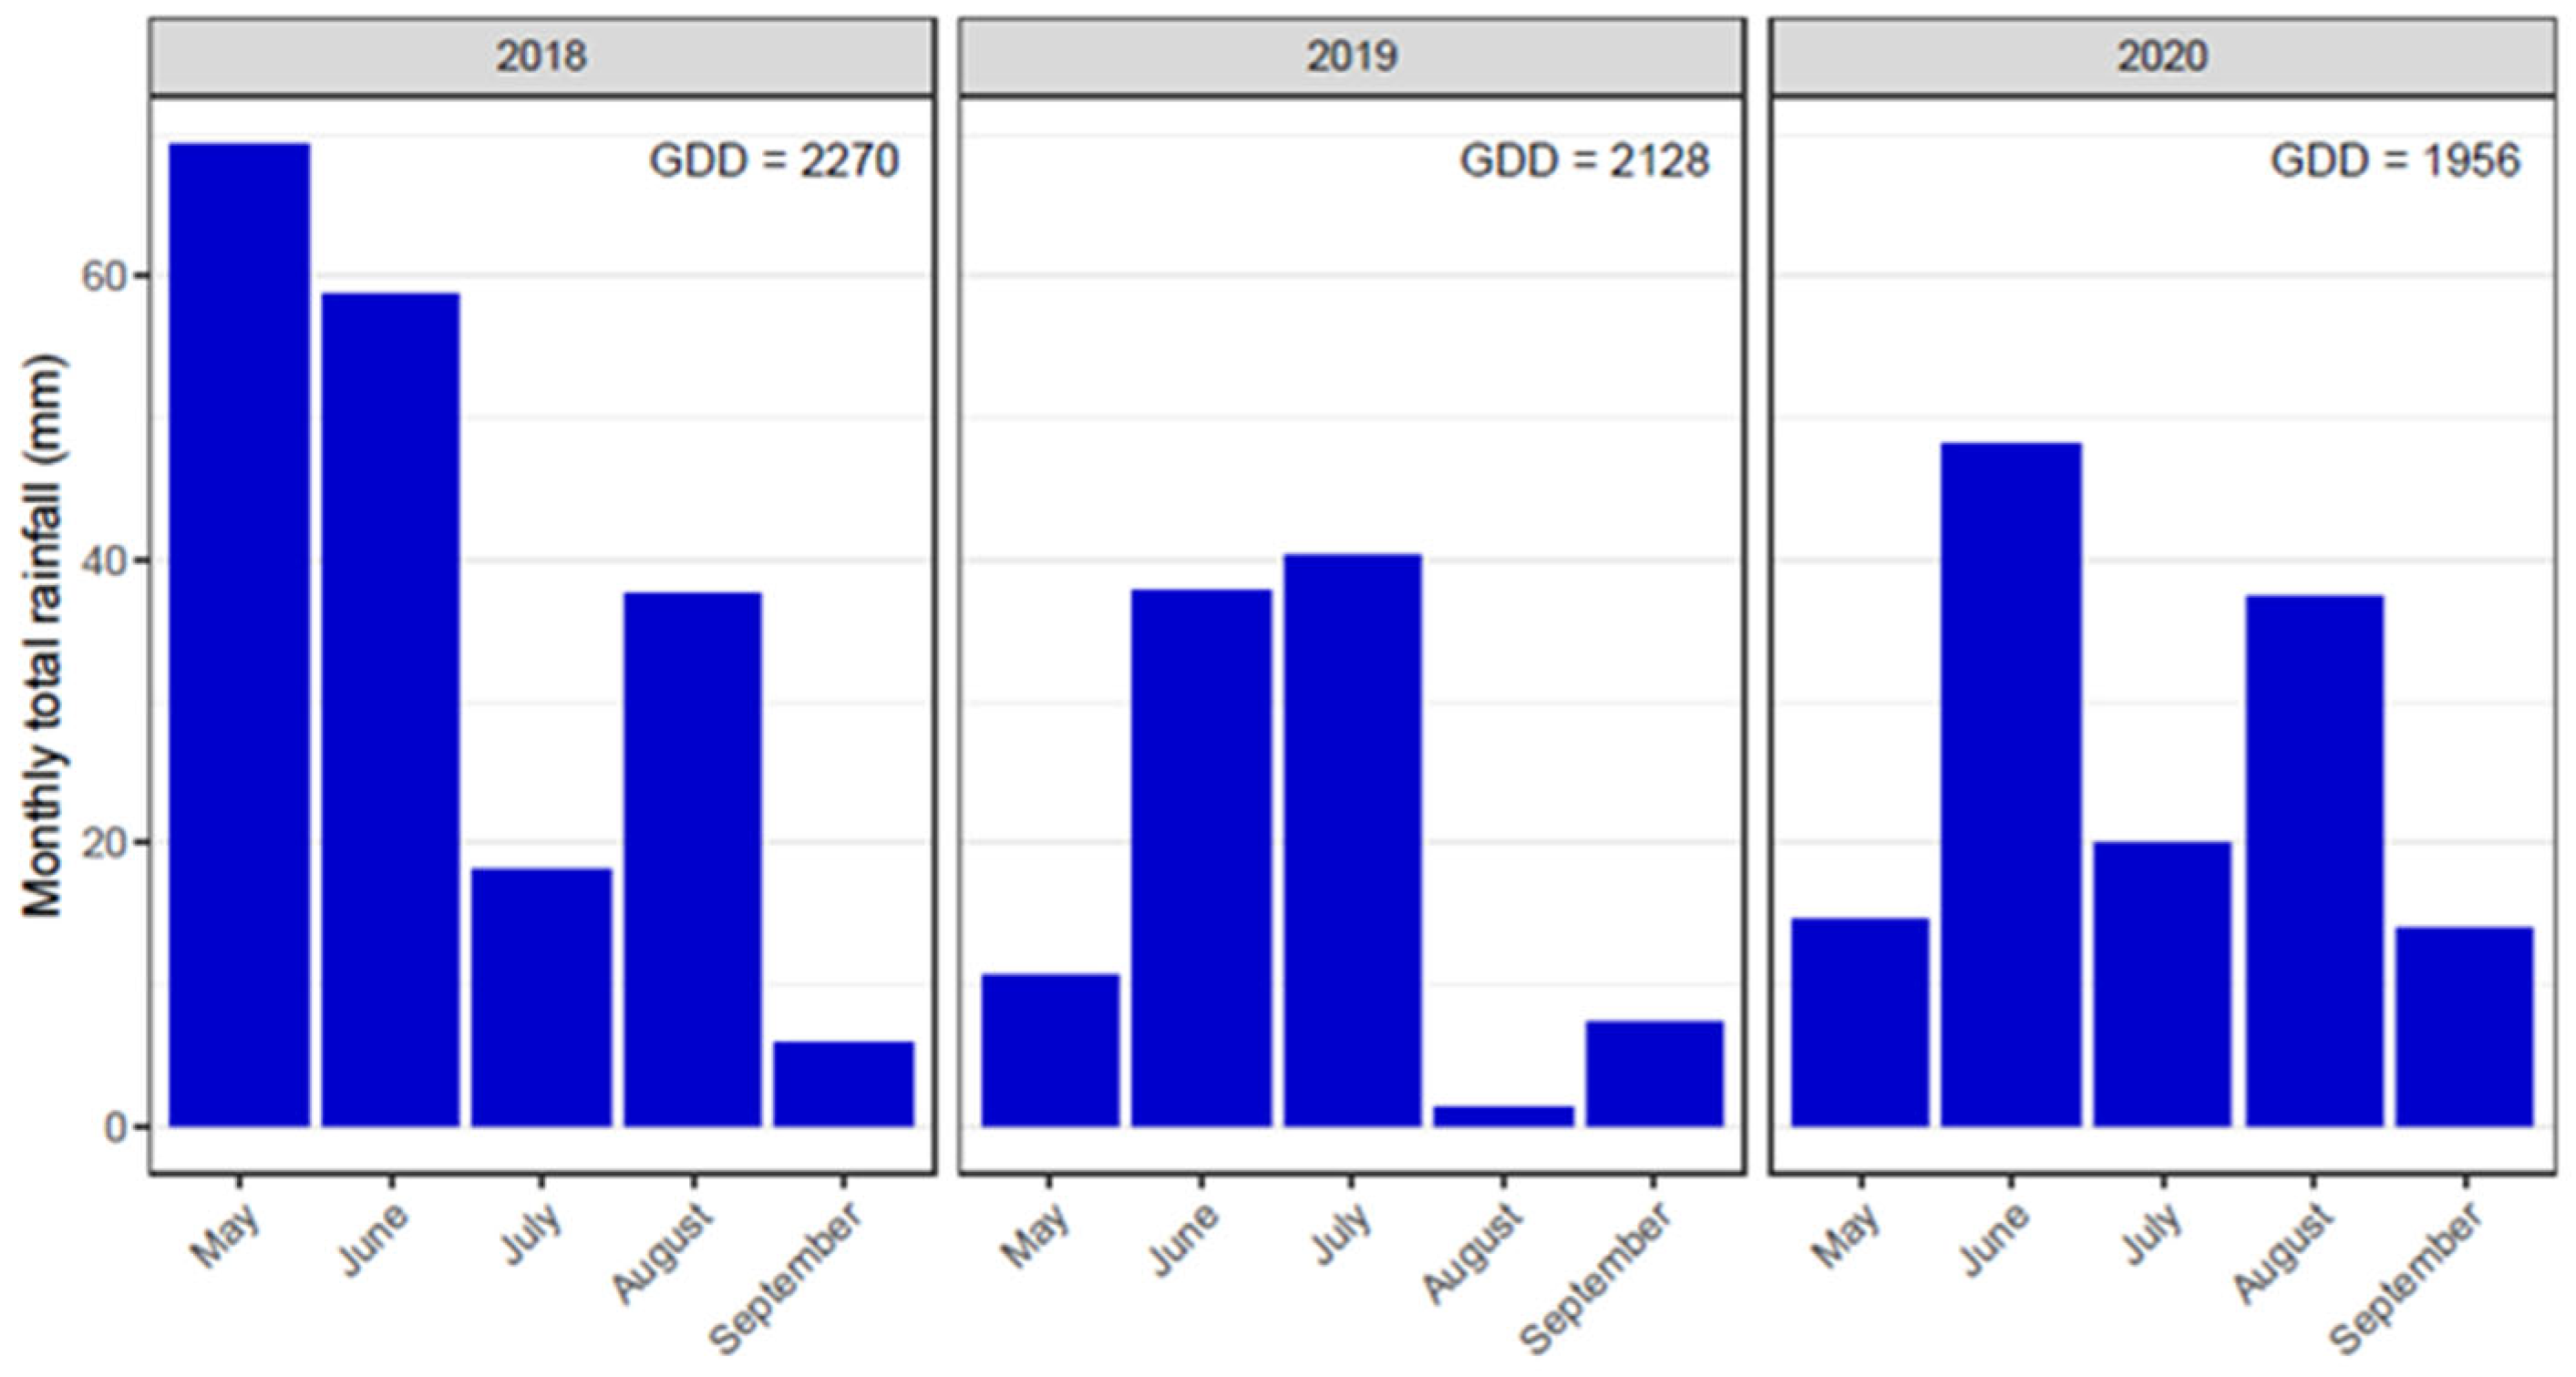
Figure 1. Total monthly rainfall (May–September) and Growing Degree Days (GDDs) of 2018–2020 cotton growing seasons.
Sustainability 16 00347 g001
Figure 2. Monthly minimum and maximum temperatures in 2018, 2019, and 2020 in Thermi, Thessaloniki.
Sustainability 16 00347 g002
Figure 3. Effect of cultivar and irrigation on seed cotton yield(kg/ha). The points are the raw data, the green is the boxplot of the dataset, the pink dot is the average yield, and the pink error bars represent (estimated marginal) means ± 95% confidence interval per group. Means followed by the same letter do not differ statistically according to post hoc Bonferroni test at 5% probability.
Sustainability 16 00347 g003
Figure 4. Seed cotton yield (kg/ha) as affected by (a) cultivar, (b) irrigation, (c) year, and (d) fertilization. The points are the raw data, the green is the boxplot of the dataset, the pink dot is the average yield, and the pink error bars represent (estimated marginal) means ± 95% confidence interval per group. Means followed by the same letter do not differ statistically according to post hoc Bonferroni test at 5% probability.
Sustainability 16 00347 g004
Figure 5. Fiber content (%) as affected by (a) cultivar, (b) irrigation, (c) year, and (d) fertilization. The points are the raw data, the green is the boxplot of the dataset, the pink dot is the average yield, and the pink error bars represent (estimated marginal) means ± 95% confidence interval per group. Means followed by the same letter do not differ statistically according to post hoc Bonferroni test at 5% probability.
Sustainability 16 00347 g005
Figure 6. Upper fiber length (mm) as affected by (a) cultivar, (b) irrigation, (c) year, and (d) fertilization. The points are the raw data, the green is the boxplot of the dataset, the pink dot is the average yield, and the pink error bars represent (estimated marginal) means ± 95% confidence interval per group. Means followed by the same letter do not differ statistically according to post hoc Bonferroni test at 5% probability.
Sustainability 16 00347 g006
Figure 7. Fiber length uniformity (%) as affected by (a) cultivar, (b) irrigation, (c) year, and (d) fertilization. The points are the raw data, the green is the boxplot of the dataset, the pink dot is the average yield, and the pink error bars represent (estimated marginal) means ± 95% confidence interval per group. Means followed by the same letter do not differ statistically according to post hoc Bonferroni test at 5% probability.
Sustainability 16 00347 g007
Figure 8. Micronaire as affected by (a) cultivar, (b) irrigation, (c) year, and (d) fertilization. The points are the raw data, the green is the boxplot of the dataset, the pink dot is the average yield, and the pink error bars represent (estimated marginal) means ± 95% confidence interval per group. Means followed by the same letter do not differ statistically according to post hoc Bonferroni test at 5% probability.
Sustainability 16 00347 g008
Figure 9. Elongation (%) as affected by (a) cultivar, (b) irrigation, (c) year, and (d) fertilization. The points are the raw data, the green is the boxplot of the dataset, the pink dot is the average yield, and the pink error bars represent (estimated marginal) means ± 95% confidence interval per group. Means followed by the same letter do not differ statistically according to post hoc Bonferroni test at 5% probability.
Sustainability 16 00347 g009
Figure 10. Strength (g/tex) as affected by (a) cultivar, (b) irrigation, (c) year, and (d) fertilization. The points are the raw data, the green is the boxplot of the dataset, the pink dot is the average yield, and the pink error bars represent (estimated marginal) means ± 95% confidence interval per group. Means followed by the same letter do not differ statistically according to post hoc Bonferroni test at 5% probability.
Sustainability 16 00347 g010
Figure 11. Reflectance (Rd) as affected by (a) cultivar, (b) irrigation, (c) year, and (d) fertilization. The points are the raw data, the green is the boxplot of the dataset, the pink dot is the average yield, and the pink error bars represent (estimated marginal) means ± 95% confidence interval per group. Means followed by the same letter do not differ statistically according to post hoc Bonferroni test at 5% probability.
Sustainability 16 00347 g011
Figure 12. Value “b” as affected by (a) cultivar, (b) irrigation, (c) year, and (d) fertilization. The points are the raw data, the green is the boxplot of the dataset, the pink dot is the average yield, and the pink error bars represent (estimated marginal) means ± 95% confidence interval per group. Means followed by the same letter do not differ statistically according to post hoc Bonferroni test at 5% probability.
Sustainability 16 00347 g012
Table 1. Soil parameters of experimental fields in Thermi, Greece from 2018 to 2020.
Soil Parameter201820192020
Sand (%)47.248.044.0
Silt (%)33.636.038.0
Clay (%)19.216.018.00
pH7.77.87.6
Organic matter (%)0.401.600.58
EC (ms cm−1)0.280.560.56
ΝO3-Ν (mg Kg−1)4.213.512.2
P (mg Kg−1)2.813.43.1
K (mg Kg−1)71607134
Table 2. Type and quantity of fertilizers applied at normal and low fertilization levels during the experimental years 2018 to 2020.
Before Planting (kg ha−1)At Squaring Stage (kg ha−1)
Year/Fertilizer12-52-021-0-00-0-3033.5-0-0
Normal fertilization
2018200300350120
20192002000250
2020200300350120
Low fertilization
201810015017560
20191001000125
202010015017560
Table 3. F values of the analysis of variance of fiber quality parameters and seed cotton yield.
ParameterFertilizationIrrigationCultivarYearFertilization: IrrigationFertilization: CultivarIrrigation: CultivarFertilization: Irrigation: Cultivar
Fiber (%)0.31 ns15.76 ***54.36 ***38.89 ***1.33 ns0.88 ns0.47 ns0.29 ns
Seed cotton yield (kg ha−1)1.41 ns12.19 ***14.58 ***5.27 *0.78 ns0.18 ns1.98 *0.64 ns
Micronaire0.67 ns2.5 ns9.6 ***27.9 ***2.52 ns1 ns1.86 ns0.58 ns
Length (mm)0.09 ns36.39 ***5.35 **3.93 ns0.07 ns0.12 ns0.53 ns0.41 ns
Length uniformity2.92 ns12.61 ***3.34 *1.84 ns0.44 ns0.9 ns0.47 ns0.74 ns
Elongation4.94 ns2.48 ns89.59 ***226.71 ***2.42 ns3.63 *0.41 ns1.56 ns
Strength (g tex−1)0.39 ns2.96 *53.37 ***27.72 ***2.22 ns0.37 ns0.71 ns1.53 ns
Rd0.11 ns3.34 *58.6 ***39.05 ***1.46 ns0.96 ns0.8 ns0.09 ns
b1.7 ns13.77 ***24.06 ***20.04 **1.92 ns0.1 ns0.79 ns0.55 ns
ns, not significant; *, significant at p < 0.05; **, significant at p < 0.01; ***, significant at p < 0.001.
Disclaimer/Publisher’s Note: The statements, opinions and data contained in all publications are solely those of the individual author(s) and contributor(s) and not of MDPI and/or the editor(s). MDPI and/or the editor(s) disclaim responsibility for any injury to people or property resulting from any ideas, methods, instructions or products referred to in the content.