Article

Comparative Study of Deep Neural Networks for Landslide Susceptibility Assessment: A Case Study of Pyeongchang-gun, South Korea

1
Team of Ecological and Natural Map, National Institute of Ecology, Seocheon 33657, Republic of Korea
2
Center for Environmental Assessment Monitoring, Environmental Assessment Group, Korea Environment Institute (KEI), Sejong 30147, Republic of Korea
*
Author to whom correspondence should be addressed.
Sustainability 2024, 16(1), 245; https://doi.org/10.3390/su16010245
Submission received: 18 November 2023 / Revised: 21 December 2023 / Accepted: 21 December 2023 / Published: 27 December 2023

Abstract

:
With an increase in local precipitation caused by extreme climatic phenomena, the frequency of landslides and associated damage has also increased. Therefore, compiling fine-scale landslide susceptibility assessment maps based on data from landslide-affected areas is essential. Deep neural network (DNN) and kernel-based DNN(DNNK) models were used to prepare landslide susceptibility maps of the mountainous Pyeongchang-gun region (South Korea) within a geographic information system framework. To map landslide susceptibility, datasets of landslide occurrence areas, topography, land use, forest, and soil were collected and entered into spatial databases, and 18 factors were then selected from the databases and used as model inputs. The training and test datasets consisted of 1600 and 400 landslide locations, respectively. The test accuracies of the DNN and DNNK models were 98.19% and 97.53% and 94.11% and 92.22% for the area under the receiver operating characteristic curve and the average precision value of the precision-recall curve, respectively. The location of future landslides can now be quickly and efficiently predicted using remote sensing data at a lower cost and with less labor. The landslide susceptibility maps produced in this study can play a role in sustainability and serve as references for establishing policies for landslide prevention and mitigation.

1. Introduction

Landslides frequently occur worldwide and cause significant damage to human lives and properties [1]. As with other natural disasters, the occurrence of landslides has been unpredictable in recent years due to extreme precipitation events induced by abnormal weather conditions attributed to global warming. In Korea, large-scale landslides have historically occurred frequently because of the country’s geographic characteristics [2]. Approximately 70% of the total land area in Korea is mountainous terrain, and such areas now often experience localized heavy rainfall caused by uncertain climatic characteristics [3]. In summer, when heavy rain and typhoons occur together, large-scale landslides can occur in almost all regions of Korea [4].
It is extremely important to assess the possibility of landslide occurrences and their causative factors [5]. Generally, landslides occur as a result of the interaction between weather, topography, geology, soil, and geophysical factors, and it is expensive and time consuming to collect data pertaining to landslide areas that exist over a wide range [6]. In addition, as landslides are caused by complex interactions of several factors, objective statistical analysis techniques are required to analyze the extensive field data obtained [7].
Several studies have been conducted in recent years to assess landslide risks in mountainous areas and reduce their negative impacts [8], and many studies on landslides have been conducted using the geographic information system (GIS) framework [9]. Recent analyses of landslide susceptibility have tended to utilize machine learning algorithms in conjunction with stochastic and statistical models [10], and various machine learning models, such as support vector machine (SVM), Gaussian naïve Bayes (GNB), Bernoulli Naïve Bayes (BNB), and decision tree (DT), have been applied. In a case study conducted in Isfahan province, Iran, GNB SVM, and BNB demonstrated accuracies of 80.1%, 81.5%, and 50%, respectively, but the deep neural network (DNN)-based model demonstrated an accuracy exceeding 90% with respect to determining landslide susceptibility [9]. In a study in China, the DNN algorithm showed an accuracy of 87.30%, which was superior to that of LSTM, CNN, and RNN of 86.50%, 85.60%, and 82.90% [11]. Additionally, meta-based models (such as AdaBoost) and deep-learning models based on neural networks have been widely used for landslide risk mapping [12].
With the development of various algorithms, meaningful results have been derived from data gathered in the field; however, most of these algorithms determine the risk of landslides based on the values assigned to each pixel [11]. Although the occurrence of a landslide appears to relate to a singular point, it is critical to understand the interaction between the elements within a certain radius of the occurrence of the landslide, and the data of such information require analysis [13]. Therefore, the use of a kernel-based algorithm and a pixel-based DNN can facilitate the extraction of spatial characteristics and their application during training. As such, kernel-based modeling that reflects spatial characteristics based on the kernel was also performed in this study.
Therefore, landslide susceptibility mapping using DNN algorithms that utilize kernel-based learning to consider landslide occurrence points and the spatial distribution of landslide-related factors in their vicinity was designed and conducted in this study [14]. To map the landslide susceptibility of the Pyeongchang-gun region in South Korea, related factors were derived using the frequency ratio (FR) within a GIS environment, and DNN and kernel-based DNN (DNNK) algorithms were applied to 18 factors. Receiver operating characteristic (ROC) and precision-recall (PR) curves were used to evaluate the accuracy of each model. Test data (20% of the total data) were used to determine the accuracy of each model. These results can serve as the foundation for developing sustainable systems to monitor and manage the disasters associated with landslides.

2. Study Area and Data

2.1. Study Area

Pyeongchang-gun is located in the highlands of Gangwon Province to the east of Seoul, South Korea. Approximately 65% of Pyeongchang-gun is located in highlands at an elevation of 700 m above sea level, and the region is predominantly covered with forests consisting of a variety of tall plants [15]. The average annual rainfall is 1082 mm (on http://www.kma.go.kr/ (accessed on 11 November 2023), and most of the rainfall occurs from June to August.
Granitic rocks dominate the geology of Pyeongchang-gun, and this is common in the mountainous regions of South Korea. Considering that landslides often occur in the Pyeongchang-gun area as a result of high altitudes and steep slopes, the prediction of landslide susceptibility based on the factors that cause landslides is important to understand the probability of potential disasters occurring [16]. This study focused on the areas of Jinbu-myeon, Pyeongchang-gun, and Gangwon-do, which are located at 37°16′ N and 128°14′ E, as shown in Figure 1.

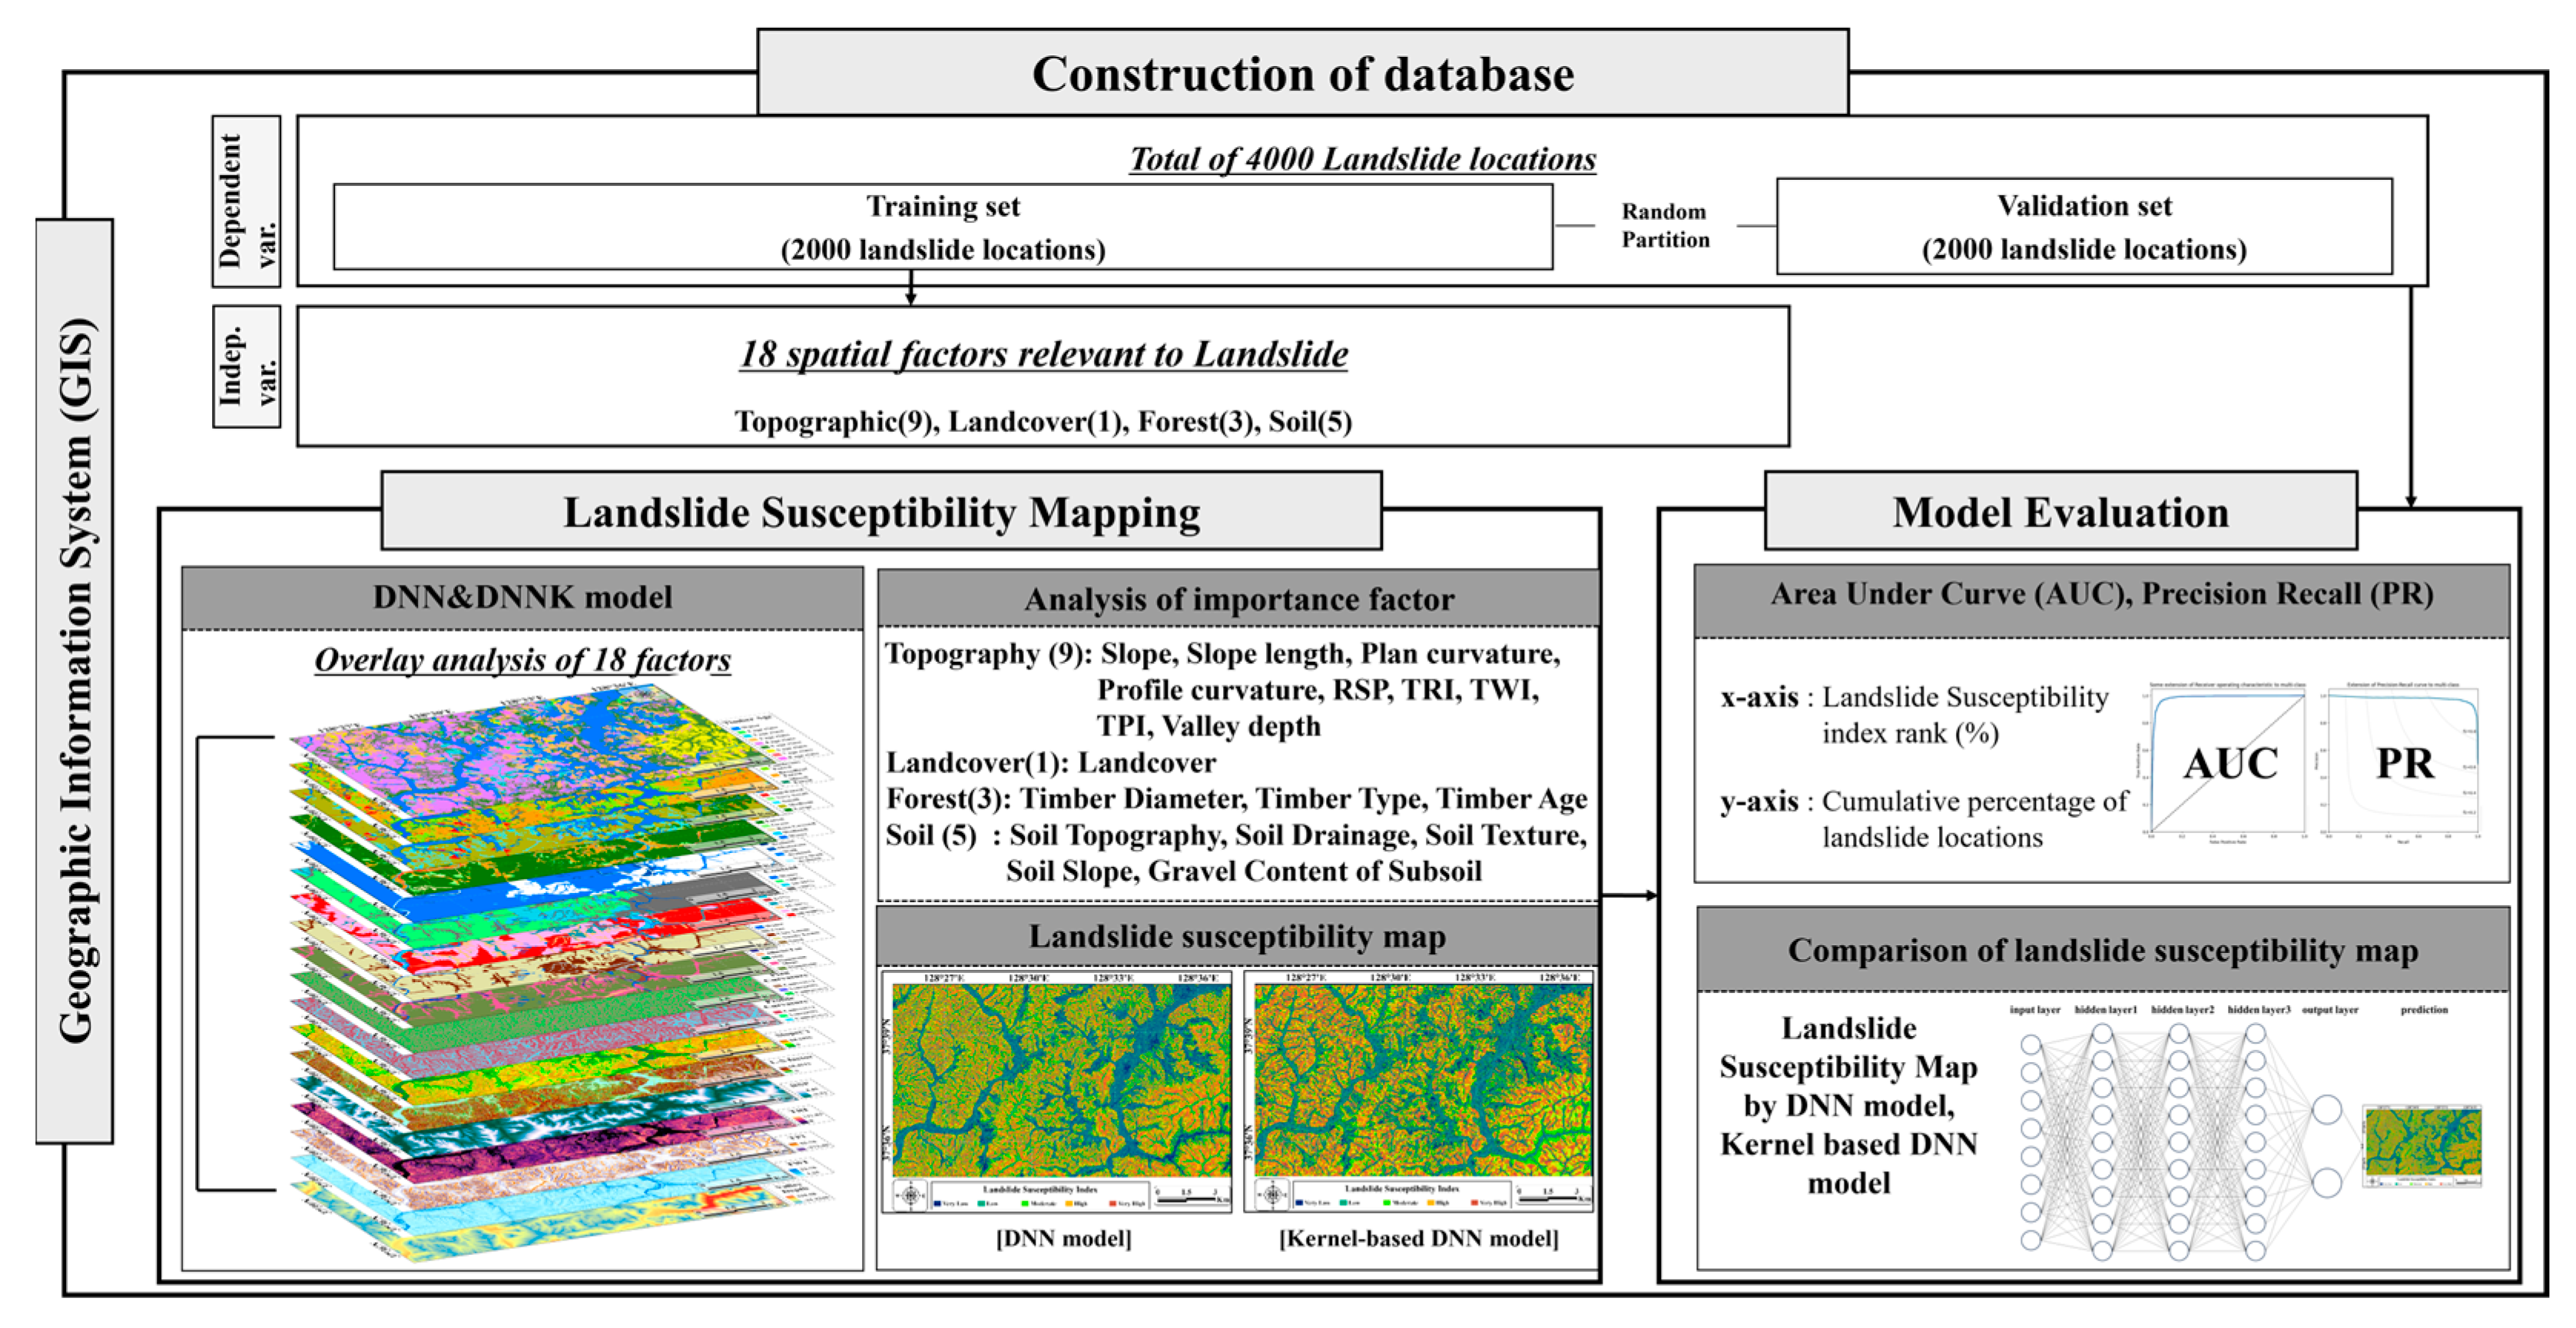
2.2. Selection of Factors Related to Landslides

In the first step, probable landslide occurrence locations were identified. To determine the precise landslide locations (Figure 2), high-resolution aerial photographs (10-cm resolution) were obtained using a map service (maps.daum.net) (accessed on 11 November 2023). An Ultra Cam-X sensor (Microsoft, Graz, Austria) was used to capture the trails of 2099 landslides that occurred in May 2008, and the results were confirmed using photographs taken after the incident (Figure 3). Several shallow soil slides and debris flows were observed in the study area (widths and lengths of <10 m and approximately 30 m, respectively). A total of 2000 locations were identified to conduct a comparative analysis of landslides, which were then classified into training and test datasets at a ratio of 8:2.
Numerous complex factors contribute to landslide occurrence. Therefore, selecting factors that are most closely related to the probability of landslide occurrence is an essential step in developing a landslide susceptibility map. Many components contribute to the stability of landslides, including geological structure, vegetation cover, lithology, seismic activity, geomorphological features, slope, climate, land use, and human activity [17]. As shown in Table 1, 18 factors related to landslide susceptibility were identified based on a literature review, and these were categorized into four types: topography, forest, soil, and landcover types [18]. Geological factors were excluded from the modeling because the geology at landslide locations in the study area was almost homogeneous [19]. The 18 factors considered for the analysis of landslide susceptibility were as follows.
Using the National Geographic Information Institute’s (1:1000 scale) digital elevation model (DEM; http://www.ngii.go.kr (accessed on 5 November 2023) as a reference, topography-related factors were converted into raster data with a spatial resolution of 10 m. Nine topographical factors were considered: plan curvature, profile curvature, slope, slope length (LS), valley depth, relative height and slope position (RSP), terrain ruggedness index (TRI), topographic position index (TPI), and terrain wetness index (TWI). Slopes are formed by the erosion and deposition of topographic surfaces, and they play an important role in determining the movement of landslide debris. In addition, water flow has a decisive influence on the occurrence of landslides in most cases [20]. It was therefore determined that, among the landslide-causing factors, topographical factors had the greatest influence on landslide occurrence, and these were used as input data to determine the relationship between landslides and these factors [21].
The slope was defined as the angle formed by the vertical height and distance, and the curvature values of the topographic surfaces were calculated using the geospatial toolset in ArcGIS Pro 3.0 version. The plan and profile curvature factors represented the morphological characteristics of the study area [22]. The value of a surface that was concave upward was positive, and that of a surface that was concave downward was negative. Two secondary geomorphological parameters, TWI, and TRI, can be used to describe and quantify the relief of a given region [23]. Valley depth can also provide information about the drainage flow in an area, which is helpful for identifying potential landslides (Figure 4). Two factors affect topographical stability: RSP and TPI [24]. These two factors were used to calculate the relative terrain location, such as the hilltop, valley bottom, exposed bridge, flat plain, and upper or lower slope. In this respect, a positive value was obtained with an increase in the difference in the relative position [25], and a value representing a high slope or valley indicated a topographically unstable state. Topographical instability can cause landslides when a significant amount of rainfall, and it was thus used as input data in this study.
Various forest factors (such as wood type, density, age, and diameter) must also be considered when evaluating landslide susceptibility [26]. In this study, three forest-related factors were considered (age, diameter, and type of forest compiled by the Korea Forest Service) (Figure 5). Forest density is associated with the density of the root systems that support the soil and provide stability, and landslides are more likely to occur in non-forested areas. It is also possible that areas with immature root systems are unable to withstand runoff from the soil surface, resulting in soil erosion [27].
Furthermore, the soil characteristics of the study area (including soil drainage, bedrock type, texture, slope, and topography) were considered (Figure 5). Data on the spatial distribution of the soil factors were obtained from the Korea Institute of Agricultural Sciences (http://www.rda.go.kr) (accessed on 11 November 2023). Soil permeability and porosity are related to the soil material, and they therefore influence the fluid flow rate. Soil thickness affects the ability of the soil to absorb water, and it influences the quantity of runoff [27,28]. When assessing land cover conditions (including runoff and infiltration rates) that are directly or indirectly associated with the occurrence of landslides, it is also necessary to assess runoff and transportation conditions. This study utilized a land-cover map published by the Korean Ministry of Environment at a scale of 1:5000 (http://eng.me.go.kr/) (accessed on 11 November 2023).

3. Methodology

Landslide occurrence is influenced by a variety of related factors; therefore, each factor needs to be simplified when used as input data for the modeling process. The location of a landslide and its neighboring area have a significant effect on natural phenomena; therefore, it is necessary to analyze the landslide using a model that considers the spatial relationship of the input data. In this study, landslide susceptibility was analyzed using kernel-based deep learning models that consider the spatial values in the vicinity of landslides. Based on the training data, 18 landslide-related factors were identified and organized in a spatial database, and a map of landslide susceptibility was created using the DNN and DNNK models based on the kernels (Figure 6).
Data on areas with landslide occurrences were obtained from the Korea Institute of Geoscience and Mineral Resources, and areas without landslide occurrences were determined using the FR method. After classifying the input data at equal intervals, the ratio of the number of pixels occupied by each section to the total number of pixels was calculated [29]. It was then possible to obtain the ratio of the number of pixels in each section where landslides occurred and divide both values to obtain the FR of each section. By extracting a section with a similar low FR value, a pixel without landslide occurrence was identified.
Several additional restrictions were then set for the terrain extracted in an area without landslide occurrence. Landslides generally occur in steep terrain; therefore, ArcMap 10.8 (ESRI, The Redlands, CA, USA) was used to determine whether landslides occur in areas where the slope is <3°. The considered landcover types were urban, agricultural, wetland, and rivers. Assuming that landslides do not necessarily occur, a total of 2000 points were randomly selected from the selected regions.
Additionally, data augmentation techniques were employed to enhance the training process. Datasets were augmented in various ways to scale the real learning datasets. Data augmentation not only increases the quantity of data but also helps the model to work well without overfitting. In this study, the data were augmented by adding noise, image rotation, flipping, and shifting. Noise injection usually consists of injecting a random-value matrix extracted from a Gaussian distribution. It is one of the major data augmentation techniques tested by Moreno-Barea [30]. Adding noise to a kernel or pixel can help DNN learn more powerful features [31]. The flipping was performed by applying flipping based on the horizontal and vertical axes to enhance the data. Rotation enhancement was performed by rotating the image right on an axis between 180° and 270°. This data enhancement was useful for increasing the accuracy of the prediction results, and this was proven in the case of ImageNet [32].

3.1. Deep Neural Network (DNN)

As a machine learning algorithm based on the principles and structure of human neural networks, the DNN algorithm is widely used across a wide range of fields, including prediction and classification [27,33]. In recent years, deep learning has evolved, and models contain multiple hidden layers between the input and output layers and complex artificial neural networks. The structure of the model used in this study is described in the following sub-sections.

3.1.1. Pixel-Based Deep Neural Network (DNN)

The DNN model uses pixel data as the input. It is the most commonly used model, and it provides fast calculations, is simple to use, and considers only a few parameters. This study used a pixel-based DNN model with five hidden layers, with a total of 1000, 500, 150, 50, and 10 hidden nodes in each layer, respectively. A rectified linear unit (ReLU) function was used as the activation function. A stochastic gradient descent (SGD) optimizer was used, and the batch size, learning rate, and epoch were set to 128, 0.01, and 300, respectively [34].

3.1.2. Kernel-Based Deep Neural Network (DNNK)

The second DNN model involved converting each input pixel into a kernel and using it as input data. A kernel-based model has the advantage of incorporating peripheral values into predictions, which would otherwise be lost in pixel-based data [27].
The kernel used a 9 × 9 m window with five hidden layers comprising a total of 1000, 500, 150, 50, and 10 hidden nodes in each, respectively. The ReLU function was used as an activation function. An SGD optimizer was employed, and the batch size, learning rate, and number of epochs were set to 128, 0.01, and 300, respectively.

3.2. Model Evaluation

The value of landslide susceptibility derived from a deep learning model is an estimate, and therefore requires evaluation. The area under the curve (AUC) of the ROC and the average precision (AP) values of the PR curve were used as quantitative indicators to assess the accuracy of the predicted landslide susceptibility by the employed DNN and DNNK models.
According to the ROC curve, the landslide susceptibility results were not used as is but were reclassified based on the relative ranking. The relative ratio can be determined by calculating the number of landslide occurrence locations cumulatively included in each range [35]. It is possible to view the entire study area through the use of the relative ratio and compare the results with those calculated using other models. For this purpose, the AUC was calculated based on the test data (20%), which were not used for model training.
The quantitative performance of the model was evaluated using the AP value, which represents the area under the PR curve. This graph shows how the precision and recall of the model changed as the thresholds changed, and the higher the AP value, the better the prediction performance of the model [27,36].

4. Results

The landslide susceptibility map displayed in Figure 7 shows the results obtained using the model in this study. One landslide susceptibility map (Figure 7a) was generated using the DNN model, and another landslide susceptibility map (Figure 7b) was predicted using the DNNK model. All the pixels in these maps represent values between 0 and 1, with the exception of water areas, such as rivers. Landslides are more susceptible when the value is closer to 1 and less susceptible when the value is closer to 0. In terms of risk classes, the proportion of areas at very high, high, moderate, low, and very low risk covered 10%, 10%, 20%, 20%, and 40%, respectively, according to the results of the landslide susceptibility map. Both models produced similar results in terms of spatial distribution, which was confirmed using a ground truth map.
According to the DNN model, landslide susceptibility was classified as very high, high, moderate, low, and very low, with susceptibility value ranges of 0.981–1.0, 0.895–0.98, 0.46–0.894, 0.017–0.459, and 0–0.016, respectively. According to the DNNK model, landslide susceptibility was classified as very high, high, moderate, low, and very low, with susceptibility value ranges of 0.993–1.0, 0.95–0.992, 0.523–0.949, 0.017–0.522, and 0–0.016, respectively. With the DNN and DNNK models, areas with susceptibility values > 0.95 accounted for 35.28% and 43.45% of the total area, respectively, and areas with susceptibility values of >0.99 accounted for 21.42% and 27.37%, respectively.
The proportion of areas with low susceptibility was significantly higher with the DNN model than with the DNNK model, and this was attributed to the influence from the water area. Landslides are less likely to occur in waterbodies, such as rivers and lakes, or valleys, and pixel-based DNN models do not competently predict water areas. In this respect, the susceptibility prediction of the kernel-based DNNK model was good in non-forested areas because the spatial information of adjacent pixels was considered.
ROC and AP values were used to evaluate the quantitative performance of the model. Using landslide-related variables and landslide occurrence areas, the training dataset was used to improve the predictive performance of landslide susceptibility. The predictive performance was evaluated using a test dataset containing 20% of data that had not been used for training. The ROC values of the DNN and DNNK models were 0.9819 and 0.9411, respectively. The prediction accuracy of both models was >94%, but that of the DNNK model was higher by 0.0408 (Figure 8a,c).
The precision-recall graph shows precision versus recall for different decision thresholds used in the DNN and DNNK models. The closer the graph is to the upper right, the higher the precision and recall [37]. The AP values of the DNN and DNNK models were 0.9753 and 0.9222, respectively, but DNNK exhibited a 5.31% higher AP value than that of the DNN (Figure 8b,d).
Compared with the DNNK model, the DNN model yielded higher quantitative results; however, according to the ROC results, both models predicted a 90% landslide occurrence in <10% of the area (Figure 8a,c). A combination of forest, soil, geological, and topographical factors acts together to produce a landslide. It is difficult to generalize landslide patterns as they occur in more than one direction, and each landslide area varies in shape and structure. For these reasons, a patch-based model was applied, and it exhibited good performance.

5. Discussion and Conclusions

Landslides are among the most common natural disasters occurring globally, resulting in numerous casualties and extreme economic losses annually. It is important to analyze and predict areas that are prone to landslides that are caused by changing temperatures and precipitation relating to climate change. The Gangwon-do region is significant in the context of sustainability due to its regional environment, which has many steep slopes. It is predominantly mountainous and susceptible to landslides; therefore, data of landslide information are available, and it was thus chosen as the research object here.
It is not possible to identify an individual factor responsible for landslide occurrence, as it is caused by a combination of several factors. It is important to reflect on the spatial characteristics of the surroundings because topographical elements play a significant role in causing landslides. Therefore, we evaluated landslide susceptibility in Pyeongchang-gun in Gangwon-do using a deep learning model that has been actively researched in recent years and has been proven to perform extremely well in kernel-based analyses.
In this study, we employed the pixel-based DNN model and the DNNK model (a kernel-based DNN model). Eighteen landslide-related factors were used as input data, and a spatial database with a grid size of 10 m × 10 m was constructed. A training dataset was used to train the model, and a test dataset was employed to evaluate and verify the models’ performance. Although pixel-based models are effective, they are limited by their inability to incorporate spatial features. The kernel used in this study was 9 m × 9 m so that the effects of landslide occurrence factors within a radius of about 10 m were considered. A performance evaluation of susceptibility prediction using ROC values suggested that the DNN model performed better than the DNNK model by 4.08%. The AP values showed that the DNN and DNNK models provided prediction performances of 97.53% and 92.22%, respectively, and that these values were similar to those of the ROC. In terms of accuracy, the results of the DNNK model were somewhat lower than those of the pixel-based DNN model; however, the areas with high vulnerability were better outlined. In future studies, we anticipate characterizing spatially extensive landslides according to kernel size differences.
Landslides can seriously impact communities and their resilience, but understanding landslide risk can help strengthen response and recovery strategies. It is crucial to develop policy alternatives to strengthen damage recovery capabilities, such as pre-established recovery plans. To support rapid recovery in the event of a disaster, smooth operational support is required, such as designating emergency transportation routes that reflect the characteristics of the disaster. In this context, it is vital to use various methods to evaluate resilience [38]. It is necessary to establish a system that links recovery and prevention before a disaster occurs and to strengthen resilience by linking roles between metropolitan and local governments. Social resilience and physical resilience have been evaluated on a sub-district scale [39], but it is necessary to institutionalize resilience assessment methods and establish landslide risk data that consider social aspects that can be universally applied. The landslide susceptibility maps presented in this study can serve as references for establishing policies that prevent landslides and mitigate their effects.
As demonstrated in this study, the location of potential landslide occurrences can be efficiently determined using remote sensing data (such as aerial photographs), which reduces the time, cost, and labor required when conducting field investigations. The DNN and DNNK models were used to produce landslide susceptibility maps of the study region, which can be employed in the prediction of future landslides. In future studies, we intend to apply an image Convolution Neural Network (CNN) to compare and analyze the prediction accuracy using pixel-based methodologies [40], and this method could be used to predict landslide risks in other areas.

Author Contributions

S.L.: Conceptualization, Methodology, Formal analysis, Supervision, Writing—original draft, Writing—review and editing. J.-C.K.: Methodology, Formal analysis, Software, Validation, Visualization, Writing—original draft. All authors have read and agreed to the published version of the manuscript.

Funding

This study was funded by the Korea Environment Institute (KEI) with support from project (2023-034(R)) of the Basic Science Research Program funded by the National Research Foundation of Korea (NRF-2018R1D1A1B07041203). This work was supported by the National Institute of Ecology (NIE) funded by the Ministry of Environment (NIE-Commissioned research-2023-27).

Institutional Review Board Statement

Not applicable.

Informed Consent Statement

Not applicable.

Data Availability Statement

Data supporting the findings of this study are available from the corresponding author upon request.

Conflicts of Interest

The authors declare no conflict of interest.

References

  1. Haque, U.; Da Silva, P.F.; Devoli, G.; Pilz, J.; Zhao, B.; Khaloua, A.; Wilopo, W.; Andersen, P.; Lu, P.; Lee, J.; et al. The human cost of global warming: Deadly landslides and their triggers (1995–2014). Sci. Total Environ. 2019, 682, 673. [Google Scholar] [CrossRef] [PubMed]
  2. Hakim, W.L.; Rezaie, F.; Nur, A.S.; Panahi, M.; Khosravi, K.; Lee, C.W.; Lee, S. Convolutional neural network (CNN) with metaheuristic optimization algorithms for landslide susceptibility mapping in Icheon, South Korea. J. Environ. Manag. 2022, 305, 114367. [Google Scholar] [CrossRef] [PubMed]
  3. Yoon, E.J.; Lee, D.K.; Kim, H.G.; Kim, H.R.; Jung, E.; Yoon, H. Multi-objective land-use allocation considering landslide risk under climate change: Case study in Pyeongchang-gun, Korea. Sustainability 2017, 9, 2306. [Google Scholar] [CrossRef]
  4. Suh, J.; Choi, Y.; Roh, T.-D.; Lee, H.-J.; Park, H.-D. National-scale assessment of landslide susceptibility to rank the vulnerability to failure of rock-cut slopes along expressways in Korea. Environ. Earth Sci. 2011, 63, 619–632. [Google Scholar] [CrossRef]
  5. Ado, M.; Amitab, K.; Maji, A.K.; Jasińska, E.; Gono, R.; Leonowicz, Z.; Jasiński, M. Landslide susceptibility mapping using machine learning: A literature survey. Remote Sens. 2022, 14, 3029. [Google Scholar] [CrossRef]
  6. Pourghasemi, H.R.; Gayen, A.; Park, S.; Lee, C.-W.; Lee, S. Assessment of landslide-prone areas and their zonation using logistic regression, logitboost, and naïvebayes machine-learning algorithms. Sustainability 2018, 10, 3697. [Google Scholar] [CrossRef]
  7. Saha, A.; Mandal, S.; Saha, S. Geo-spatial approach-based landslide susceptibility mapping using analytical hierarchical process, frequency ratio, logistic regression and their ensemble methods. SN Appl. Sci. 2020, 2, 1647. [Google Scholar] [CrossRef]
  8. Pham, B.; Shirzadi, A.; Shahabi, H.; Omidvar, E.; Singh, S.K.; Sahana, M.; Asl, D.; Ahmad, B.; Quoc, N.; Lee, S. Landslide susceptibility assessment by novel hybrid machine learning algorithms. Sustainability 2019, 11, 4386. [Google Scholar] [CrossRef]
  9. Azarafza, M.; Azarafza, M.; Akgün, H.; Atkinson, P.M.; Derakhshani, R. Deep learning-based landslide susceptibility mapping. Sci. Rep. 2021, 11, 24112. [Google Scholar] [CrossRef]
  10. Chang, Z.; Catani, F.; Huang, F.; Liu, G.; Meena, S.R.; Huang, J.; Zhou, C. Landslide susceptibility prediction using slope unit-based machine learning models considering the heterogeneity of conditioning factors. J. Rock Mech. Geotech. Eng. 2023, 15, 1127–1143. [Google Scholar] [CrossRef]
  11. Habumugisha, J.M.; Chen, N.; Rahman, M.; Islam, M.M.; Ahmad, H.; Elbeltagi, A.; Sharma, G.; Liza, S.N.; Dewan, A. Landslide susceptibility mapping with deep learning algorithms. Sustainability 2022, 14, 1734. [Google Scholar] [CrossRef]
  12. Rai, D.K.; Xiong, D.; Zhao, W.; Zhao, D.; Zhang, B.; Dahal, N.M.; Wu, Y.; Baig, M.A. An investigation of landslide susceptibility using logistic regression and statistical index methods in dailekh district, Nepal. Chin. Geogr. Sci. 2022, 32, 834. [Google Scholar] [CrossRef]
  13. Ni, W.; Zhao, L.; Zhang, L.; Xing, K.; Dou, J. Coupling progressive deep learning with the AdaBoost framework for landslide displacement rate prediction in the Baihetan dam reservoir, China. Remote Sens. 2023, 15, 2296. [Google Scholar] [CrossRef]
  14. Pradhan, B.; Dikshit, A.; Lee, S.; Kim, H. An explainable AI (XAI) model for landslide susceptibility modeling. Appl. Soft Comput. 2023, 142, 110324. [Google Scholar] [CrossRef]
  15. Han, J.-S.; Cheon, K.-S.; Kim, K.-A.; Yoo, K.-O. Distribution and characteristics of plant resources in MT. Heungjeong (Pyeongchang-gun, Gangwon-do). Korean J. Plant Resour. 2012, 25, 416–432. [Google Scholar] [CrossRef]
  16. Kim, J.-C.; Lee, S.; Jung, H.-S.; Lee, S. Landslide susceptibility mapping using random forest and boosted tree models in Pyeong-Chang, Korea. Geocarto Int. 2018, 33, 1000. [Google Scholar] [CrossRef]
  17. Jung, H.-S.; Lee, S.; Pradhan, B. Sustainable applications of remote sensing and geospatial information systems to earth observations. Sustainability 2020, 12, 2390. [Google Scholar] [CrossRef]
  18. Nguyen, P.T.; Tuyen, T.T.; Shirzadi, A.; Pham, B.T.; Shahabi, H.; Omidvar, E.; Amini, A.; Entezami, H.; Prakash, I.; Phong, T.V.; et al. Development of a novel hybrid intelligence approach for landslide spatial prediction. Appl. Sci. 2019, 9, 2824. [Google Scholar] [CrossRef]
  19. Ghorbanzadeh, O.; Blaschke, T.; Gholamnia, K.; Meena, S.R.; Tiede, D.; Aryal, J. Evaluation of different machine learning methods and deep-learning convolutional neural networks for landslide detection. Remote Sens. 2019, 11, 196. [Google Scholar] [CrossRef]
  20. Das, S.; Sarkar, S.; Kanungo, D.P. A critical review on landslide susceptibility zonation: Recent trends, techniques, and practices in Indian Himalaya. Nat. Hazards 2023, 115, 23. [Google Scholar] [CrossRef]
  21. Nguyen, V.-T.; Tran, T.H.; Ha, N.A.; Ngo, V.L.; Nadhir, A.-A.; Tran, V.P.; Duy Nguyen, H.; Ma, M.; Amini, A.; Prakash, I.; et al. GIS based novel hybrid computational intelligence models for mapping landslide susceptibility: A case study at da lat city, Vietnam. Sustainability 2019, 11, 7118. [Google Scholar] [CrossRef]
  22. Csillik, O.; Evans, I.S.; Drăguţ, L. Transformation (normalization) of slope gradient and surface curvatures, automated for statistical analyses from DEMs. Geomorphology 2015, 232, 65–77. [Google Scholar] [CrossRef]
  23. Liang, Z.; Chen, S.; Yang, Y.; Zhao, R.; Shi, Z.; Viscarra Rossel, R.A.V. National digital soil map of organic matter in topsoil and its associated uncertainty in 1980’s China. Geoderma 2019, 335, 47–56. [Google Scholar] [CrossRef]
  24. Rahmati, O.; Ghorbanzadeh, O.; Teimurian, T.; Mohammadi, F.; Tiefenbacher, J.P.; Falah, F.; Pirasteh, S.; Ngo, P.-T.T.; Bui, D.T. Spatial modeling of snow avalanche using machine learning models and geo-environmental factors: Comparison of effectiveness in two mountain regions. Remote Sens. 2019, 11, 2995. [Google Scholar] [CrossRef]
  25. Wang, Q.; Wang, D.; Huang, Y.; Wang, Z.; Zhang, L.; Guo, Q.; Chen, W.; Chen, W.; Sang, M. Landslide susceptibility mapping based on selected optimal combination of landslide predisposing factors in a large catchment. Sustainability 2015, 7, 16653. [Google Scholar] [CrossRef]
  26. Yeon, Y.-K.; Han, J.-G.; Ryu, K.H. Landslide susceptibility mapping in Injae, Korea, using a decision tree. Eng. Geol. 2010, 116, 274–283. [Google Scholar] [CrossRef]
  27. Kadavi, P.R.; Lee, C.-W.; Lee, S. Application of ensemble-based machine learning models to landslide susceptibility mapping. Remote Sens. 2018, 10, 1252. [Google Scholar] [CrossRef]
  28. Shahabi, H.; Hashim, M. Landslide susceptibility mapping using GIS-based statistical models and Remote sensing data in tropical environment. Sci. Rep. 2015, 5, 9899. [Google Scholar] [CrossRef]
  29. Li, L.; Lan, H.; Guo, C.; Zhang, Y.; Li, Q.; Wu, Y. A modified frequency ratio method for landslide susceptibility assessment. Landslides 2017, 14, 727–741. [Google Scholar] [CrossRef]
  30. Moreno-Barea, F.J.; Strazzera, F.; Jerez, J.M.; Urda, D.; Franco, L. Forward noise adjustment scheme for data augmentation. In Proceedings of the 2018 IEEE Symposium Series on Computational Intelligence (SSCI), Bangalore, India, 18–21 November 2018; pp. 728–734. [Google Scholar]
  31. Maharana, K.; Mondal, S.; Nemade, B. A review: Data pre-processing and data augmentation techniques. Glob. Transit. Proc. 2022, 3, 91–99. [Google Scholar] [CrossRef]
  32. Shorten, C.; Khoshgoftaar, T.M. A survey on image data augmentation for deep learning. J. Big Data 2019, 6, 1. [Google Scholar] [CrossRef]
  33. Du, S.S.; Zhai, X.; Poczos, B.; Singh, A. Gradient descent provably optimizes over-parameterized neural networks. arXiv 2018, arXiv:1810.02054. [Google Scholar]
  34. Choi, D.; Shallue, C.J.; Nado, Z.; Lee, J.; Maddison, C.J.; Dahl, G.E. On empirical comparisons of optimizers for deep learning. arXiv 2019, arXiv:1910.05446. [Google Scholar]
  35. Bowers, A.J.; Zhou, X. Receiver operating characteristic (ROC) area under the curve (AUC): A diagnostic measure for evaluating the accuracy of predictors of education outcomes. J. Educ. Stud. Placed Risk 2019, 24, 20–46. [Google Scholar] [CrossRef]
  36. Davis, J.; Goadrich, M. The relationship between Precision-Recall and ROC curves. In Proceedings of the 23rd International Conference on Machine Learning, Pittsburgh, PA, USA, 25–29 June 2006; pp. 233–240. [Google Scholar]
  37. Saito, T.; Rehmsmeier, M. The precision-recall plot is more informative than the ROC plot when evaluating binary classifiers on imbalanced datasets. PLoS ONE 2015, 10, e0118432. [Google Scholar] [CrossRef]
  38. Lin, Z.; Ji, Y.; Sun, X. Landslide displacement prediction based on CEEMDAN method and CNN–BiLSTM model. Sustainability 2023, 15, 10071. [Google Scholar] [CrossRef]
  39. Forcellini, D. In an expeditious framework for assessing the seismic resilience (SR) of structural configurations. Structures 2023, 56, 105015. [Google Scholar] [CrossRef]
  40. Zhang, X.; Song, J.; Peng, J.; Wu, J. Landslides-oriented urban disaster resilience assessment—A case study in ShenZhen, China. Sci. Total Environ. 2019, 661, 95–106. [Google Scholar] [CrossRef]
Figure 1. Map of the study area using an aerial image.
Sustainability 16 00245 g001
Figure 2. Distribution of areas susceptible and not susceptible to landslides in a geological map of the study area, Pyeongchang-gun.
Sustainability 16 00245 g002
Figure 3. (ad) is the examples of major landslides identified in Pyeongchang-gun 2008. (http://maps.daum.net) (accessed on 11 November 2023).
Sustainability 16 00245 g003
Figure 4. Topographical aspects that influence the occurrence of landslides: (a) plan curvature, (b) profile curvature, (c) slope, (d) slope length (LS), (e) valley depth, (f) relative height and slope position (RSP), (g) terrain ruggedness index (TRI), (h) topographic position index (TPI), and (i) terrain wetness index (TWI).
Sustainability 16 00245 g004
Figure 5. Factors influencing landscape susceptibility: (a) land use, (b) timber age, (c) timber diameter, (d) timber type, (e) soil drainage, (f) gravel content in subsoil, (g) soil slope, (h) soil texture, and (i) soil topography.
Sustainability 16 00245 g005
Figure 6. Structure of deep learning procedures composed of three phases: (1) data collection and preprocessing, (2) deep neural network training and prediction, and (3) model evaluation.
Sustainability 16 00245 g006
Figure 7. Landslide susceptibility maps produced using (a) DNN and (b) DNNK models.
Sustainability 16 00245 g007
Figure 8. (a) ROC and (b) PR curves of the DNN model. (c) ROC and (d) PR curves of the DNNK model.
Sustainability 16 00245 g008
Table 1. Data layer relating to a landslide within the study area.
Original DataFactorsData TypeScale
Aerial photographLandslide locationPoint1:1000
Topographical map a Plan curvatureGRID1:1000
Profile curvature
Slope
Slope length (LS)
Valley depth
Relative height and slope position (RSP)
Terrain roughness index (TRI)
Topographic position index (TPI)
Terrain wetness index (TWI)
Land use map bLand use
Forest map cTimber agePolygon1:5000
Timber diameter
Timber type
Soil map dSoil drainagePolygon1:25,000
Gravel content in subsoil
Soil slope
Soil texture
Soil topography
a Topographical factors from a digital topographic map created by the National Geographic Information Institute (http://www.ngii.go.kr) (accessed on 5 November 2023). b Land-use map compiled by the Korea Ministry of Environment (http://eng.me.go.kr/) (accessed on 11 November 2023). c Forest map compiled by the Korea Forest Service (https://map.forest.go.kr/forest/) (accessed on 11 November 2023). d Detailed soil map compiled by the Rural Development Administration (http://www.rda.go.kr) (accessed on 11 November 2023).
Disclaimer/Publisher’s Note: The statements, opinions and data contained in all publications are solely those of the individual author(s) and contributor(s) and not of MDPI and/or the editor(s). MDPI and/or the editor(s) disclaim responsibility for any injury to people or property resulting from any ideas, methods, instructions or products referred to in the content.

