Article

Pollution Assessment with Persistent Organic Pollutants in Upper Soil of a Series of Rural Roma Communities in Transylvania, Romania, Its Sources Apportionment, and the Associated Risk on Human Health

by
Vlad-Alexandru Pănescu
1,2,
Victor Bocoș-Bințințan
1,*,
Mihaela-Cătălina Herghelegiu
1,2,
Radu-Tudor Coman
3,
Vidar Berg
4,
Jan Ludvig Lyche
4 and
Mihail Simion Beldean-Galea
1,*
1
Faculty of Environmental Science and Engineering, Babeş-Bolyai University, 30 Fântânele Str., 400294 Cluj-Napoca, Romania
2
“Raluca Ripan” Institute for Research in Chemistry, Babeş-Bolyai University, 30 Fântânele Str., 400294 Cluj-Napoca, Romania
3
Faculty of Medicine, “Iuliu Hațieganu” University of Medicine and Pharmacy, 8 Babeș Str., 400012 Cluj-Napoca, Romania
4
Faculty of Veterinary Medicine, Norwegian University of Life Sciences, 1433 Ås, Norway
*
Authors to whom correspondence should be addressed.
Sustainability 2024, 16(1), 232; https://doi.org/10.3390/su16010232
Submission received: 15 November 2023 / Revised: 14 December 2023 / Accepted: 24 December 2023 / Published: 26 December 2023
(This article belongs to the Special Issue Monitoring, Risk Assessment and Early Warning of Farmland Pollution)

Abstract

:
This paper aims to assess the pollution by determining the sources of persistent organic pollutants (POPs) in 22 rural Roma communities in Transylvania in order to assess the human health risk associated with this exposure. For this, 16 polycyclic aromatic hydrocarbons (PAHs), 20 organochlorine pesticides (OCPs) and 12 polychlorinated biphenyls (PCBs) were determined in 22 soil samples collected from selected areas by gas chromatography coupled with mass spectrometry for PAHs and with electron capture detector for all halogenated compounds. Target compounds were isolated from soil by ultrasound-assisted extraction. We found that POP concentrations in soil ranged from 4.86 to 451.85 ng/g dw for PAHs, from 25.62 to 139.30 ng/g dw for OCPs, and from 0.22 to 49.12 ng/g dw for PCBs. The diagnostic ratios ƩLMWHMW, ANT/(ANT + PHE), and FLT/(FLT + PYR) strongly suggest a pyrogenic model of PAHs, such as biomass, coal, and petroleum combustion, while the isomer ratios ƩDDTHCH, α-HCH/γ-HCH and (DDE + DDD)/ƩDDT suggest that OCP residues originate from their ancient uses. Non-carcinogenic (HI) and carcinogenic (CR) risks of these organic compounds present in the soil through non-dietary pathways were in the very low-risk category (ranging from 10−8 to 10−4), indicating an absence of these risks from the investigated POPs in the studied area.

1. Introduction

Persistent organic pollutants (POPs) are halogenated chemical compounds considered to be among the most common soil contaminants, being specific especially to intensively industrialised areas and various processes related to human activities. With the increasing of different types of industries and human activities from the past century, a state of global concern has arisen regarding the situation of environmental pollution.
Most common and important POPs are organochlorine pesticides (OCPs), polychlorinated biphenyls (PCBs) and polycyclic aromatic hydrocarbons (PAHs), but other highly persistent toxic compounds like polychlorinated dibenzo-p-dioxins (PCDDs) [1] and polychlorinated dibenzofurans (PCDFs) [2] must be mentioned too.
POPs can be divided into two broad categories, namely the intentionally produced compounds on the one hand (the organochlorine pesticides OCPs and the industrial compounds like PCBs) and accidentally produced compounds—by-products that are generated mainly by incomplete combustions (PCDDs, PCDFs and polycyclic aromatic hydrocarbons PAHs), on the other hand [3]. All these compounds are considered semi-volatile and thus can be transported over very long distances from places where they were either produced or applied [4,5,6].
The origins of POPs may vary, depending very much on the nearby industries or anthropic activities (agriculture, heavy traffic, production of different engine oils, oil refining plants, paints production, etc.) [7,8]. Some POPs are still being used in medical treatments against certain biological vectors of infectious diseases, like lice and scabies [9].
POPs are hydrophobic chemicals; therefore, they accumulate in soils and can be retained there for tens of years or even longer. Some soils can receive their POP quantities directly from pesticide usage, sewage sludge, waste disposal, and intensive agriculture, as well as indirectly from the incomplete burning of waste, organic matter like gas, oil, coal, and wood [10,11].
Due to their lipophilic character, they tend to bioaccumulate and biomagnify very easily in both aquatic and terrestrial food chains, and consequently, food of animal origin represents a notable source of exposure [7,12]. Nonetheless, all soils receive significant amounts of POPs from atmospheric depositions.
Because of their high toxicity, POPs have been prohibited from being used since the beginning of the 1980s, and with the launch of the 2001 Stockholm Convention, twelve compounds from four classes of compounds were banned: nine of them being OCPs (aldrin, dieldrin, endrin, chlordane, DDT, heptachlor, hexachlorobenzene HCB, mirex, toxaphene), plus the three classes of PCBs, PCDDs and PCDFs. As of 2023, more than thirty compounds are on the list of hazardous compounds, having been permanently banned from ever being used [13].
Among these persistent pollutants, PAHs are probably the most common pollutants, being produced involuntarily through the combustion of various materials. There are more than 100 different PAHs, which always exist as complex mixtures and not as single compounds [11]. They consist of two or more aromatic fused rings; the most usual PAHs found in the environment consist of two to seven fused benzene rings [14].
In soils, there is a high chance that PAHs remain tightly attached to the solid particles, where they can reach underground water and contaminate it. In the atmosphere, by reactions with sunlight and various other chemicals from the air, PAHs are subject to degradation in a matter of days to weeks due to phenomena such as photolytic and oxidative processes [11].
Organochlorine pesticides (OCPs) are a category of synthetic bioaccumulative chlorinated hydrocarbons, which include in their molecule at least one chlorine atom connected covalently [7]. OCPs have been used for decades, especially in agriculture, to combat pests and vector-borne diseases. The best-known and used OCPs are dichlorodiphenyltrichloroethane (DDT), hexachlorocyclohexanes (HCHs) and chlorinated cyclodienes. Until their ban in 1985, OCPs such as DDTs and HCHs were used in large quantities in Romania, being considered basic elements of agriculture at that time [10].
Polychlorobiphenyls (PCBs) are organic compounds that were first synthesised in the late 1920s and have been long time used in industrial production such as plastics, paint, and several types of oil, as well as insulators for electric transformers and as heat transfer fluids. Like the OCPs, polychlorobiphenyls (PCBs) are also among the most persistent environmental pollutants, being in the list of compounds from the Stockholm Convention (2001) and can be found within all environmental samples—air, water, soil, sediments, and biota [15].
There are 209 PCBs divided into groups, most of which are listed using the number system from 1 to 209 or also named according to the number of isomers they have [16].
Due to the persistence and high mobility of POPs in the environment, numerous studies have aimed to evaluate surface soil contamination with POPs and the risk associated with exposure to these chemicals [7,10,12,15]. However, there is a lack of data on the incidence of these chemicals in soils used by rural Roma communities, which consequently makes it very difficult to assess the health risks in these vulnerable communities.
In this study, both the occurrence and sources apportionment of three classes of POPs (OCPs, PCBs, and PAHs) in upper soil collected from 22 from rural Roma communities in Transylvania, Romania were investigated.
The aim of the present study is to provide basic scientific data for a better understanding of the occurrence, sources, and associated health risks of selected POPs in agricultural soils used by rural Roma communities in Transylvania, Romania, in order to establish appropriate risk mitigation measures on health.

2. Materials and Methods

2.1. Chemicals and Reagents

Different POP standard mixtures were used for qualitative and quantitative analysis. The OCP mixture contains 22 compounds such as aldrin, dieldrin, endrin, α-HCH, γ-HCH, β-HCH, hexachlorobenzene HCB, quintozene, tecnazene, heptachlor, heptachlor epoxide, α-endosulfan, β-endosulfan, cis-chlordane, trans-chlordane, o,p′-DDT, p,p′-DDT, o,p′-DDE (o,p′-dichlorodiphenyldichloroethylene), p,p′-DDE, o,p′-DDD (o,p′-dichlorodiphenyldichloroethane), p,p′-DDD, methoxychlor (EPA Organochlorine Pesticide Mixture CLP) at a concentration of 2000 μg/mL each, in hexane:toluene (1:1 v/v). The PCB mixture contains 12 PCB congeners (PCB-18, -28, -31, -52, -44, -101, -114, -149, -153, -138, -180, -194) in a concentration of 10 μg/mL each in heptane. Both standard mixtures were purchased from Supelco (Merck Romania SRL, Bucharest, Romania). The PAH standard mixture contains 16 compounds: naphthalene (NAP), acenaphthylene (ACY), acenaphthene (ACE), fluorene (FL), phenanthrene (PHE), anthracene (ANT), fluoranthene (FLT), pyrene (PYR), benz[a]anthracene (BaA), chrysene (CHR), benzo[b]fluoranthene (BbF), benzo[k]fluoranthene (BkF), benzo[a]pyrene (BaP), dibenzo[a,h]anthracene (DahA), benzo[g,h,i]perylene (BghiP), and indeno[1,2,3-cd]pyrene (IND) at a concentration of 500 μg/mL each, in acetonitrile:toluene mixture (92:8 v/v), (CRM EPA Method 8310 PAH Mixture) and was purchased from Restek (Restek Corporation, Bellefonte, PA, USA).
Other chemicals and reagents, such as silica, alumina, granular anhydrous sodium sulphate, 99.5% purity copper, acetone, acetonitrile, dichloromethane, and hexane, were purchased from Sigma-Aldrich (St. Louis, MO, USA) and Merck, Darmstadt, Germany.

2.2. Instrumentation

All PAHs analyses were performed by gas chromatography coupled to mass spectrometry using a GC-MS model Focus GC equipped with a TriPlus autosampler and a DSQII mass spectrometer (Thermo Eletron Corporation, Waltham, MA, USA). The separation was carried out on a TR-5 MS capillary column (30 m × 0.25 mm × 0.25 μm) (ThermoFisher, Waltham, MA, USA) using the following temperature gradient: initial temperature of 60 °C and heating to 130 °C with 10 °C/min and then up to 300 °C with 3 °C/min. For the mass spectrometer, the temperature of the ionisation source, transfer line, and inlet were 200 °C, 300 °C, and 310 °C, respectively. Data acquisition was performed in selected ion monitoring (SIM) mode using the X-Calibur software (v3.0.63, Thermo Electron Corp.). The MS ionisation energy was 70 eV, and the volume of the injected sample in GC was 1 µL, in splitless mode. High-purity helium (99.999%) was used as carrier gas at a constant flow rate of 1.2 mL/min.
Analyses of OCPs and PCBs were performed using a Trace GC gas chromatograph equipped with a 63Ni electron capture detector (ECD) and a TriPlus autosampler (Thermo Electron Corporation). An HP-5MS capillary column (30 m × 0.25 mm × 1.0 μm stationary phase film thickness, Agilent, Santa Clara, CA, USA) was used for separation under the following temperature gradient: from 70 °C to 180 °C at 25 °C/min, from 180 °C to 200 °C with 1 °C/min, from 200 °C to 260 °C with 2 °C/min and from 260 °C to 300 °C with 5 °C/min and finally holding the column at 300 °C for 5 min. The inlet and detector temperatures were set at 270 °C and 300 °C, respectively. High-purity nitrogen (99.999%) was used as carrier gas at a flow rate of 2 mL/min. Chrom-Card software (v2, 14 May 2017) was used for data acquisition.

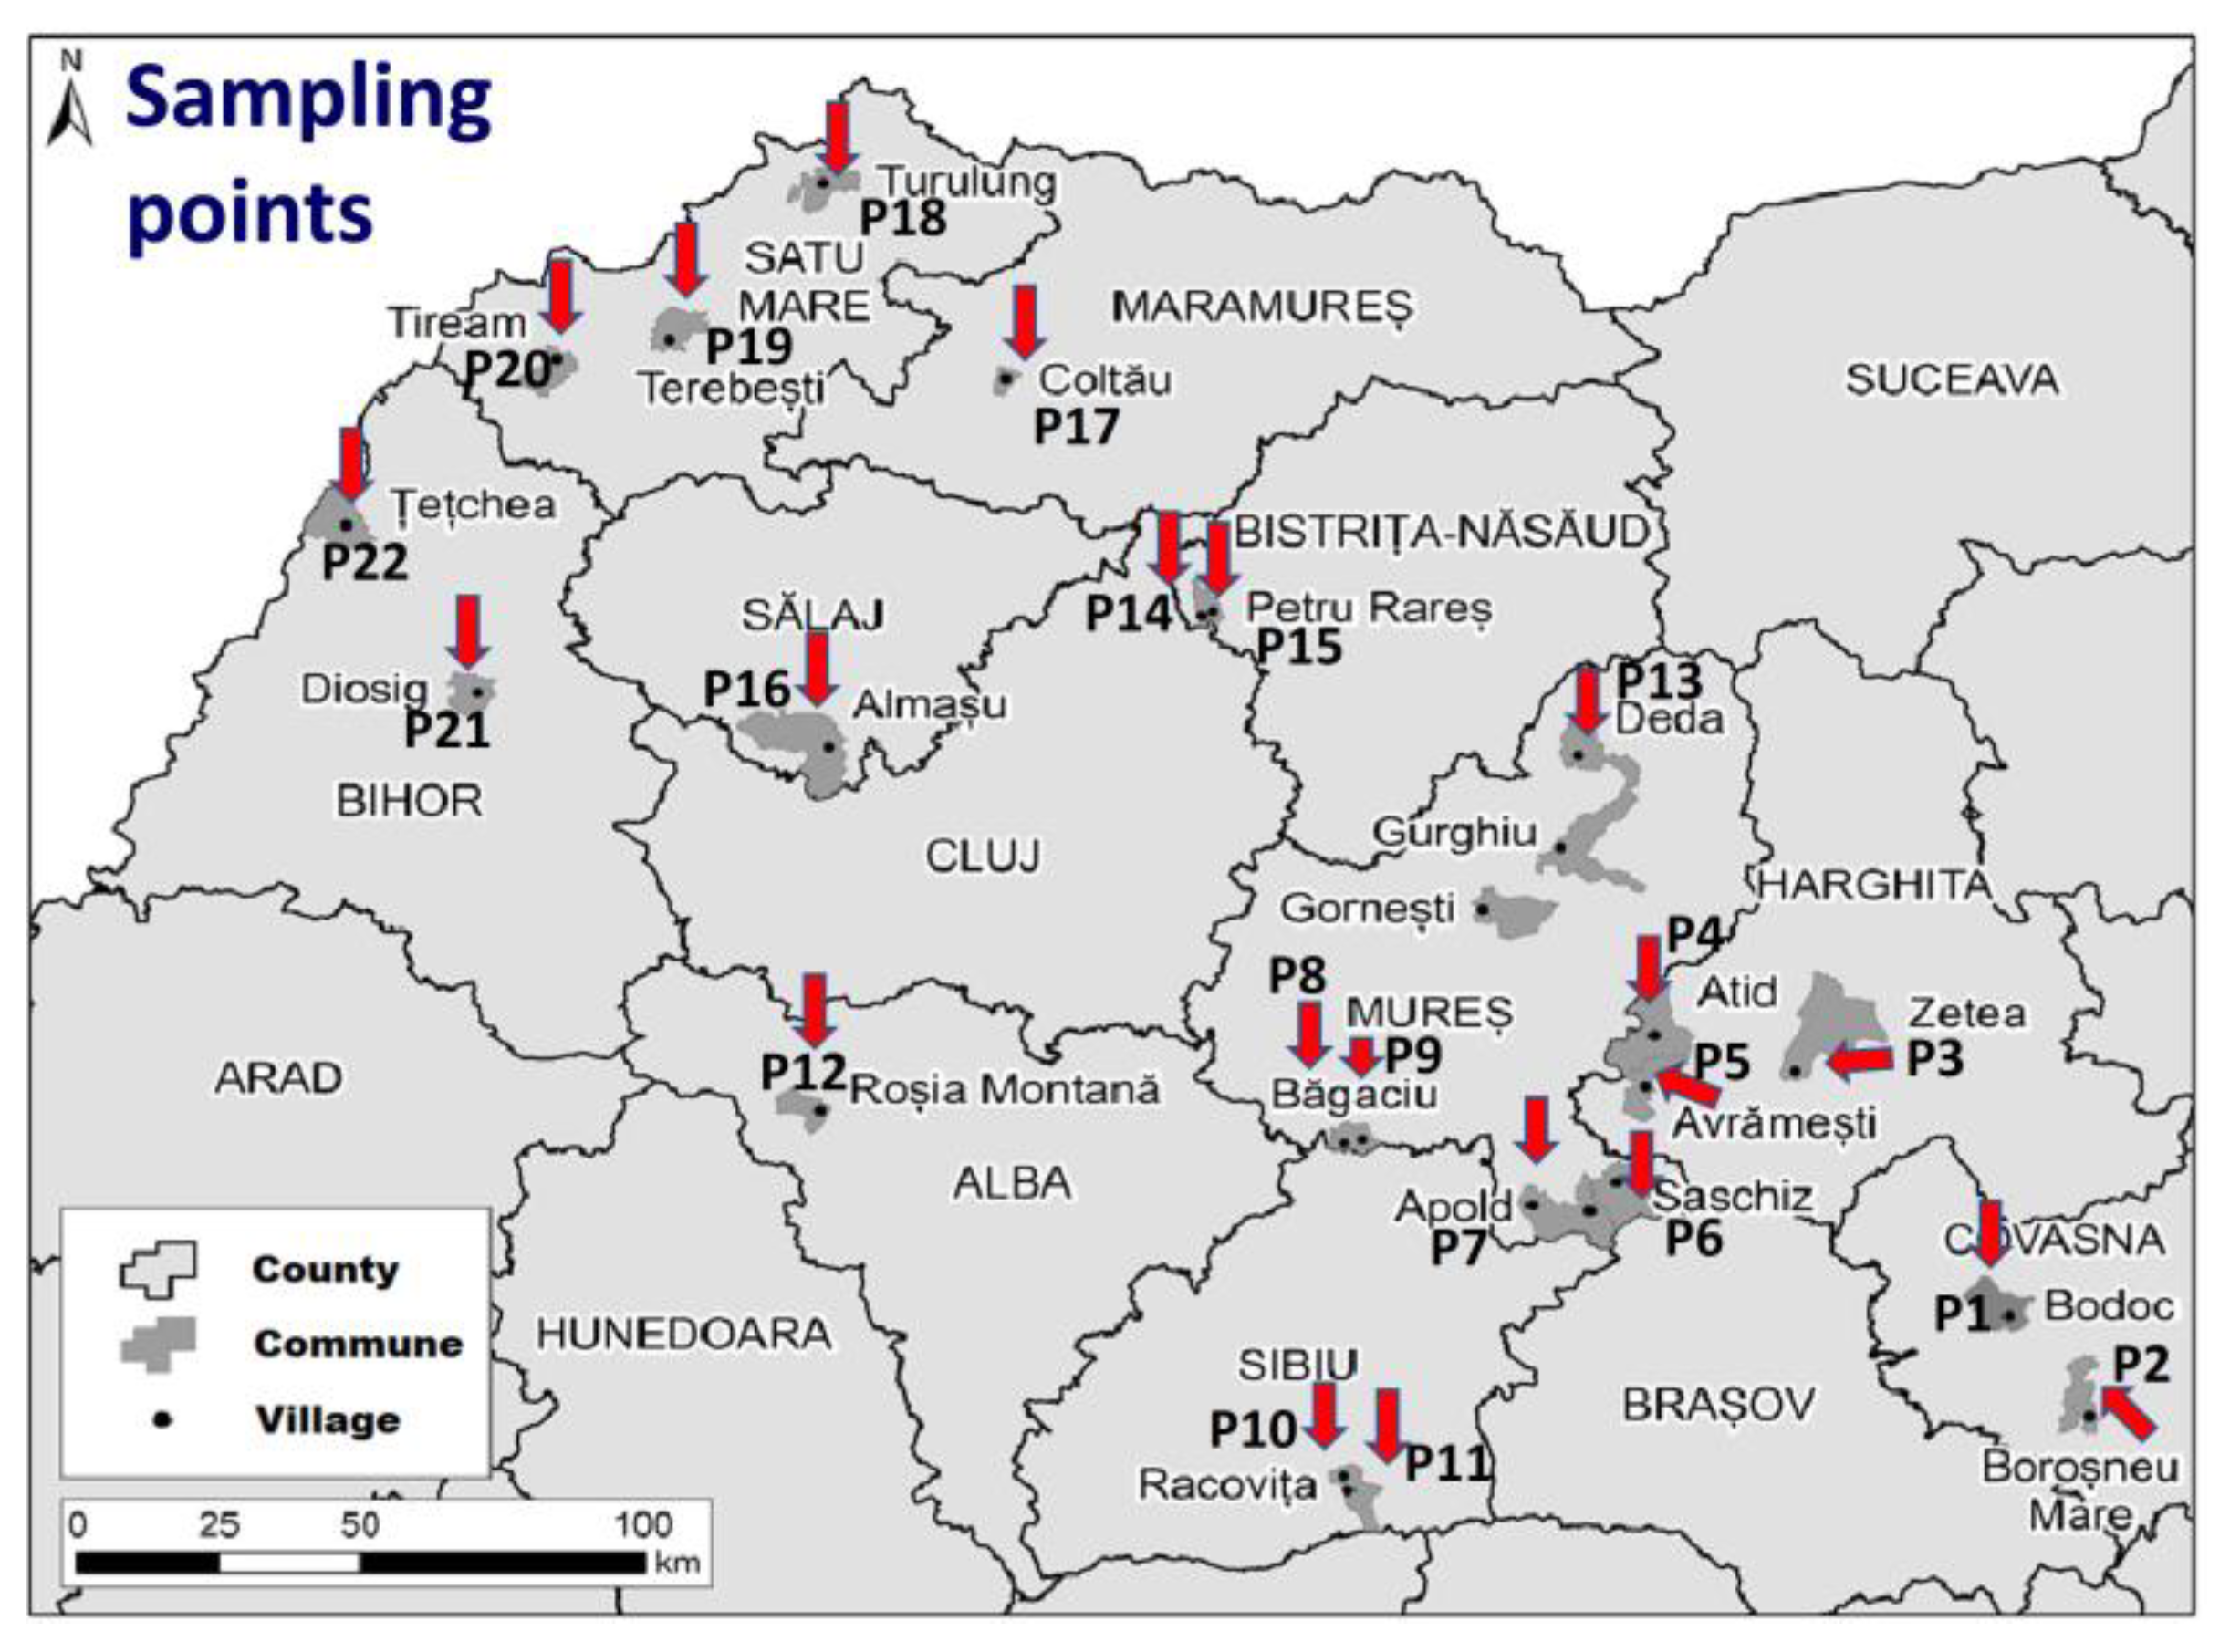
2.3. Sample Collection

To evaluate the sources of POP pollution and the exposure of the population to these pollutants, 22 soil samples were taken from 22 different rural Roma communities from the Transylvania region, Romania, between May and August 2022. The distribution of the samples, and their code is presented in Figure 1. Soil samples were collected using a metallic shovel from a depth between 0 and 10 cm from a square with a side of 1 m. The samples were then placed in plastic bags and stored at a temperature of 5 °C until analysis. For representativeness, five samples were collected from each sampling point, which were later mixed and homogenised.

2.4. Sample Preparation

The collected soil samples were dried at room temperature (22 °C) for 24 h, and after the removal of any vegetal remains, the samples were crushed with a pestle mortar and sieved through a 2 mm mesh sieve. For the extraction of the target compounds, 8 g of soil samples were weighed with an accuracy of 0.1 mg and placed in a 50 mL conical glass vial. Later, the soil samples were contaminated with an internal standard mixture (IS1) containing 100 ng of naphthalene-d8, anthracene-d10, fluoranthene-d10 and perylene-d12 and 20 ng of PCB-30.
The ultrasound-assisted extraction was performed with 30 mL of acetone: n-hexane mixture (1:1, v/v) in the ultrasonic bath for 20 min. After ultrasound-assisted extraction, the sample was subjected to centrifugation for 5 min (3000 rpm) and the supernatant was collected. The extraction procedure was repeated 2 more times with a fresh solvent mixture, and the collected extracts were combined in a 100 mL round bottom glass flask. The resulting extract was further subjected to desulfurisation with 1 g of copper powder for 12 h. The next day, after decanting the copper, the extract was evaporated to approximately 2 mL with a rotary evaporator and subjected to purification by open-column chromatography [17].
For the purification of soil extracts, a purification open column containing three layers of adsorbents in the following order, from top to bottom: 1 g of anhydrous sodium sulphate, 4 g of activated alumina and 4 g of silica gel, was used. Before use, the column was conditioned with 20 mL of n-hexane at atmospheric pressure. After conditioning, the extract of approximately 2 mL was introduced into the head of the column, and the compounds of interest were eluted with 20 mL of n-hexane and 40 mL of a mixture of n-hexane: dichloromethane (80:20, v/v). The eluate obtained was later concentrated on a rotary evaporator to approximately 1–2 mL. After adding to the obtained extract, the second internal standard mixture (IS2) containing 100 ng of acenaphthene-d10, phenanthrene-d10 and chrysene-d12 and 20 ng of PCB-155 was evaporated to dryness under nitrogen flow. The residue remaining after evaporation of the solvent was then re-dissolved with 300 μL of n-hexane: dichloromethane (80:20, v/v), and the resulting sample was eventually subjected to GC-MS and GC-ECD analyses. PCB-30, PCB-155, and deuterated PAH (IS1 and IS2) were used for the quantification of OCPs, PCBs, and PAH, respectively.
According to our previous published results [17], the obtained extraction recoveries ranged from 75.69 ± 8.04% to 114.04 ± 5.4% for PAHs, and from 82.9 ± 1.95% to 128.39 ± 2.19% for OCPss and PCBs respectively. The method detection limit (DL) ranges from 0.09 to 1.5 ng/g dry weight (dw) for PAH and from 0.01 to 0.2 ng/g dw for OCPs and PCBs.

2.5. Health Risk Assessment

The health risk was assessed by non-cancer and carcinogenic risk of pollutants as hazard index (HI) and carcinogenic risk (CR) according to U.S. EPA recommendation [18,19,20,21].
The ingestion, dermal contact, and inhalation routes were considered for estimating the exposure of the local population. The average daily dose (ADD, (mg/kg/d) of a pollutant via soil ingestion, dermal contact, and inhalation as exposure pathways can be estimated by the following equations [21]:
ADDingest = (Cs × IngR × EF × ED × CF)/(BW × AT)
ADDdermal = (Cs × SA × AF × ABS × EF × ED × CF)/(BW × AT)
ADDinhale = (Cs × InhR × EF × ED)/(PEF × BW × AT)
where Cs is the concentration of pollutant in soil (mg/kg); IngR is the soil ingestion rate (mg/day); EF is the exposure frequency (days/year); ED is the exposure duration (year); CF is the conversion factor (kg/mg); BW is the body weight (kg); AT is the average lifetime (day); SA is the dermal surface exposure; AF is the skin-soil adherence factor; ABS is the gastrointestinal absorption factor; IngR is the soil intake rate; InhR is the soil inhalation rate; PEF is the particulate emission rate.
The hazard index (HI) and the carcinogenic risk (CR) can be estimated using the following equations [19,21]:
HI = ∑ADD/RfD
CR = ∑ADD × CSF
where HI represents hazard index, CR is carcinogenic risk, RfD is reference values, and CSF is carcinogenic risk factors slope.
The total risks were the sum of risks associated with each exposure route. The values of variables considered to estimate HI and CR are given in Table 1.

3. Results and Discussion

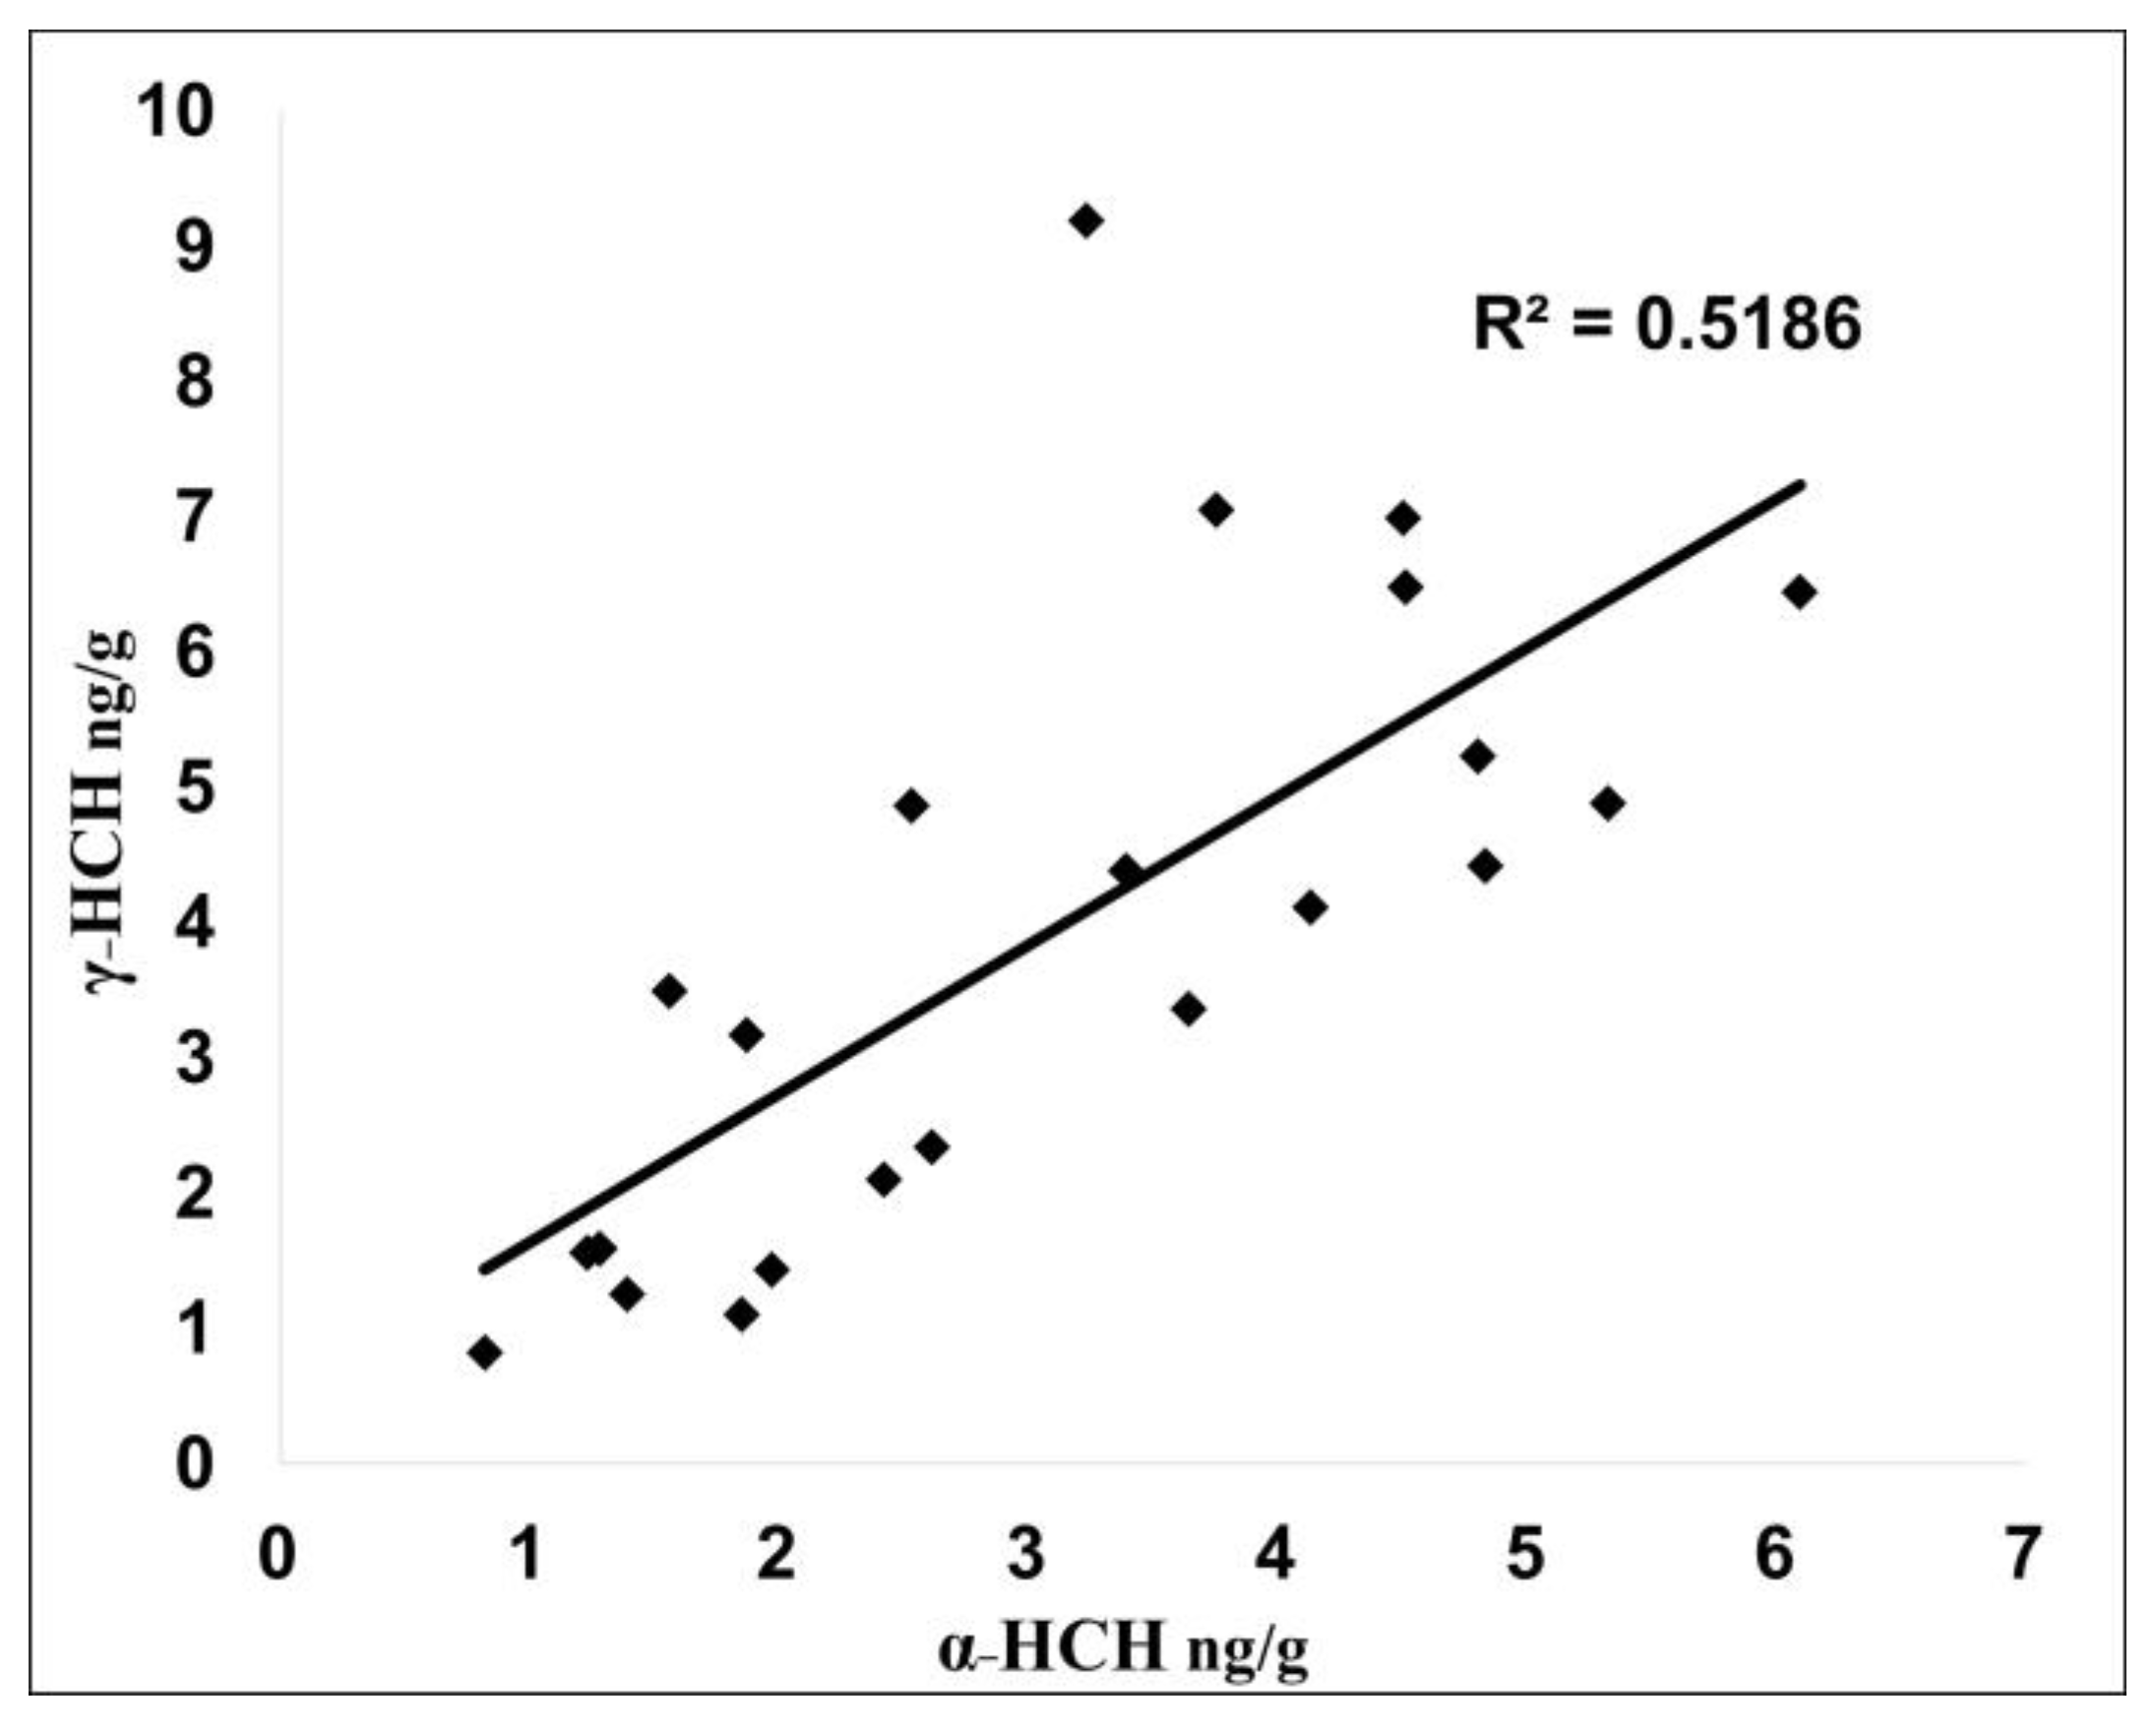
3.1. OCP Distribution and Potential Source Apportionment

Total OCP concentration in soil samples ranged from 25.62 to 139.30 ng/g dw, with the highest concentrations found at sampling point P15 (Reteag) and the lowest at sampling point P1 (Bodoc) (Table 2). The most prevalent OCPs were dieldrin (<DL–52.05 ng/g), p,p′-DDD (<DL–42.22 ng/g), heptachlor (<DL–41.23 ng/g), γ-HCH (0.56–10.42 ng/g) and α-HCH (<DL–8.09 ng/g). β-HCH, heptachlor epoxide, trans-chlordane and endrin were not found in any sample analysed, while other OCPs were detected in small amounts and in a limited number of soil samples (Table S1). The results are quite similar to those obtained by other authors in Mureș County in Romania [22] or in China [23], who found OCP residues in the range of tens of ng/g in soil samples. On the other hand, another study carried out in Mongolia [24] found OCP concentrations of the order of µg/g soil being 1000 times higher than the concentrations found in this study.
Since over time different classes or mixtures of OCPs have been used, for a better estimation of OCP use in the study areas, these compounds were divided into five groups, namely: HCH residues (α-, β-, γ-HCH, hexachlorobenzene, tecnazene, quintozene); DDT residues (o,p′-DDT, p,p′-DDT, o,p′-DDE, p,p′-DDE, o,p′-DDD, p,p′-DDD, methoxychlor); endosulfan residues (α-, β-endosulfan); chlordane-related residues (cis-chlordane, trans-chlordane, heptachlor and heptachlor epoxide) and cyclodiene pesticide residues (aldrin, dieldrin, endrin).
Among the five groups of OCPs, the highest prevalence was recorded for residues of chlordane-related compounds, the order of magnitude being as follows: chlordanes > cyclodiene pesticides > DDT > HCH > endosulfan. The average concentration of chlordanes, cyclodiene pesticides, DDT, HCH and endosulfan was 25.50, 14.69, 11.94, 11.38, and 0.50 ng/g, respectively (Table 2).
This classification provides information on the prevalence of different classes of OCPs in the analysed soil samples, but it is equally important for establishing the source and behaviour of these compounds in environmental compartments, too. To detect past and recent input of OCPs to soil, isomeric and parent substance/metabolite ratios of OCPs are commonly used [25]. Ratios such as ∑DDT/ƩHCH, α-HCH/γ-HCH, (DDE + DDD)/∑DDT, DDE/DDD, o,p′-DDT/p,p′-DDT, heptachlor/heptachlor epoxide, cis-chlordane/trans-chlordane are widely used in the scientific literature to predict the source, age, and degradation pathway of these toxic and persistent compounds [17,26,27].
The first approach that can be used is the ∑DDT/∑HCH ratio, which can give us information about the use of DDT and HCH. A ratio with a value above 1 suggests the use of DDT, while a value less than 1 suggests the use of HCH [17]. Our results show that HCH predominated in 12 out of 22 analysed samples, while DDT in 10 samples.
Because both HCH and DDT have been used in different forms or mixtures, variations in the composition of HCH isomers or DDT congeners in the environment can provide useful information about pollution sources [28].
Regarding HCH, the results showed that α-HCH was detected in concentrations ranging from <DL to 8.09 ng/g, γ-HCH from 0.56 to 10.42 ng/g, while β-HCH was not detected in any soil sample (Table S1, Supplementary Material). If it is considered that HCH was used either as a technical mixture of four isomers (60–70% α-HCH, 5–12% β-HCH and 10–12% γ-HCH) or as pure lindane (99% γ-HCH) [29], the ratio of α-HCH/γ-HCH can provide information about the type of HCH used. In general, α-HCH/γ-HCH ratio above 4 indicates a technical mixture, 0 indicates lindane, and less than 4 suggests a possible release of lindane into the environment [29,30].
In the analysed soil samples, the α-HCH/γ-HCH ratio varied between 0.35 and 1.68, indicating that the HCHs is a cocktail of technical HCH and lindane application. Similar results were obtained on other soils from Romania [31]. Among HCH isomers, only α-HCH and γ-HCH were detected. This is strange because β-HCH, a component of the technical mixture of HCH or a degradation product of α-HCH and γ-HCH, was not detected in any sample, even though it is the most persistent and less volatile isomer and tends to accumulate in soil [32]. On the other hand, it is interesting to note that there is a significant correlation between α-HCH and γ-HCH (R2 = 0.5186) in the studied soils, even if technical HCH or lindane was used in the past (Figure 2). This correlation clearly reflects the degradation of γ-HCH to α-HCH [27].
Moreover, if the enantiomeric fraction EF of α-HCH is calculated (the ratio between α-HCH and the sum of α-HCH + γ-HCH) from the soil samples [32,33] it can be seen that the EF value of α-HCH in a mixture is higher or close to the value of the racemic mixture, with EFs ≈ 0.5 (Figure 3), which indicates a fresh source of α-HCH, other than the past application of technical HCH.
An explanation for both the maintenance of the correlation between the α- and γ-HCH isomers and the deriving racemic α-HCH could be the in situ conversion of γ-HCH to α-HCH.
This fact was already mentioned in the scientific literature [27], which states that there is a high potential for γ-HCH to be converted in the soil to α-HCH through sunlight and biological degradation.
The composition of DDTs showed that p,p′-DDD (54.41%) was the predominant form, followed by p,p′-DDT (30.27%), o,p′-DDT (10.13%) and p,p′-DDE (5.19%). This composition is not at all similar to that of commercial, technical DDT mixtures (75% p,p′-DDT, 15% o,p′-DDT, 5% p,p′-DDE and <5% p,p′-DDD) [34], which means clearly that a series of degradation processes occurred during the time. To predict the source, age, and degradation patterns, the diagnostic ratio of (DDD + DDE)/∑DDTs, DDD/DDE, o,p′-DDT/p,p′-DDTs were used [26,27].
The (DDE + DDD)/∑DDT ratio can be used to assess whether DDT has been introduced into the environment recently or in the past. A ratio < 0.5 indicates recent input of DDT, and a ratio > 0.5 indicates previous use [28]. DDE/DDD ratios are effective markers for estimating the degradation status (pathway) of DDT. The ratio > 1 indicates the aerobic degradation of DDT to DDE, while the ratio < 1 reflects the transformation of DDT to DDD by anaerobic degradation [30]. The o,p′-DDT/p,p′-DDT ratio is used to determine the sources of DDT (Dicofol or DDT) [35]. A ratio of >1 indicates the use of Dicofol (C14H9Cl5O, a tertiary alcohol derivate from DDT, in which the benzylic hydrogen has been replaced by a hydroxyl group), while a ratio of <1 indicates the use of the technical mixture [36].
The results of the (DDE + DDD)/∑DDT ratio obtained for the analysed soil samples reflect the fact that the DDT residue originates from the previous use of DDT, all ratio values being above 0.5 (Table 2). This denotes that there has been no new input of DDT in the last period.
The value of the ratio DDE/DDD is (with just two exceptions: sampling point P5—Avrămești and P19—Terebești) below 1, which reflects the prevalence of DDD in the soil as a result of the anaerobic degradation of DDT in the soil. This scenario was also reported by some previous studies [26,32,37], which found a higher amount of DDD compared to DDE in soil samples. The anaerobic degradation of DDT into DDE is highlighted only in the two previously mentioned sampling points. Furthermore, in 16 of 22 samples, DDE isomers were not detected (Table S1). Similar results were obtained worldwide [27,33].
The results for the o,p′-DDT/p,p′-DDT ratio suggest the use of the technical mixture of DDT, with the value obtained being below 1 in all samples (Table 2) [38].
Heptachlor residue varied between 0.34 and 49.33 ng/g (Table 2), the most widespread being heptachlor, with a concentration between 0.34 and 41.14 ng/g (Table S1). Heptachlor epoxide was detected only in three samples (P13, P15, P18) in the following concentrations 5.25, 8.86, and 5.08 ng/g, which means that the conversion of heptachlor into heptachlor epoxide by biotic, abiotic pathways or volatilisation rarely occurs. Cis-chlordane was detected in one sample at a concentration of 0.07 ng/g, while trans-chlordane was not detected in any soil sample (Table S1). The results are similar to other research performed in Romania [39].
Cyclodiene pesticide residues range from <DL to 53.73 ng/g (Table 3). The most widespread representative is dieldrin, with a concentration ranging from <DL to 52.05 ng/g, followed by aldrin from <DL to 6.17 ng/g. Endrin was not detected in any soil sample (Table S1). The results are similar to other studies conducted in other parts of Romania [10,22].

3.2. PCBs Concentrations in Soil Samples

The total concentration of PCBs in the soil samples varied between 0.22 and 49.12 ng/g dw, the highest concentrations being found at sampling point P15 (Reteag) and the lowest at sampling point P17 (Coltău) (Table S2). The most prevalent PCBs were PCB-52 (<DL–33.77 ng/g), PCB-138 (<DL–19.53 ng/g) and PCB-28 (<DL–6.94 ng/g). PCB-194 was detected in two samples at a concentration of 6.76 ng/g (P8) and 7.95 ng/g (P22). If the percentage for all individual compounds is calculated from the total of 12 PCBs, then tetra-PCBs represent 48.47%, hexa-PCBs 38.02%, and tri-PCBs 8.48%, respectively [18]. The high prevalence of tri- and tetra-PCBs has also been reported in the literature in soils from China [18,40,41], Mongolia [24], or river sediment in Romania [17].
High concentrations of less chlorinated PCBs (tri-Cl + tetra-Cl PCBs) in rural areas are probably due to wet or dry atmospheric deposition, given that there are no local sources of PCBs in these areas. The presence of hexa-Cl and octa-Cl PCBs may be due to the discharge of untreated contaminants [17]. The absence of penta-Cl PCBs and the prevalence of tetra-Cl PCBs in rural soil could be explained by microbial dechlorination, which may be the most important pathway for the origin of less chlorinated PCBs [17].
The presence of tri-Cl PCBs can be attributed to technical PCBs such as Aroclor 1016, the presence of tetra-Cl PCBs can be attributed to Aroclor-1242 and -1248, as well as to the microbial degradation of higher-chlorinated PCBs [42,43], the presence of hexa-Cl PCBs can be attributed to Aroclor-1254, while the octa-Cl PCBs can be attributed to Aroclor-1260 and -1262 [44].
If we consider that low molecular weight PCBs are used in transformers, capacitors and lubricants, and high molecular weight PCBs are commonly used in paints and plasticisers [18], we can conclude that, in the absence of local sources in the studied areas, the origin of PCBs is atmospheric deposition. However, to understand the extent of PCB pollution, more information is needed, which calls for more detailed studies in the future.

3.3. PAHs Distribution and Sources

The total PAH concentration in the analysed soil samples varies between 4.86 and 451.85 ng/g dw, the lowest concentration being found in sampling point P11 (Sebeșu de Sus) and the highest in sampling point P2 (Boroșneu) (Table 3). These concentrations are much lower than those found in farmland soil from China (17.82 to 1544.73 ng/g) [45]. Regarding the composition, the highest values were recorded for PAH hydrocarbons with 4 to 6 benzene rings, respectively FLT (0.04 to 128.07 ng/g), PYR (0.05 to 78.87 ng/g), CHR (0.29 to 77.85 ng/g), BbF + BkF (<DL to 66.37 ng/g), IND (<DL to 42.88 ng/g) and BghiP (<DL to 35.64 ng/g). BaP was detected in 14 samples in a concentration ranging from 0.15 to 16.37 ng/g dw, while other PAHs were detected in a concentration ranging from <DL to less than 5 ng/g dw (Table S3, Supplementary Material).
If the percentage of PAHs generated by combustion (FLA, PYR, BaA, CHR, BkF, BbF, BaP, IND, BghiP) (%∑COMB) of the total PAHs is calculated, they account for more than 75% of the total HAP. This suggests that the origin of PAHs in soil is one due to combustion, as it contains PAHs with more than four rings and not one due to spills of petroleum products that typically contain PAHs with less than four benzene rings [46].
In order to identify the source of PAHs, various isomeric ratios were calculated, such as the abundance ratio of low molecular weight PAHs, (∑LMW) (with 2–3 benzene rings) and with high molecular weight PAHs, (∑HMW) (with 4–6 benzene rings) (∑LMW/∑HMW) [47], isomeric ratio of FL/(FL + PYR) [46], ratio of ANT/(ANT + PHE), and ratio of FLT/(FLT + PYR) [48].
According to the specialised literature, these isomeric ratios can establish, with some degree of accuracy, either the petrogenic or the pyrogenic signature/origin of these polyaromatic hydrocarbons. Thus, a ∑LMW/∑HMW ratio less than or equal to 1 indicates a pyrogenic contribution and a value greater than 1 indicates a petrogenic contribution [47]. A FL/(FL + PYR) ratio less than 0.5 indicates petroleum emissions and greater than 0.5 diesel emissions [46]. An ANT/(ANT + PHE) ratio less than or equal to 0.1 indicates a petrogenic input, and greater than 0.1 indicates a pyrogenic one. A FLT/(FLT + PYR) ratio of less than 0.4 indicates oil leakage; between 0.4 and 0.5 suggests fossil fuel combustion, and greater than 0.5 indicates a contribution from natural sources such as biomass and coal combustion, respectively [48].
For the analysed soil samples, the obtained values for ∑LMW/∑HMW ratio suggest a pyrogenic source of PAH, these values being lower than 1 for all the analysed samples (Table 3). Since ∑LMW/∑HMW ratios can undergo changes during transport from sources to receptor sites [49], the other three diagnostic ratios were considered for a better assessment of PAH sources. Thus, for the ratio FL/(FL + PYR), the results varied from 0.001 to 0.901, which suggests mainly petroleum emissions in 20 samples analysed (Table 3). For the ANT/(ANT + PHE) ratio, the results ranged from 0.25 to 0.55, suggesting a pyrogenic origin of PAH in all analysed samples. The FLT/(FLT + PYR) ratio suggests petroleum combustion in 5 of 22 samples and biomass and coal combustion in 17 samples, with values ranging from 0.43 to 0.77 (Table 3).
To better visualise the contribution of different sources to the soil PAH concentration, the cross plot of the isomeric ratios of ANT/(ANT + PHE) versus FLT/(FLT + PYR)) was plotted (Figure 4). The results suggest that the main sources of pollution in the analysed soil samples mixed petroleum combustion and biomass and coal combustion [48].

3.4. Health Risk Assessment

The estimated target pollutants via the non-dietary route are summarised in Table 4. The ADD of different pesticides, PAH and POC for each sampling point and non-dietary routes are given in Tables S2–S5. Compared with adults, children had a higher susceptibility of exposure to environmental contaminants per unit of body weight owing to their behavioural and physiological characteristics.
The non-cancer risks (HI) of these organic compounds were all within acceptable values (ranging from 10−8 to 10−4). This indicated that there was an absence of non-cancer risks of these organic compounds in the studied area. The carcinogenic risks (CR) posed by these organic compounds in soil via non-dietary routes were also in the very low-risk category (ranging from 10−8 to 10−6) both for adults and children.
The average CR values of children and adults exposed to organic compounds through different pathways (ingestion, dermal contact, and inhalation) in rural soils collected from different sources are listed in Table 5.
As presented in Table 5, the average carcinogenic risk (CR) associated with the three classes of POPs on the three routes of exposure decreases in the order direct ingestion > dermal contact > inhalation. It is observed that the CR due to inhalation is more than 104 times lower than the other two exposure routes, which means that the inhalation exposure route can be neglected. It can also be observed that, in general, the CR values indicate that children were the most sensitive age group to exposure to POPs contamination since they have higher CR values than adults in most cases. The results are quite similar with those obtained by researchers from China [19,21,45], Pakistan [33], or Nigeria [20], who obtained CR values between 10−8 and 10−5, which means that there is no potential carcinogenic risk from the exposure to contaminated agricultural soils with POPs.

4. Conclusions

Pollution of soils by three main categories of persistent organic pollutants (POPs), such as (a) 16 polycyclic aromatic hydrocarbons (PAHs), (b) 22 organochlorine pesticides (OCPs), and (c) 12 polychlorinated biphenyls (PCBs), in a series of 22 rural Roma communities in the Transylvania region of Romania has been investigated, to evaluate the human health risks associated with this exposure.
Total OCP concentration in soil samples ranged from 25.62 to 139.30 ng/g dw. The most prevalent OCPs were dieldrin (<DL–52.05 ng/g), p,p′-DDD (<DL–42.22 ng/g), heptachlor (<DL–41.23 ng/g), γ-HCH (0.56–10.42 ng/g) and α-HCH (<DL–8.09 ng/g). The OCPs β-HCH, heptachlor epoxide, trans-chlordane and endrin were not found at all, while other OCPs were detected in small amounts and in a limited number of soil samples.
Among the five groups of OCPs, the concentrations decreased in the following order: chlordanes > cyclodiene pesticides > DDT > HCH > endosulfan. The average concentration of chlordanes, cyclodiene pesticides, DDT, HCH and endosulfan was 25.50, 14.69, 11.94, 11.38, and 0.50 ng/g, respectively.
The ƩDDT/ƩHCH ratio was used to provide information about the use of DDT and HCH. Our results showed that HCH predominated in 12 out of 22 analysed soil samples, while DDT was predominant in 10 samples.
Regarding HCH, the results showed that α-HCH was detected in concentrations ranging from <DL to 8.09 ng/g, γ-HCH from 0.56 to 10.42 ng/g, while β-HCH was not detected in any soil sample. If it is considered that HCH is used either as a technical mixture of four isomers (60–70% α-HCH, 5–12% β-HCH and 10–12% γ-HCH) or as pure lindane (99% γ-HCH), the ratio of α-HCH/γ-HCH can provide information about the type of HCH used.
The composition of DDTs showed that p,p′-DDD (54.41%) was predominant, followed by p,p′-DDT (30.27%), o,p`-DDT (10.13%) and p,p′-DDE (5.19%). This composition is obviously not similar to that of standard, commercial, technical DDT mixtures (75% p,p′-DDT, 15% o,p′-DDT, 5% p,p′-DDE and <5% p,p′-DDD), which clearly means that some degradation processes of DDTs occurred over time. To predict the source, age and degradation patterns, the diagnostic ratio of (DDD + DDE)/∑DDTs, DDD/DDE, o,p′-DDT/p,p′-DDTs were used. The results of the (DDE + DDD)/∑DDT ratio obtained for the analysed soil samples reflect the fact that the DDT residue originates from the previous, historical use of DDT because all ratio values being >0.5; this finding also shows that there has been no new input of DDT in the last period. The results for the o,p′-DDT/p,p′-DDT ratio suggest the use of the technical mixture of DDT, with the value obtained being <1 for all samples.
Heptachlor varied between 0.34 and 49.33 ng/g dw, while heptachlor epoxide was detected only in three samples (in concentrations between 5 and 9 ng/g dw), which means that the conversion of heptachlor into heptachlor epoxide by various degradation pathways occurs rarely. Cis-chlordane was detected in one sample (0.07 ng/g dw), while trans-chlordane was not detected in any soil sample.
Cyclodiene pesticide residues ranged from <DL to 53.73 ng/g dw. The most widespread was dieldrin (<DL–52.05 ng/g), followed by aldrin (from <DL to 6.17 ng/g), while endrin was not detected in any soil sample.
Concerning the PCBs, their levels were from 0.22 to 49.12 ng/g dw, with PCB-52 (<DL–33.77 ng/g), PCB-138 (<DL–19.53 ng/g) and PCB-28 (<DL–6.94 ng/g) being the most present compounds.
Total PAH concentrations were found to be between 4.86 and 451.85 ng/g dw; the highest levels were observed for PAH hydrocarbons containing 4 to 6 benzene rings (FLT; PYR; CHR; BbF + BkF; IND and BghiP). The carcinogen BaP was found in 14 soil samples, and its concentration varied from 0.15 to 16.37 ng/g dw. A series of isomeric ratios involving the PAHs were calculated; for the analysed soil samples, the obtained values for the ∑LMW/∑HMW ratio (lower than 1) suggest a pyrogenic source of PAH. Also, values calculated for the ratio FL/(FL + PYR) were from 0.001 to 0.901 in 20 soil samples, which indicates mainly petroleum emissions as a PAH source. Moreover, the values obtained for the ANT/(ANT + PHE) ratio (from 0.25 to 0.55) indicate a pyrogenic origin of PAHs in all analysed soils. Finally, the values of the FLT/(FLT + PYR) ratio (from 0.43 to 0.77) suggest petroleum combustion in 5 of 22 samples and biomass and coal combustion in 17 samples.
In summary, our results showed that POP concentrations in soil ranged from 4.86 to 451.85 ng/g dw for PAHs, from 25.62 to 139.30 ng/g dw for OCPs, and from 0.22 to 49.12 ng/g dw for PCBs. We can therefore conclude that all the investigated POPs were present in soil samples at ultra-trace levels, since their concentrations were in all cases < 1 ppm (1 μg/g dw).
The non-carcinogenic (HI) and carcinogenic (CR) risks of these organic compounds in soil through non-dietary pathways were calculated and were found to be in the very low-risk category (ranging from 10−8 to 10−4), indicating an absence of these risks from the investigated POPs (PAHs, OCPs, and PCBs) in the studied area.

Supplementary Materials

The following supporting information can be downloaded at: https://www.mdpi.com/article/10.3390/su16010232/s1, Table S1. The concentration of individual OCPs (ng/g dw) determined in analysed soil samples. Table S2. The concentration of individual PCBs (ng/g dw) determined in analysed soil samples, ADDingestion, ADDdermal, and ADDinhalation values, HI and CR values. Table S3. The concentration of individual PAHs (ng/g dw) determined in analysed soil samples, ADDingestion, ADDdermal, and ADDinhalation values, HI and CR values. Table S4. ADDingestion, ADDdermal, and ADDinhalation values, HI and CR values of α-HCH and γ-HCH. Table S5. ADDingestion, ADDdermal, and ADDinhalation values, HI and CR values of DDE, DDD and DDT isomers.

Author Contributions

Conceptualization, M.S.B.-G. and V.B.-B.; Methodology, M.S.B.-G.; Validation, V.-A.P. and M.S.B.-G.; Formal analysis, V.-A.P. and M.-C.H.; Investigation, V.-A.P., M.S.B.-G., V.B., J.L.L. and V.B.-B.; Resources, M.S.B.-G. and V.B.; Data curation, V.B.-B. and R.-T.C.; Writing—original draft, V.-A.P., M.S.B.-G., V.B.-B. and R.-T.C.; Writing—review and editing, M.S.B.-G. and V.B.-B.; Supervision, M.S.B.-G.; Project administration, M.S.B.-G. and V.B.; Funding acquisition, M.S.B.-G. and V.B. All authors have read and agreed to the published version of the manuscript.

Funding

The research leading to these results has received funding from the Norway Grants 2014–2021 under Project contract no. 23/2020.

Institutional Review Board Statement

Not applicable.

Informed Consent Statement

Not applicable.

Data Availability Statement

Data are contained within the article.

Conflicts of Interest

The authors declare no conflict of interest.

References

  1. Grassi, P.; Fattore, E.; Generoso, C.; Fanelli, R.; Arvati, M.; Zuccato, E. Polychlorobiphenyls (PCBs), polychlorinated dibenzo-p-dioxins (PCDDs) and dibenzofurans (PCDFs) in fruit and vegetables from an industrial area in northern Italy. Chemosphere 2010, 79, 292–298. [Google Scholar] [CrossRef] [PubMed]
  2. Dreyer, A.; Minkos, A. Polychlorinated biphenyls (PCBs) and polychlorinated dibenzo-para-dioxins and dibenzofurans (PCDD/F) in ambient air and depositions in the German background. Environ. Pollut. 2023, 316, 120511. [Google Scholar] [CrossRef] [PubMed]
  3. Breivik, K.; Sweetman, A.; Pacyna, J.M.; Jones, K.C. Towards a global historical emission inventory for selected PCB congeners—A mass balance approach 3. An update. Sci. Total Environ. 2007, 377, 296–307. [Google Scholar] [CrossRef] [PubMed]
  4. Polder, A.; Muller, M.B.; Lyche, J.L.; Mdegela, R.H.; Nonga, H.E.; Mabiki, F.P.; Mbise, T.J.; Skaare, J.U.; Sandvik, M.; Skjerve, E.; et al. Levels and patterns of persistent organic pollutants (POPs) in tilapia (Oreochromis sp.) from four different lakes in Tanzania: Geographical differences and implications for human health. Sci. Total Environ. 2014, 488–489, 252–260. [Google Scholar] [CrossRef] [PubMed]
  5. Deng, Z.; Han, X.; Chen, C.; Wang, H.; Ma, B.; Zhang, D.; Zhang, Z.; Zhang, C. The distribution characteristics of polychlorinated biphenyls (PCBs) in the surface sediments of Ross Sea and Drake Passage, Antarctica: A 192 congeners analysis. Mar. Pollut. Bull. 2020, 154, 111043. [Google Scholar] [CrossRef]
  6. Pănescu, V.A.; Begy, R.; Roșian, G.; Bruzzoniti, M.C.; Beldean-Galea, M.S. Historical assessment of atmospheric persistent organic pollutants depositions in Muntinu glacial lake, southern Romanian Carpathians, based on radionuclide-dated sediments. Studia UBB Chem. 2022, LXVII, 287–302. [Google Scholar] [CrossRef]
  7. Albanese, S.; Guarino, A. Assessing contamination sources and environmental hazards for potentially toxic elements and organic compounds in the soils of a heavily anthropized area: The case study of the Acerra plain (Southern Italy). Geosciences 2010, 8, 552–578. [Google Scholar] [CrossRef]
  8. Wong, M.H.; Leung, A.O.W.; Chan, J.K.Y.; Choi, M.P.K. A review on the usage of POP pesticides in China, with emphasis on DDT loadings in human milk. Chemosphere 2005, 6, 740–752. [Google Scholar] [CrossRef]
  9. Wolmarans, N.J.; Bervoets, L.; Gerber, R.; Yohannes, Y.B.; Nakayama, S.M.M.; Ikenaka, Y.; Ishizuka, M.; Meire, P.; Smit, N.J.; Wepener, V. Bioaccumulation of DDT and other organochlorine pesticides in amphibians from two conservation areas within malaria risk regions of South Africa. Chemosphere 2021, 274, 129956. [Google Scholar] [CrossRef]
  10. Drăgan, D.; Cucu-Man, S.; Dirtu, A.C.; Mocanu, R.; Van Vaeck, L.; Covaci, A. Occurrence of organochlorine pesticides and polychlorinated biphenyls in soils and sediments from Eastern Romania. Int. J. Environ. Anal. 2006, 86, 833–842. [Google Scholar] [CrossRef]
  11. Agency for Toxic Substances and Disease Registry (ATSDR). Public Statement, Polycyclic Aromatic Hydrocarbons (PAHs); ATSDR: Washington, DC, USA, 1995; pp. 1–6. [Google Scholar]
  12. Giubilato, E.; Radomyski, A.; Critto, A.; Ciffroy, P.; Brochot, C.; Pizzol, L.; Marcomini, A. Modelling ecological and human exposure to POPs in Venice lagoon. Part I—Application of MERLIN-Expo tool for integrated exposure assessment. Sci. Total Environ. 2016, 565, 961–976. [Google Scholar] [CrossRef] [PubMed]
  13. United Nations Environment Programme (UNEP). Available online: https://chm.pops.int/TheConvention/ThePOPs/ListingofPOPs/tabid/2509/Default.aspx (accessed on 24 October 2023).
  14. Boehm, P.D. Polycyclic Aromatic Hydrocarbons (PAHs). In Environmental Forensic, 1st ed.; Morrison, R., Murphy, B., Eds.; Elsevier: Amsterdam, The Netherlands, 2005; pp. 313–337. [Google Scholar]
  15. Covaci, A.; Gheorghe, A.; Voorspoels, S.; Maervoet, J.; Redeker, E.S.; Blust, R.; Schepens, P. Polybrominated diphenyl ethers, polychlorinated biphenyls and organochlorine pesticides in sediment cores from the Western Scheldt river (Belgium): Analytical aspects and depth profiles. Environ. Int. 2005, 31, 367–375. [Google Scholar] [CrossRef] [PubMed]
  16. Megson, D. Polychlorinated Biphenyls. In Encyclopedia of Analytical Science, 3rd ed.; Worsfold, P., Townshend, A., Poole, C.F., Miro, M., Eds.; Elsevier: Amsterdam, The Netherlands, 2019; pp. 318–328. [Google Scholar]
  17. Barhoumi, B.; Beldean-Galea, M.S.; Al-Rawabdeh, A.M.; Roba, C.; Martonos, I.M.; Bălc, R.; Kahlaoui, M.; Touil, S.; Tedetti, M.; Driss, M.R.; et al. Occurrence, distribution and ecological risk of trace metals and organic pollutants in surface sediments from a Southeastern European river (Someşu Mic River, Romania). Sci. Total Environ. 2019, 660, 660–676. [Google Scholar] [CrossRef] [PubMed]
  18. Niu, L.; Mao, S.; Zhou, J.; Zhao, L.; Zhu, Y.; Xu, C.; Sun, X.; Sun, J.; Liu, W. Polychlorinated biphenyls (PCBs) in soils from typical paddy fields of China: Occurrence, influencing factors and human health risks. Environ. Pollut. 2022, 307, 119567. [Google Scholar] [CrossRef] [PubMed]
  19. Teng, Y.; Li, J.; Wu, J.; Lu, S.; Wang, Y.; Chen, H. Environmental distribution and associated human health risk due to trace elements and organic compounds in soil in Jiangxi province China. Ecotox. Environ. Saf. 2015, 122, 406–416. [Google Scholar] [CrossRef]
  20. Adesina, O.A.; Ezengwa, I.; Abdulraheem, K.A.; Adewole, A.J.; Oyetunji, O.B. Soil concentrations of Polychlorinated Biphenyl in a typical Nigerian University environment and its risk assessment. Case Stud. Chem. Environ. Eng. 2023, 7, 100343. [Google Scholar] [CrossRef]
  21. Xu, Y.; Dai, S.; Meng, K.; Wang, Y.; Ren, W.; Zhao, L.; Christie, P.; Teng, Y. Occurrence and risk assessment of potentially toxic elements and typical organic pollutants in contaminated rural soils. Sci. Total Environ. 2018, 630, 618–629. [Google Scholar] [CrossRef]
  22. Ferencz, L.; Balog, A. Pesticide Survey in Soil, Water and Foodstuffs from Central Romania. Carpathian J. Earth Environ. Sci. 2010, 5, 111–118. [Google Scholar]
  23. Zhao, W.; Lu, J.; Lai, Y.; Hou, Y.; Zhao, X.; Wei, Q.; Zou, X.; Gou, Z. Occurrences, Possible Sources, and Risk Impacts of Organochlorine Pesticides in Soil of Changchun Central Urban Area, Northeast China. Sustainability 2023, 15, 16801. [Google Scholar] [CrossRef]
  24. Surenjav, E.; Fiedler, H. POPs in the Mongolian environment. Emerg. Contam. 2023, 9, 100251. [Google Scholar] [CrossRef]
  25. Zhao, Z.; Jiang, Y.; Li, Q.; Cai, Y.; Yin, H.; Zhang, L.; Zhang, J. Spatial correlation analysis of polycyclic aromatic hydrocarbons (PAHs) and organochlorine pesticides (OCPs) in sediments between Taihu Lake and its tributary rivers. Ecotoxicol. Environ. Saf. 2017, 142, 117–128. [Google Scholar] [CrossRef] [PubMed]
  26. Eqani, S.A.; Malik, R.N.; Mohammad, A. The levels and distribution of selected organo-chlorine pesticides in sediments from River Chenab, Pakistan. Environ. Geochem. Health. 2011, 33, 33–47. [Google Scholar] [CrossRef] [PubMed]
  27. Syed, J.H.; Malik, R.N.; Liu, D.; Xu, Y.; Wang, Y.; Li, J.; Zhang, G.; Jones, K.C. Organochlorine pesticides in air and soil and estimated air–soil exchange in Punjab, Pakistan. Sci. Total. Environ. 2013, 444, 491–497. [Google Scholar] [CrossRef] [PubMed]
  28. Doong, R.A.; Peng, C.K.; Sun, Y.C.; Liao, P.L. Composition and distribution of organochlorine pesticide residues in surface sediments from the Wu-Shi River estuary, Taiwan. Mar. Pollut. Bull. 2002, 45, 246–253. [Google Scholar] [CrossRef] [PubMed]
  29. Li, W.; Yang, H.; Gao, Q.; Pan, H.; Yang, H. Residues of Organochlorine Pesticides in Water and Suspended Particulate Matter from Xiangshan Bay, East China Sea. Bull. Environ. Contam. Toxicol. 2012, 89, 811–815. [Google Scholar] [CrossRef] [PubMed]
  30. Ali, U.; Bajwa, A.; Chaudhry, M.J.I.; Adeel, M.; Syed, J.H.; Li, J.; Zhang, G.; Jones, K.C.; Malik, R.N. Significance of black carbon in the sediment–water partitioning of organochlorine pesticides (OCPs) in the Indus River, Pakistan. Ecotoxicol. Environ. Saf. 2016, 126, 177–185. [Google Scholar] [CrossRef]
  31. Covaci, A.; Manirakiza, P.; Schepens, P. Persistent Organochlorine Pollutants in Soils from Belgium, Italy, Greece, and Romania. Bull. Environ. Contam. Toxicol. 2002, 68, 97–103. [Google Scholar] [CrossRef]
  32. Alamdar, A.; Syed, J.H.; Malik, R.N.; Katsoyiannis, A.; Liu, J.; Li, J.; Zhang, G.; Jones, K.C. Organochlorine pesticides in surface soils from obsolete pesticide dumping ground in Hyderabad City, Pakistan: Contamination levels and their potential for air–soil exchange. Sci. Total Environ. 2014, 470–471, 733–741. [Google Scholar] [CrossRef]
  33. Sultan, M.; Waheed, S.; Ali, U.; Sweetman, A.J.; Jones, K.C.; Malik, R.N. Insight into occurrence, profile and spatial distribution of organochlorine pesticides in soils of solid waste dumping sites of Pakistan: Influence of soil properties and implications for environmental fate. Ecotoxicol. Environ. Saf. 2019, 170, 195–204. [Google Scholar] [CrossRef]
  34. Yang, R.Q.; Lv, A.H.; Shi, J.B.; Jaing, G.B. The level and distribution of organochlorine pesticides (OCPs) in sediments from the Haihe River, China. Chemosphere 2005, 61, 347–354. [Google Scholar] [CrossRef]
  35. Ali, U.; Syed, J.H.; Junwen, L.; Sánchez-García, L.; Malik, R.N.; Chaudhry, M.J.I.; Arshad, M.; Li, J.; Zhang, G.; Jones, K.C. Assessing the relationship and influence of black carbon on distribution status of organochlorines in the coastal sediments from Pakistan. Environ. Pollut. 2014, 190, 82–90. [Google Scholar] [CrossRef]
  36. Min, C.; Li, C.; Huang, P. Assessment, composition and possible source of organochlorine pesticides in surface soil from Ürümqi, China. Pedosphere 2015, 25, 888–900. [Google Scholar]
  37. Malik, R.N.; Rauf, S.; Mohammad, A.; Eqani, S.; Ahad, K. Organochlorine residual concentrations in cattle egret from the Punjab Province, Pakistan. Environ. Monit. Assess. 2011, 173, 325–341. [Google Scholar] [CrossRef]
  38. Jiang, Y.F.; Wang, X.T.; Jia, Y.; Wang, F.; Wu, M.H.; Sheng, G.Y.; Fu, J.M. Occurrence, distribution and possible sources of organochlorine pesticides in agricultural soil of Shanghai, China. J. Hazard. Mater. 2009, 170, 989–997. [Google Scholar] [CrossRef]
  39. Ene, A.; Bogdevich, O.; Sion, A. Levels and distribution of organochlorine pesticides (OCPs) and polycyclic aromatic hydrocarbons (PAHs) in topsoils from SE Romania. Sci. Total Environ. 2012, 439, 76–86. [Google Scholar] [CrossRef]
  40. Mao, S.; Liu, S.; Zhou, Y.; An, Q.; Zhou, X.; Mao, Z.; Wu, Y.; Liu, W. The occurrence and sources of polychlorinated biphenyls (PCBs) in agricultural soils across China with an emphasis on unintentionally produced PCBs. Environ. Pollut. 2021, 271, 116171. [Google Scholar] [CrossRef]
  41. Yu, H.; Liu, Y.; Shu, X.; Ma, L.; Pan, Y. Assessment of the spatial distribution of organochlorine pesticides (OCPs) and polychlorinated biphenyls (PCBs) in urban soil of China. Chemosphere 2020, 243, 125392. [Google Scholar] [CrossRef]
  42. Vanier, C.; Sylvestre, M.; Planas, D. Persistence and fate of PCBs in sediments of the Saint Lawrence River. Sci. Total Environ. 1996, 192, 229–244. [Google Scholar] [CrossRef]
  43. Zhou, S.S.; Shao, L.Y.; Yang, H.Y.; Wang, C.; Liu, W.P. Residues and sources recognition of polychlorinated biphenyls in surface sediments of Jiaojiang Estuary, East China Sea. Mar. Pollut. Bull. 2012, 64, 539–545. [Google Scholar] [CrossRef]
  44. Frame, G.M.; Cochran, J.W.; Bøwadt, S.S. Complete PCB congener distributions for 17 aroclor mixtures determined by 3 HRGC systems optimized for comprehensive, quantitative, congener-specific analysis. J. High Resolut. Chromatogr. 1996, 19, 657–668. [Google Scholar] [CrossRef]
  45. Zhang, R.; Wang, Y.; Zhang, Y.; Bai, Y. Distribution, sources, and health risk of polycyclic aromatic hydrocarbons in farmland soil of Helan, China. Sustainability 2023, 15, 16667. [Google Scholar] [CrossRef]
  46. Tobiszewski, M.; Namieśnik, J. PAH diagnostic ratios for the identification of pollution emission sources. Environ. Pollut. 2012, 162, 110–119. [Google Scholar] [CrossRef]
  47. Zhang, W.; Zhang, S.; Wan, C.; Yue, D.; Ye, Y.; Wang, X. Source diagnostics of polycyclic aromatic hydrocarbons in urban road runoff, dust, rain and canopy throughfall. Environ. Pollut. 2008, 153, 594–601. [Google Scholar] [CrossRef]
  48. Zhu, L.; Chen, Y.; Zhou, R. Distribution of polycyclic aromatic hydrocarbons in water, sediment and soil in drinking water resource of Zhejiang Province, China. J. Hazard. Mater. 2008, 150, 308–316. [Google Scholar] [CrossRef]
  49. Cai, Y.; Wang, X.; Wu, Y.; Li, Y.; Ya, M. Over 100-year sedimentary record of polycyclic aromatic hydrocarbons (PAHs) and organochlorine compounds (OCs) in the continental shelf of the East China Sea. Environ. Pollut. 2016, 219, 774–784. [Google Scholar] [CrossRef]
Figure 1. Map indication of all 22 soil sampling points in the investigated area.
Sustainability 16 00232 g001
Figure 2. Linear correlation between α-HCH and γ-HCH concentrations in analysed soil samples.
Sustainability 16 00232 g002
Figure 3. The cross plot of α−HCH concentration versus calculated α-HCH EF of the mixture.
Sustainability 16 00232 g003
Figure 4. The Cross plot for the isomeric ratios of ANT/(ANT + PHE) versus FLT/(FLT + PYR) in analysed soil samples.
Sustainability 16 00232 g004
Table 1. The values of the variables used for estimation of ADD, HI and CR [19,21].
Body weightBwkg70 (adult); 15 (child)
Averaging timeATdays (d)ED × 365 (non-carcinogenic), 25,550 (cancer)
Exposure frequencyEFd/y350
Exposure durationEDyear (y)24 (adult); 6 (child)
Soil ingestion rateIngRmg/d100 (adult); 200 (child)
Soil inhalation rateInhRm3/d20 (adult); 7.6 (child)
Conversion factorCFkg/mg1 × 10−6
Dermal surface exposureSAcm2/d5700 (adult); 2800 (child)
Adherence factor to skinAFmg cm20.2 (organic compound)
Dermal absorption factorABSUnitless0.1 (organic compound)
Gastrointestinal absorption factorABSGIUnitless1.0 (p,p′-DDD, p,p′-DDT, p,p′-DDE, α-HCH, γ-HCH, PCBs)
Particle emission factorPEFm3/kg1.36 × 109
Ingestion reference valuesRfDingmg/kg/d0.002 (p,p′-DDD); 5 × 10⁻⁴ (p,p′-DDT); 0.008 (α-HCH); 3 × 10⁻⁴ (γ-HCH); 2.75 (BaP)
Dermal reference valuesRfDdermalmg/kg/d0.002 (p,p′-DDD); 5 × 10⁻⁴ (p,p′-DDT); 0.008 (α-HCH); 3 × 10⁻⁴ (γ-HCH),
Carcinogenic slope factor via ingestionCSFing1/(mg/kg/d)0.24 (p,p′-DDD); 0.34 (p,p′-DDT); 0.34 (p,p′-DDE); 6.3 (α-HCH); 1.1 (γ-HCH); 7.3 (BaP); 2.0 (PCBs)
Dermal contact factorCSFdermal1/(mg/kg/d)0.24 (p,p′-DDD); 0.34 (p,p′-DDT); 0.34 (p,p′-DDE); 6.3 (α-HCH); 1.1 (γ-HCH); 25 (BaP); 2.22 PCB
Inhalation unit riskCSFinhalmg/m30.069 (p,p′-DDD); 0.097 (p,p′-DDT); 0.097 (p,p′-DDE); 1.8 (α-HCH); 0.31 (γ-HCH); 3.85 (BaP); 0.57 (PCBs),
Toxic equivalent factor of PAHTEF BaPunitless0.001 (NAP, ACY, ACE, FL, PHE, FLT, PYR); 0.01 (ANT, CHR, BghiP); 0.1 (BaA, BbF, BkF, IND); 1 (BaP, DahA)
Table 2. The concentration of total OCPs (ng/g dw), HCH-, DDT-, heptachlor-cyclodiene residue and values of isomeric ratios obtained in analysed soil samples.
Sample CodeTotal OCPsHCH DDTHeptachlorCyclodiene DDT/
HCH
α-HCH/
γ-HCH
DDE + DDD
/∑DDT
DDE/
DDD
o,p′-DDT/
p,p′-DDT
P125.623.754.4414.942.492.711.003.99-0.27
P231.7911.847.630.349.770.760.926.710.670.18
P329.575.962.118.173.440.801.110.91-0.28
P460.668.903.8829.417.270.770.593.97-0.30
P553.3215.33.4128.110.510.231.260.791.540.74
P6106.4718.4519.1841.1422.41.670.642.81-0.68
P7133.9711.6155.7920.7341.2120.000.791.79-0.73
P838.598.265.0420.244.321.000.453.270.180.46
P964.1518.254.9826.7412.950.450.701.100.110.39
P1028.225.024.0216.351.880.891.150.61-0.54
P1128.215.302.0516.733.140.710.810.86-0.36
P1263.669.7017.2419.8215.92.330.522.16-0.81
P1387.6514.1111.8943.9916.110.371.092.52-0.36
P14125.609.5332.3327.4452.056.531.121.63-0.76
P15139.3117.0215.6749.3353.731.260.354.12-0.28
P1645.129.702.0730.75nd0.251.000.29--
P1732.975.011.5918.934.710.471.383.97--
P1879.6219.8114.0836.339.401.000.533.99--
P19111.2910.4839.3724.2227.775.621.084.150.17-
P2074.7023.0310.9628.8510.571.071.093.98-0.22
P2162.9114.167.0532.76.600.970.774.280.970.84
P2230.125.230.6515.776.900.221.680.76--
“-“ not calculated.
Table 3. The concentration of total PAHs (ng/g), ∑Comb (ng/g), %∑Comb of PAHs and values of isomeric ratios obtained in analysed soil samples.
Sample CodeTotal PAHComb%∑Comb of PAHsLMW/
HMW
FL/
(FL + PYR)
ANT/
(ANT + PHEN)
FLT/
(FLT + PYR)
P1168.74166.398.560.0150.0080.450.63
P2451.8544798.930.0110.0020.350.62
P39.588.9793.650.0680.0430.250.58
P418.1817.0393.690.0670.0710.500.59
P526.1725.7698.420.0160.0410.400.36
P662.6160.6092.360.0830.0010.400.54
P76.494.8674.800.3370.4340.420.58
P887.0884.7597.330.0270.0030.300.61
P95.534.1875.720.3200.6160.550.48
P1012.1712.0398.820.0120.0260.400.43
P114.864.7798.210.0180.2950.290.77
P1294.0985.7991.170.0970.0200.430.63
P1352.0350.5797.210.0290.0110.280.67
P1415.0213.1687.520.1430.0970.440.69
P1516.4515.3293.040.0750.0280.440.49
P162.992.2976.360.3100.4580.310.58
P176.445.3883.690.1980.9010.400.44
P1824.3721.8989.830.1130.0390.460.59
P1934.8532.8494.210.0610.0010.400.55
P20108.59106.7598.300.0170.0070.480.57
P2126.8925.8196.030.0410.0580.280.72
P2228.3327.2296.130.0400.0710.320.68
Table 4. Non-cancer (HI) and carcinogenic risks (CR) (unitless) derived from exposure to target pollutants.
CompoundHIAdultHIChildCancer RiskAdultCancer RiskChild
MinMaxMinMaxMinMaxMinMax
α-HCH0.15 × 10−51.15 × 10−50.16 × 10−51.18 × 10−57.80 × 10−857.93 × 10−88.05 × 10−859.78 × 10⁻⁸
γ-HCH4.12 × 10−54.62 × 10−44.26 × 10−54.77 × 10−41.36 × 10−815.26 × 10−81.41 × 10−81.57 × 10⁻⁷
DDD0.21 × 10−52.7 × 10−40.21 × 10−52.78 × 10−41.10 × 10−81.40 × 10−60.10 × 10−81.33 × 10⁻⁷
DDE-----8.78 × 10⁻⁸-0.90 × 10⁻⁷
DDT0.31 × 10−51.96 × 10−4042 × 10−52.63 × 10−40.17 × 10−81.02 × 10−70.17 × 10−81.06 × 10⁻⁷
16PAH0.31 × 10−816.04 × 10−80.10 × 10−85.29 × 10−85.56 × 10−82.89 × 10−61.80 × 10−79.37 × 10⁻⁶
12PCB----0.67 × 10−81.49 × 10−60.70 × 10−81.569 × 10−6
“-“ not calculated.
Table 5. Carcinogenic risk CR derived under different exposure scenarios (Average value).
Carcinogenic Risk CR α-HCHγ-HCHDDDDDT16PAH12PCB
Ingestion (×10−8)Adult25.025.681.110.946.2525.15
Child22.085.020.980.8324.0522.19
Dermal (×10−8)Adult2.760.630.1250.1054.473.08
Child6.591.500.2950.24510.687.35
Inhalation (×10−12)Adult1.050.180.0450.040.921.05
Child1.880.420.0850.071.641.88
Disclaimer/Publisher’s Note: The statements, opinions and data contained in all publications are solely those of the individual author(s) and contributor(s) and not of MDPI and/or the editor(s). MDPI and/or the editor(s) disclaim responsibility for any injury to people or property resulting from any ideas, methods, instructions or products referred to in the content.

