
Street Design Strategies Based on Spatial Configurations and Building External Envelopes in Relation to Outdoor Thermal Comfort in Arid Climates


 ,
,  , ,
, ,
Abstract
:1. Introduction
- (1)
- How do variations in the H/W aspect ratio, street canyon orientation, and building external materials interact to impact outdoor thermal comfort at different levels in arid climates?
- (2)
- What spatial configurations and parametric details should be considered to achieve appropriate thermal comfort ranges within urban canyons?
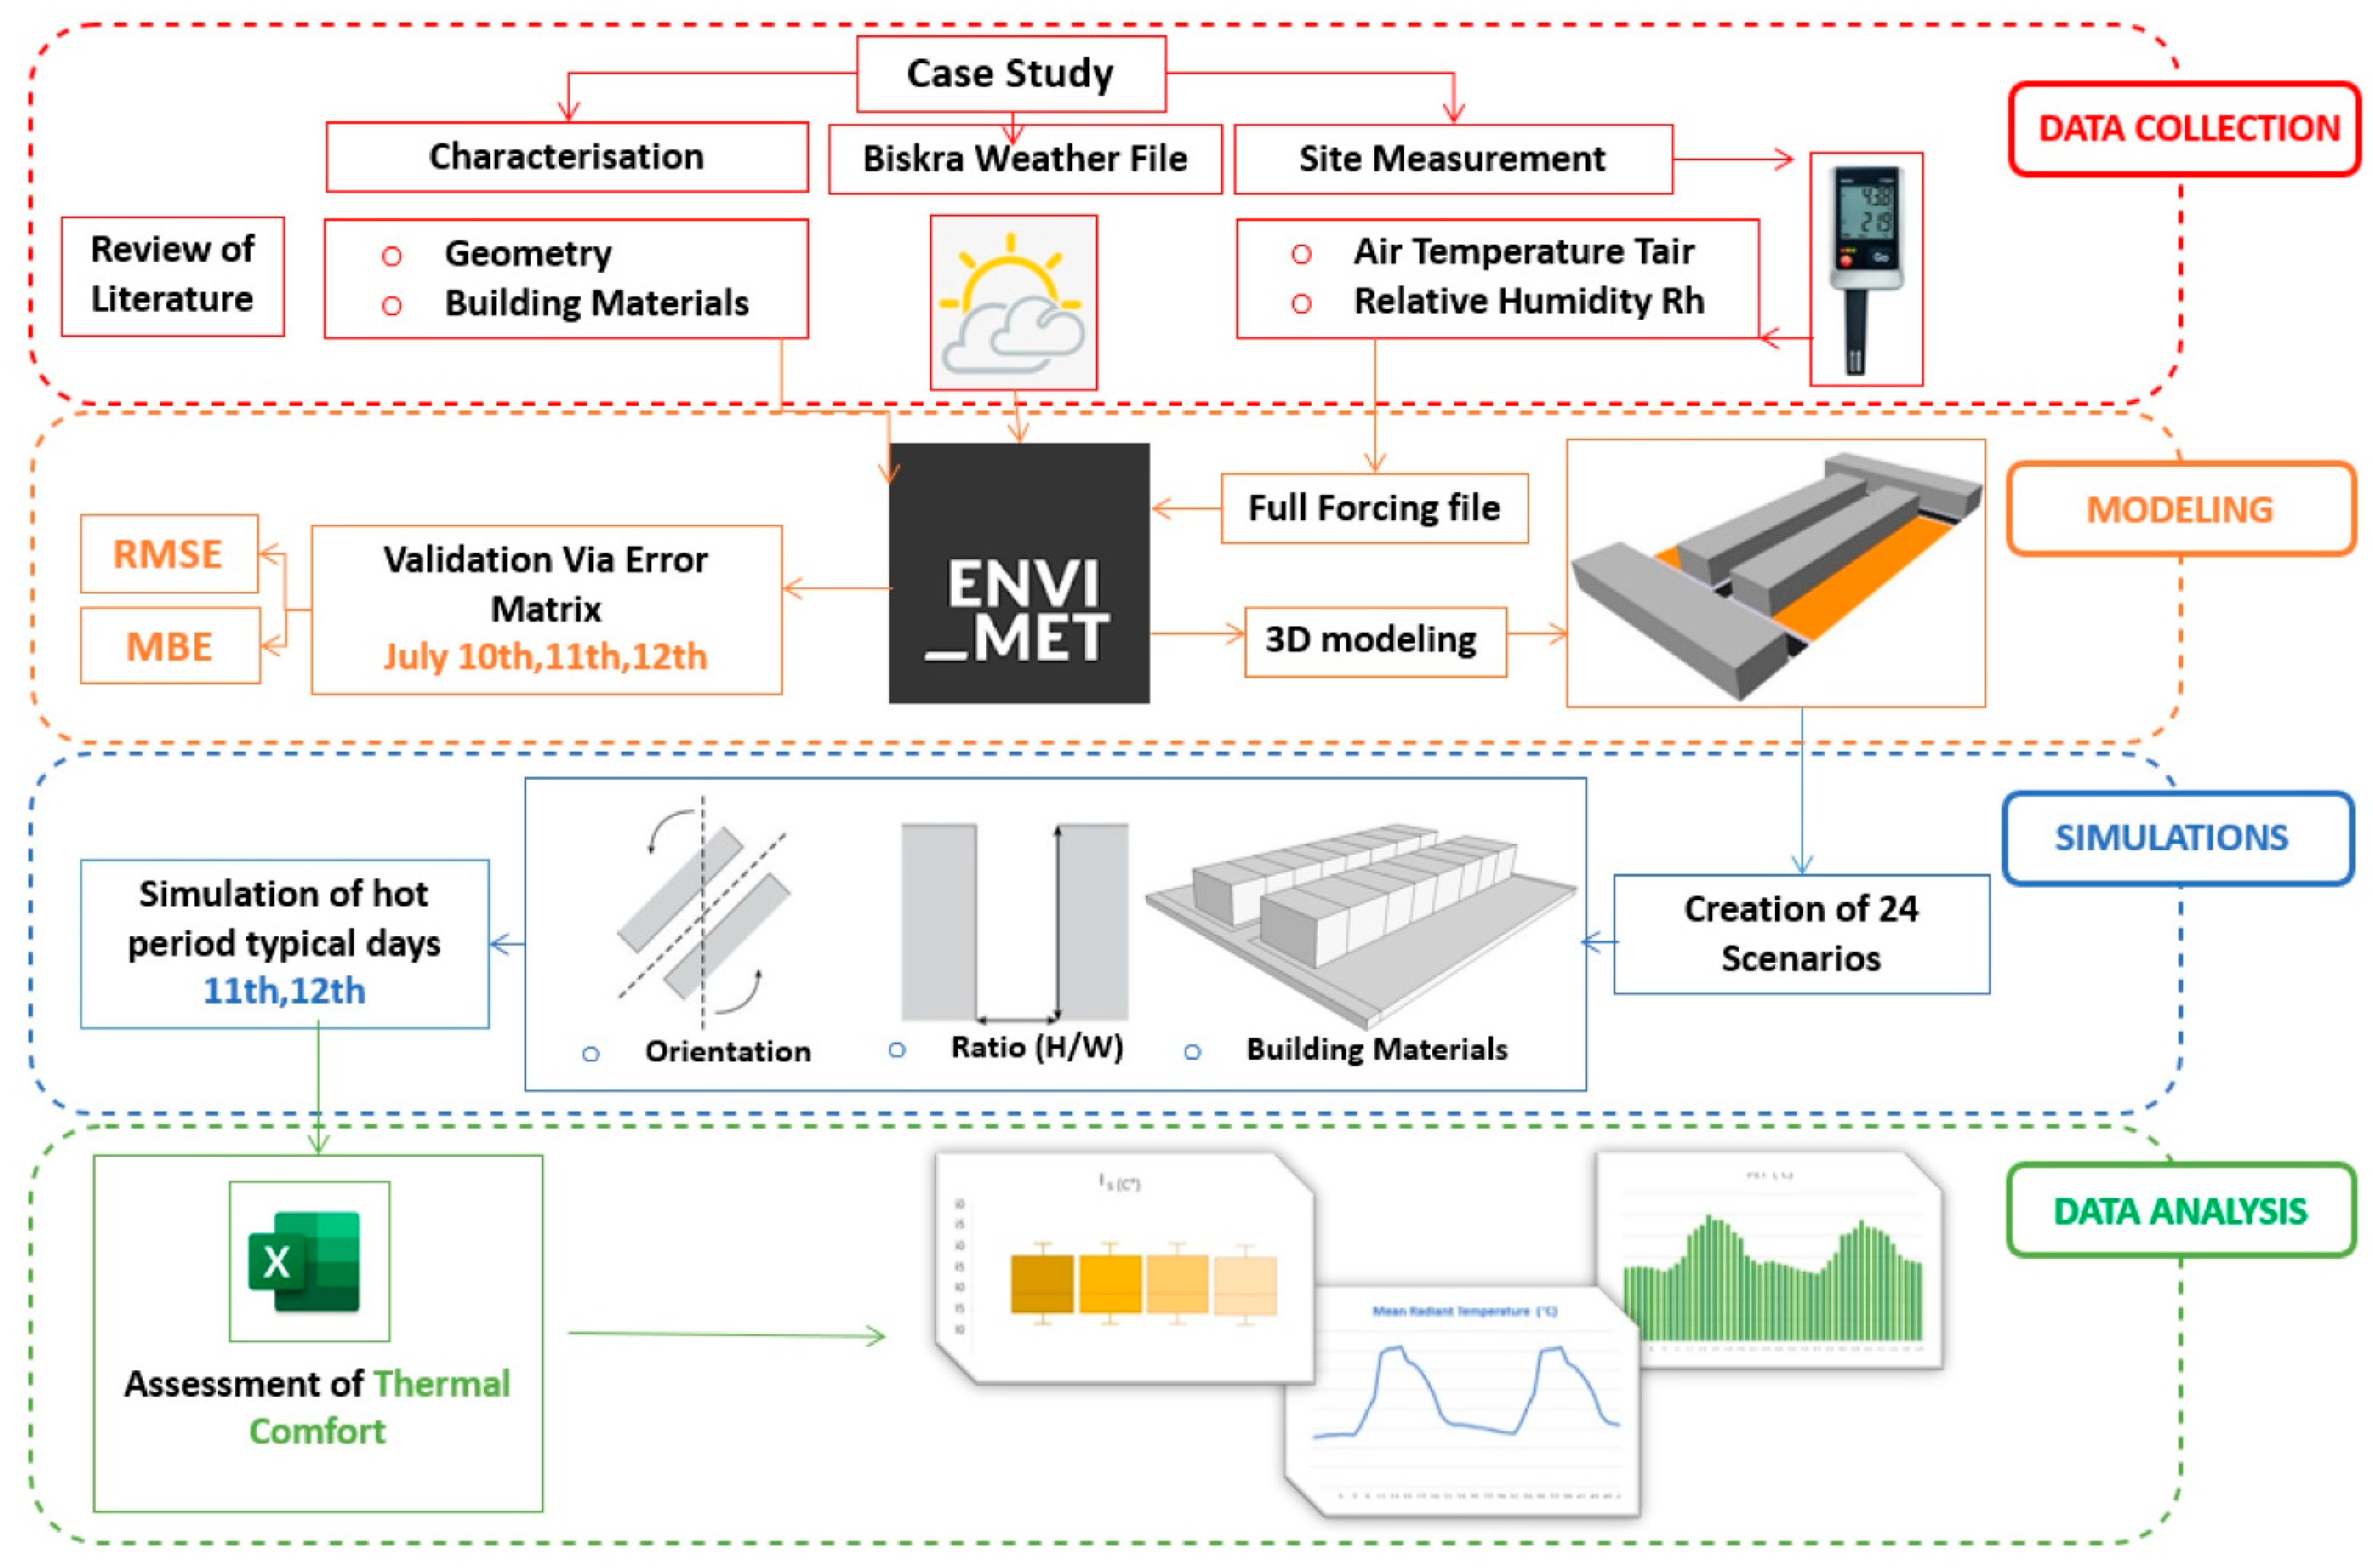
2. Materials and Methods
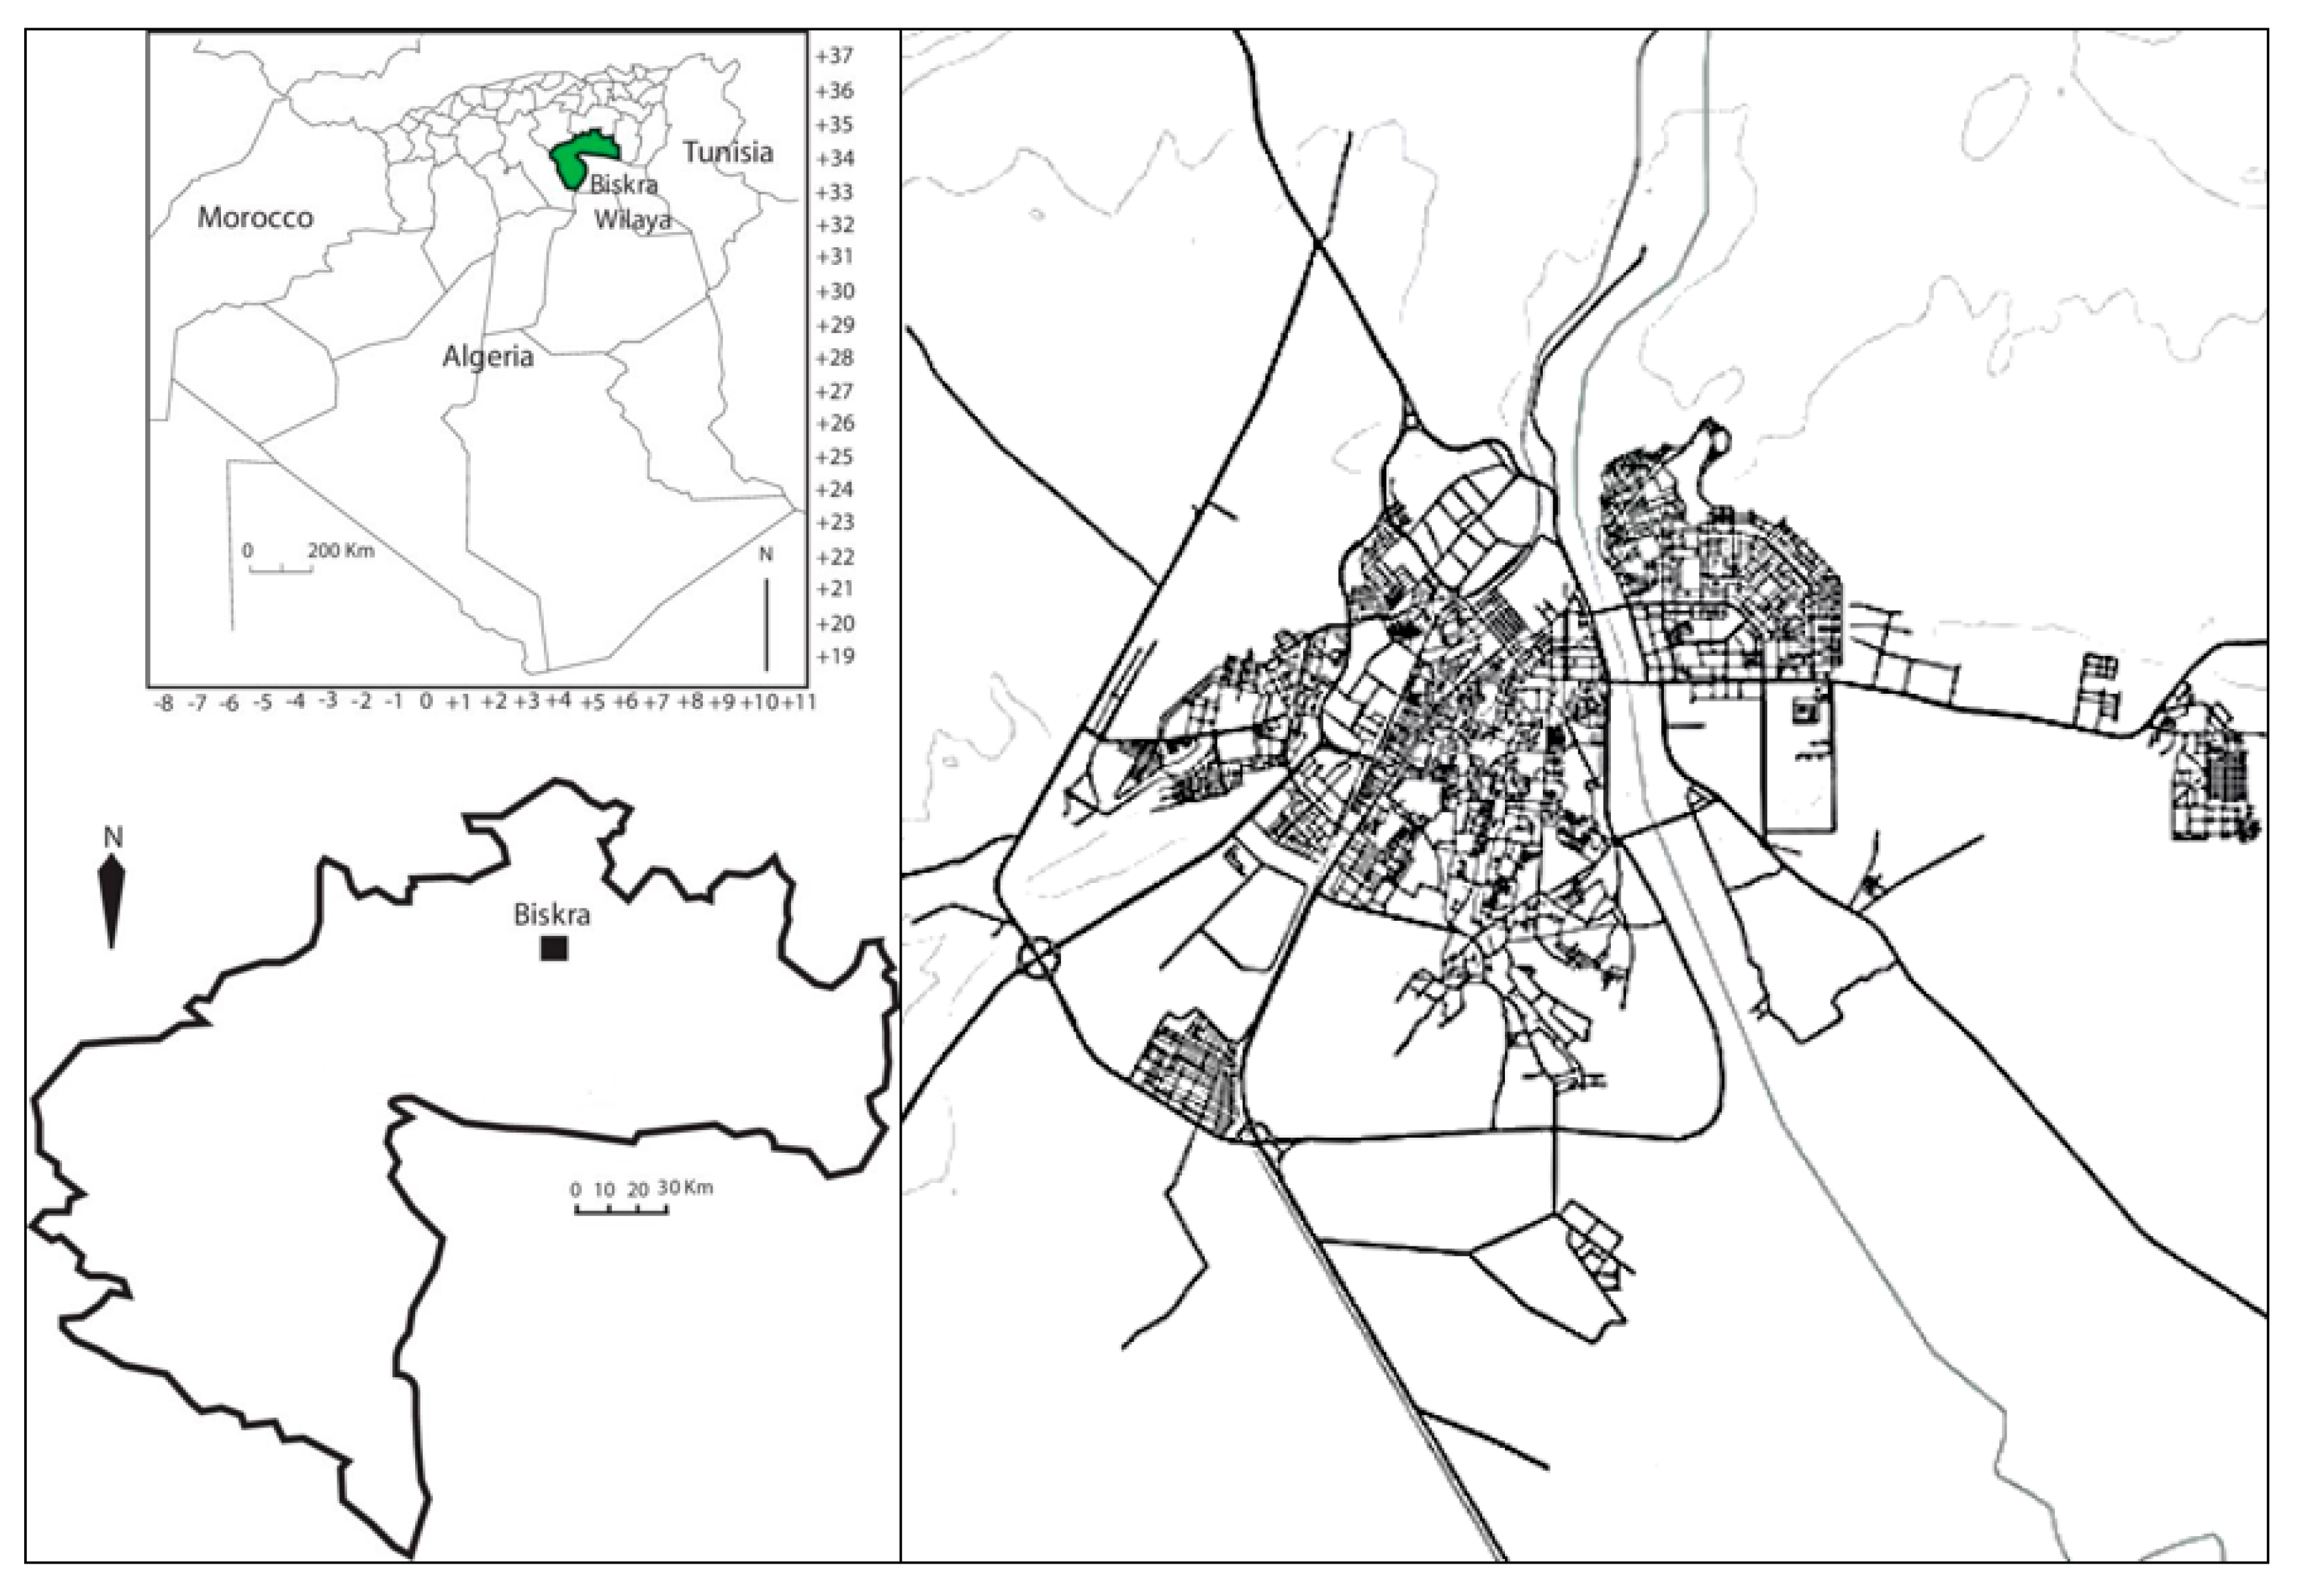
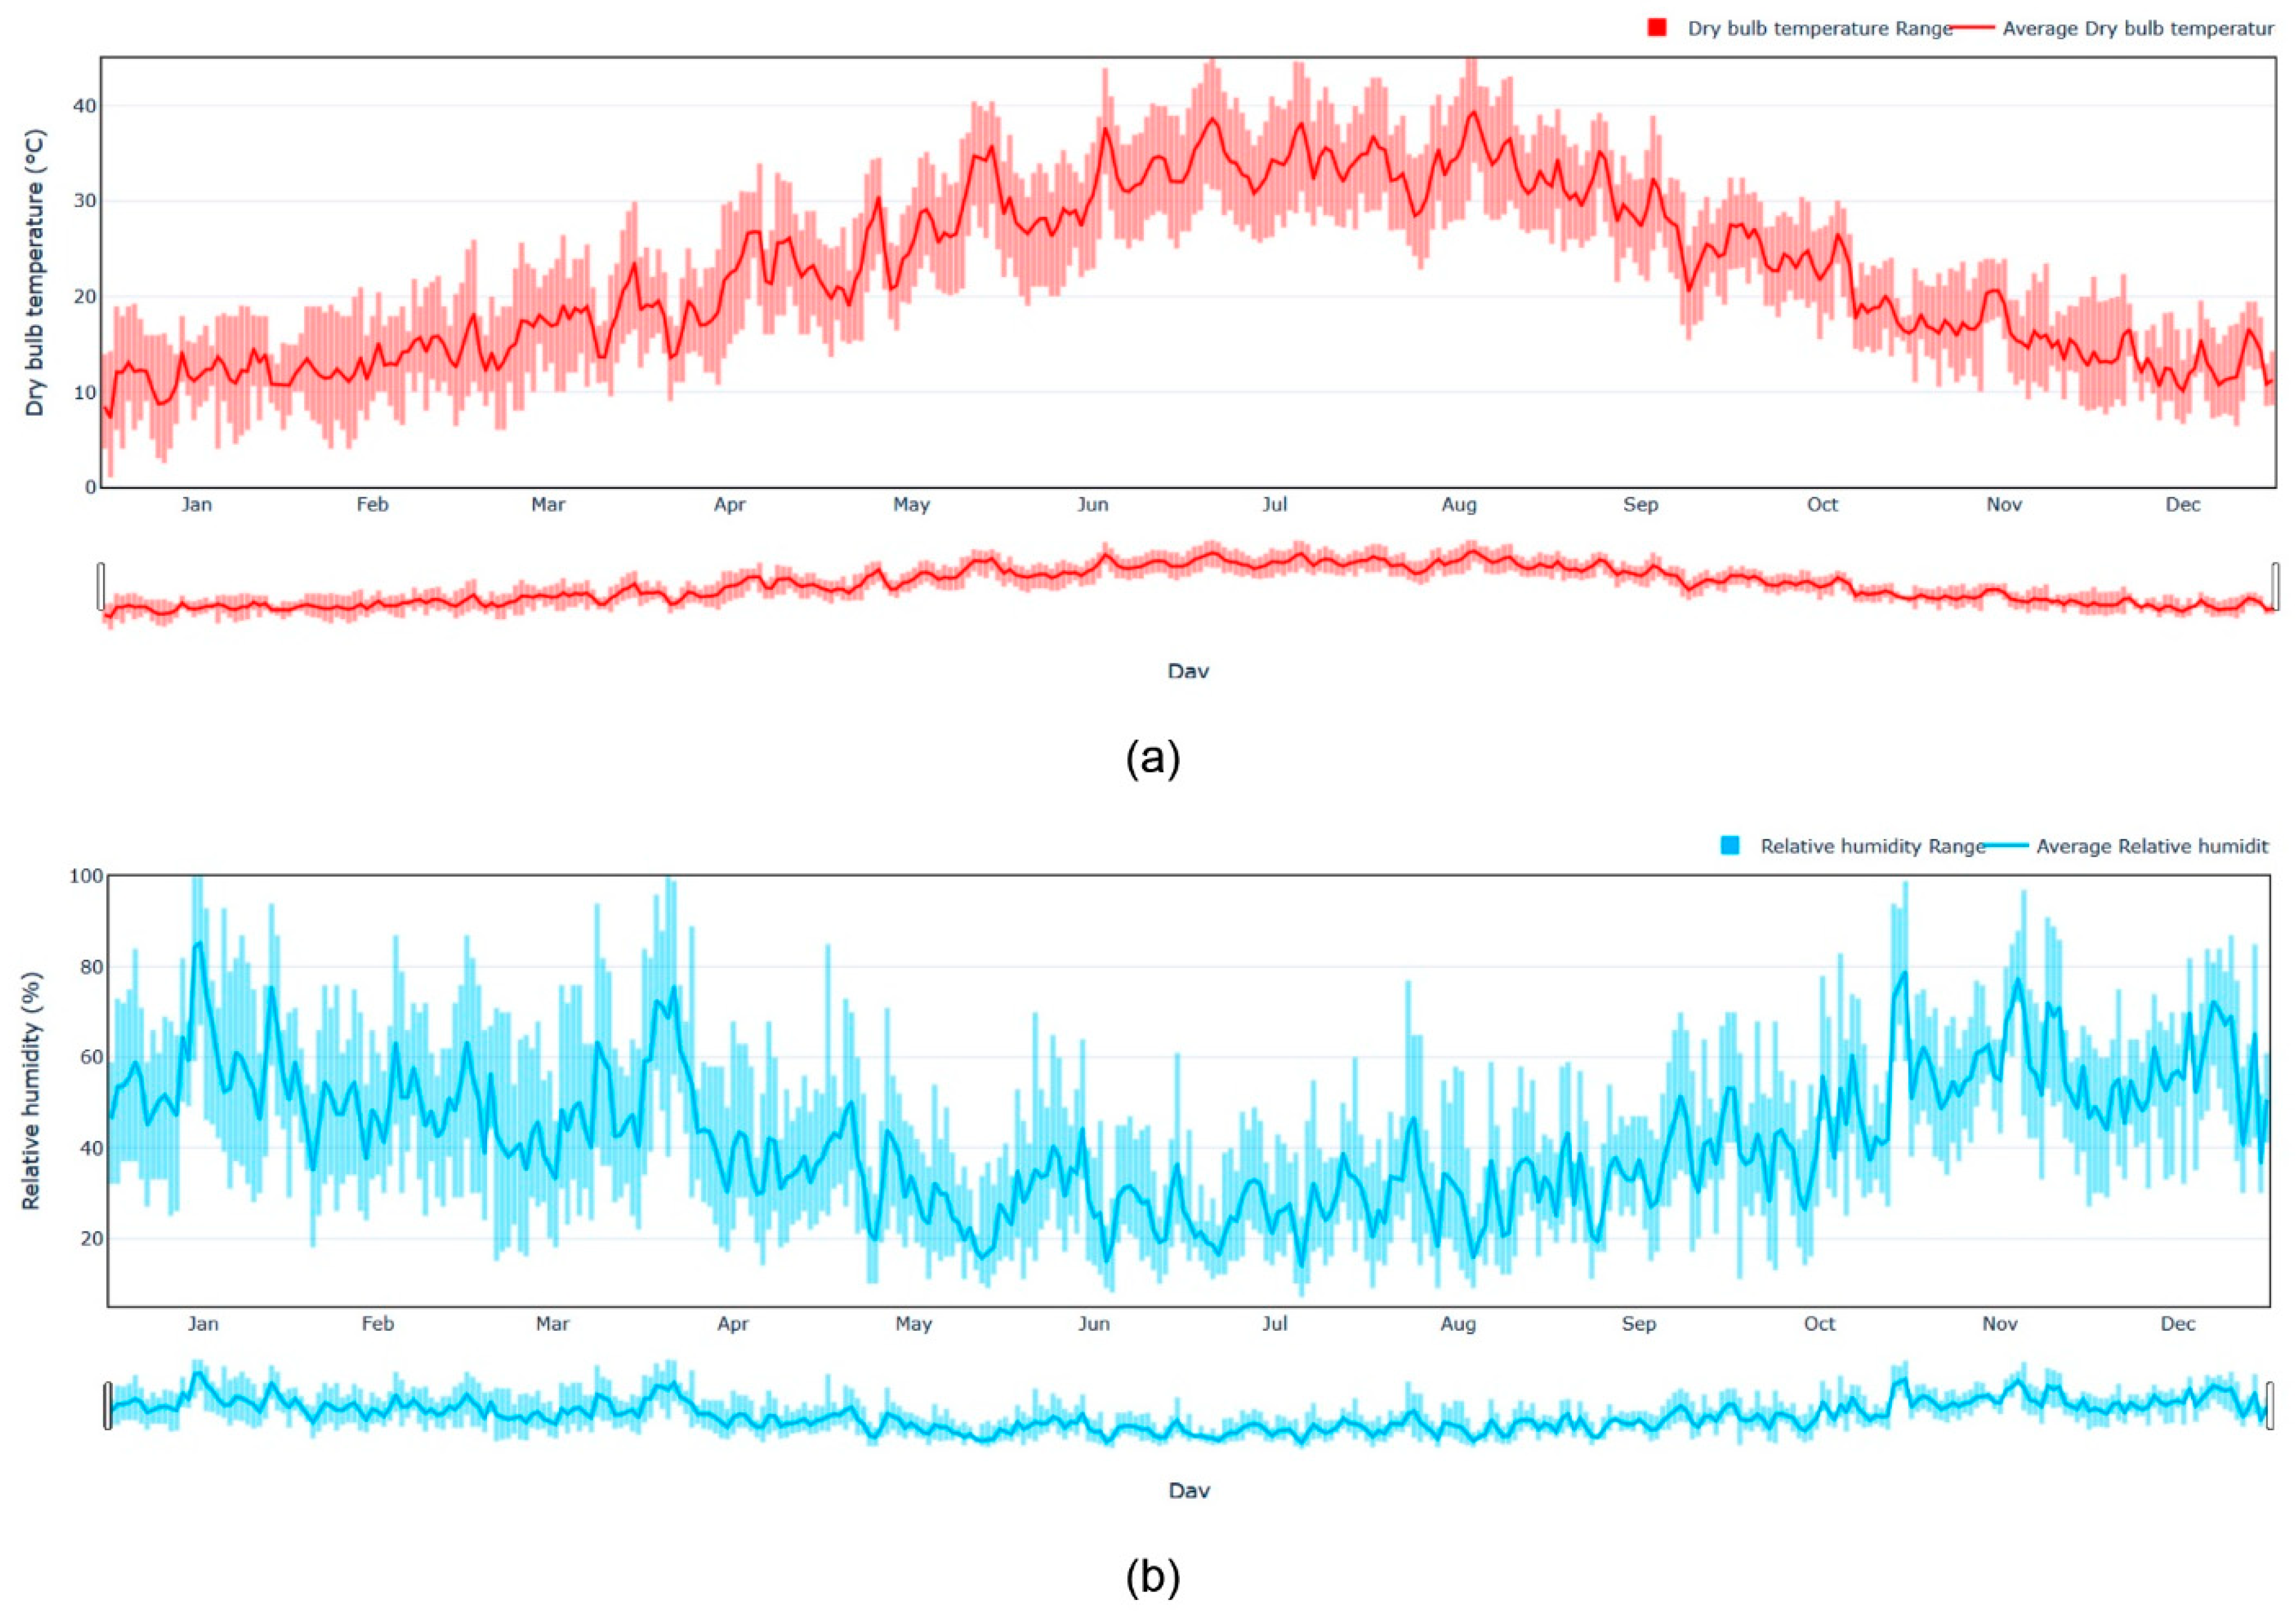
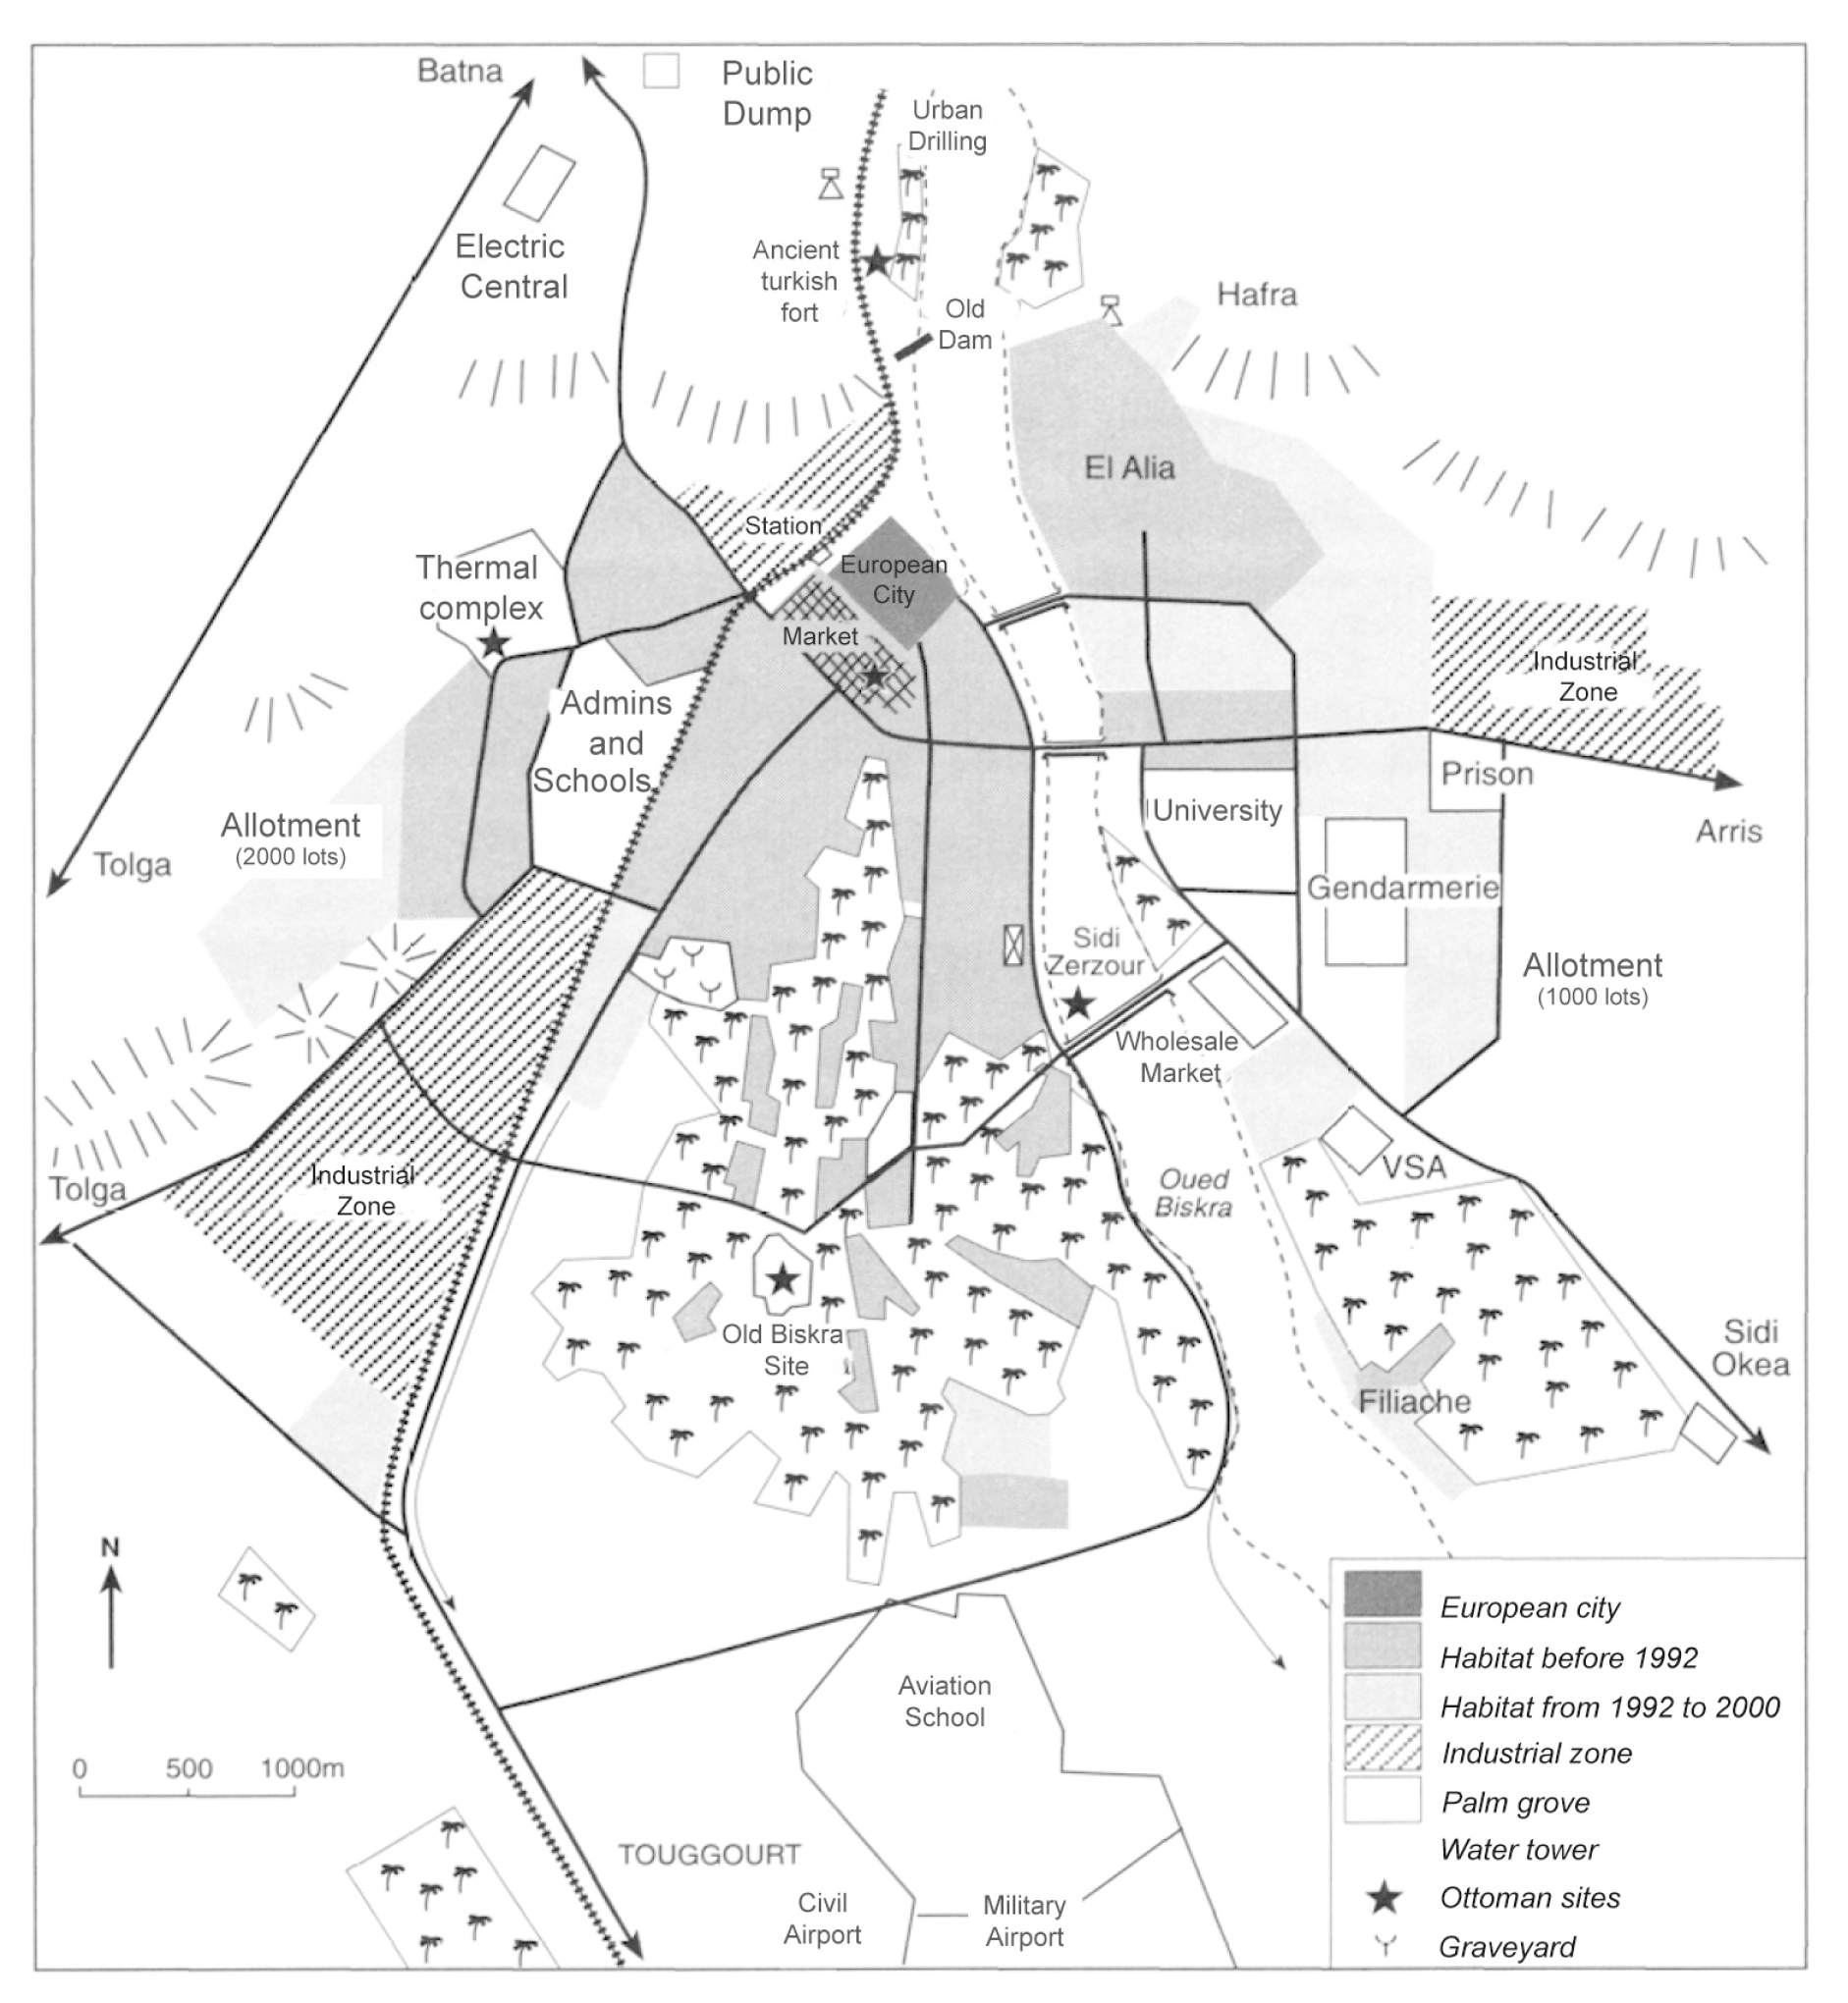
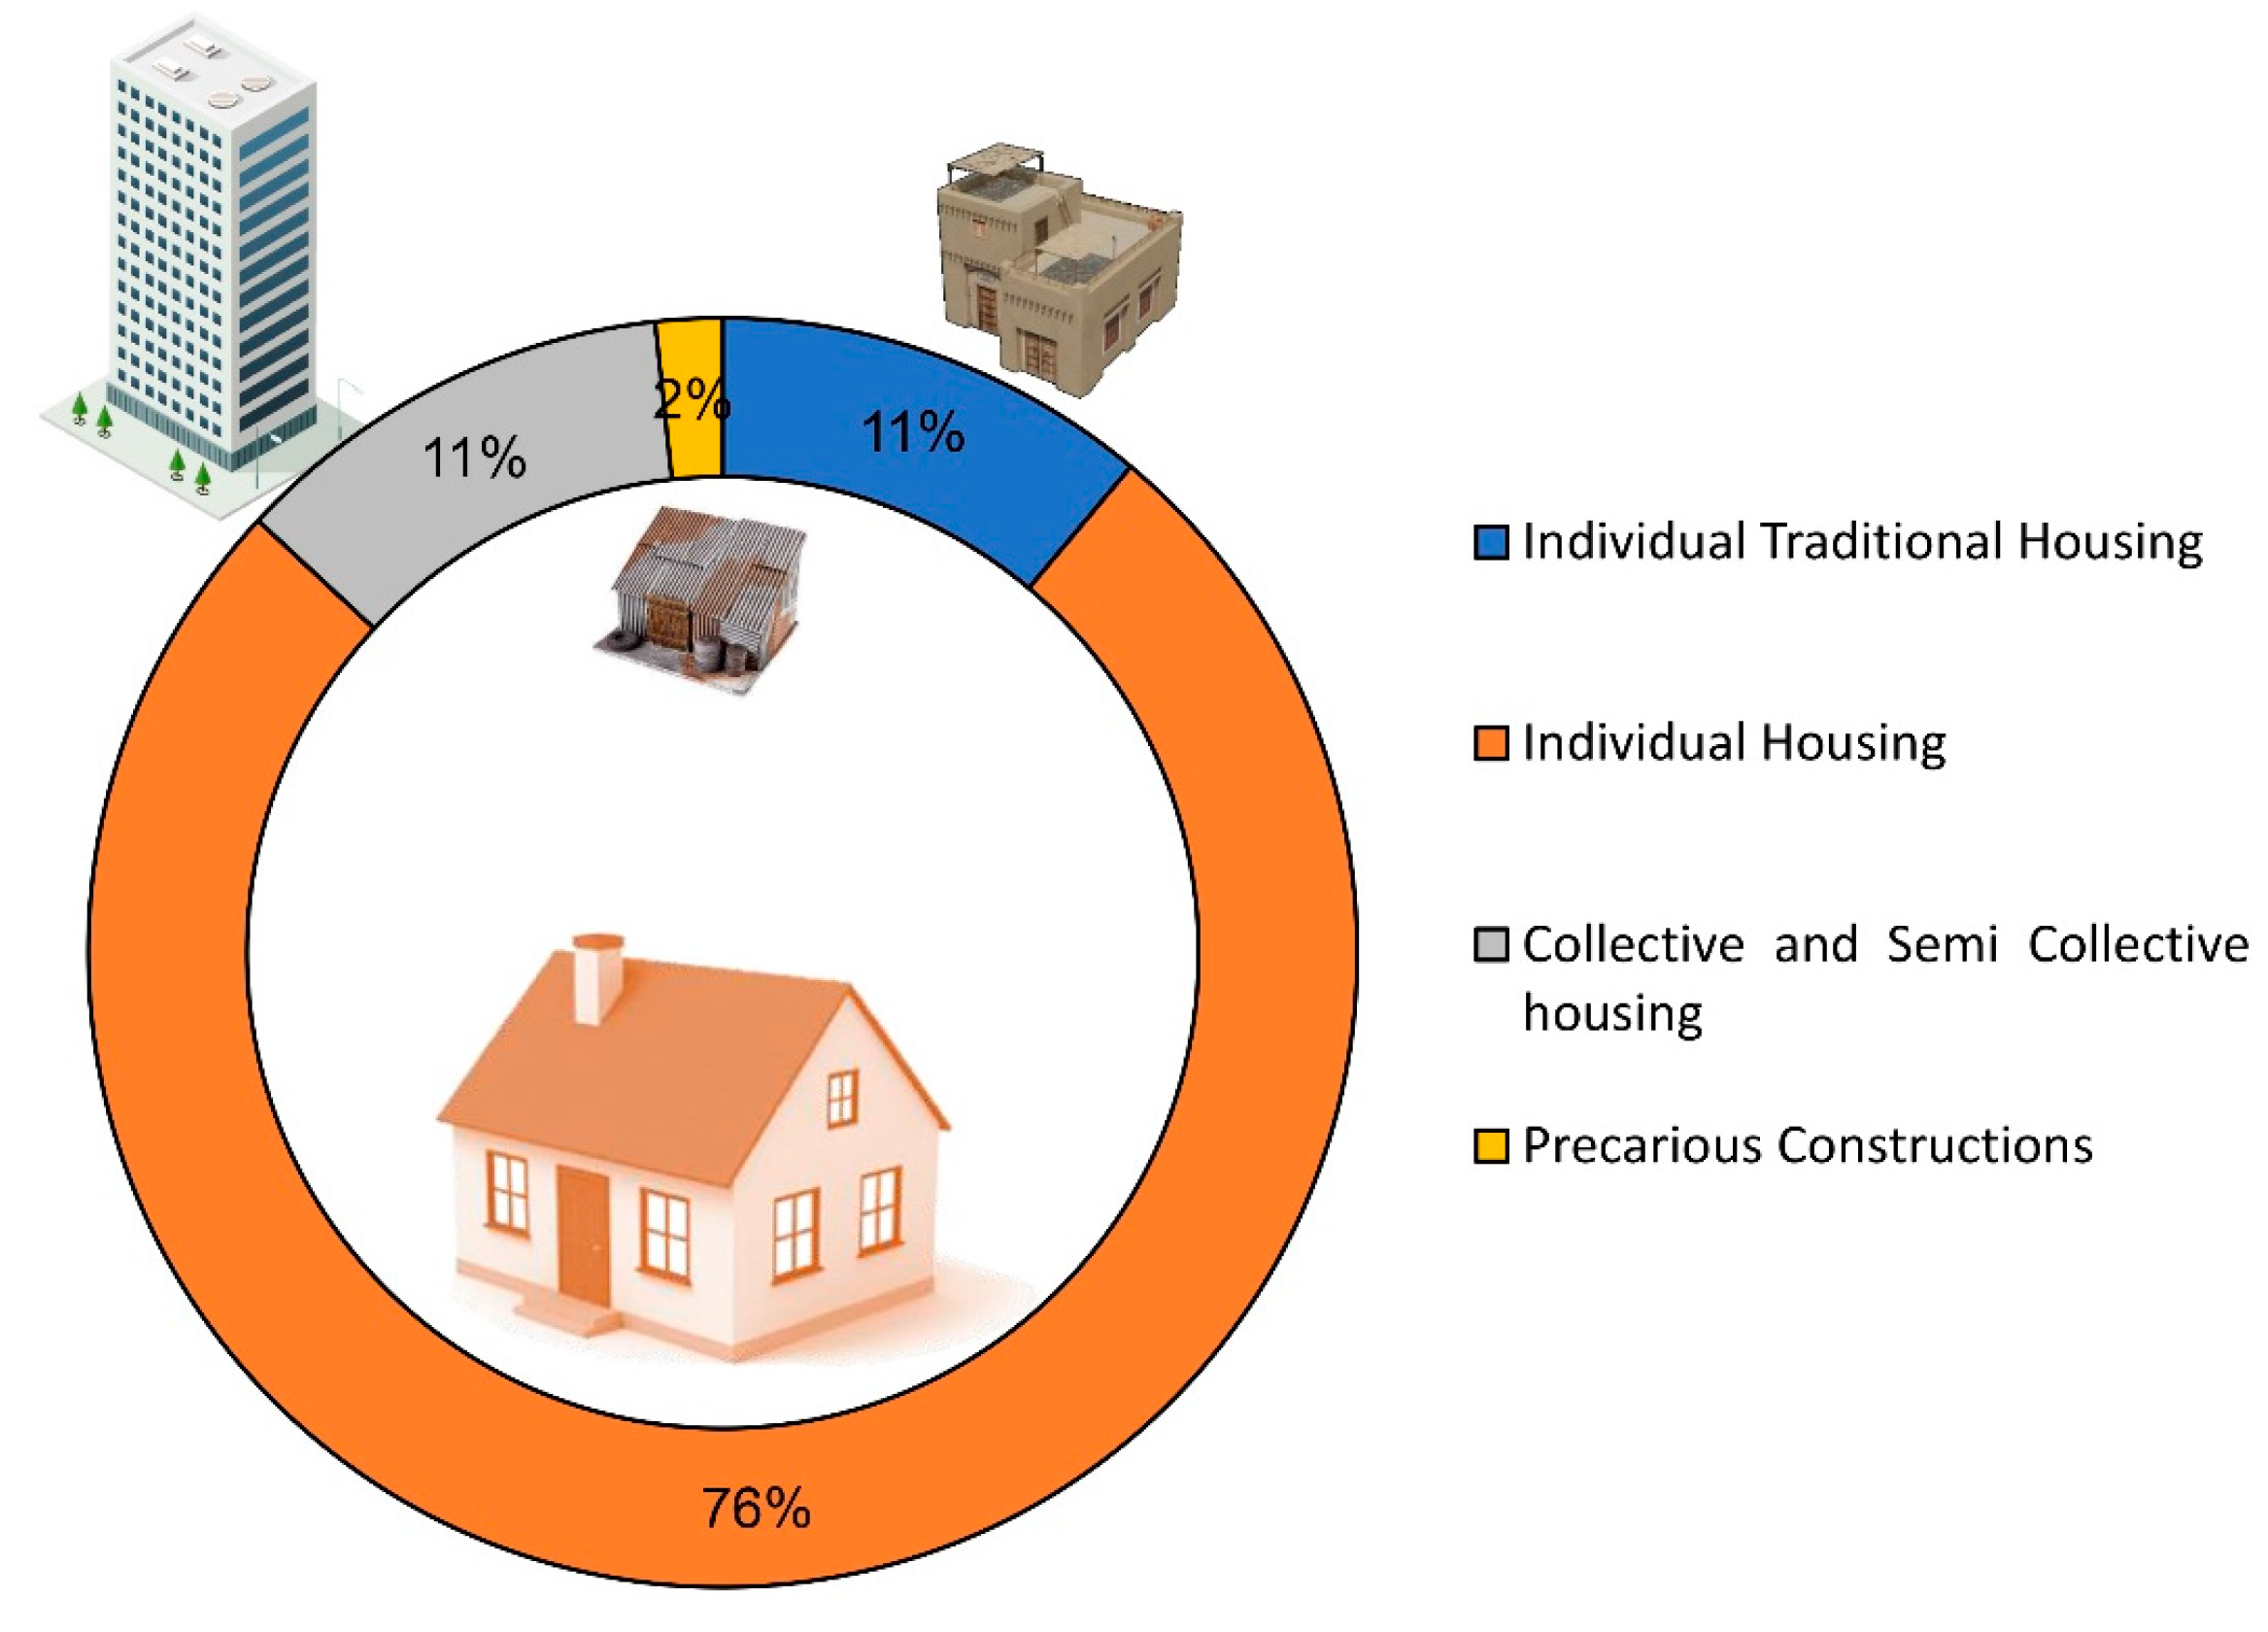
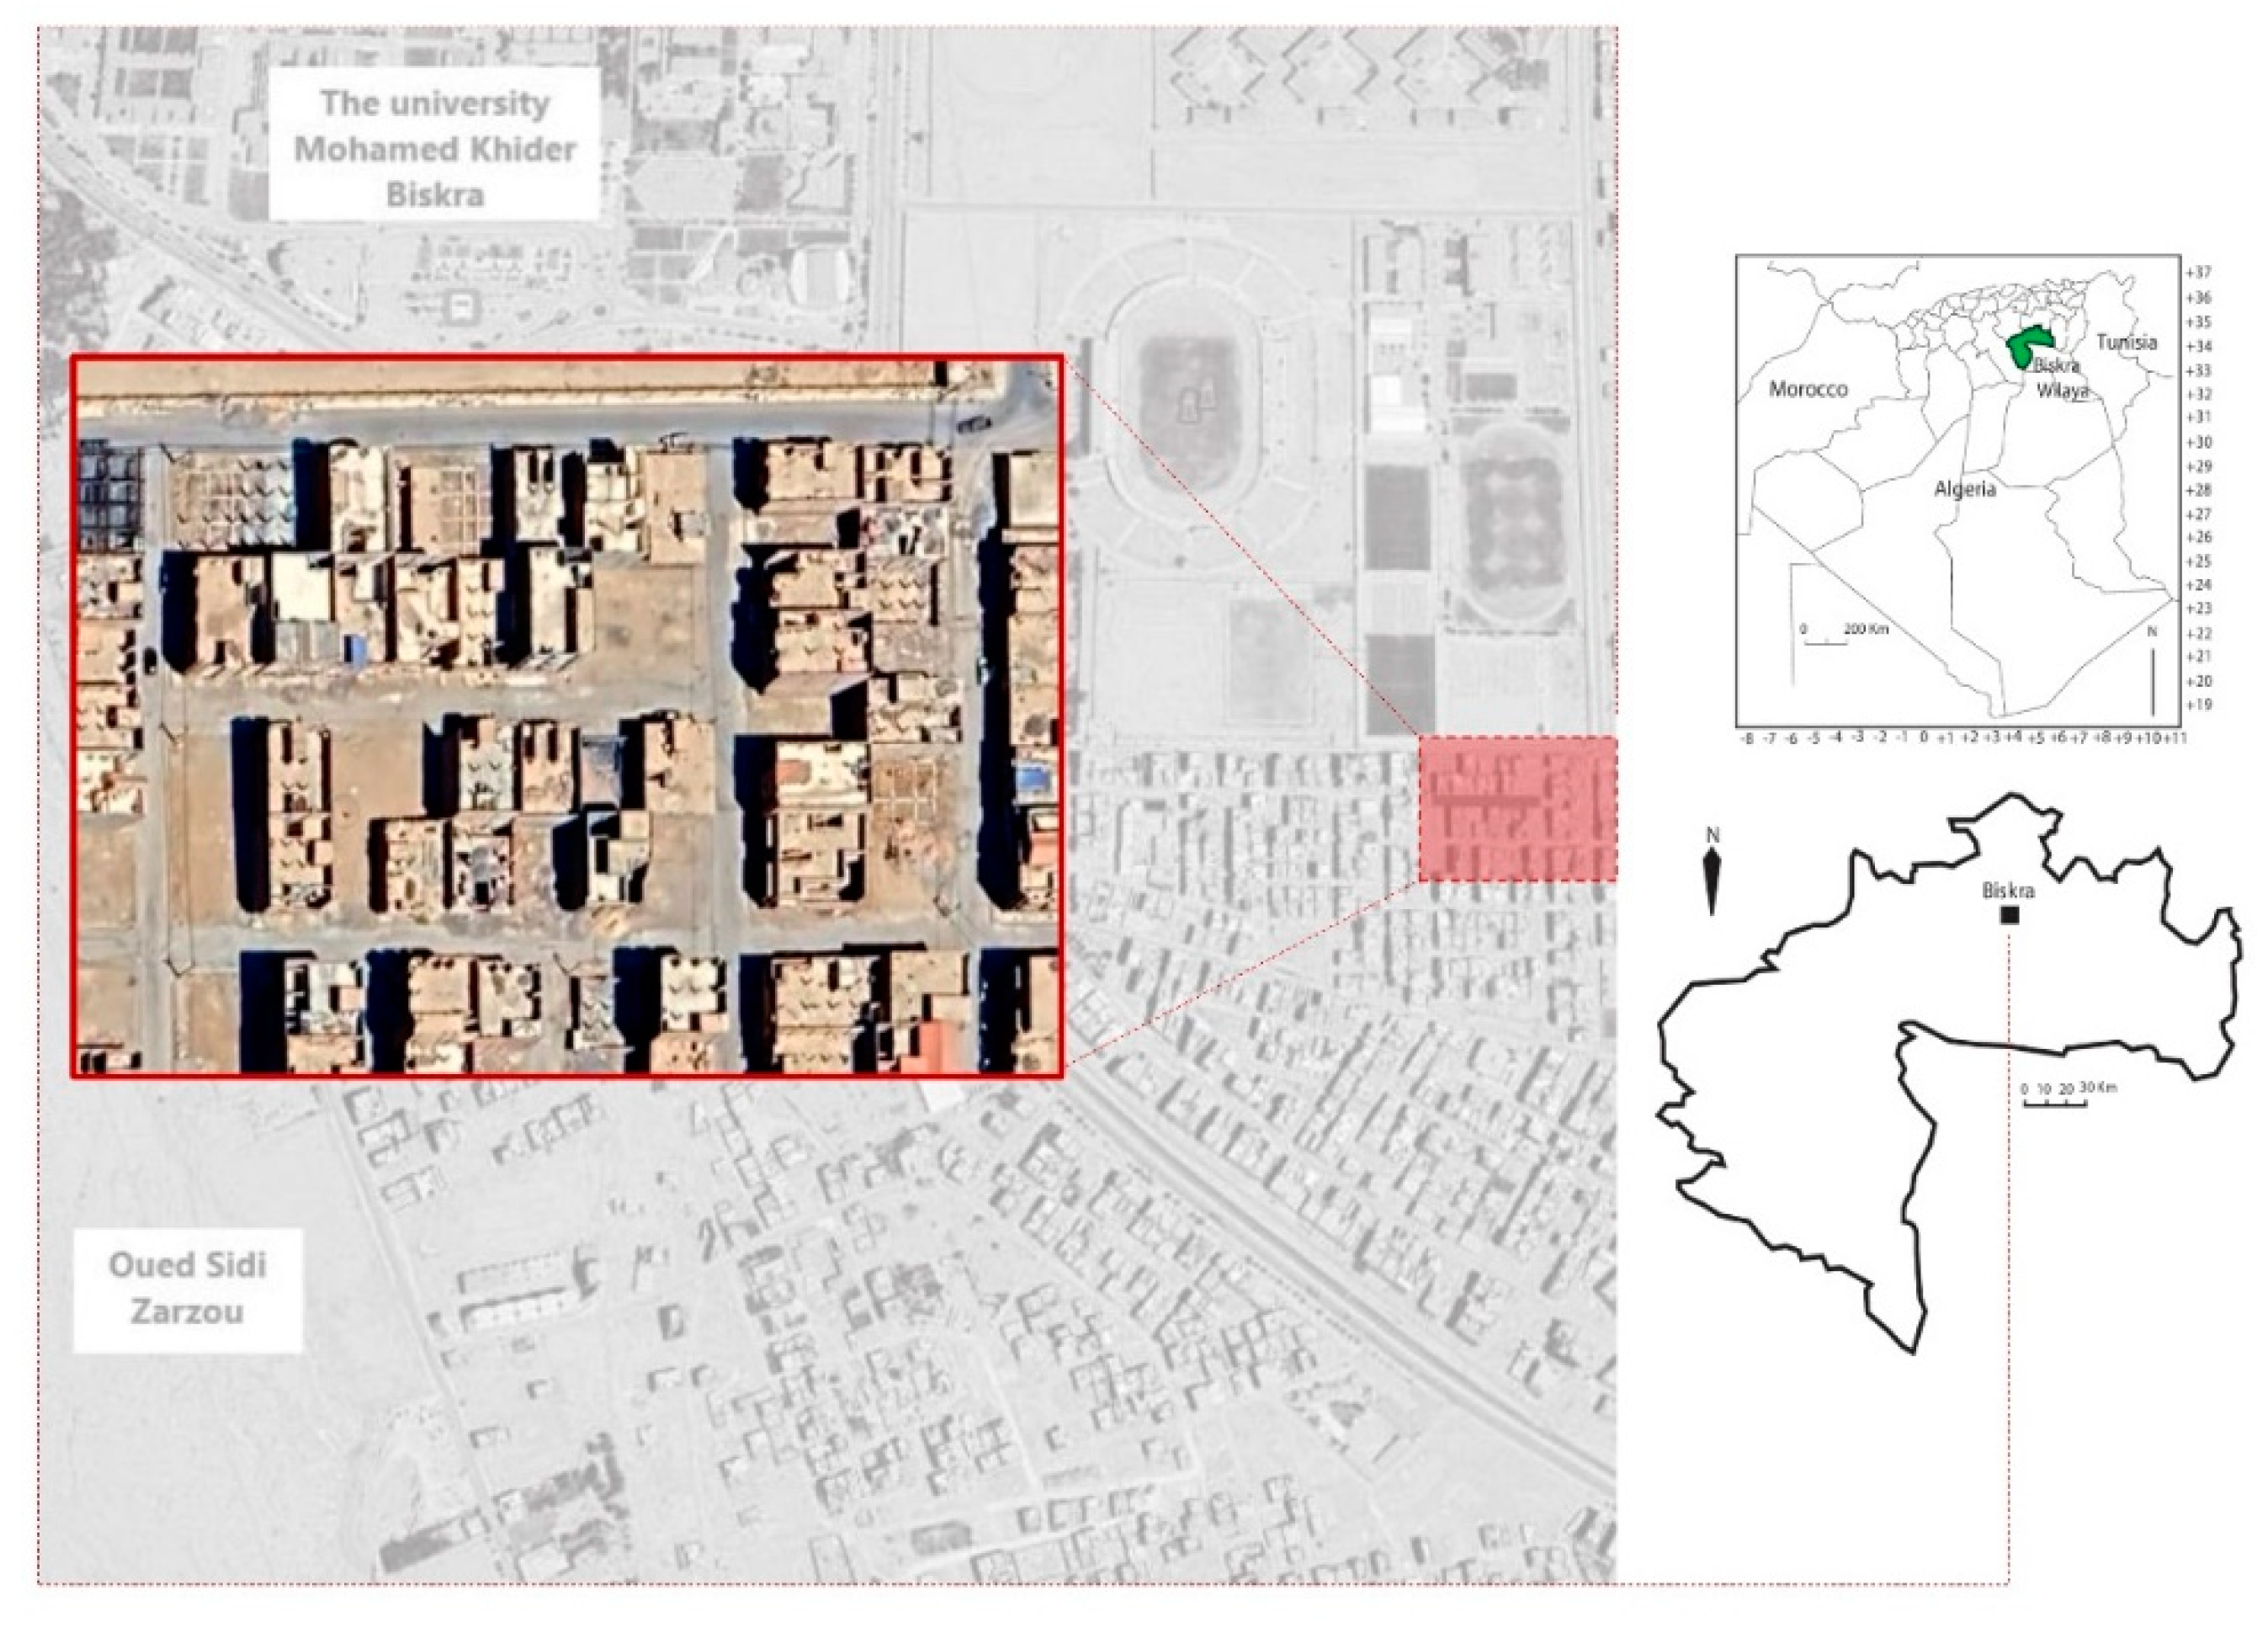
2.1. Site Fields
Characterization of the Biskra City Housing Sector
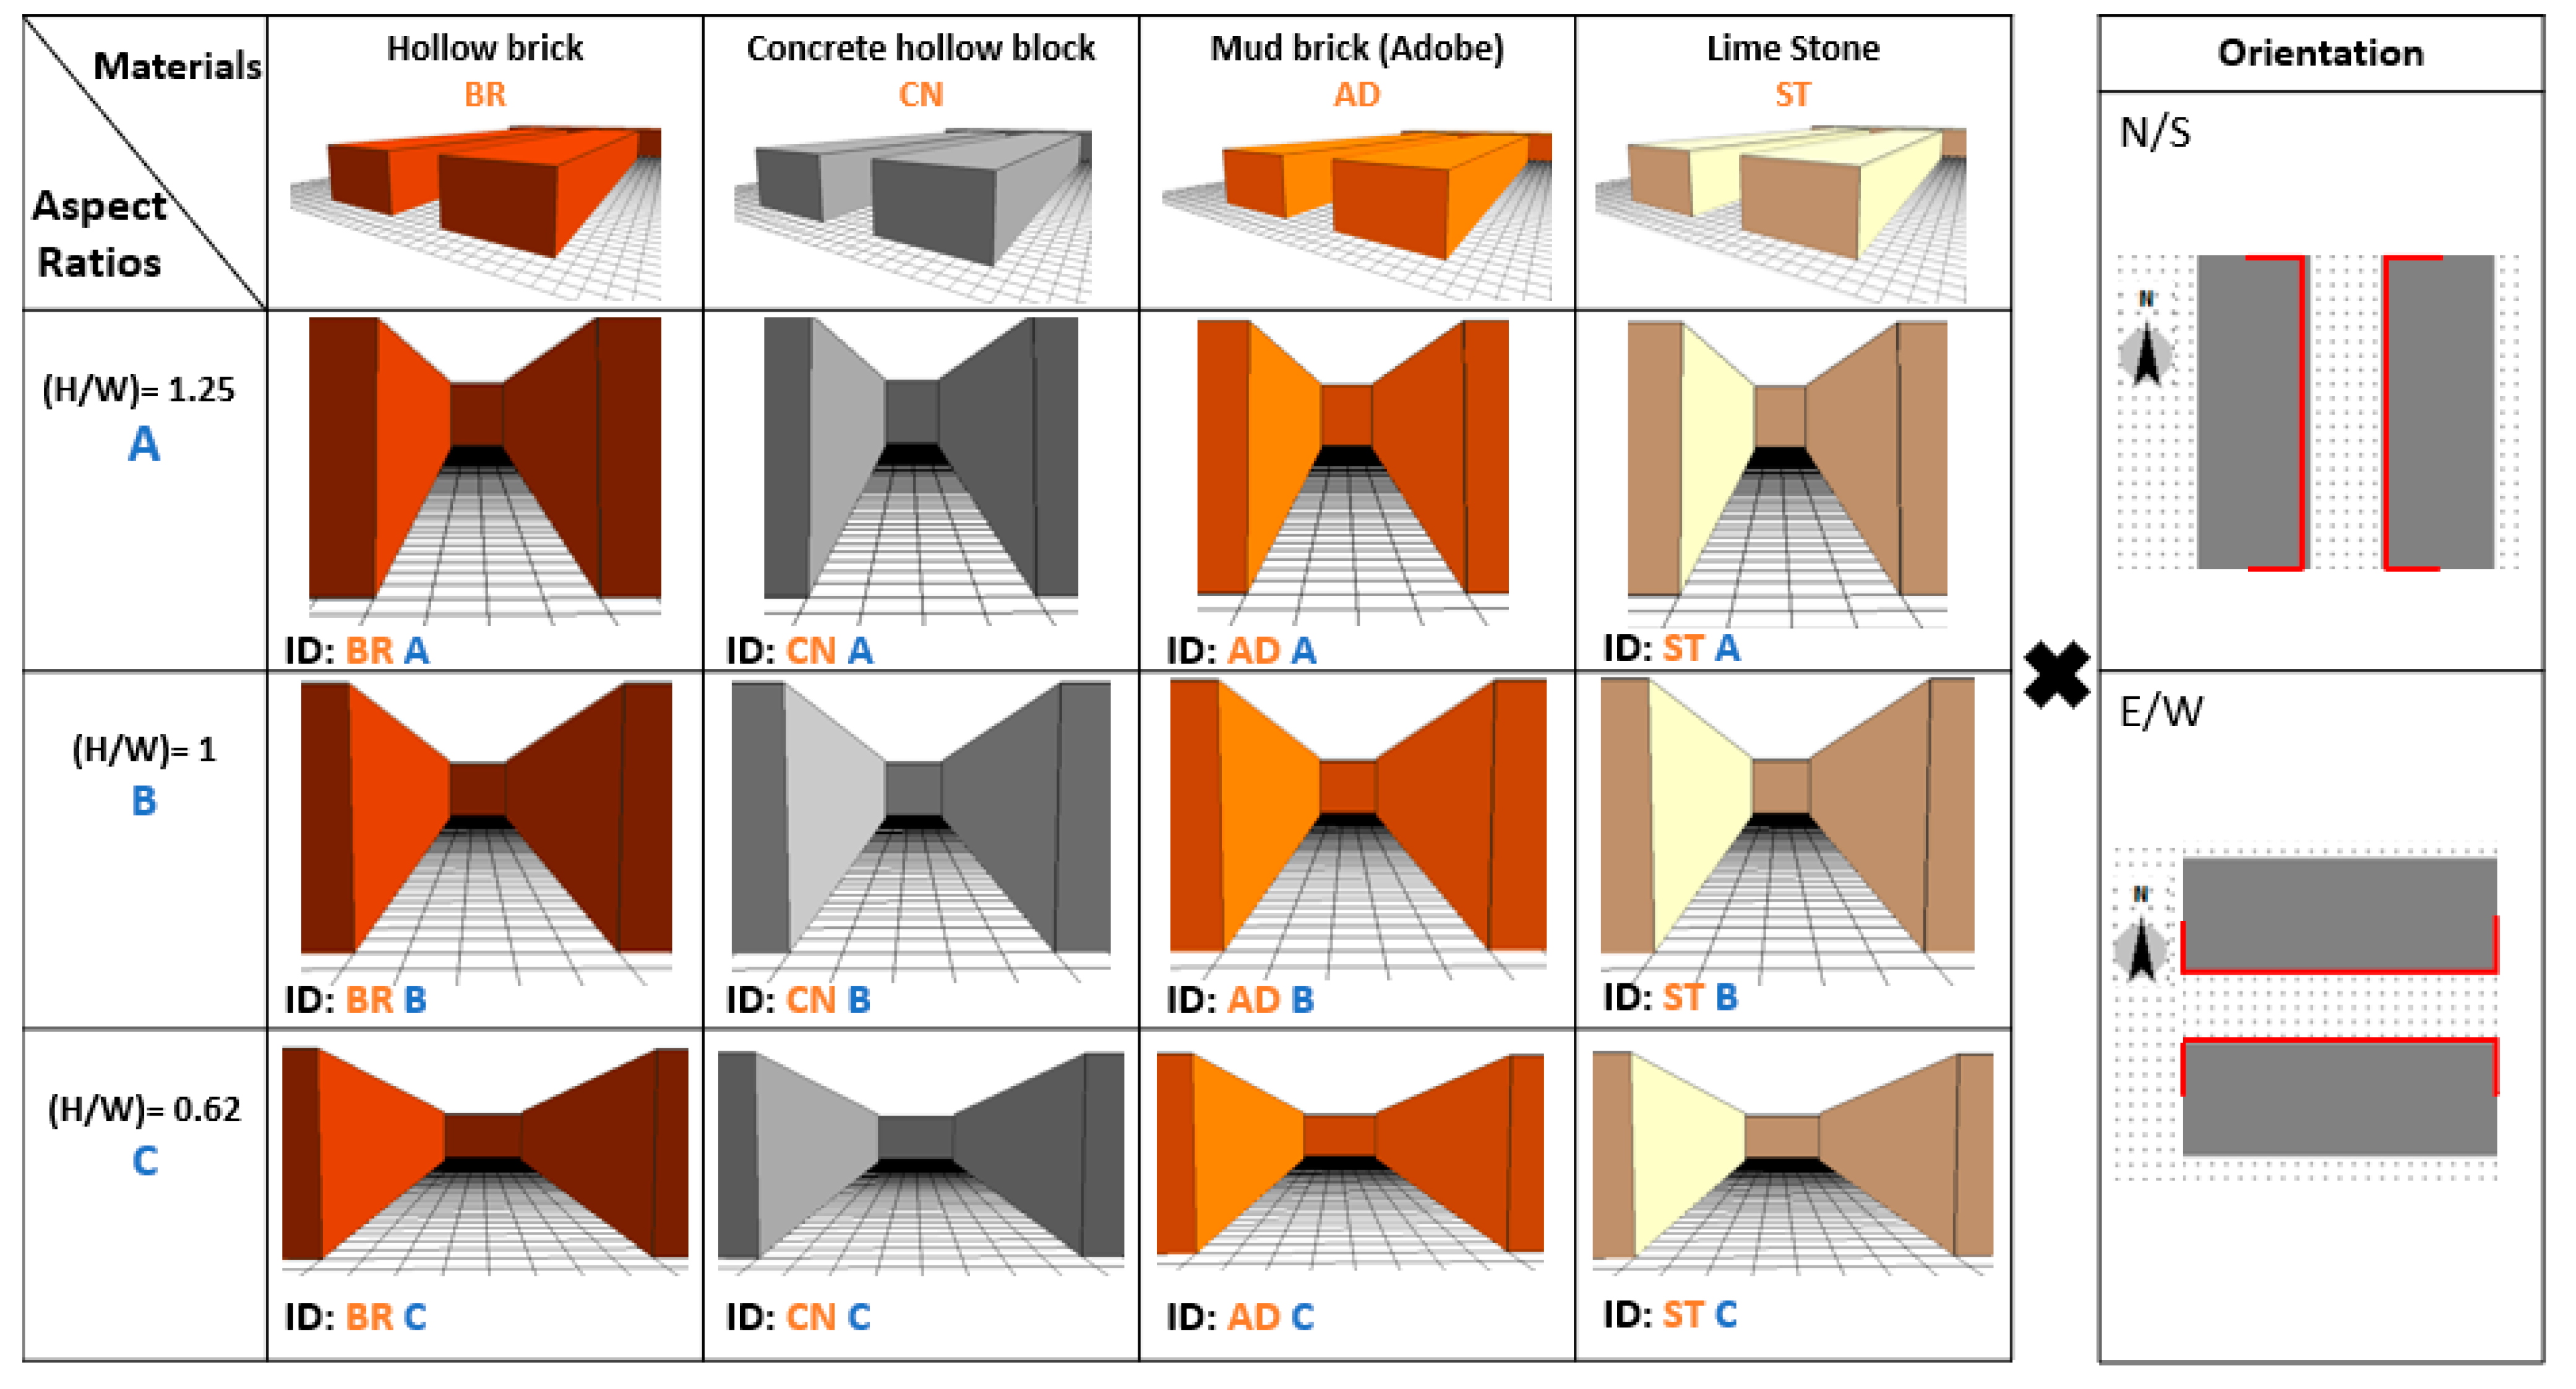
2.2. Site and Sample Selection Criteria
2.3. In Situ Measurement
2.4. Model Creation and Simulation
2.5. Calibration with ENVI-Met
3. Results
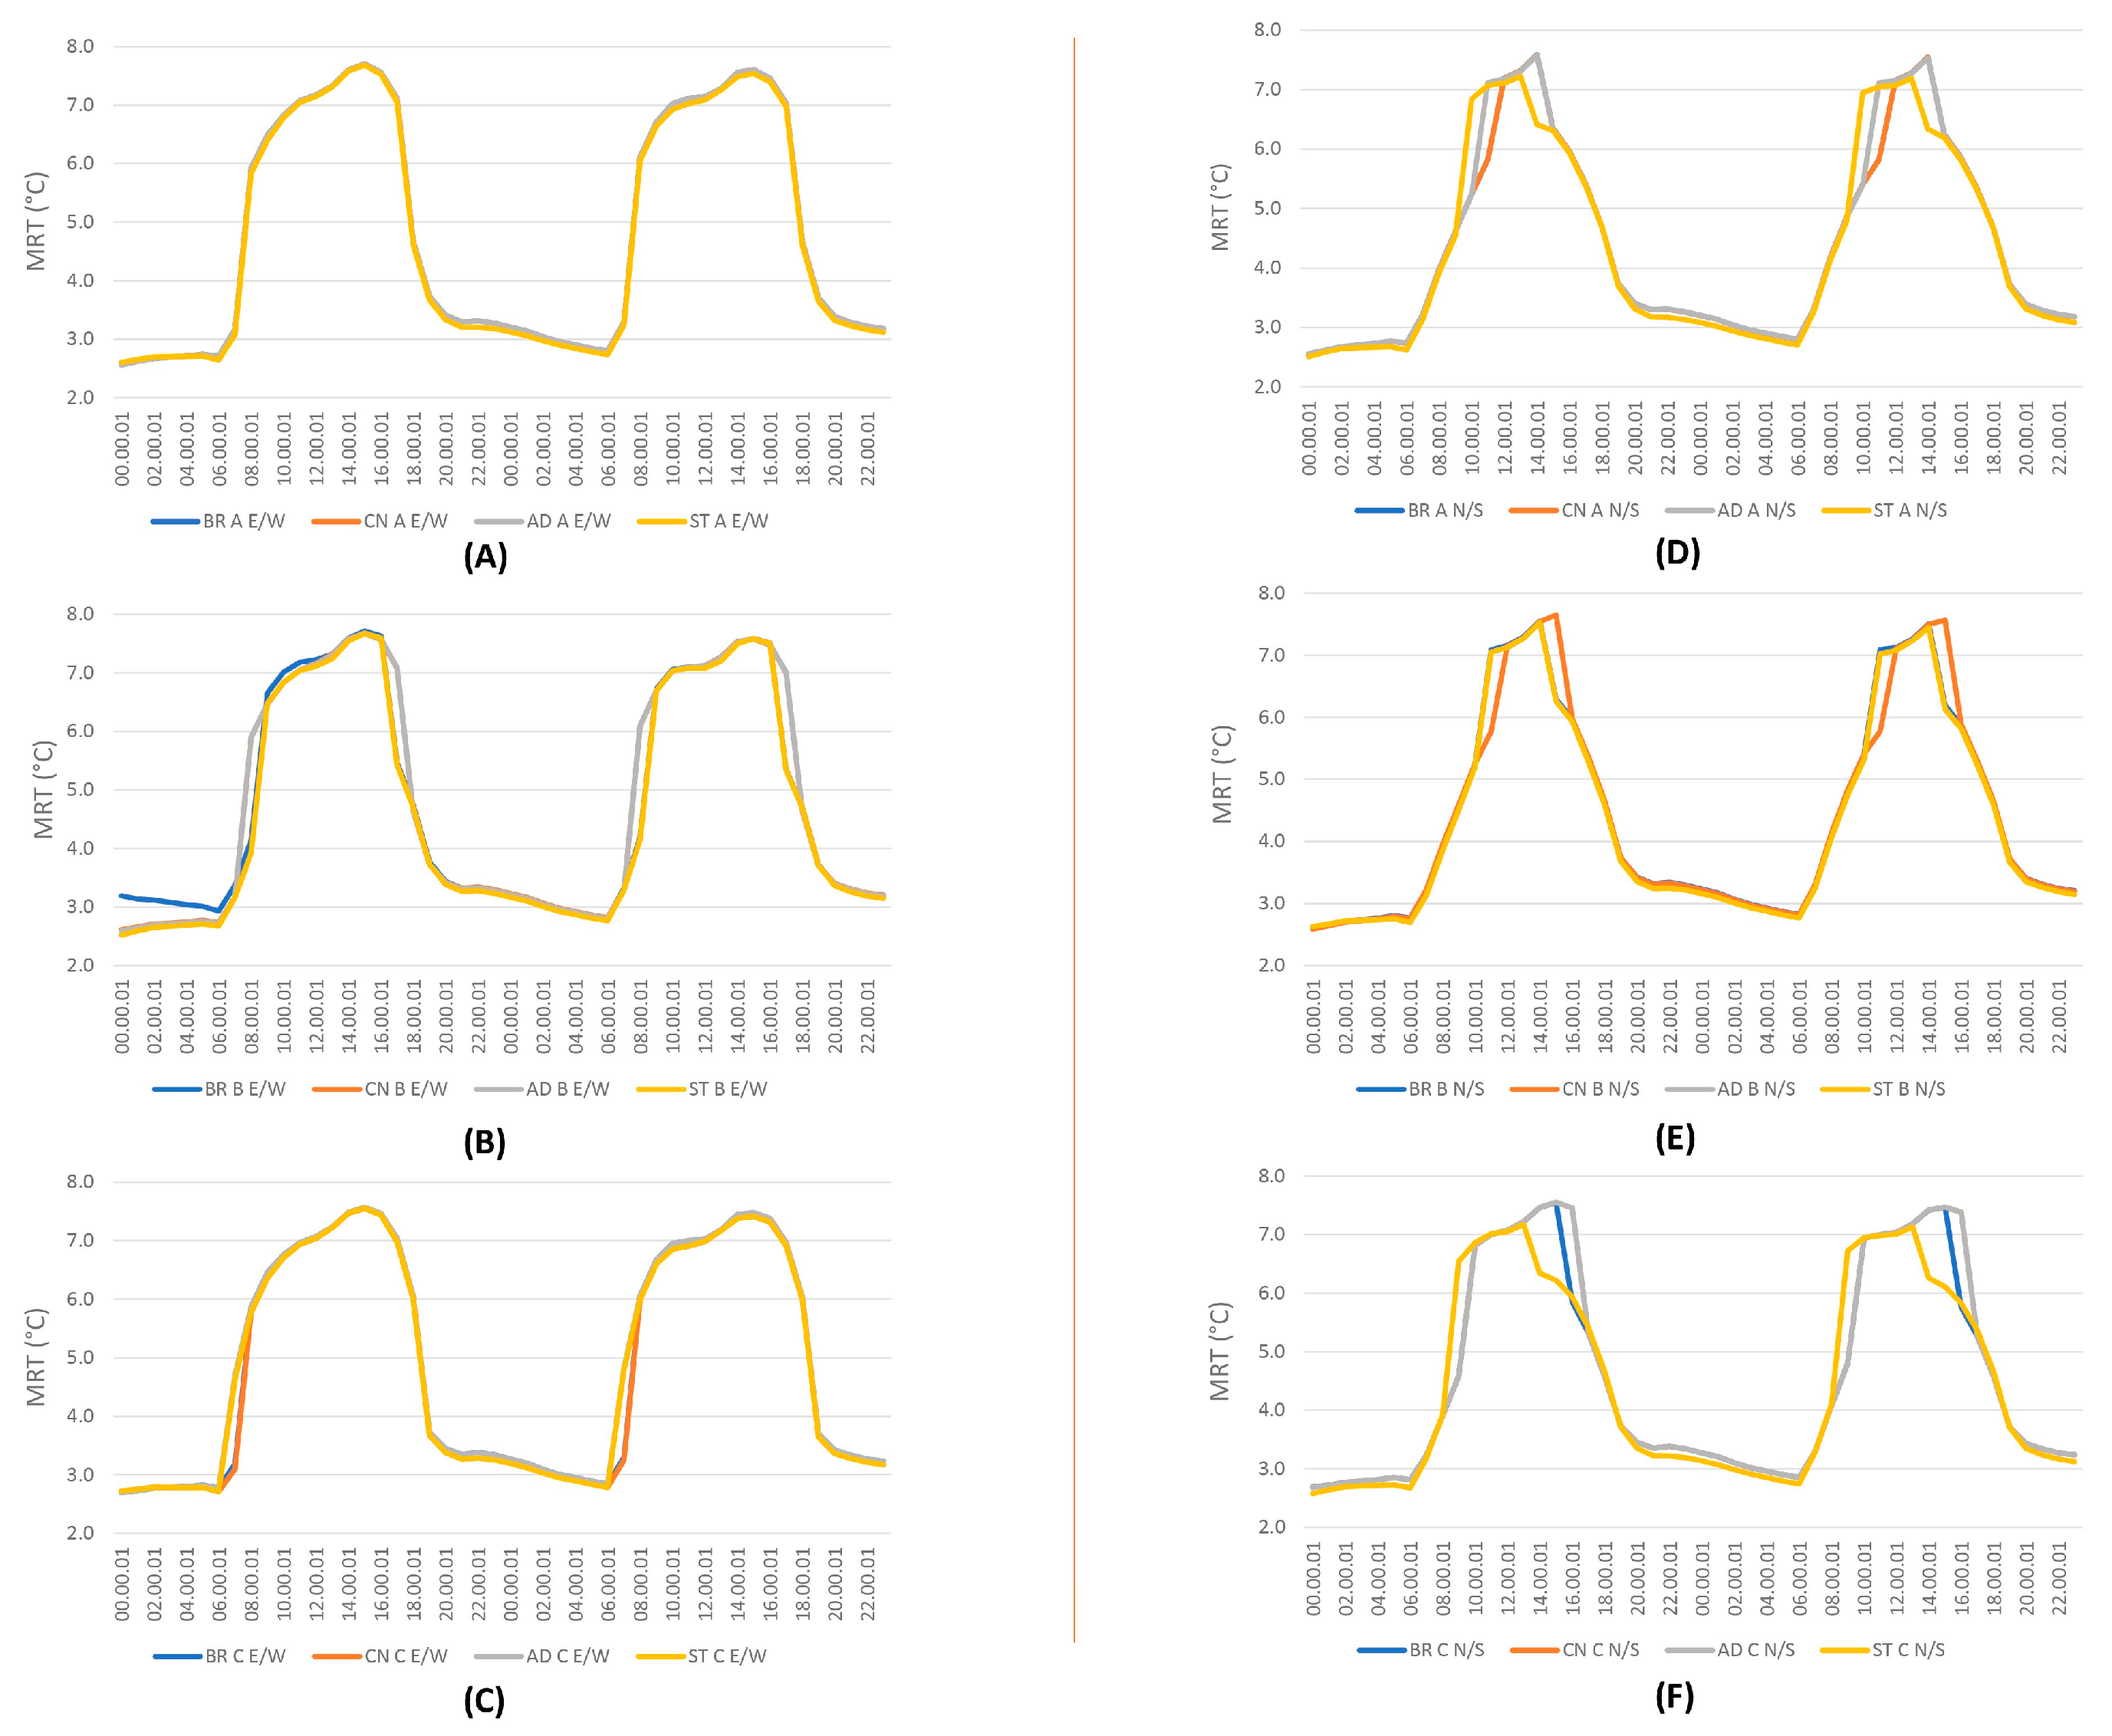
3.1. Mean Radiant Temperature (Tmrt)
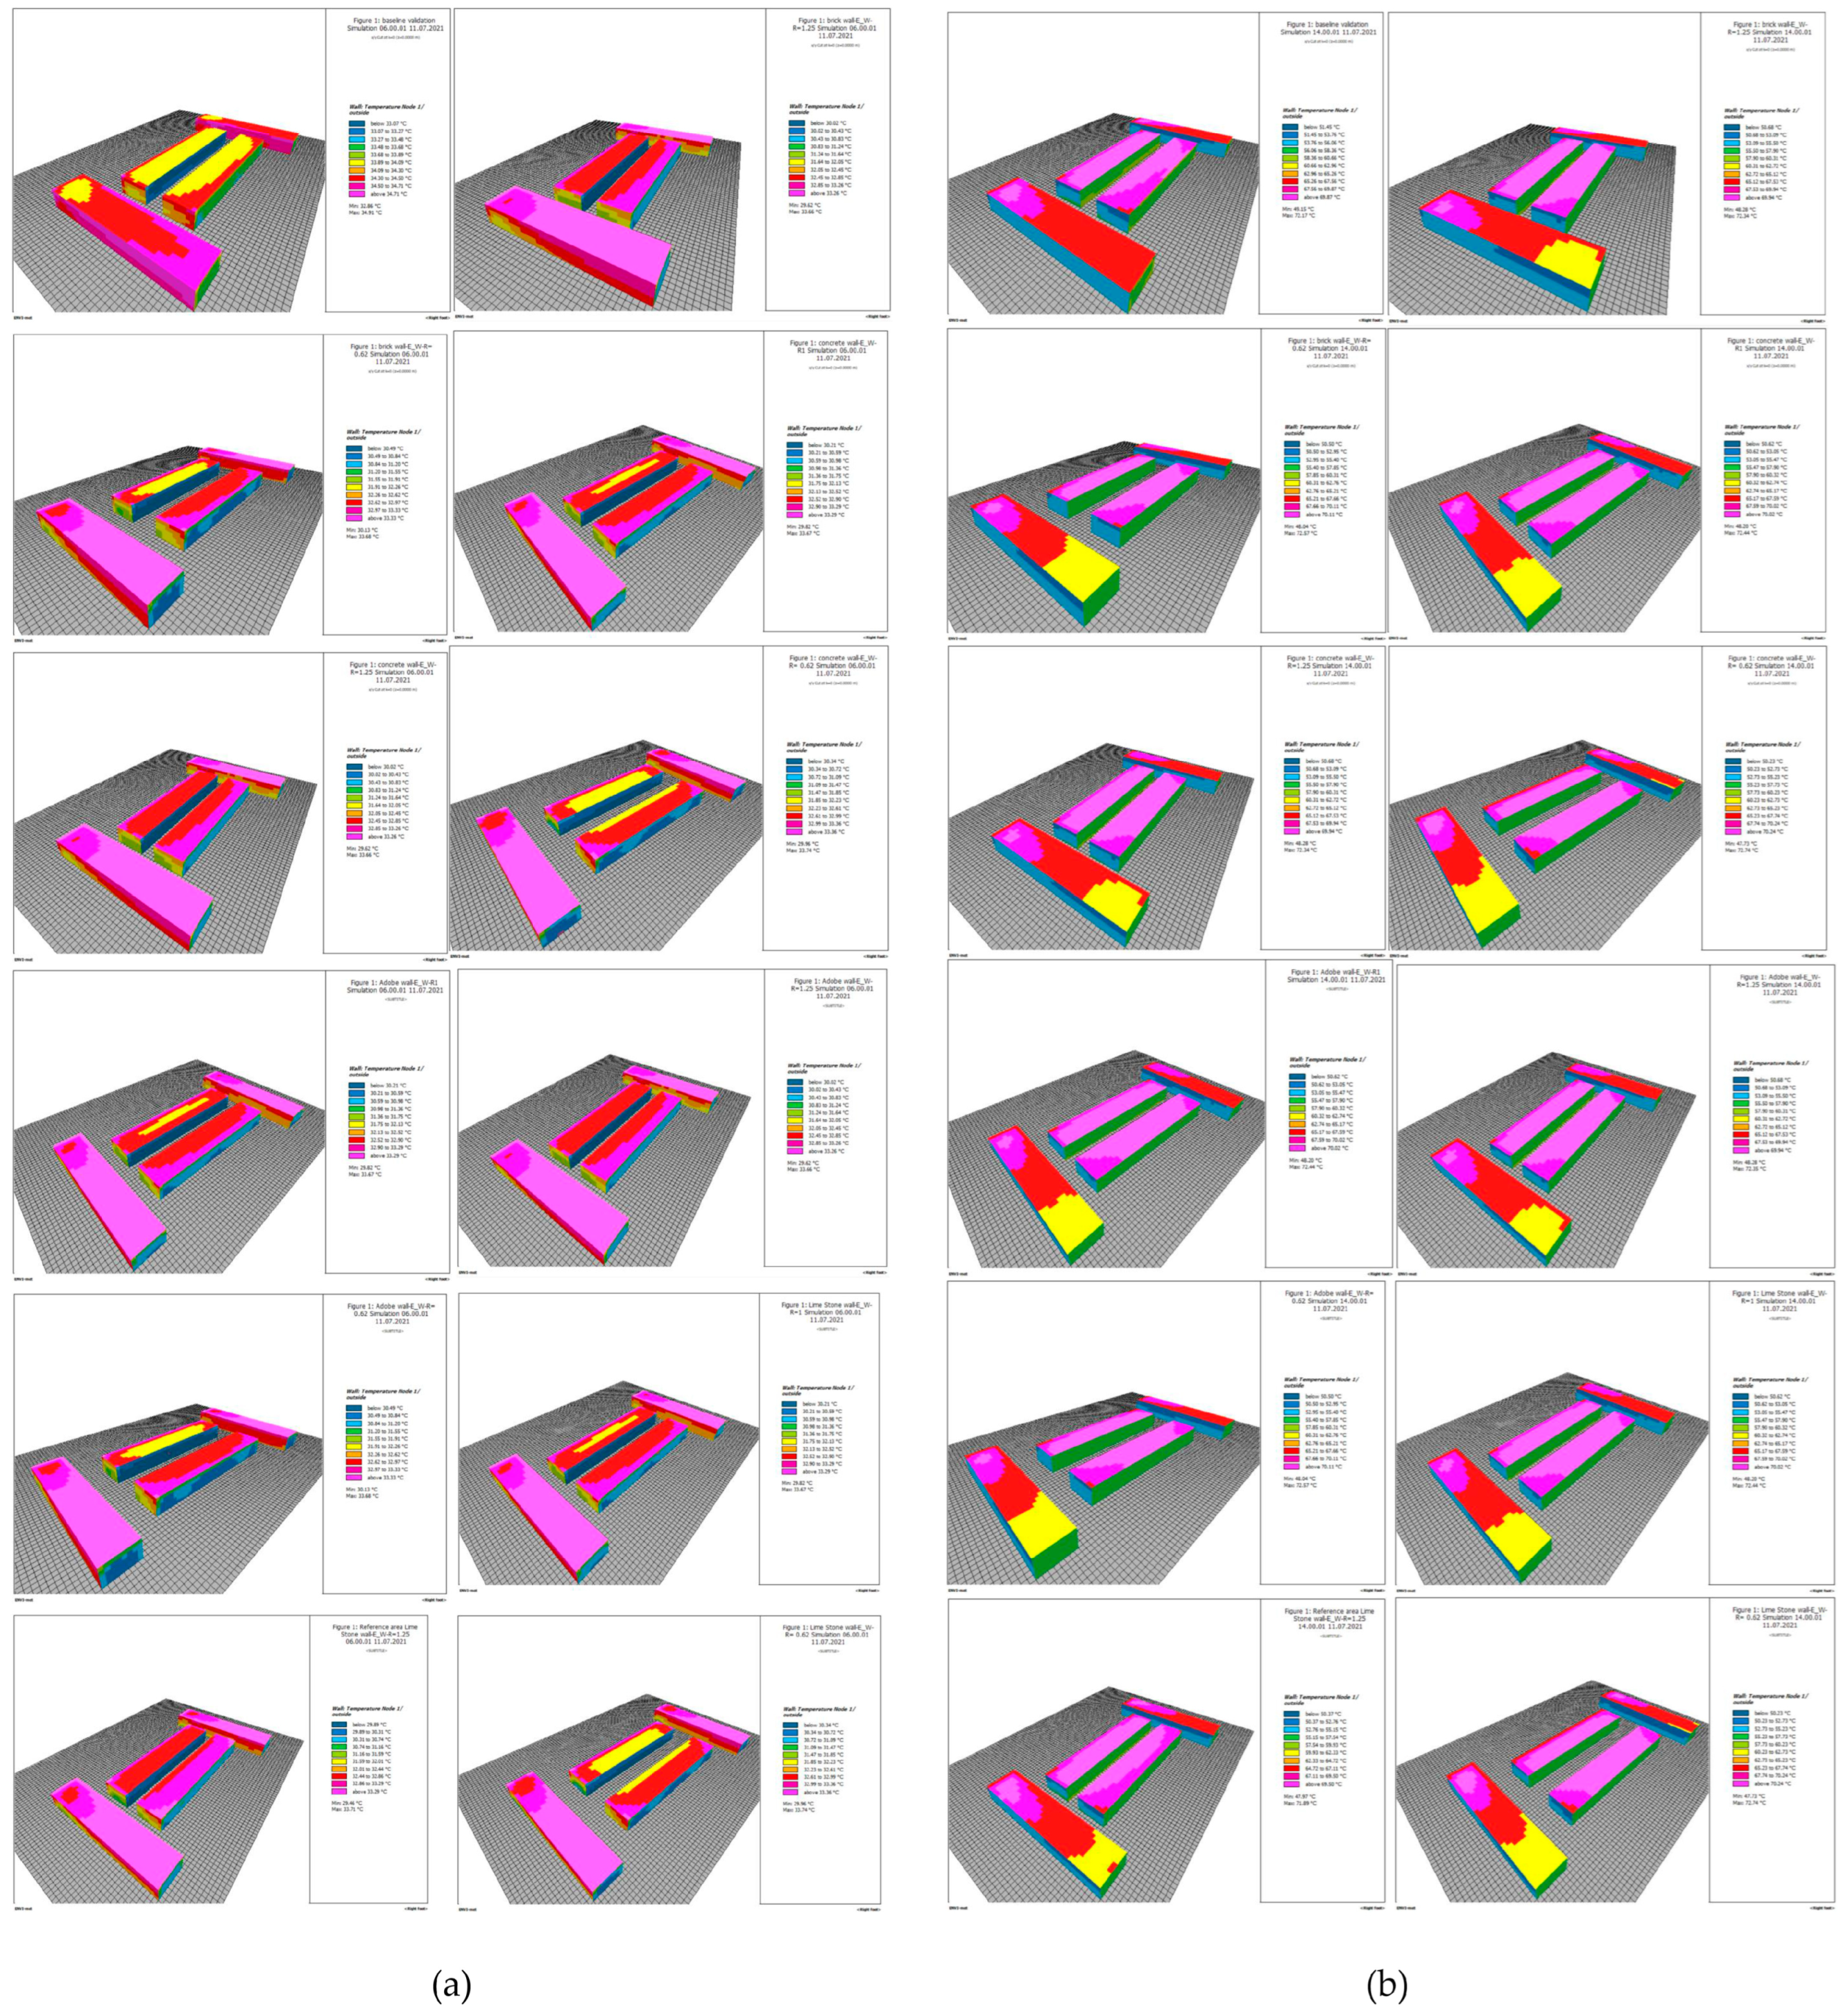
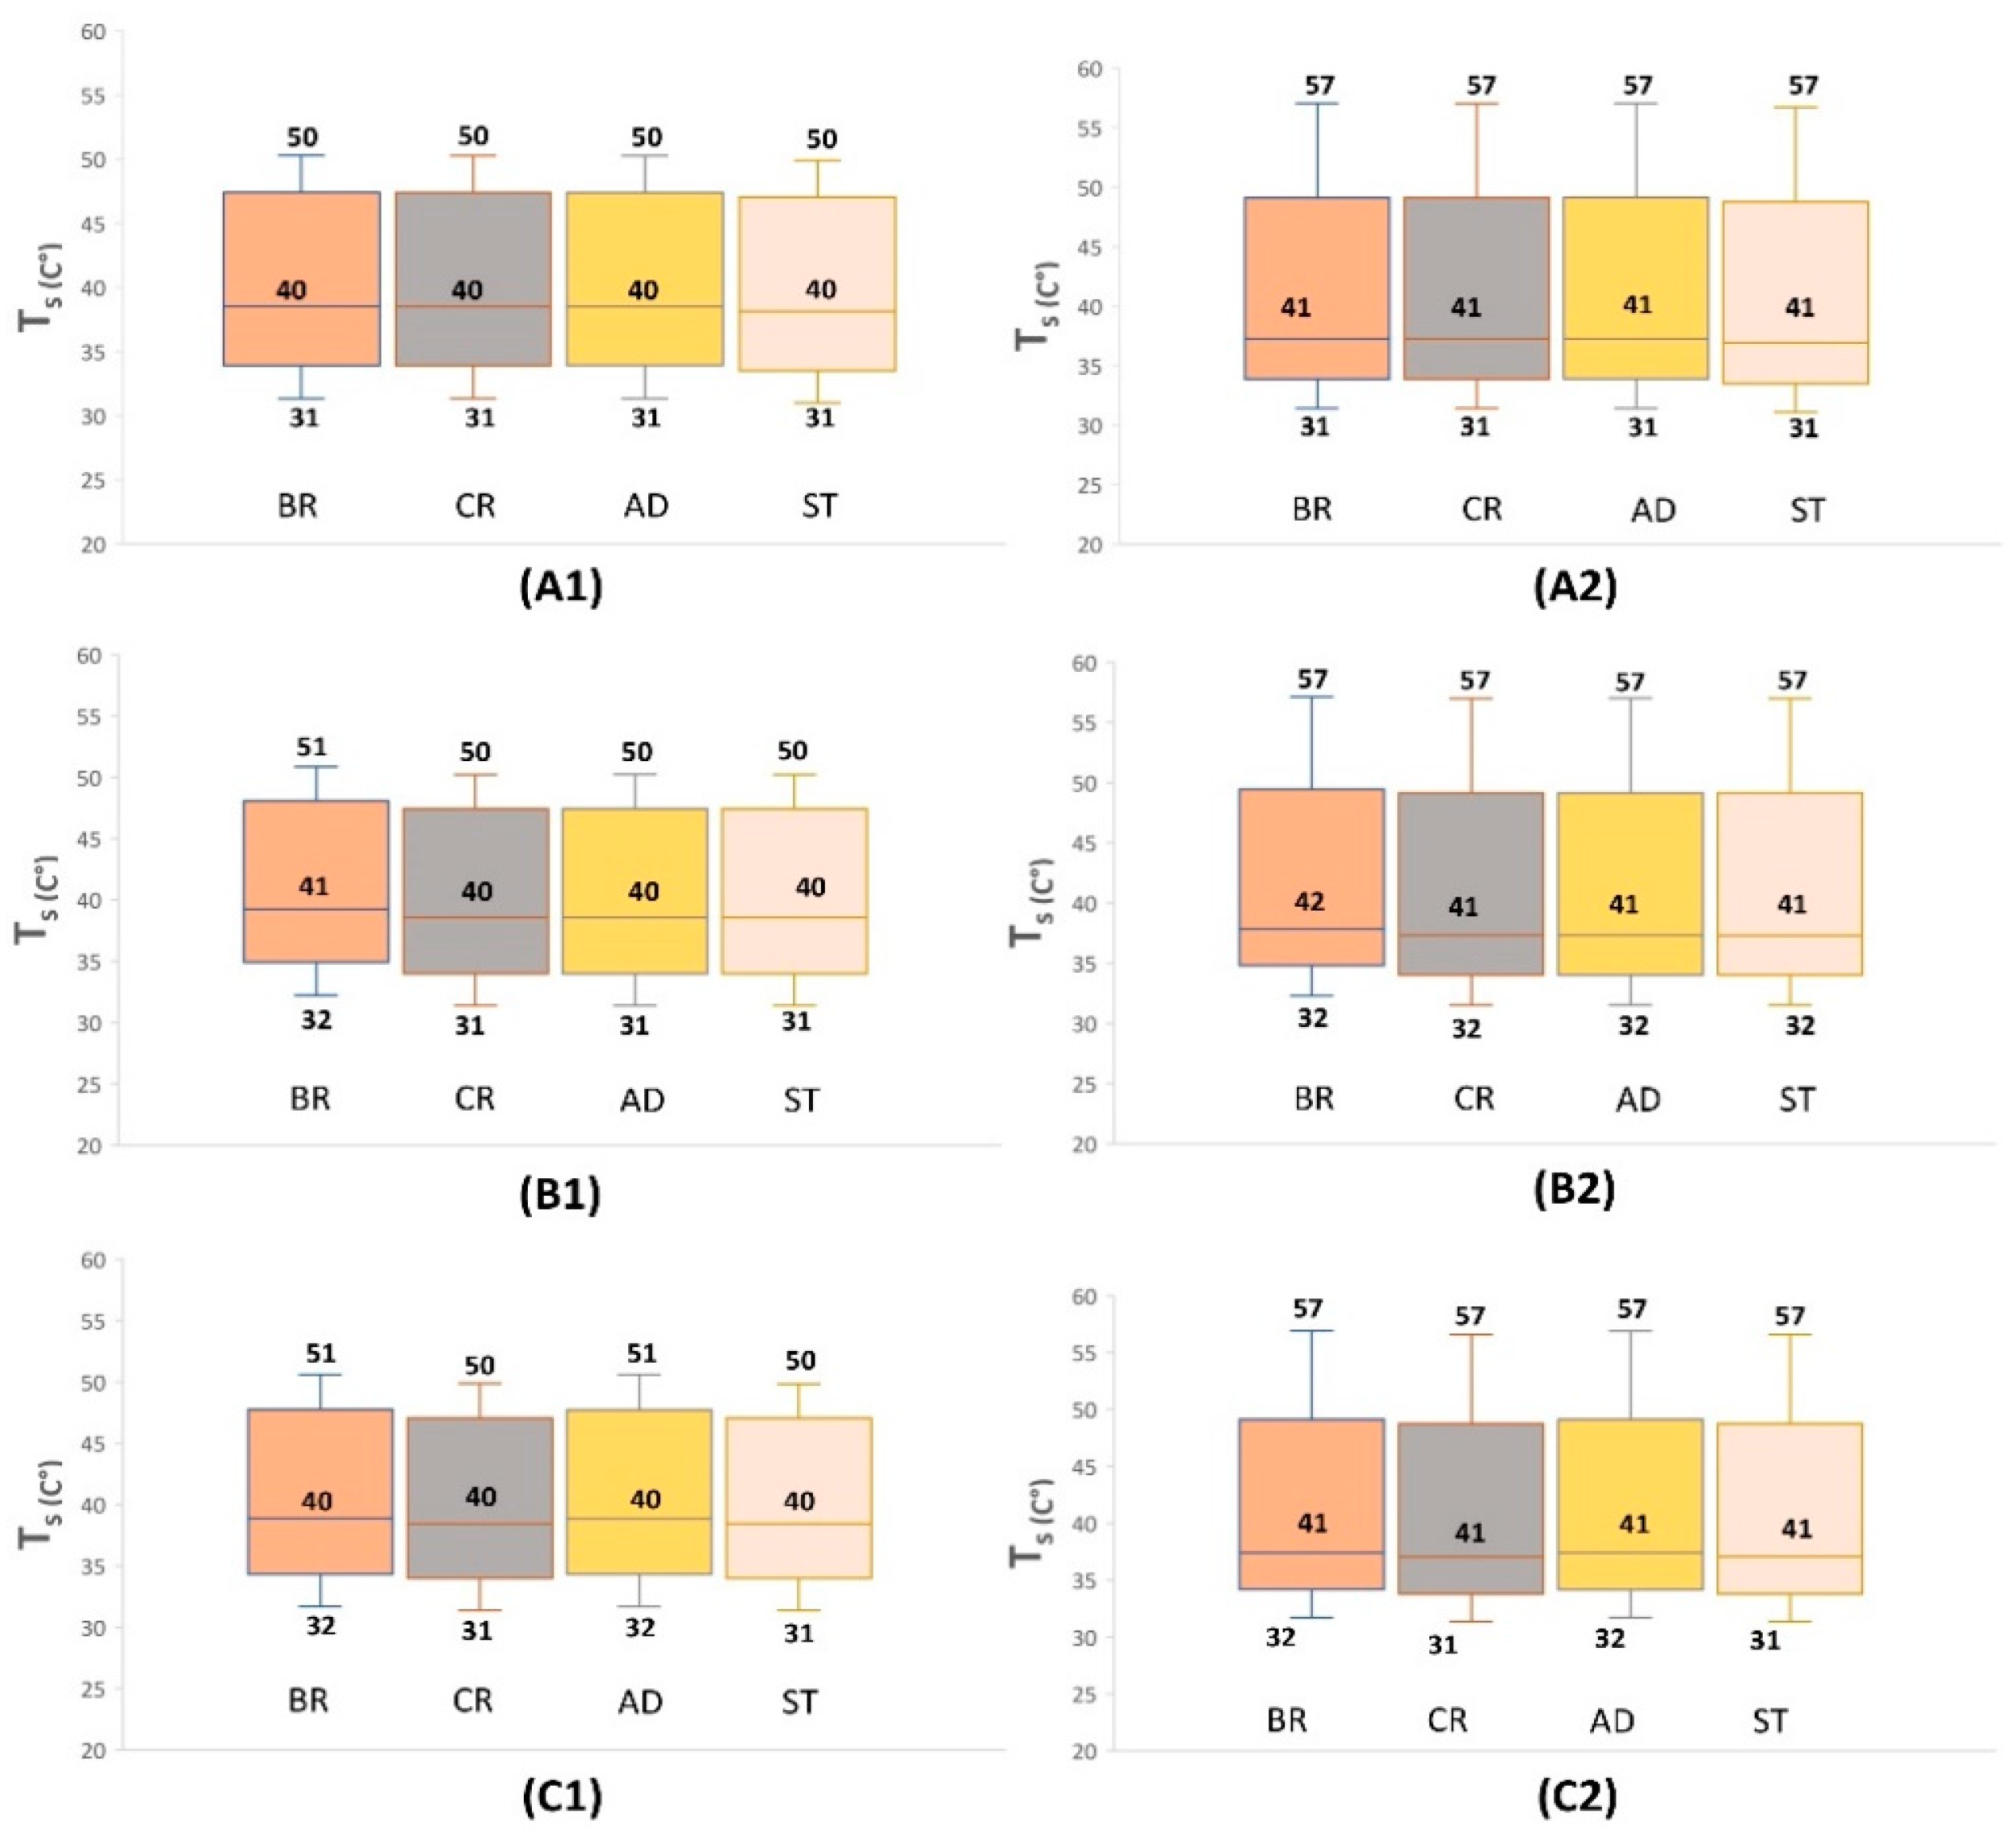
3.2. Surface Temperature (Ts)
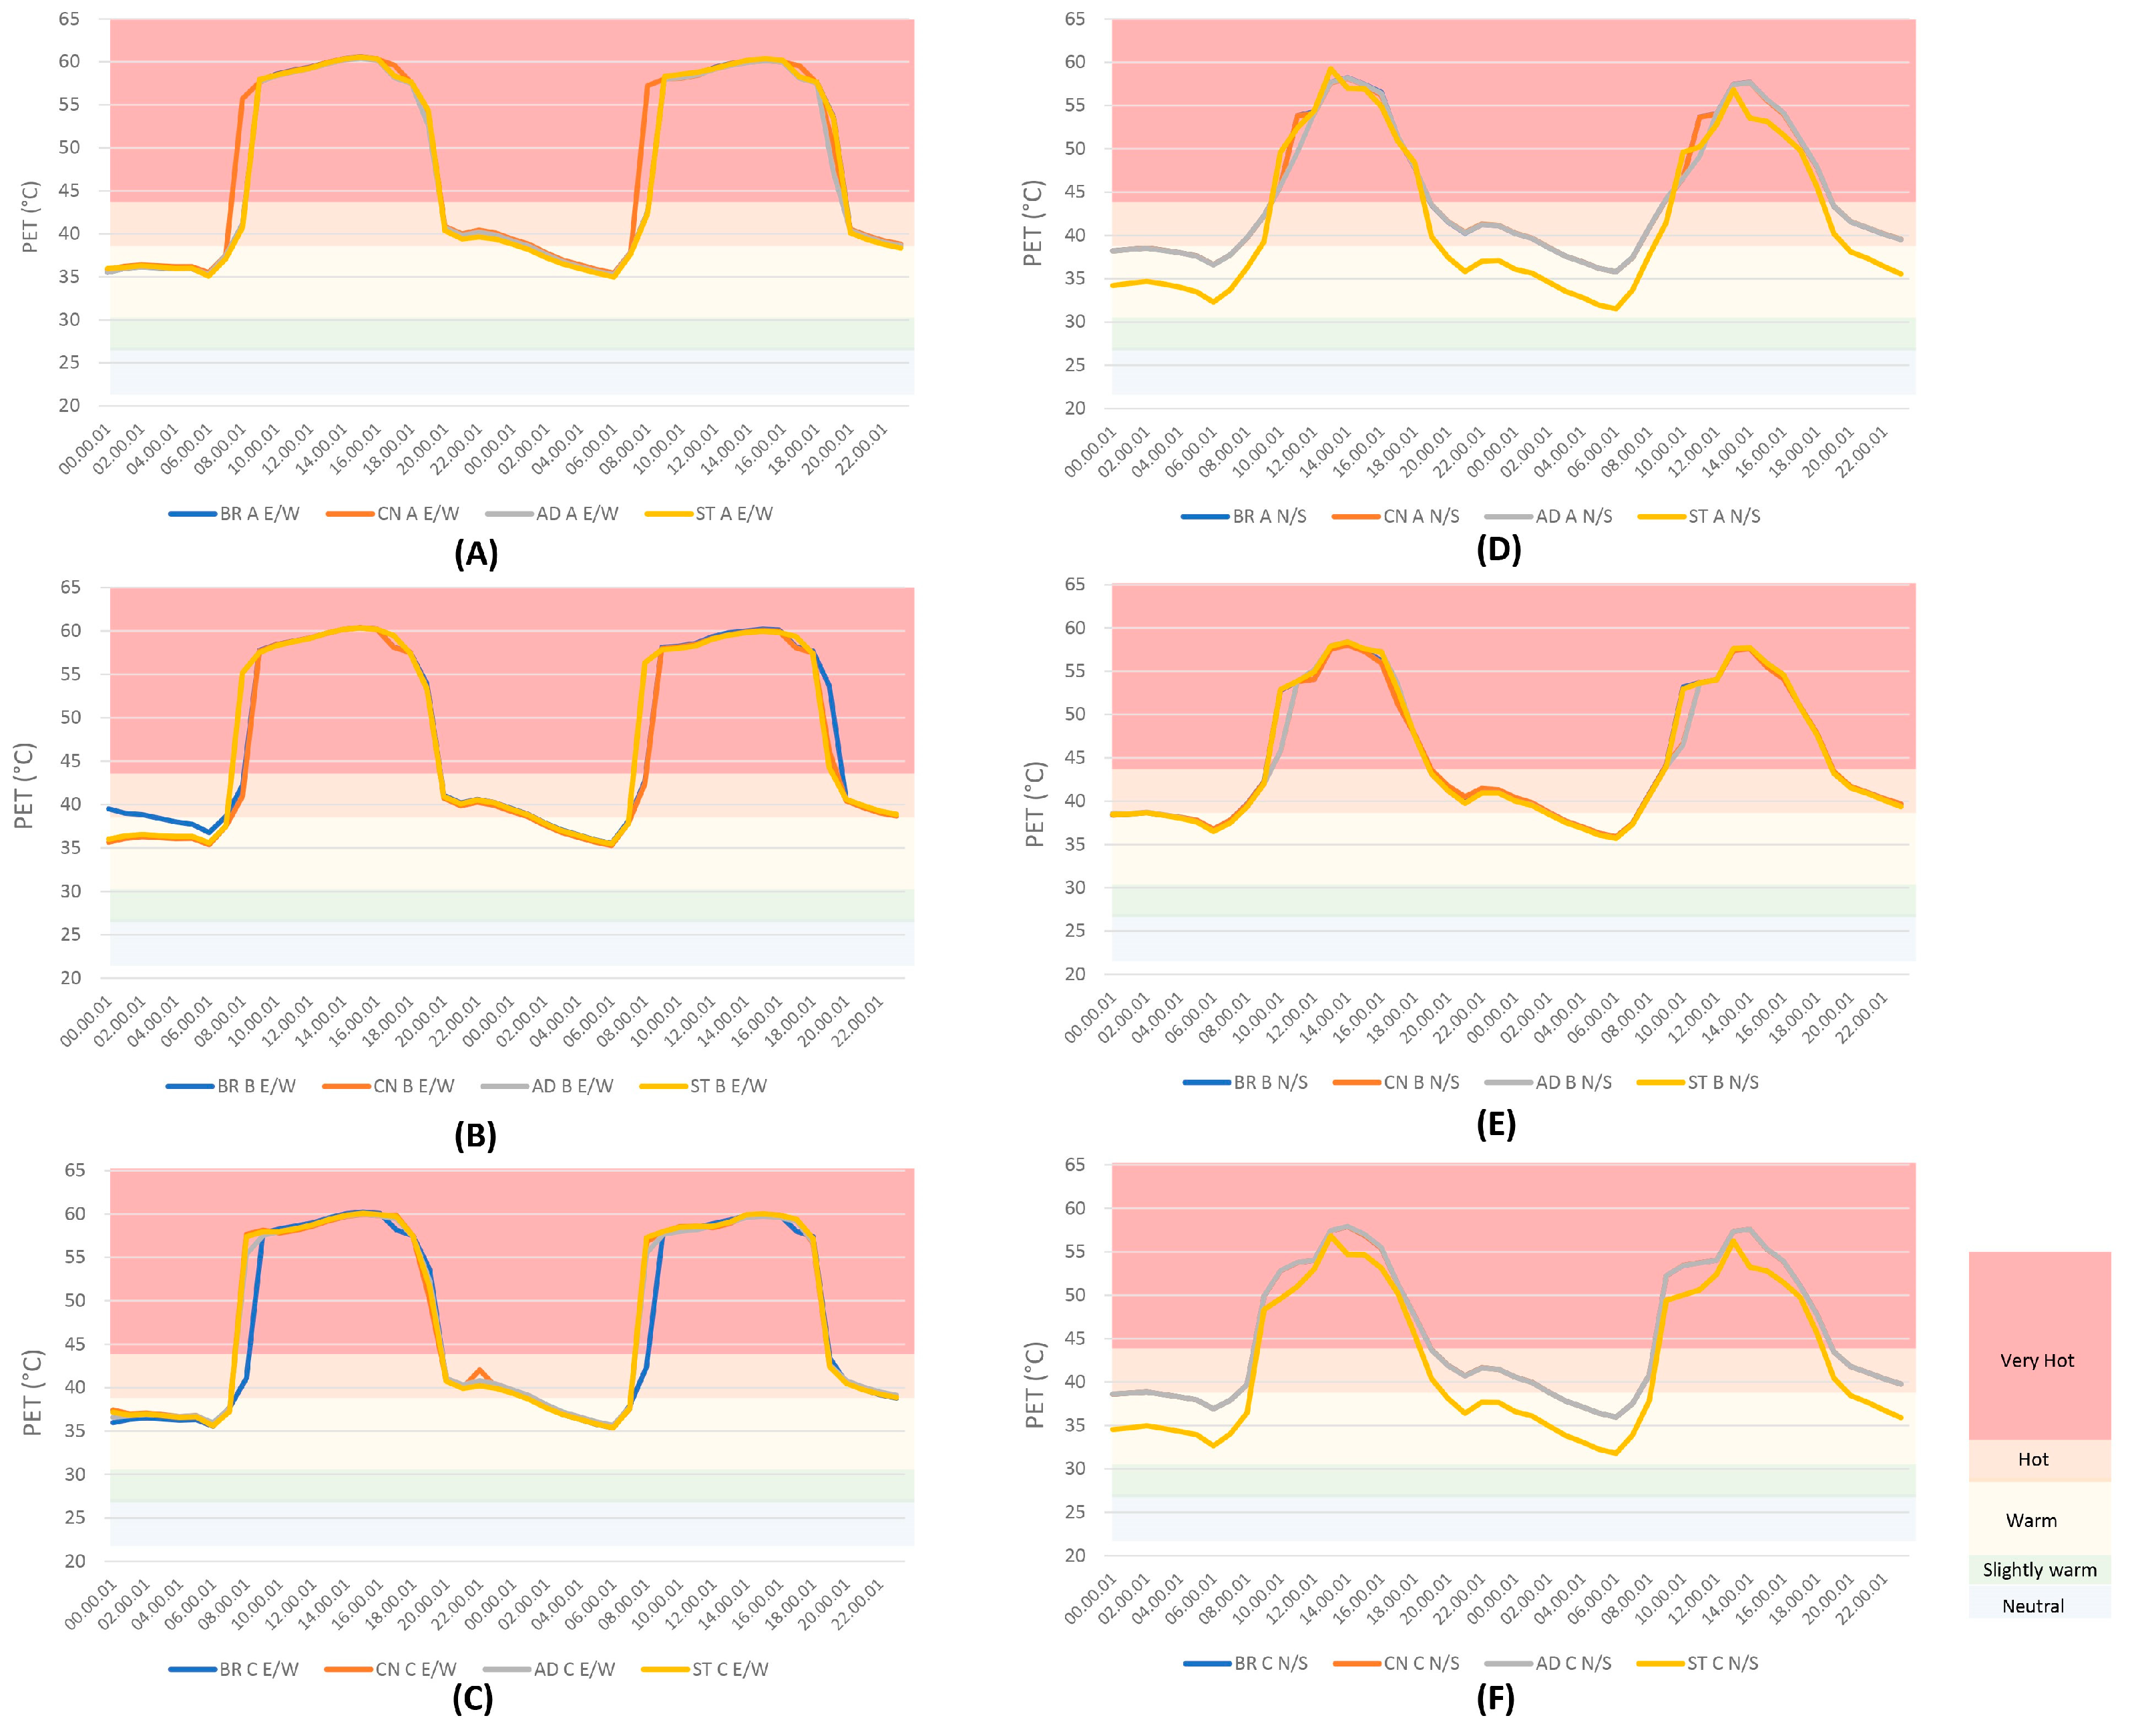
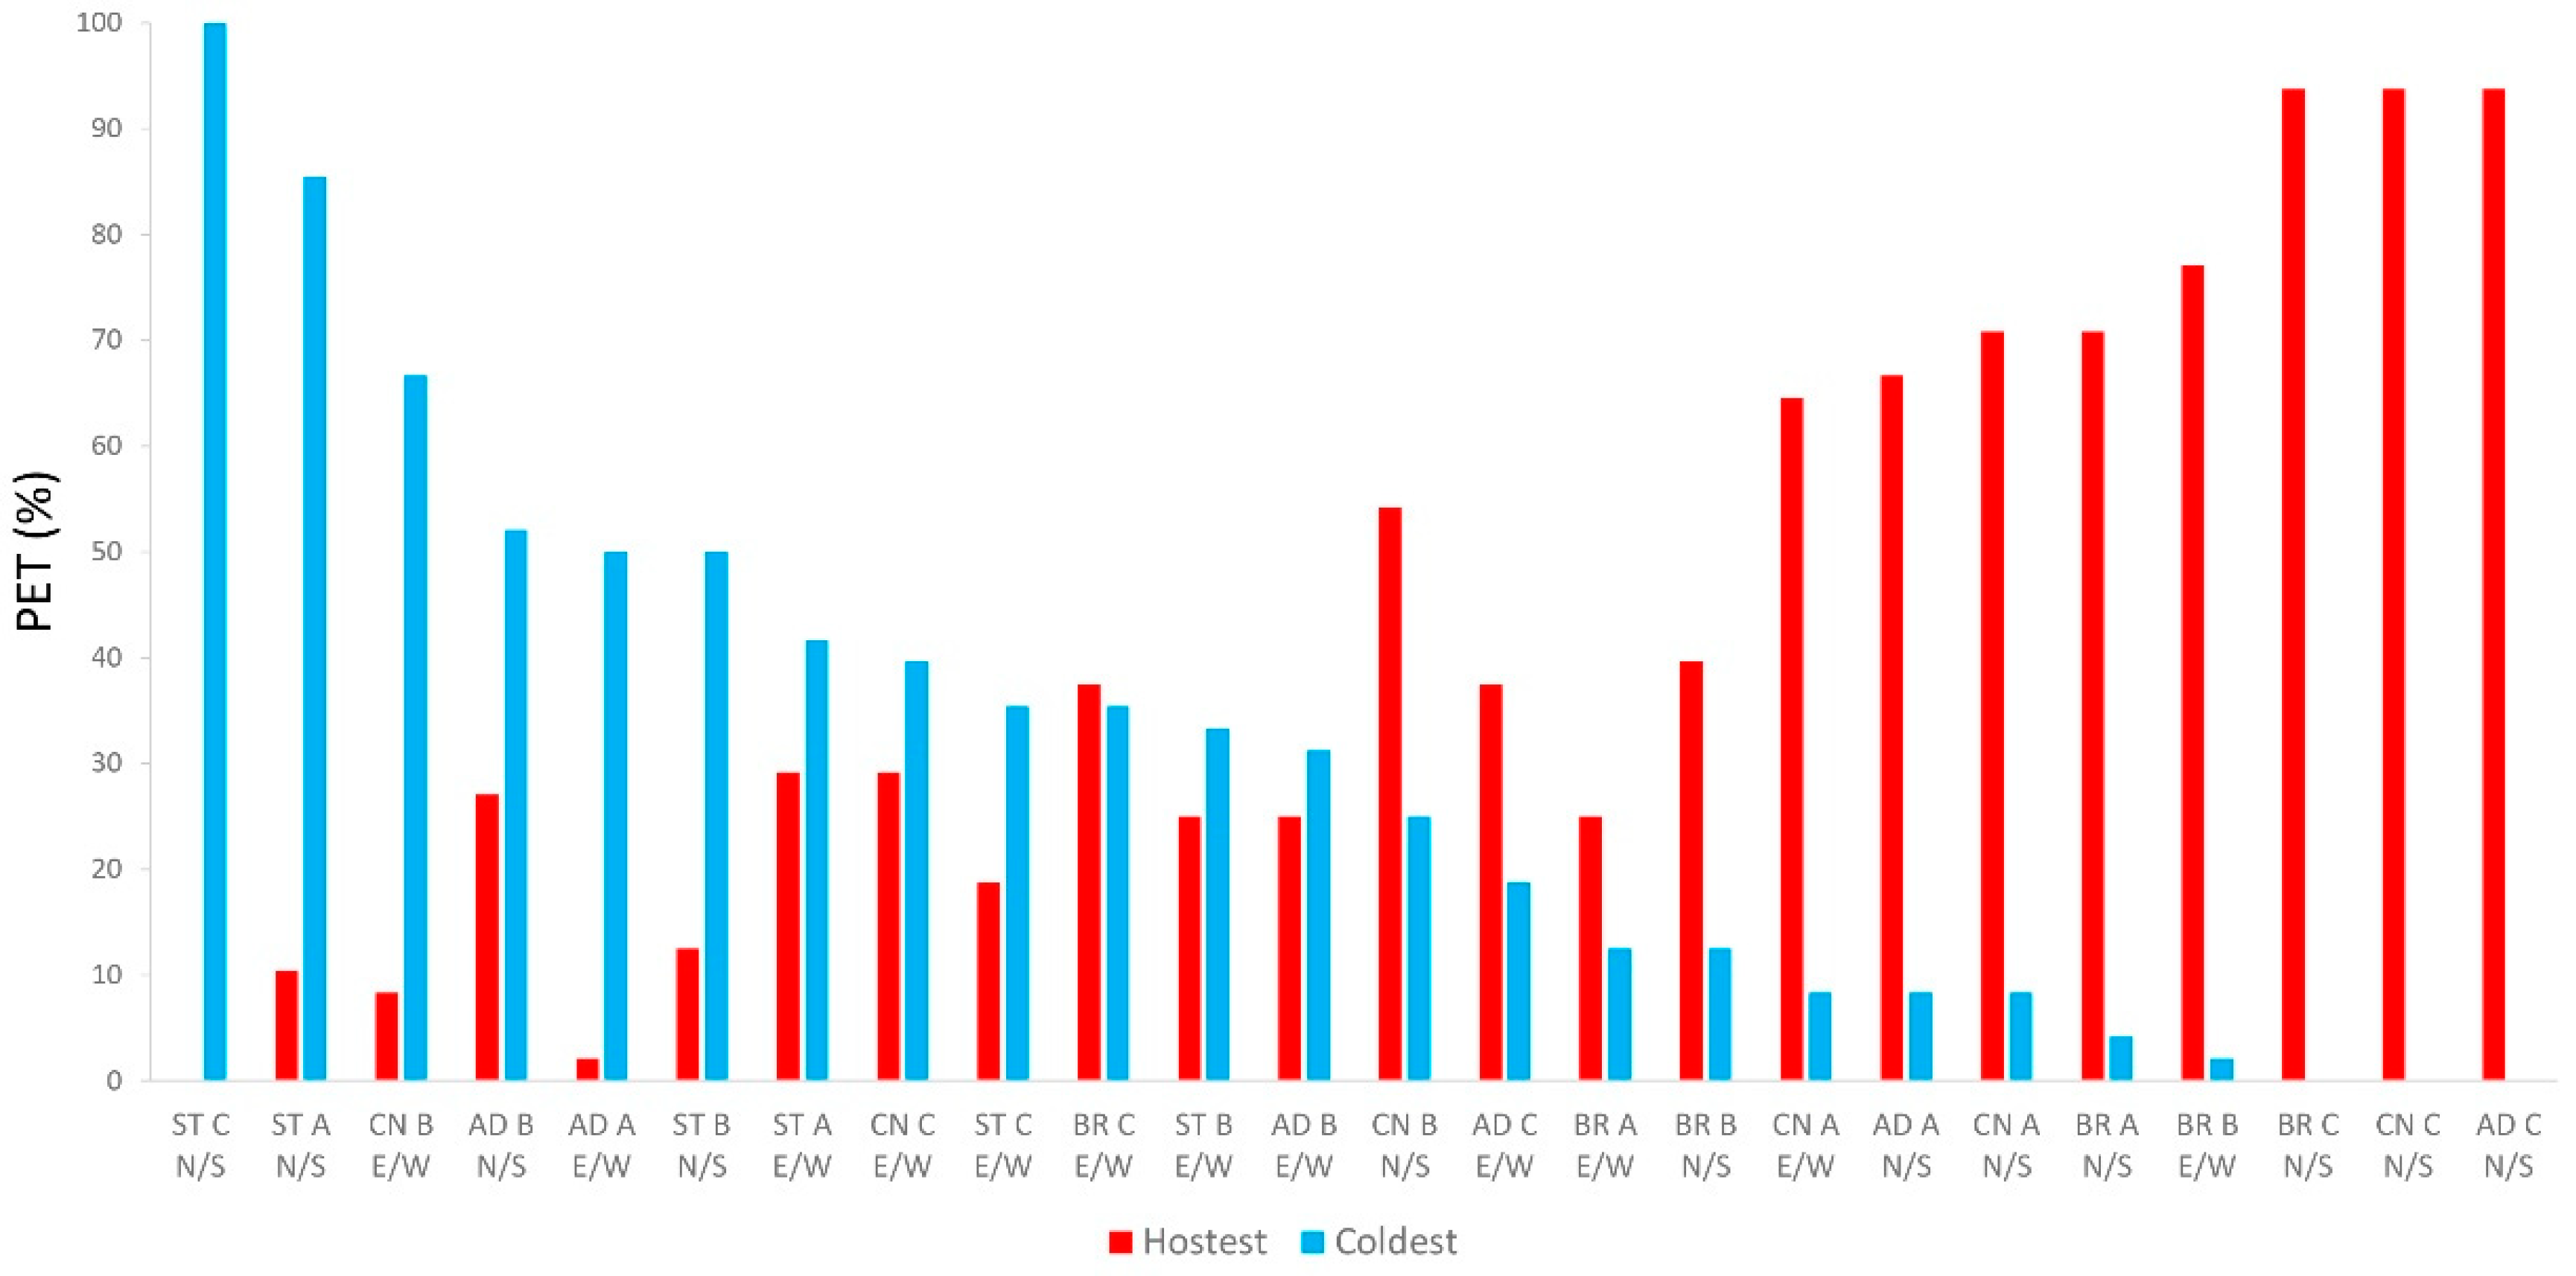
3.3. The Physiological Equivalent Temperature Index (PET)
- High cooling category: [above 60–100%] of cooling efficiency, obtained predominantly in the N-S orientation in the A (H/W = 1.25) and C (H/W = 0.62) canyon groups and the E-W orientation in the B (H/W = 1) canyon group. Limestone (ST) was a prominent material in this category.
- Medium cooling category: [40–60%] of cooling efficiency, observed in both orientations in the deep canyons A and B for limestone (ST) and adobe (AD) walls.
- Low cooling category: [below 40%] of cooling efficiency, notably observed in the E-W orientation in the shallow canyon, with brick (BR) and concrete (CN) being the most affected materials.
- Extreme heating category: [above 60–100%] of heat retention predominantly occurred in the N-S orientation within all canyon forms. The most affected materials were brick (BR), concrete (CN), and slightly, adobe (AD).
- Medium heating category: [40–60%] of heat retention, obtained solely with the concrete (CN) wall in the N-S orientation in B canyon.
- Low heating category: [below 40%] of heat retention, varied between the E-W and N-S orientations across different canyon forms and walls.
4. Discussion
4.1. Findings and Recommendations
4.2. Strength and Limitations
4.3. Implication for Practice and Research
5. Conclusions
Author Contributions
Funding
Institutional Review Board Statement
Informed Consent Statement
Data Availability Statement
Acknowledgments
Conflicts of Interest
Nomenclature
| ASHRAE | American Society of Heating, Refrigerating, and Air-Conditioning Engineers |
| CBE | Berkeley Center for the Built Environment |
| CNERIB | Algerian Centre for Building Integrated Studies and Research |
| BR | hollow brick wall |
| CN | concrete hollow block wall |
| AD | adobe brick wall |
| ST | limestone wall |
| PET | physiological equivalent temperature |
| Tmrt | mean radiant temperature |
| Ts | surface temperature |
| Ta | air temperature |
| CFD | computational fluid dynamics |
| MBE | mean bias error |
| RMSE | root mean square error |
Appendix A

References
- Kleerekoper, L.; Van Esch, M.; Salcedo, T.B. How to make a city climate-proof, addressing the urban heat island effect. Resour. Conserv. Recycl. 2012, 64, 30–38. [Google Scholar] [CrossRef]
- Rydin, Y.; Bleahu, A.; Davies, M.; Dávila, J.D.; Friel, S.; De Grandis, G.; Groce, N.; Hallal, P.C.; Hamilton, I.; Howden-Chapman, P.; et al. Shaping cities for health: Complexity and the planning of urban environments in the 21st century. Lancet 2012, 379, 2079–2108. [Google Scholar] [CrossRef] [PubMed]
- Magli, S.; Lodi, C.; Lombroso, L.; Muscio, A.; Teggi, S. Analysis of the urban heat island effects on building energy consumption. Int. J. Energy Environ. Eng. 2015, 6, 91–99. [Google Scholar] [CrossRef]
- Pérez-Lombard, L.; Ortiz, J.; Pout, C. A review on buildings energy consumption information. Energy Build. 2008, 40, 394–398. [Google Scholar] [CrossRef]
- Darbani, E.S.; Rafieian, M.; Parapari, D.M.; Guldmann, J.M. Urban design strategies for summer and winter outdoor thermal comfort in arid regions: The case of historical, contemporary and modern urban areas in Mashhad, Iran. Sustain. Cities Soc. 2023, 89, 104339. [Google Scholar] [CrossRef]
- Ali-Toudert, F. Exploration of the thermal behaviour and energy balance of urban canyons in relation to their geometrical and constructive properties. Build. Environ. 2021, 188, 107466. [Google Scholar] [CrossRef]
- Castaldo, V.L.; Rosso, F.; Golasi, I.; Piselli, C.; Salata, F.; Pisello, A.L.; Ferrero, M.; Cotana, F.; de Lieto Vollaro, A. Thermal comfort in the historical urban canyon: The effect of innovative materials. Energy Procedia 2017, 134, 151–160. [Google Scholar] [CrossRef]
- Andreou, E.; Axarli, K. Investigation of urban canyon microclimate in traditional and contemporary environment. Experimental investigation and parametric analysis. Renew. Energy 2012, 43, 354–363. [Google Scholar] [CrossRef]
- Erell, E.; Pearlmutter, D.; Boneh, D.; Kutiel, P.B. Effect of high-albedo materials on pedestrian heat stress in urban street canyons. Urban Clim. 2014, 10, 367–386. [Google Scholar] [CrossRef]
- Kolokotsa, D.; Santamouris, M.; Zerefos, S.C. Green and cool roofs’ urban heat island mitigation potential in European climates for office buildings under free floating conditions. Sol. Energy 2013, 95, 118–130. [Google Scholar] [CrossRef]
- Santamouris, M. Using cool pavements as a mitigation strategy to fight urban heat island—A review of the actual developments. Renew. Sustain. Energy Rev. 2013, 26, 224–240. [Google Scholar] [CrossRef]
- Rosso, F.; Jin, W.; Pisello, A.L.; Ferrero, M.; Ghandehari, M. Translucent marbles for building envelope applications: Weathering effects on surface lightness and finishing when exposed to simulated acid rain. Constr. Build. Mater. 2016, 108, 146–153. [Google Scholar] [CrossRef]
- Deng, J.Y.; Wong, N.H. Impact of urban canyon geometries on outdoor thermal comfort in central business districts. Sustain. Cities Soc. 2020, 53, 101966. [Google Scholar] [CrossRef]
- Johansson, E. Influence of urban geometry on outdoor thermal comfort in a hot dry climate: A study in Fez, Morocco. Build. Environ. 2006, 41, 1326–1338. [Google Scholar] [CrossRef]
- Ali-Toudert, F.; Mayer, H. Numerical study on the effects of aspect ratio and orientation of an urban street canyon on outdoor thermal comfort in hot and dry climate. Build. Environ. 2006, 41, 94–108. [Google Scholar] [CrossRef]
- Muniz-Gäal, L.P.; Pezzuto, C.C.; de Carvalho, M.F.H.; Mota, L.T.M. Urban geometry and the microclimate of street canyons in tropical climate. Build. Environ. 2020, 169, 106547. [Google Scholar] [CrossRef]
- Wonorahardjo, S.; Sutjahja, I.M.; Mardiyati, Y.; Andoni, H.; Thomas, D.; Achsani, R.A.; Steven, S. Characterising thermal behaviour of buildings and its effect on urban heat island in tropical areas. Int. J. Energy Environ. Eng. 2020, 11, 129–142. [Google Scholar] [CrossRef]
- Rosso, F.; Golasi, I.; Castaldo, V.L.; Piselli, C.; Pisello, A.L.; Salata, F.; Ferrero, M.; Cotana, F.; de Lieto Vollaro, A. On the impact of innovative materials on outdoor thermal comfort of pedestrians in historical urban canyons. Renew. Energy 2018, 118, 825–839. [Google Scholar] [CrossRef]
- Schrijvers, P.J.C.; Jonker, H.J.J.; De Roode, S.R.; Kenjereš, S. The effect of using a high-albedo material on the Universal Temperature Climate Index within a street canyon. Urban Clim. 2016, 17, 284–303. [Google Scholar] [CrossRef]
- Matzarakis, A.; Mayer, H.; Iziomon, M.G. Applications of a universal thermal index: Physiological equivalent temperature. Int. J. Biometeorol. 1999, 43, 76–84. [Google Scholar] [CrossRef]
- Höppe, P. The physiological equivalent temperature–a universal index for the biometeorological assessment of the thermal environment. Int. J. Biometeorol. 1999, 43, 71–75. [Google Scholar] [CrossRef] [PubMed]
- Potchter, O.; Cohen, P.; Lin, T.P.; Matzarakis, A. Outdoor human thermal perception in various climates: A comprehensive review of approaches, methods and quantification. Sci. Total Environ. 2018, 631, 390–406. [Google Scholar] [CrossRef] [PubMed]
- Staiger, H.; Laschewski, G.; Matzarakis, A. Selection of appropriate thermal indices for applications in human biometeorological studies. Atmosphere 2019, 10, 18. [Google Scholar] [CrossRef]
- Bruse, M. ENVI-Met 3.0: Updated Model Overview. University of Bochum. 2004. Available online: www.envi-met.com (accessed on 15 November 2023).
- Salata, F.; Golasi, I.; de Lieto Vollaro, R.; de Lieto Vollaro, A. Urban microclimate and outdoor thermal comfort. A proper procedure to fit ENVI-met simulation outputs to experimental data. Sustain. Cities Soc. 2016, 26, 318–343. [Google Scholar] [CrossRef]
- Labdaoui, K.; Mazouz, S.; Acidi, A.; Cools, M.; Moeinaddini, M.; Teller, J. Utilizing thermal comfort and walking facilities to propose a comfort walkability index (CWI) at the neighbourhood level. Build. Environ. 2021, 193, 107627. [Google Scholar] [CrossRef]
- Jia, S.; Wang, Y. Effect of heat mitigation strategies on thermal environment, thermal comfort, and walkability: A case study in Hong Kong. Build. Environ. 2021, 201, 107988. [Google Scholar] [CrossRef]
- Mouada, N.; Zemmouri, N.; Meziani, R. Urban morphology, outdoor thermal comfort and walkability in hot, dry cities: Case study in Sidi Okba, Algeria. Int. Rev. Spat. Plan. Sustain. Dev. 2019, 7, 117–133. [Google Scholar] [CrossRef]
- Coté, M. La Ville et le Désert: Le Bas-Sahara Algérien; Karthala: Paris, France, 2005. [Google Scholar]
- Côte, M. Signatures Sahariennes: Terroirs & Territoires vus du Ciel; Presses Universitaires de Provence (PUP): Aix-en Provence, France, 2012. [Google Scholar]
- Matallah, M.E.; Arrar, H.F.; Faci, M.; Mahar, W.A.; Ben Ratmia, F.Z.; Attia, S. Assessment of Human Outdoor Thermal Comfort in a Palm Grove during the Date Palm Phenological Cycle. Atmosphere 2022, 13, 379. [Google Scholar] [CrossRef]
- Born Bouzaher, S.L.; Alkama, D. The requalification of the palm trees of Ziban as a tool for sustainable planning. Procedia-Soc. Behav. Sci. 2013, 102, 508–519. [Google Scholar] [CrossRef]
- Center for the Built Environment (CBE). Available online: https://clima.cbe.berkeley.edu/ (accessed on 1 August 2023).
- Farhi, A. Biskra: De l’oasis à la ville saharienne (Note). Méditerranée 2002, 99, 77–82. [Google Scholar] [CrossRef]
- Semahi, S.; Zemmouri, N.; Singh, M.K.; Attia, S. Comparative bioclimatic approach for comfort and passive heating and cooling strategies in Algeria. Build. Environ. 2019, 161, 106271. [Google Scholar] [CrossRef]
- Haoui, S.; Chergui, S. Terre, pierre et bois dans l’architecture vernaculaire des Aurès et des Ziban: Des matériaux à usage complémentaire. J. Mater. Environ. Sci. 2016, 7, 3522–3531. [Google Scholar]
- Harrison, G. Meteorological Measurements and Instrumentation; John Wiley & Sons: Hoboken, NJ, USA, 2014. [Google Scholar]
- Mahdavinejad, M.; Moradchelleh, A.; Dehghani, S.; Mirhosseini, S.M. The adoption of central courtyard as a traditional archetype in contemporary architecture of Iran. World Appl. Sci. J. 2013, 21, 802–811. [Google Scholar]
- Ouali, K.; El Harrouni, K.; Abidi, M.L.; Diab, Y. Analysis of Open Urban Design as a tool for pedestrian thermal comfort enhancement in Moroccan climate. J. Build. Eng. 2020, 28, 101042. [Google Scholar] [CrossRef]
- Tsoka, S.; Tsikaloudaki, A.; Theodosiou, T. Analyzing the ENVI-met microclimate model’s performance and assessing cool materials and urban vegetation applications–A review. Sustain. Cities Soc. 2018, 43, 55–76. [Google Scholar] [CrossRef]
- Cohen, P.; Shashua-Bar, L.; Keller, R.; Gil-Ad, R.; Yaakov, Y.; Lukyanov, V.; Bar, P.; Tanny, J.; Cohen, S.; Potchter, O. Urban outdoor thermal perception in hot arid Beer Sheva, Israel: Methodological and gender aspects. Build. Environ. 2019, 160, 106169. [Google Scholar] [CrossRef]
- Liu, Z.; Cheng, W.; Jim, C.Y.; Morakinyo, T.E.; Shi, Y.; Ng, E. Heat mitigation benefits of urban green and blue infrastructures: A systematic review of modeling techniques, validation and scenario simulation in ENVI-met V4. Build. Environ. 2021, 200, 107939. [Google Scholar] [CrossRef]
- Rahul, A.; Edupuganti, S.R.; Naorem, V.; Mukherjee, M.; Brooks, T. Urban risk assessment tools and techniques for ecosystem-based solutions. In Ecosystem-Based Disaster and Climate Resilience: Integration of Blue-Green Infrastructure in Sustainable Development; Springer: Singapore, 2021; pp. 253–278. [Google Scholar]
- Olesen, B.W.; Parsons, K.C. Introduction to thermal comfort standards and to the proposed new version of EN ISO 7730. Energy Build. 2002, 34, 537–548. [Google Scholar] [CrossRef]
- Matallah, M.E.; Ahriz, A.; Zitouni, D.C.; Arrar, H.F.; Ratmia, M.A.E.B.; Attia, S. A methodological approach to evaluate the passive cooling effect of Oasis palm groves. Sustain. Cities Soc. 2023, 99, 104887. [Google Scholar] [CrossRef]
- ASHRAE Guideline 14-2002; Measurement of Energy and Demand Savings. ASHRAE: Atlanta, GA, USA, 2002.


| Variable | Device | Dimensions | Unit | Accuracy | Range |
|---|---|---|---|---|---|
| Air temperature (Ta) | Testo 175 H1 0572 1754 | 149 × 53 × 27 mm | °C | ±0.4 °C | −20 to + 55 °C |
| Relative humidity (RH) | % | ±1.0% | 0 to 100% |
| Construction Materials | Layers (Outside to Inside) | Composition | Thickness (m) | Thermal Conductivity (W/m-K) | Specific Heat Capacity (J/kg K) | Density (kg/m3) | Albedo | Emissivity | Absorption |
|---|---|---|---|---|---|---|---|---|---|
| Wall 1 (Reference) | Layer 1 Layer 2 Layer 3 Layer 4 Layer 5 | Mortar Hollow brick Air cavity Hollow brick Plaster | 0.02 0.15 0.05 0.10 0.02 | 1.40 0.48 0.024 0.48 0.35 | 1080 936 1000 936 936 | 2200 900 1.22 900 800 | 0.30 0.34 - 0.34 0.93 | 0.84 0.9 0.9 0.91 | 0.50 0.66 - 0.66 0.07 |
| Wall 2 | Layer 1 Layer 2 Layer 3 | Mortar Concrete hollow block Plaster | 0.02 0.20 0.02 | 1.40 1.10 0.35 | 1080 1080 936 | 2200 1300 800 | 0.30 0.30 0.93 | 0.94 0.92 0.91 | 0.50 0.80 0.07 |
| Wall 3 | Layer 1 Layer 2 Layer 3 | Mortar Mud brick (adobe) Plaster | 0.02 0.50 0.02 | 1.40 0.81 0.35 | 1080 1075 936 | 2200 2500 800 | 0.30 0.33 0.93 | 0.94 0.85 0.91 | 0.50 0.69 0.07 |
| Wall 4 | Layer 1 Layer 2 Layer 3 | Mortar Lime stone Plaster | 0.02 0.60 0.02 | 1.40 2.40 0.35 | 1080 936 936 | 2200 2400 800 | 0.3 0.4 0.93 | 0.94 0.95 0.91 | 0.50 0.50 0.07 |
| Roof | Layer 1 Layer 2 Layer 3 | Concrete Concrete slab (hollow block) Mortar | 0.05 0.16 0.02 | 0.46 1.45 1.40 | 1080 1080 1080 | 1200 1450 2200 | 0.30 0.30 0.30 | 0.94 0.92 0.94 | 0.50 0.80 0.50 |
| Street floor | Concrete pavement Asphalte Loamy soil | 0.01 0.10 - | - - - | - - - | - - - | 0.50 0.20 - | 0.90 0.90 0.90 | - - - |
| Space Geometry | |||||
|---|---|---|---|---|---|
| Street orientation | E-W N-S | E-W N-S | E-W N-S | E-W N-S | |
| Longitude (°) | 5.73 | 5.73 | 5.73 | 5.73 | |
| Latitude (°) | 34.85 | 34.85 | 34.85 | 34.85 | |
| Aspect Ratio (H/W) | 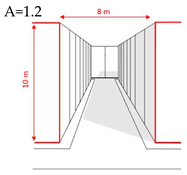 | 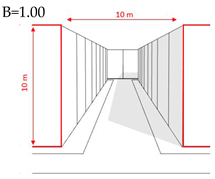 | 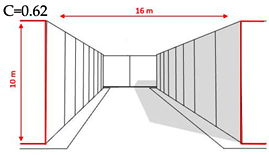 | ||
| Model geometry | |||||
| Grid size | 100 m × 70 m × 20 m | 100 m × 70 m × 20 m | 100 m × 70 m × 20 m | 100 m × 70 m × 20 m | |
| dx = size of X grid | dx = 2.00 | dx = 2.00 | dx = 2.00 | dx = 2.00 | |
| dy = size of Y grid | dy = 2.00 | dy = 2.00 | dy = 2.00 | dy = 2.00 | |
| dz = size of Z grid | dz = 2.00 | dz = 2.00 | dz = 2.00 | dz = 2.00 | |
| Construction material | |||||
| Building material | Walls: Created wall: Mortar; (hollow brick/ air/hollow brick); plaster  | Walls: Created wall: Mortar; concrete hollow block; plaster 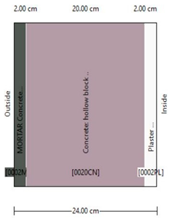 | Walls: Created wall: Mortar; mud brick (adobe); plaster 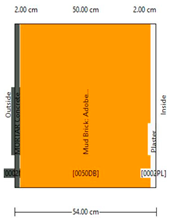 | Walls: Created wall: Mortar; lime stone; plaster 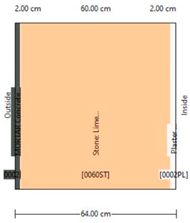 | |
| Roofs: Created roof: Concrete; concrete slab (hollow block); mortar 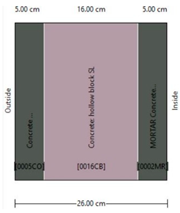 | Roofs: Created roof: Concrete; concrete slab (hollow block); mortar  | Roofs: Created roof: Concrete; concrete slab (hollow block); mortar 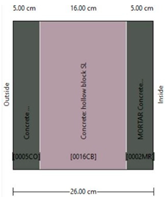 | Roofs: Created roof: Concrete; concrete slab (hollow block); mortar  | ||
| Soil | Concrete pavement Asphalt Road Loamy soil | Concrete pavement Asphalt Road Loamy soil | Concrete pavement Asphalt Road Loamy soil | Concrete pavement Asphalt Road Loamy soil | |
| Simulation | |||||
| Start date | 10 July 2021 | 10 July 2021 | 10 July 2021 | 10 July 2021 | |
| Start time | 23 h 00 | 23 h 00 | 23 h 00 | 23 h 00 | |
| Total simulation time | 48 h | 48 h | 48 h | 48 h | |
| Type of meteorological boundary conditions | Full forcing—CSV | Full forcing—CSV | Full forcing—CSV | Full forcing—CSV | |
| Street | Indices | Reference Station | |
|---|---|---|---|
| Baseline | RMSE | 1.34 | 5.08% |
| MBE | 0.76 | 2.88% | |
| Categories | Canyon A (H/W = 1.25) | Canyon B (H/W = 1) | Canyon C (H/W = 0.62) | ||||||||||
|---|---|---|---|---|---|---|---|---|---|---|---|---|---|
| BR | CN | AD | ST | BR | CN | AD | ST | BR | CN | AD | ST | ||
| Cooling efficiency | E-W | ∇12.5% | ∇8.3% | ∇50.0% | ∇41.7% | ∇2.1% | ∇66.7% | ∇31.3% | ∇33.3% | ∇35.4% | ∇39.6% | ∇18.8% | ∇35.4% |
| Heat retention | ∆25.5% | ∆64.6% | ∆2.1% | ∆29.2% | ∆77.1% | ∆8.3% | ∆25.0% | ∆25.0% | ∆37.5% | ∆29.2% | ∆37.5% | ∆18.8% | |
| Cooling efficiency | N-S | ∇4.2% | ∇8.3% | ∇8.3% | ∇85.4% | ∇12.5% | ∇25.0% | ∇50.0% | ∇50.0% | ∇0.0% | ∇0.0% | ∇0.0% | ∇100.0% |
| Heat retention | ∆70.8% | ∆70.8% | ∆66.7% | ∆10.4% | ∆39.6% | ∆54.2% | ∆27.1% | ∆12.5% | ∆93.8% | ∆93.8% | ∆93.8% | ∆0.0% | |
| Thermal perception | |||||||||||||
| Warm | E-W | 22.9% | 22.9% | 22.9% | 22.9% | 8.3% | 22.9% | 20.8% | 20.8% | 22.9% | 16.7% | 20.8% | 18.8% |
| N-S | 6.3% | 6.3% | 6.3% | 37.5% | 4.2% | 4.2% | 6.3% | 6.3% | 4.2% | 4.2% | 4.2% | 41.7% | |
| Hot | E-W | 29.2% | 27.1% | 29.2% | 29.2% | 41.7% | 29.2% | 29.2% | 29.2% | 29.2% | 33.3% | 50.0% | 31.3% |
| N-S | 47.9% | 47.9% | 47.9% | 20.8% | 50.0% | 50.0% | 47.9% | 47.9% | 50.0% | 50.0% | 50.0% | 16.7% | |
| Extreme heat | E-W | 47.9% | 50% | 47.9% | 47.9% | 50% | 47.9% | 50% | 50% | 47.9% | 50% | 50% | 50% |
| N-S | 45.8% | 45.8% | 45.8% | 41.7% | 45.8% | 45.8% | 45.8% | 45.8% | 45.8% | 45.8% | 45.8% | 41.7% | |
| PET (°C) | 17–26 | 26–28 | 28–37 | 37–42 | >42 | ||||||||
| Thermal comfort stress level | Neutral | Slightly warm | Warm | Hot | Very hot | ||||||||
| No thermal stress | Slight heat stress | Moderate heat stress | Strong heat stress | Extreme heat stress | |||||||||
Disclaimer/Publisher’s Note: The statements, opinions and data contained in all publications are solely those of the individual author(s) and contributor(s) and not of MDPI and/or the editor(s). MDPI and/or the editor(s) disclaim responsibility for any injury to people or property resulting from any ideas, methods, instructions or products referred to in the content. |
© 2023 by the authors. Licensee MDPI, Basel, Switzerland. This article is an open access article distributed under the terms and conditions of the Creative Commons Attribution (CC BY) license (https://creativecommons.org/licenses/by/4.0/).
Share and Cite
Ben Ratmia, F.Z.; Ahriz, A.; Santi, G.; Bouzaher, S.; Mahar, W.A.; Ben Ratmia, M.A.E.; Matallah, M.E. Street Design Strategies Based on Spatial Configurations and Building External Envelopes in Relation to Outdoor Thermal Comfort in Arid Climates. Sustainability 2024, 16, 221. https://doi.org/10.3390/su16010221
Ben Ratmia FZ, Ahriz A, Santi G, Bouzaher S, Mahar WA, Ben Ratmia MAE, Matallah ME. Street Design Strategies Based on Spatial Configurations and Building External Envelopes in Relation to Outdoor Thermal Comfort in Arid Climates. Sustainability. 2024; 16(1):221. https://doi.org/10.3390/su16010221
Chicago/Turabian StyleBen Ratmia, Fatima Zahra, Atef Ahriz, Giovanni Santi, Soumia Bouzaher, Waqas Ahmed Mahar, Mohamed Akram Eddine Ben Ratmia, and Mohamed Elhadi Matallah. 2024. "Street Design Strategies Based on Spatial Configurations and Building External Envelopes in Relation to Outdoor Thermal Comfort in Arid Climates" Sustainability 16, no. 1: 221. https://doi.org/10.3390/su16010221
APA StyleBen Ratmia, F. Z., Ahriz, A., Santi, G., Bouzaher, S., Mahar, W. A., Ben Ratmia, M. A. E., & Matallah, M. E. (2024). Street Design Strategies Based on Spatial Configurations and Building External Envelopes in Relation to Outdoor Thermal Comfort in Arid Climates. Sustainability, 16(1), 221. https://doi.org/10.3390/su16010221