Article

Ultrasound Application in Potato Cultivation: Potential for Enhanced Yield and Sustainable Agriculture

by
Piotr Pszczółkowski
1,* and
Barbara Sawicka
2
1
Experimental Station for Cultivar Assessment of Central Crop Research Centre, Uhnin, 21-211 Dębowa Kłoda, Poland
2
Department of Plant Production Technology and Commodity Science, University of Life Sciences in Lublin, Akademicka Str. 15, 20-950 Lublin, Poland
*
Author to whom correspondence should be addressed.
Sustainability 2024, 16(1), 108; https://doi.org/10.3390/su16010108
Submission received: 30 October 2023 / Revised: 29 November 2023 / Accepted: 18 December 2023 / Published: 21 December 2023

Abstract

:
Ultrasounds, characterized by high-frequency air vibrations exceeding 20 kHz, have traditionally found applications in medicine and the food industry, primarily for analyzing chemical composition and food product structure. They also have potential uses in agriculture, particularly in potato cultivation. Objective: The aim of this study was to assess the potential to increase yields of selected potato varieties through the use of ultrasound in agricultural practices. The research findings were derived from a field experiment conducted on Luvisols between 2015 and 2017 in central-eastern Poland. The field experience was designed using a randomized complete-block split-plot layout with three replications. The primary factor included eight potato cultivars representing various maturity groups. The second-order factors included two cultivation management practices: (A) ultrasound application as a pre-plant treatment, and (B) a control group without ultrasound application (sonication). The study assessed potato tuber yield and its structural characteristics. Results: Tuber yield was influenced by the chosen cultivation practices, as well as the variations in responses among potato cultivars to environmental factors and pre-plant treatments. Conclusion: The research findings suggest that the use of ultrasounds in agricultural practices holds promise as a valuable tool for promoting sustainable agriculture, increasing potato cultivation productivity, and fostering environmentally friendly production methods.

1. Introduction

Potato (Solanum tuberosum L.) holds a prominent position among the world’s essential crops for the global economy. It stands as the third-largest food crop worldwide in terms of human consumption and is the fourth-largest in production, following corn, rice, and wheat, according to the FAO [1]. Ultrasounds, characterized by high-frequency air vibrations exceeding 20 kHz, are considered non-invasive factors in the field of acoustics and do not contribute to increased chemical applications in agriculture. Ultrasound is an acoustic wave, and its frequency is beyond the range of human hearing, with the upper audible limit being approximately 20 kHz. The conventional upper limit for ultrasound is set at around 10 GHz [2,3]. Ultrasound is defined by physical parameters such as wave propagation speed, wavelength, amplitude, frequency, and intensity. The intensity of the wave governs the energy flux carried by the sound, and frequency primarily determines the hearing threshold [2,4]. Ultrasound has been employed extensively in fields such as medical diagnostics, medicine, construction, industry, environmental protection, and various economic sectors [2,5,6].
Recent discoveries have confirmed that plants can sense, generate, and emit sound waves, which play a role in plant adaptation to the environment [6,7,8]. Physical signals, including acoustic signals, can quickly propagate at lower energy costs, enabling plants to adapt to environmental changes more swiftly and efficiently compared to chemical responses [7,8,9]. Acoustic waves are capable of transmitting energy and environmental information to plants, leading to changes in their growth and development [10,11,12]. Under certain controlled conditions, abiotic stresses can stimulate growth or energy release through sound and touch in some plant species, despite the activation of antioxidants [11]. In a recent study, the use of piezoelectric ultrasound (PE-US) on explants via a liquid medium led to the identification of heat shock proteins (HSP) at 17 °C. Additionally, 72 genes associated with glutathione S-transferases (GST) and 2 genes related to zinc finger proteins (ZFP) were detected at 6 °C [13]. This study found that potatoes subjected to PE-US stress exhibited significantly longer roots, higher shoot fresh weight (SFW), a much higher chlorophyll a/b ratio, and lower chlorophyll b content.
In food production, high-power, low-frequency ultrasonic waves (20–100 kHz) are utilized. Ultrasound is primarily employed in two main directions in food processing: diagnostics (defect inspection and food testing) and the direct support of various processes and technological operations, including washing, cutting, grinding, extraction, emulsification, homogenization, drying, and freezing, among others [6,14,15,16,17,18,19,20,21]. Thus far, no adverse side effects of ultrasound usage in agriculture or agri-food processing have been identified.
In agriculture, various physical factors, such as magnetic fields, electric fields, electromagnetic fields, ionizing radiation, long-wave radiation, short-wave radiation, laser light, and ultrasounds, are employed to enhance yield and improve health safety. According to several authors [19,20,21,22], these treatments do not alter the chemical composition of reproductive materials but have a modifying impact on physiological and chronological processes. Ultrasound has been demonstrated to have a positive influence on plant morphology, anatomy, and biophysical properties [13,21,22]. Furthermore, it influences various biological and physiological processes in plants, such as seed germination, the cell cycle, cell proliferation, shoot and root growth, callus development, signal transduction systems, enzyme and hormone activity, and gene expression [10,13,13,22,23,24,25]. Recent publications [9,24,26] and collaborative studies [13] have highlighted the ability of ultrasound to alter potato plants in response to stress, impact mRNA transcription, and enhance in vitro growth and development.
Furthermore, 13 gene sequences that significantly respond to ultrasound have been recently identified, which are believed to be homologous to Solanum lycopersicum genes (SLXTH) [27,28]. There is experimental evidence that plants not only sense and respond to ultrasound but also emit ultrasound in the frequency range of 20 to 300 kHz, especially in response to drought stress. It is suggested that plants may utilize ultrasound radiation from various cells or plant parts to transport water within plants, such as in xylem or phloem transport [29]. For ecological reasons, ultrasound may offer advantages over chemical methods [13,20,21,24]. During the sonication process, mechanical vibrations at various frequencies (kHz) are employed, and water serves as an excellent medium for the propagation of ultrasound waves. Ultrasound stimulates plant growth and cell division, and it can affect intracellular division and possibly inhibit growth [21,22,30,31].
Ultrasound has been investigated for its potential to improve crop yield and quality through various mechanisms. The principle of ultrasound in agriculture involves the application of sound waves with frequencies above the audible range for humans [2,6,9]. Here are some ways in which ultrasound may influence plants:
Cellular Permeability: Ultrasound can increase the permeability of plant cell membranes, facilitating the absorption of nutrients and water [2].
Metabolic Activity: Ultrasound may stimulate metabolic processes in plants, leading to increased growth rates and overall plant development [9,11].
Pathogen Control: Ultrasound has been explored for its antimicrobial effects, potentially helping to control pathogens and pests in crops [17].
Seed Germination and Tuber Propagation: Ultrasound treatment has been investigated for its impact on seed germination and the growth of tuber-propagated crops, promoting quicker and more-uniform germination [21,22].
Genetic Expression: Ultrasound can influence gene expression in plants, leading to changes in various physiological processes [24,26].
Research on ultrasonic treatment for increasing plant yield and improving quality has been conducted on various crops, including but not limited to:
Rice: Studies have explored the application of ultrasound in rice cultivation to enhance seed germination and grain yield [1].
Wheat: Ultrasound has been investigated for its effects on wheat seed germination and plant growth [1].
Soybeans: Research has examined the impact of ultrasound on soybean seed germination and plant development [2].
Potatoes: As mentioned in previous queries, ultrasound has been studied for its potential effects on potato yield and tuber quality [9,13,20,21,24,26].
The research status for asexual propagation crops with tubers or buds such as potatoes as propagators indicates ongoing investigations into how ultrasound may influence the growth, development, and yield of these crops [2,4,21,22,30,31]. However, specific findings may vary based on the crop type, ultrasound parameters, and environmental conditions.
It is important to note that while ultrasound shows promise in agriculture, the effectiveness of ultrasound treatment can be influenced by factors such as frequency, intensity, and duration of exposure, as well as the specific stage of plant development [5,6,13,14,15,16,17,18,19,20,21]. Research in this field is dynamic, and new findings continue to emerge.
The objective of this study was to illustrate the influence of ultrasonic application in the cultivation of specific edible potato cultivars on enhancing tuber sprouting capacity, promoting plant growth, consequently augmenting both overall and commercial yields and improving tuber structure.
The alternative research hypothesis suggests that:
  • Subjecting potato tubers to ultrasound treatment prior to planting is anticipated to elevate the yield per unit area and produce a yield structure with a favorable proportion of marketable fractions.
  • Physical treatments on potato tubers before planting will significantly influence the structure, overall yield, and commercial yield of the tubers of the studied cultivars, in contrast to the null hypothesis, which assumes that physical treatments will not have a significant impact on these characteristics.

2. Material and Methods

2.1. Field Research

The field experience was conducted from 2015 to 2017 at the Cultivar Assessment Experimental Station in Uhnin, in the Lublin region (51°34′ N, 23°02′ E, H = 155 m above sea level), on Luvisols composed of NRCS-USDA sandy loam [32]. The experiment followed a randomized split-plot design with three replications. The primary factor involved eight potato cultivars. The second-order factor was management practices in potato cultivation.

2.2. Characteristics of Cultivars

The studied potato cultivars can be summarized as follows:
  • ‘Denar’: Very early, light-yellow skin, slightly yellow flesh, round-oval tubers, versatile for salads, taste rating: 7/9.
  • ‘Lord’: Very early, light-yellow skin, slightly yellow flesh, round-oval tubers, versatile for salads, taste rating: 7/9.
  • ‘Owacja’: Early, Light-yellow skin, slightly yellow flesh, round-oval tubers, versatile (B-BC), suitable for general consumption, taste rating: 7/9.
  • ‘Vineta’: Early, light-yellow skin, yellow flesh, round tubers, suitable for general consumption, taste rating: 7/9.
  • ‘Satina’: Medium-early, light-yellow skin, yellow flesh, round-oval tubers, suitable for general consumption, taste rating: 7.5/9.
  • ‘Tajfun’: Medium-early, light-yellow skin, yellow flesh, oval tubers, slightly floury, versatile for culinary uses, taste rating: 7/9.
  • ‘Syrena’: Medium-late, light-yellow skin, yellow flesh, oval tubers, ideal for various culinary uses, taste rating: 7/9.
  • ‘Zagłoba’: Medium late, light-yellow skin, yellow flesh, round-oval tubers, suitable for general consumption, taste rating: 6.5/9.
These cultivars vary in terms of maturity, skin and flesh color, and culinary applications. The taste ratings, assessed on a nine-point scale, provide a subjective evaluation of each cultivar’s flavor. The choice of potato cultivar can be tailored to one’s culinary preferences and intended use [33].

2.3. Cultivation Practices

Two methods of managing potato crops were used in the experiment:
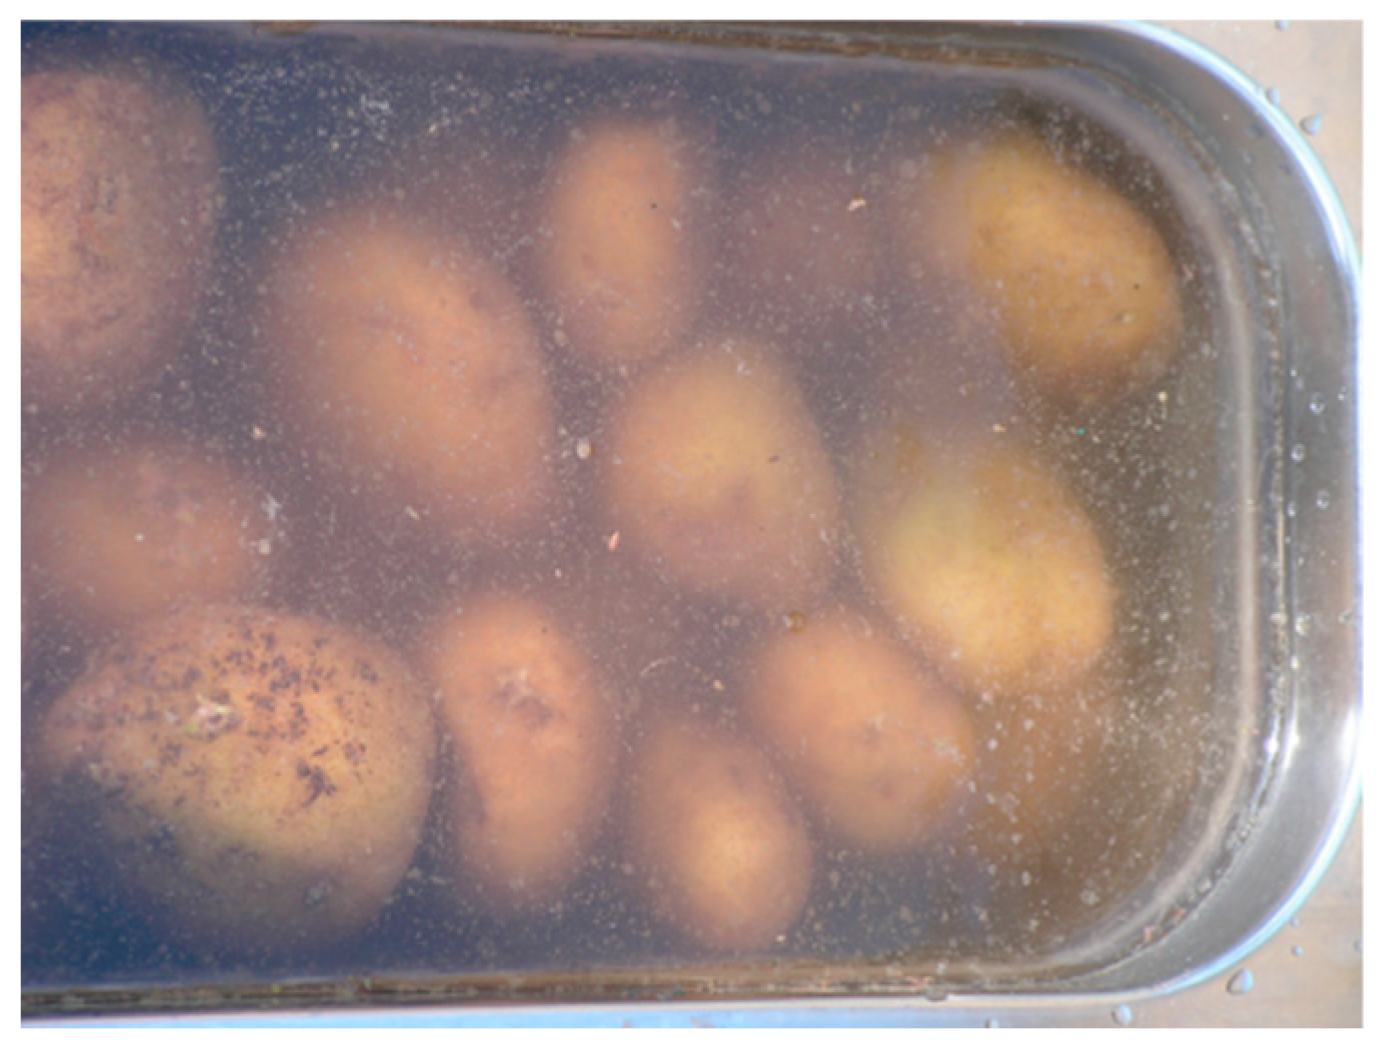
before planting, the potato tubers were sonicated in an aquatic environment at 18 °C for the time specified in the pilot studies (10 min),
control object in which the tubers were soaked in distilled water for 10 min before planting.
Tuber sonication was carried out in an ultrasonic bathtub device equipped with three ultrasonic piezoelectric transducers, glued under the bottom of the tank made of acid-resistant steel sheet (Figure 1). They generated ultrasounds powered by an alternating current, and had a frequency of 50 Hz, according to [34], with a power of 200 W.

2.4. Growing Conditions

The preceding crop for potatoes throughout the experiment was winter triticale. After harvesting, stubble cultivation was performed. In each fall before planting, winter plowing was conducted to a depth of approximately 27 cm. During spring, the field underwent harrowing, followed by the sowing of NPK fertilizers, which were then mixed with the soil using a cultivating unit to a depth of 12 cm. Mineral fertilizers, including potassium, phosphorus, and sulfur, were applied to the soil in the following quantities: 39.3 kg P ha−1, 112.1 kg K ha−1, and 15.8 kg S ha−1. The determination of mineral fertilization was based on the soil’s content of these components. Nitrogen fertilizers, totaling 90 kg N ha−1 (27 kg polyphoska + 63 kg urea), were sown in the spring. Prior to initiating the experiment each year, a new certified reproductive material of EU A class was procured. The planting of qualified class A potato propagating material was performed manually at the end of April, with a spacing of 67.5 × 37 cm. The plot size for harvest was 15 m2. There was a total of 48 plots in the field experiment (2 technologies × 8 cultivars × 3 repetitions). The entire area with tramlines and sowing when establishing the experiment was 1500 m2, and for harvesting it was 720 m2. The protection of plants against diseases, pests, and weeds was carried out following the principles of Good Agricultural Practice [35].
Throughout the growing season, three sprays were applied to combat early blight and late blight, while control measures were taken against the Colorado potato beetle as needed, utilizing available preparations (Table 1). Each year, prior to harvest, tubers were excavated from ten randomly chosen plants in each plot to assess the quantity and weight of tubers falling into the categories of <35 mm, 36–50 mm, 51–60 mm, and >60 mm in diameter [36]. The harvest of tubers for each potato cultivar occurred sequentially at the physiological maturity phase (BBCH 98) [37]. The total tuber yield encompassed the combined weight of tubers gathered from the entire plot area, including the weight of previously collected samples, with the results expressed in t ha−1 [36]. Marketable yield refers to tubers with a diameter exceeding 35 mm, devoid of external and internal defects, and free from greening [38].
The tuber yield structure was determined on an electric sorter by counting and weighing tubers according to the fractions: <35, 36–50, 51–60, and >60 mm in diameter [38]. Based on the yield structure, the marketable yield was then calculated by subtracting the weight of tubers with defects and deformations [38,39].
The marketable yield was calculated by subtracting the weight of defective and deformed tubers from the total yield. This represents the mass of tubers considered suitable for sale in the market. An example equation could look like this:
Marketable Yield = Total Yield − Weight of Tubers with Defects [39].
Such calculations allow for obtaining the mass of tubers that are considered of high quality and meet the commercial criteria, which is significant from the perspective of market sales of potato tubers.

2.5. Soil Sampling

Prior to initiating the experiment, a total of 20 individual soil samples were collected annually, constituting a composite sample weighing approximately 0.5 kg [40]. The soil samples collected in this manner were analyzed for various parameters, including particle size distribution (Table 2), pH in 1 mol KCl·dm−3 [41], and organic carbon content (Corganic), using the Tiurin method [42]. Additionally, based on the organic carbon content, the humus content in the soil was determined [43], and the levels of P [44], K [45], Mg, Cu, Zn, Fe, and B [46] were quantified.

2.6. Soil Minerals Analysis

The soil exhibited a slightly acidic pH, low humus content, high to very high levels of phosphorus and magnesium, and low to medium levels of potassium. Additionally, the soil featured a medium manganese and iron content, a medium to high copper content, a high zinc content, and a high boron content (Table 3).

2.7. Meteorological Conditions

During the potato growing season in the conducted field studies in all years, variable meteorological conditions were observed (Table 4). The year 2015 was characterized by the highest total precipitation during the vegetation period, but its distribution was not favorable for potato cultivation and yield. After planting the tubers in May, there was a recorded rainfall of 120 mm, which was 200% of the perennial average. During the intensive growth period of potato plants (June–August), there was a significant shortage of precipitation. Air temperatures during this period were 3.7 °C higher than the long-term norm. The Sielianinov hydrothermal coefficient characterizes these months as dry to extremely dry. September was very humid and warm. However, the rainfall in that month no longer significantly affected tuber yield (Table 4).
In 2016, the year was characterized by high temperatures and the lowest total rainfall, which, however, was favorably distributed throughout the potato growing season. May recorded 78% of the long-term average rainfall, with an air temperature 1.5 °C higher than the long-term average for the month. Both June and July were warmer than the long-term average, accompanied by optimal rainfall. However, water shortages were observed in August and September. The hydrothermal coefficient describes 2016 as an extremely dry and hot year (Table 4).
The year 2017 was characterized by variable meteorological conditions. April was very humid, with optimal rainfall recorded in May. In June, water shortages were observed, while July experienced rainfall at 176% of the long-term average. August, on the other hand, faced a deficit of precipitation, marked by high air temperatures. The average daily temperature in August was 2.5 °C higher than the long-term norm. To summarize, June was very dry, July was characterized by ample rainfall, and August was once again very dry. September had a higher amount of rainfall, but it did not significantly impact potato yield (Table 4).

2.8. Statistical Calculations

The results were analyzed using the three-factor ANOVA model (SAS 9.2, 2008) [48], and multiple T-Tukey tests were conducted with a selected significance level of α = 0.05. Analysis of variance models encompassed main effects and interactions among the studied factors, with specific attention to main effects and two-way interactions. T-Tukey’s multiple comparison tests facilitated comprehensive comparative analyses of means, identifying statistically homogeneous groups of means through the least significant differences (LSD), denoted as HSD (Tukey’s Honest Significant Difference) groups. The result tables present crucial components of the analysis of variance, including calculated probabilities (p-values) associated with F-test functions (F-Snedecor or Fisher-Snedecor). These p-values determine the significance and extent of the impact of the examined factors on the differentiation of analyzed variables in comparison to commonly accepted α significance levels (0.05, 0.01). Letter indicators accompanying the means (significance groups) establish homogeneous groups, with shared letter indices indicating no statistically significant difference. Subsequent letter indices—a, b, etc.—designate groups of means in ascending order.
The procedure for constructing a standard normal probability plot for yield involved sorting and assigning ranks to deviations from the mean (residuals), which were then arranged in ascending order. Based on these ranks, standardized normal distribution values were calculated under the assumption that the data originated from a normally distributed population. Subsequently, these calculated values were plotted on the Y-axis of the graph. If the observed residuals, presented on the X-axis, conform to a normal distribution, all points should fall on a straight line. However, if the residuals do not follow a normal distribution, they will deviate from this straight line. This type of chart also helps in identifying outliers [49].

3. Results

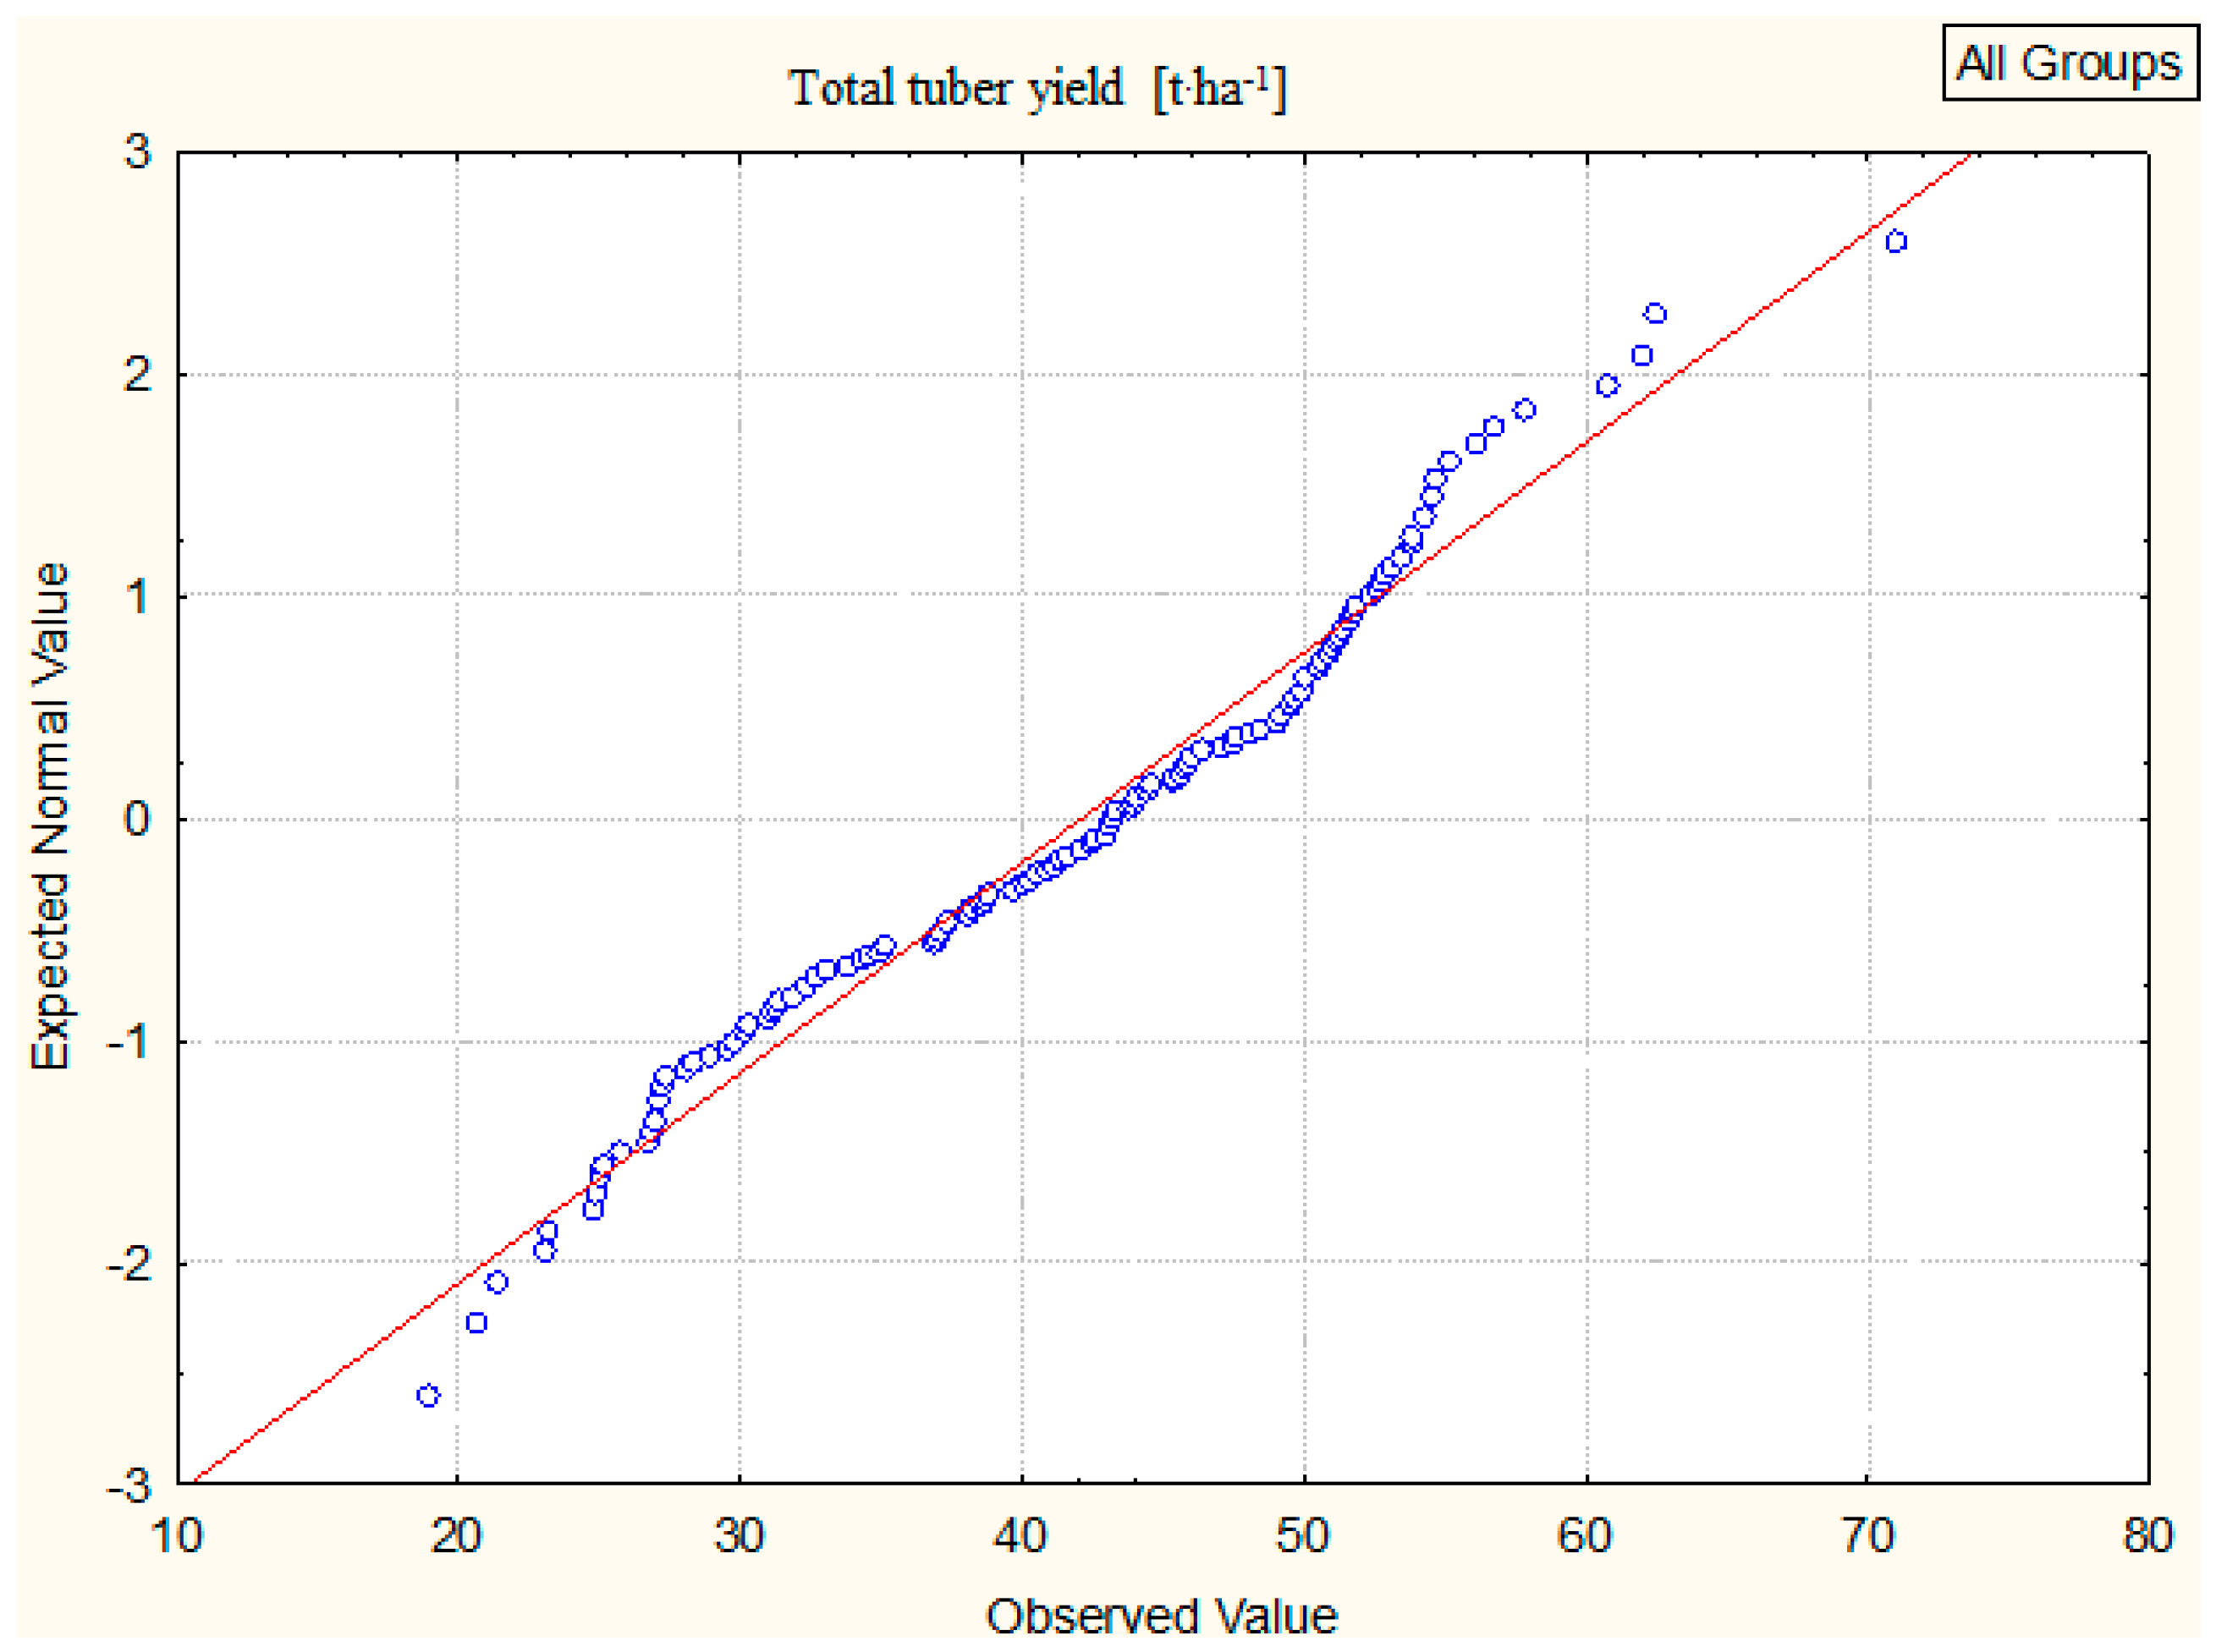
3.1. Total Tuber Yield

The tuber yield in the experiment exhibited an average of 42.09 tons per hectare, with each of the experimental factors demonstrating a notable influence on the overall tuber yield (Table 5).
The application of ultrasound as a pre-planting treatment in potato cultivation led to a notable increase in total tuber yield compared to the control conditions, with an enhancement of 5.4% (Table 5).
Among the tested cultivars, ‘Zagłoba’ exhibited the highest total tuber yield, while the early cultivar ‘Owacja’ yielded the least. The tested cultivars can be divided into three statistically homogeneous groups based on yield: ‘Lord’, ‘Owacja’, ‘Vineta’, and ‘Tajfun’; ‘Denar’ and ‘Satina’; and ‘Syrena’ and ‘Zagłoba’ (Table 5).
The meteorological conditions throughout the study years exerted the most substantial impact on the total potato yield. The highest yield was recorded in 2016, a year characterized by low total rainfall but favorable distribution during tuber formation and yield accumulation. In contrast, 2015, a dry and hot year, resulted in the lowest tuber yield. ‘Denar’, ‘Lord’, ‘Vineta’, and ‘Tajfun’ were the cultivars most sensitive to the lack of rainfall, while ‘Satina’ and ‘Syrena’ demonstrated the greatest resilience to the adverse weather conditions in 2015 (Table 5).
During the second year of the study, characterized by a more favorable distribution of rainfall, the tested cultivars demonstrated increased yield stability. ‘Zagłoba’ proved to be the most efficient cultivar, with a yield exceeding 60 t·ha−1, while ‘Owacja’, ‘Vineta’, ‘Satina’, and ‘Lord’ were among the least productive (Table 5).
In 2017, a year marked by alternating periods of excess and shortage of rainfall, certain cultivars yielded poorly. ‘Owacja’ and ‘Tajfun’ were grouped in terms of their yield. Another group of cultivars exhibited similar yields, including ‘Lord’, ‘Vineta’, and ‘Syrena’. Meanwhile, the cultivars ‘Denar’ and ‘Zagłoba’ performed exceptionally well, yielding the highest tuber quantities (Table 5). The interaction between the year and management’s cultivation practices was insignificant.
The total tuber yield values in Figure 2 appear to follow a normal distribution, indicated by their alignment along a straight line. This adherence to a normal distribution instills a high level of confidence in the obtained results, suggesting minimal deviations or variations in the distribution of the analyzed variables.
This kind of plot is frequently employed to evaluate the normality of a variable’s distribution. It visualizes the degree of resemblance between the distribution of a specific variable and a normal distribution. To construct a standard normal probability plot, the following steps are typically followed: Ranking Residuals: Initially, the deviations from the mean (residuals) are organized in ascending order, and consecutive numbers are assigned as ranks. Based on these ranks, standardized values for a normal distribution are calculated, assuming that the data originate from a normally distributed population.
Plot Z-Values: The computed z-values are subsequently plotted along the Y-axis of the graph. In the event that the observed residuals, plotted on the X-axis, adhere to a normal distribution, all points should align on a straight line. Conversely, if the residuals deviate from a normal distribution, they will diverge from this straight line. This type of plot is also useful for identifying outliers in the data.
So, in this case, the alignment of the total tuber yield values along a straight line in the plot suggests that the distribution of these values is close to a normal distribution, which is a positive indicator for statistical analysis and interpretation.

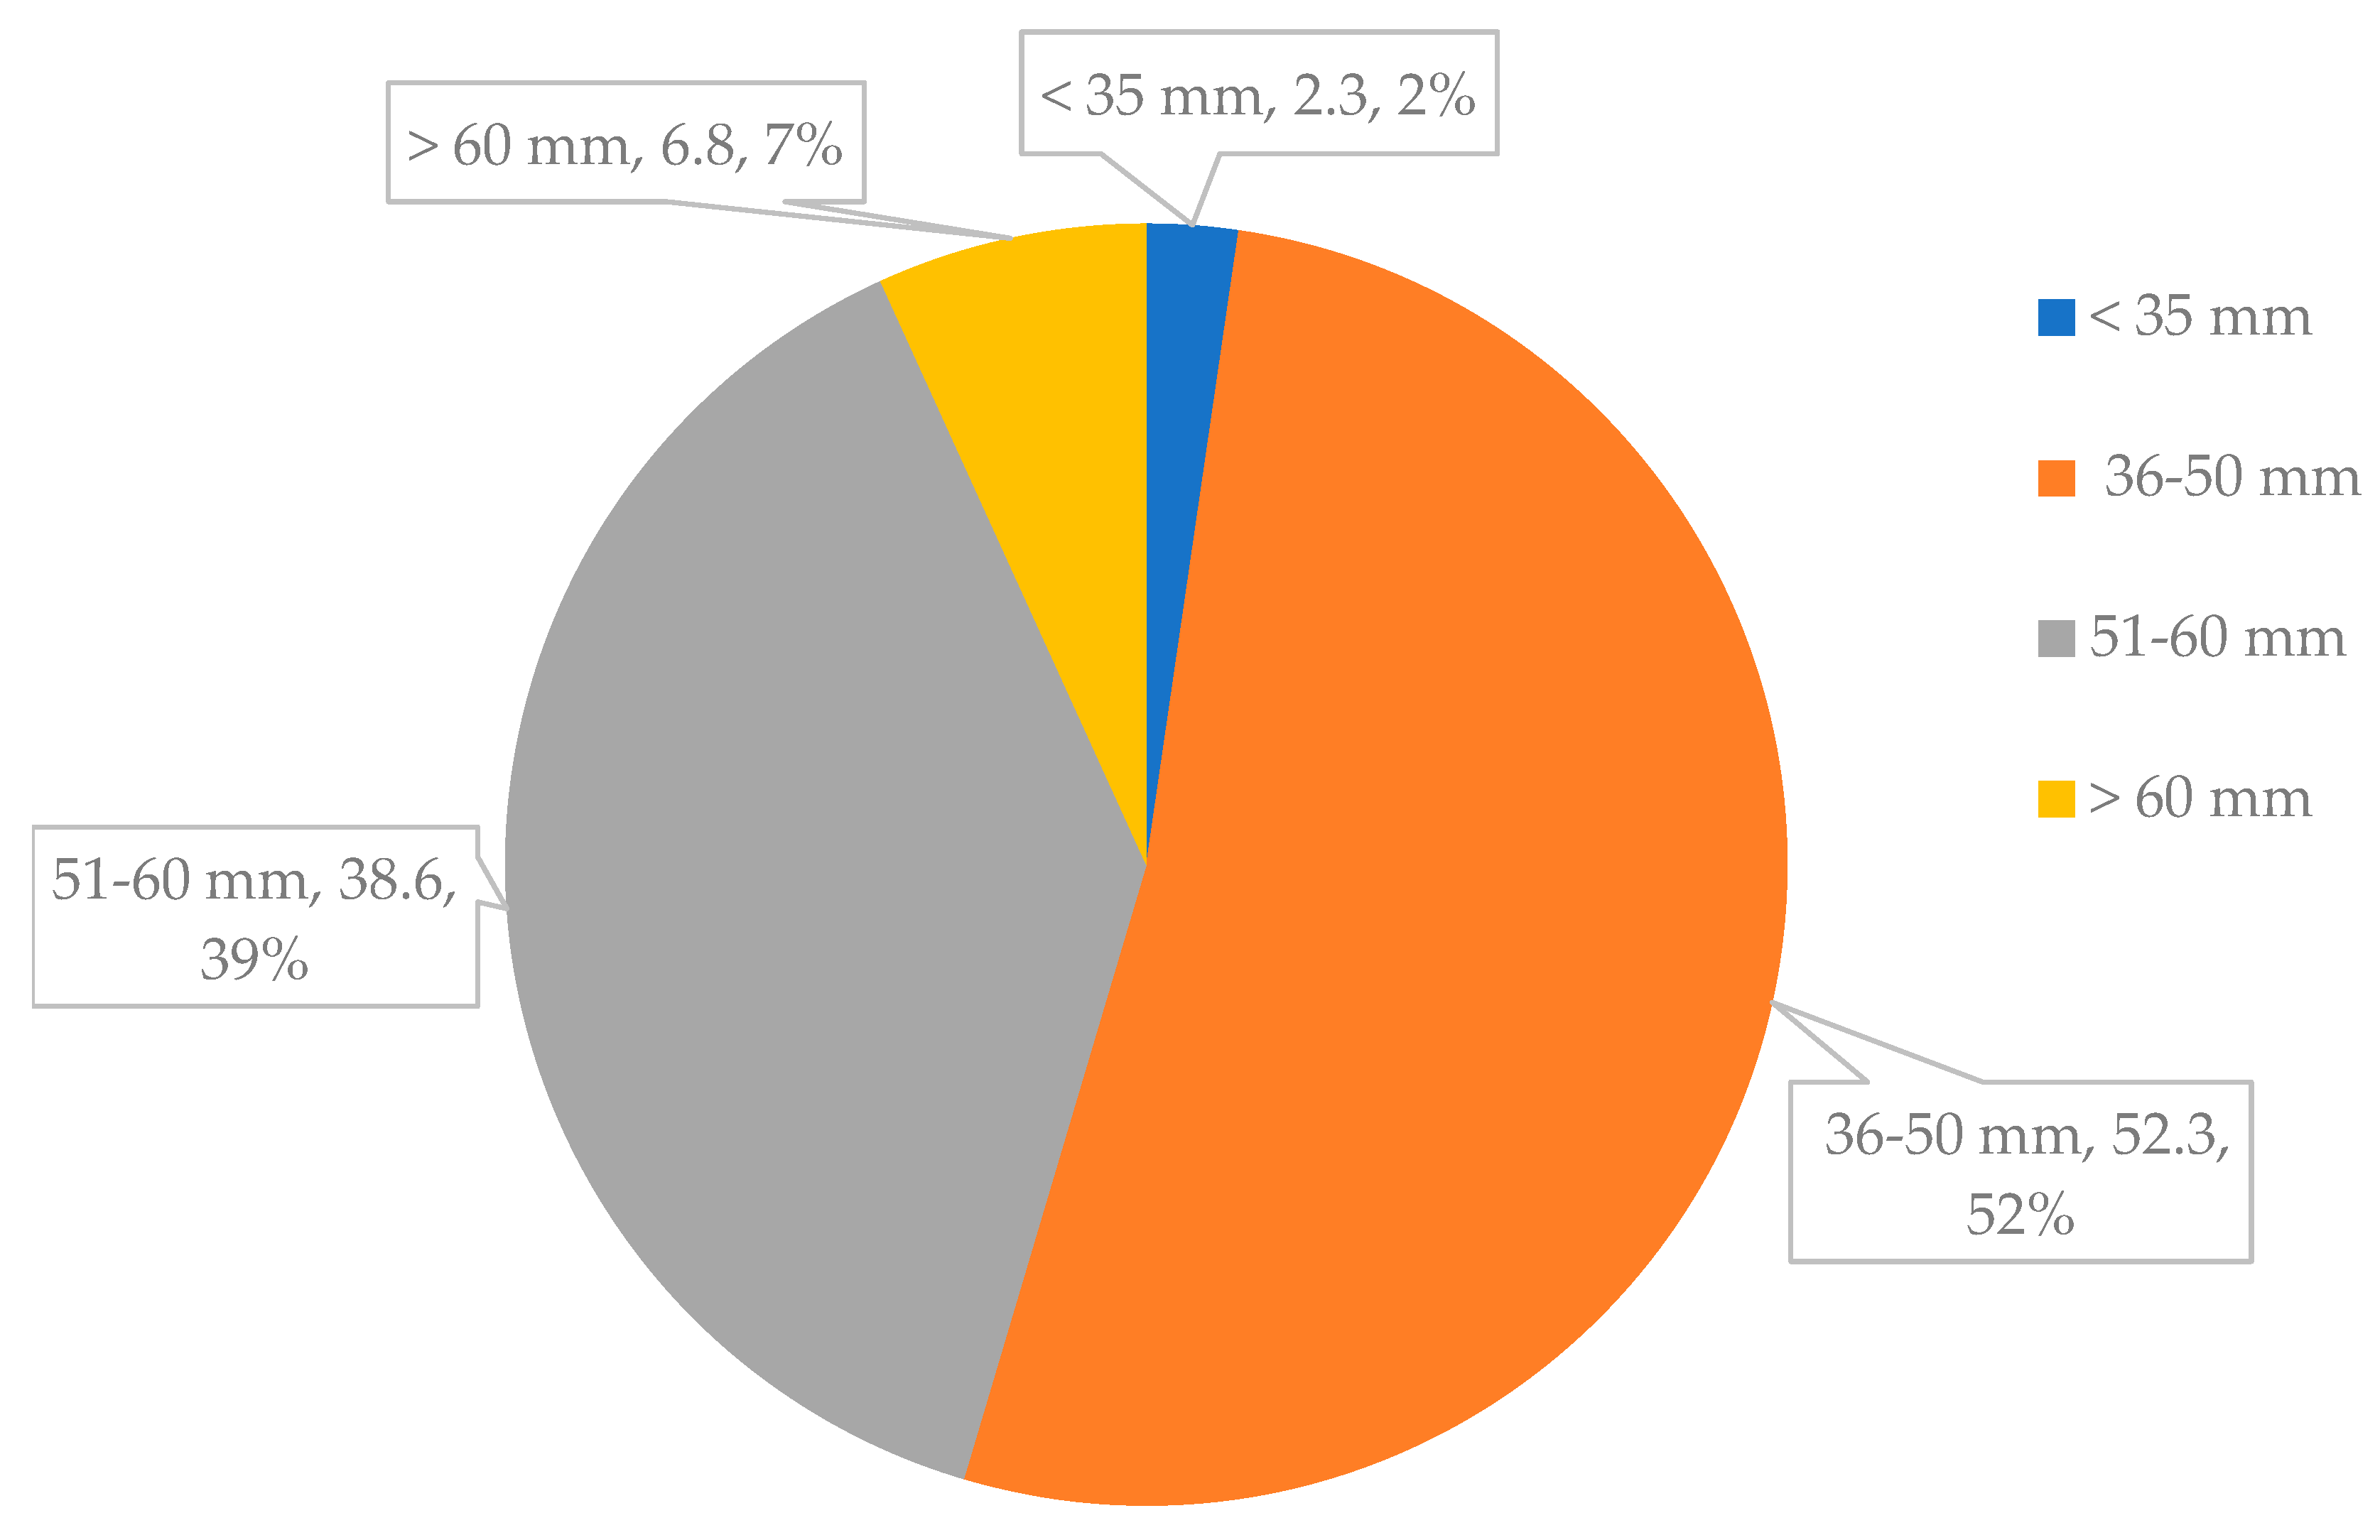
3.2. Tuber Mass Structure

The majority of the potato yield comprised tubers with a diameter ranging from 36 to 50 mm (52.3%), whereas the smallest proportion was attributed to tubers with a diameter less than 35 mm (2.3%) (Figure 3).
Figure 3 presents the percentage distribution of individual tuber fractions in the overall yield. The majority of the yield is concentrated in the 36–50 mm category, while tubers smaller than 35 mm constitute a small proportion of the total yield. The 51–60 mm fraction is also significant, whereas tubers larger than 60 mm represent the smallest portion of the yield but still have their share.
The application of ultrasound in potato cultivation did not yield a significant impact on the distribution of tuber fractions compared to the control group. Nevertheless, a positive trend was noted within the 35–50 mm fraction (Table 6).
The genetic characteristics of the examined potato cultivars significantly influenced the composition of tuber mass in the total yield. Among the cultivars, ‘Syrena’ showed the smallest proportion of small tubers with a diameter below 35 mm, whereas the early-maturing ‘Owacja’ cultivar had the largest share of such small tubers. For the ‘Zagłoba’ variety, the lowest share was found in the fraction of tubers with diameters of 36–50 mm, while the highest share was recorded for tubers with diameters of 51–60 mm and over 60 mm. In contrast, the ‘Tajfun’ cultivar exhibited the opposite situation (Table 6).
In the first year of the study, which had the lowest total tuber yield, the largest shares were observed within the tuber fractions of <35 mm and 36–50 mm, and the smallest percentage was seen among tubers with diameters of 51–60 mm and over 60 mm. In the most productive year, 2016, the situation was different: the smallest fractions were represented by tubers with diameters of <35 mm and 36–50 mm, whereas the largest fractions included larger tubers with diameters of 51–60 mm and over 60 mm (Table 6).

3.3. Percentage of Marketable Yield

The marketable yield of tubers, on average, constituted 97.8% of the total yield (as indicated in Table 7). The application of ultrasound prior to planting did not result in a significant effect on the proportion of marketable tubers in the overall yield.
Among the different potato cultivars, the early cultivar ‘Owacja’ had the smallest share of tubers that met commercial size requirements, while the late cultivar ‘Syrena’ had the largest share of such marketable tubers. Among the studied cultivars, two homogeneous groups were identified: ‘Denar’ and ‘Zagłoba’; and ‘Lord,’ ‘Vineta,’ ‘Satina,’ and ‘Tajfun’ (Table 7).
The meteorological conditions throughout the study years exerted the most substantial influence on the volume of marketable yield and its relative proportion within the total tuber yield. The highest marketable yield, with a 99.1% share of tubers meeting the requirements of the Polish Standards for table potatoes, was observed in the bountiful year of 2016. This year was characterized by an excellent distribution of rainfall during the potato vegetation period, which was favorable for crop harvesting. In contrast, the lowest marketable yield and the lowest percentage of tubers meeting the marketable size criteria were recorded in 2015, a year marked by extreme drought during the most critical growth period (Table 7).

3.4. Marketable Tuber Yield

The size of the marketable yield of tubers adopted a normal distribution as all values were arranged along a straight line. This confirms the great confidence in the obtained results, as they form a straight line, and the status of the highest yields is ideally situated along a straight line (Figure 4).
The marketable tuber yield in the experiment was substantial, averaging 41.24 tons per hectare (Table 8).
The incorporation of ultrasound into potato cultivation management led to a 5.5% increase in this metric compared to the control group (Table 8).
Among the varieties, ‘Owacja’, ‘Vineta’, and ‘Tajfun’ formed a single homogeneous group, displaying the lowest marketable yield. In contrast, the late-maturing ‘Zagłoba’ cultivar achieved the highest marketable tuber yield. Additionally, a homogeneous group was formed by the cultivars ‘Satina’ and ‘Denar’ (Table 8).
The reaction of the examined cultivars to the management practices in potato cultivation exhibited diversity. Most cultivars exhibited a positive response to pre-planting tuber sonication, with only two cultivars, ‘Denar’ and ‘Tajfun’, showing no significant impact on the volume of commercial yield. In both management methods, the cultivars ‘Owacja’ and ‘Vineta’, proved to be the least productive, while the cultivars ‘Satina’ and ‘Syrena’ turned out to be the most productive (Table 8).
In 2015, a year marked by significant precipitation shortages and high air temperatures, the lowest yields were observed for the ‘Vineta’, ‘Lord’, and ‘Denar’ cultivars, which formed a single homogeneous group. Another group consisted of ‘Tajfun’, and ‘Owacja’ cultivars. With slightly higher yields, ‘Satina’ and ‘Syrena’ were grouped into yet another homogeneous group. The ‘Zagłoba’ cultivar yielded the highest (Table 8).
In the following year, 2016, characterized by optimal thermal and humidity conditions, the highest commercial tuber yield was achieved by the cultivar ‘Zagłoba’ (59.79 t/ha). Right behind it was the early cultivar ‘Denar.’ The next positions in the same homogeneous group were occupied by the cultivars ‘Syrena’ and ‘Tajfun.’ Meanwhile, the lowest commercial yields were obtained by the cultivars ‘Owacja,’ ‘Satina,’ ‘Vineta,’ and ‘Lord,’ forming a homogeneous group (Table 8).
In the year 2017, characterized by variable weather conditions, the lowest commercial tuber yields were produced by the cultivars ‘Owacja’ and ‘Tajfun.’ The next cultivars forming a homogeneous group were ‘Lord,’ ‘Satina,’ and ‘Syrena,’ while the highest commercial tuber yields were obtained by two equally productive cultivars: ‘Denar’ and ‘Zagłoba,’ originating from different earliness groups (Table 8).
The interaction between the year and management’s cultivation practices turned out to be insignificant.

3.5. Descriptive Statistics of Dependent and Independent Variables

Table 9 provides descriptive statistics for both the dependent (y1 and y2) and independent variables (x1, x2, x3, x4, and x5).
Here is the interpretation and commentary on these statistics:
Mean: Mean values serve as a central measure for each variable. y1 and y2 had similar means, with y1 at 42.32 and y2 at 41.48. x1 had a mean of 2.24; x2 had a mean of 52.33; x3 had a mean of 38.56; x4 had a mean of 6.83; and x5 had a mean of 97.75.
Standard Error: It indicates the precision of sample means. Smaller standard errors suggest more reliable sample means.
The median represents the middle value of a dataset when ordered from lowest to highest. For y1 and y2, median values were slightly below the mean values. For x1, x3, x4, and x5, medians were also slightly below the means, indicating a slight left skew.
Standard Deviation: This measures the spread or variability in the data. y1 and y2 had similar standard deviations, suggesting similar variability. The independent variables (x1, x2, x3, x4, and x5) had larger standard deviations compared to y1 and y2, indicating greater variability in these independent variables.
Kurtosis measures the tiredness or shape of the distribution. Negative kurtosis values suggest a platykurtic (light-tailed) distribution. The kurtosis values for y1, y2, x1, x2, x3, x4, and x5 were all negative, indicating light-tailed distributions.
Skewness: Skewness measures the asymmetry in the distribution. y1, y2, x3, and x5 had negative skewness, suggesting a slight left skew (longer left tail). x1, x2, and x4 had positive skewness, suggesting a slight right skew (longer right tail).
Range: The range is the variance between the highest and lowest values in the dataset. The range varied widely, with x2 having the highest range (63.29) and x1 having the lowest (5.95).
Minimum and Maximum: These values provide the absolute lowest and highest observations in the dataset.
Coefficient of Variation (CV%): The CV% represents the percentage of the standard deviation relative to the mean. It measures relative variability. y1 and y2 had similar CV% values, indicating comparable relative variability. x3 had the highest CV% (96.23%), indicating substantial relative variability compared to the mean.
In summary, Table 9 provides a comprehensive overview of the distribution, variability, and shape of the data for both dependent and independent variables. It offers valuable insights for further analysis and interpretation of the dataset.

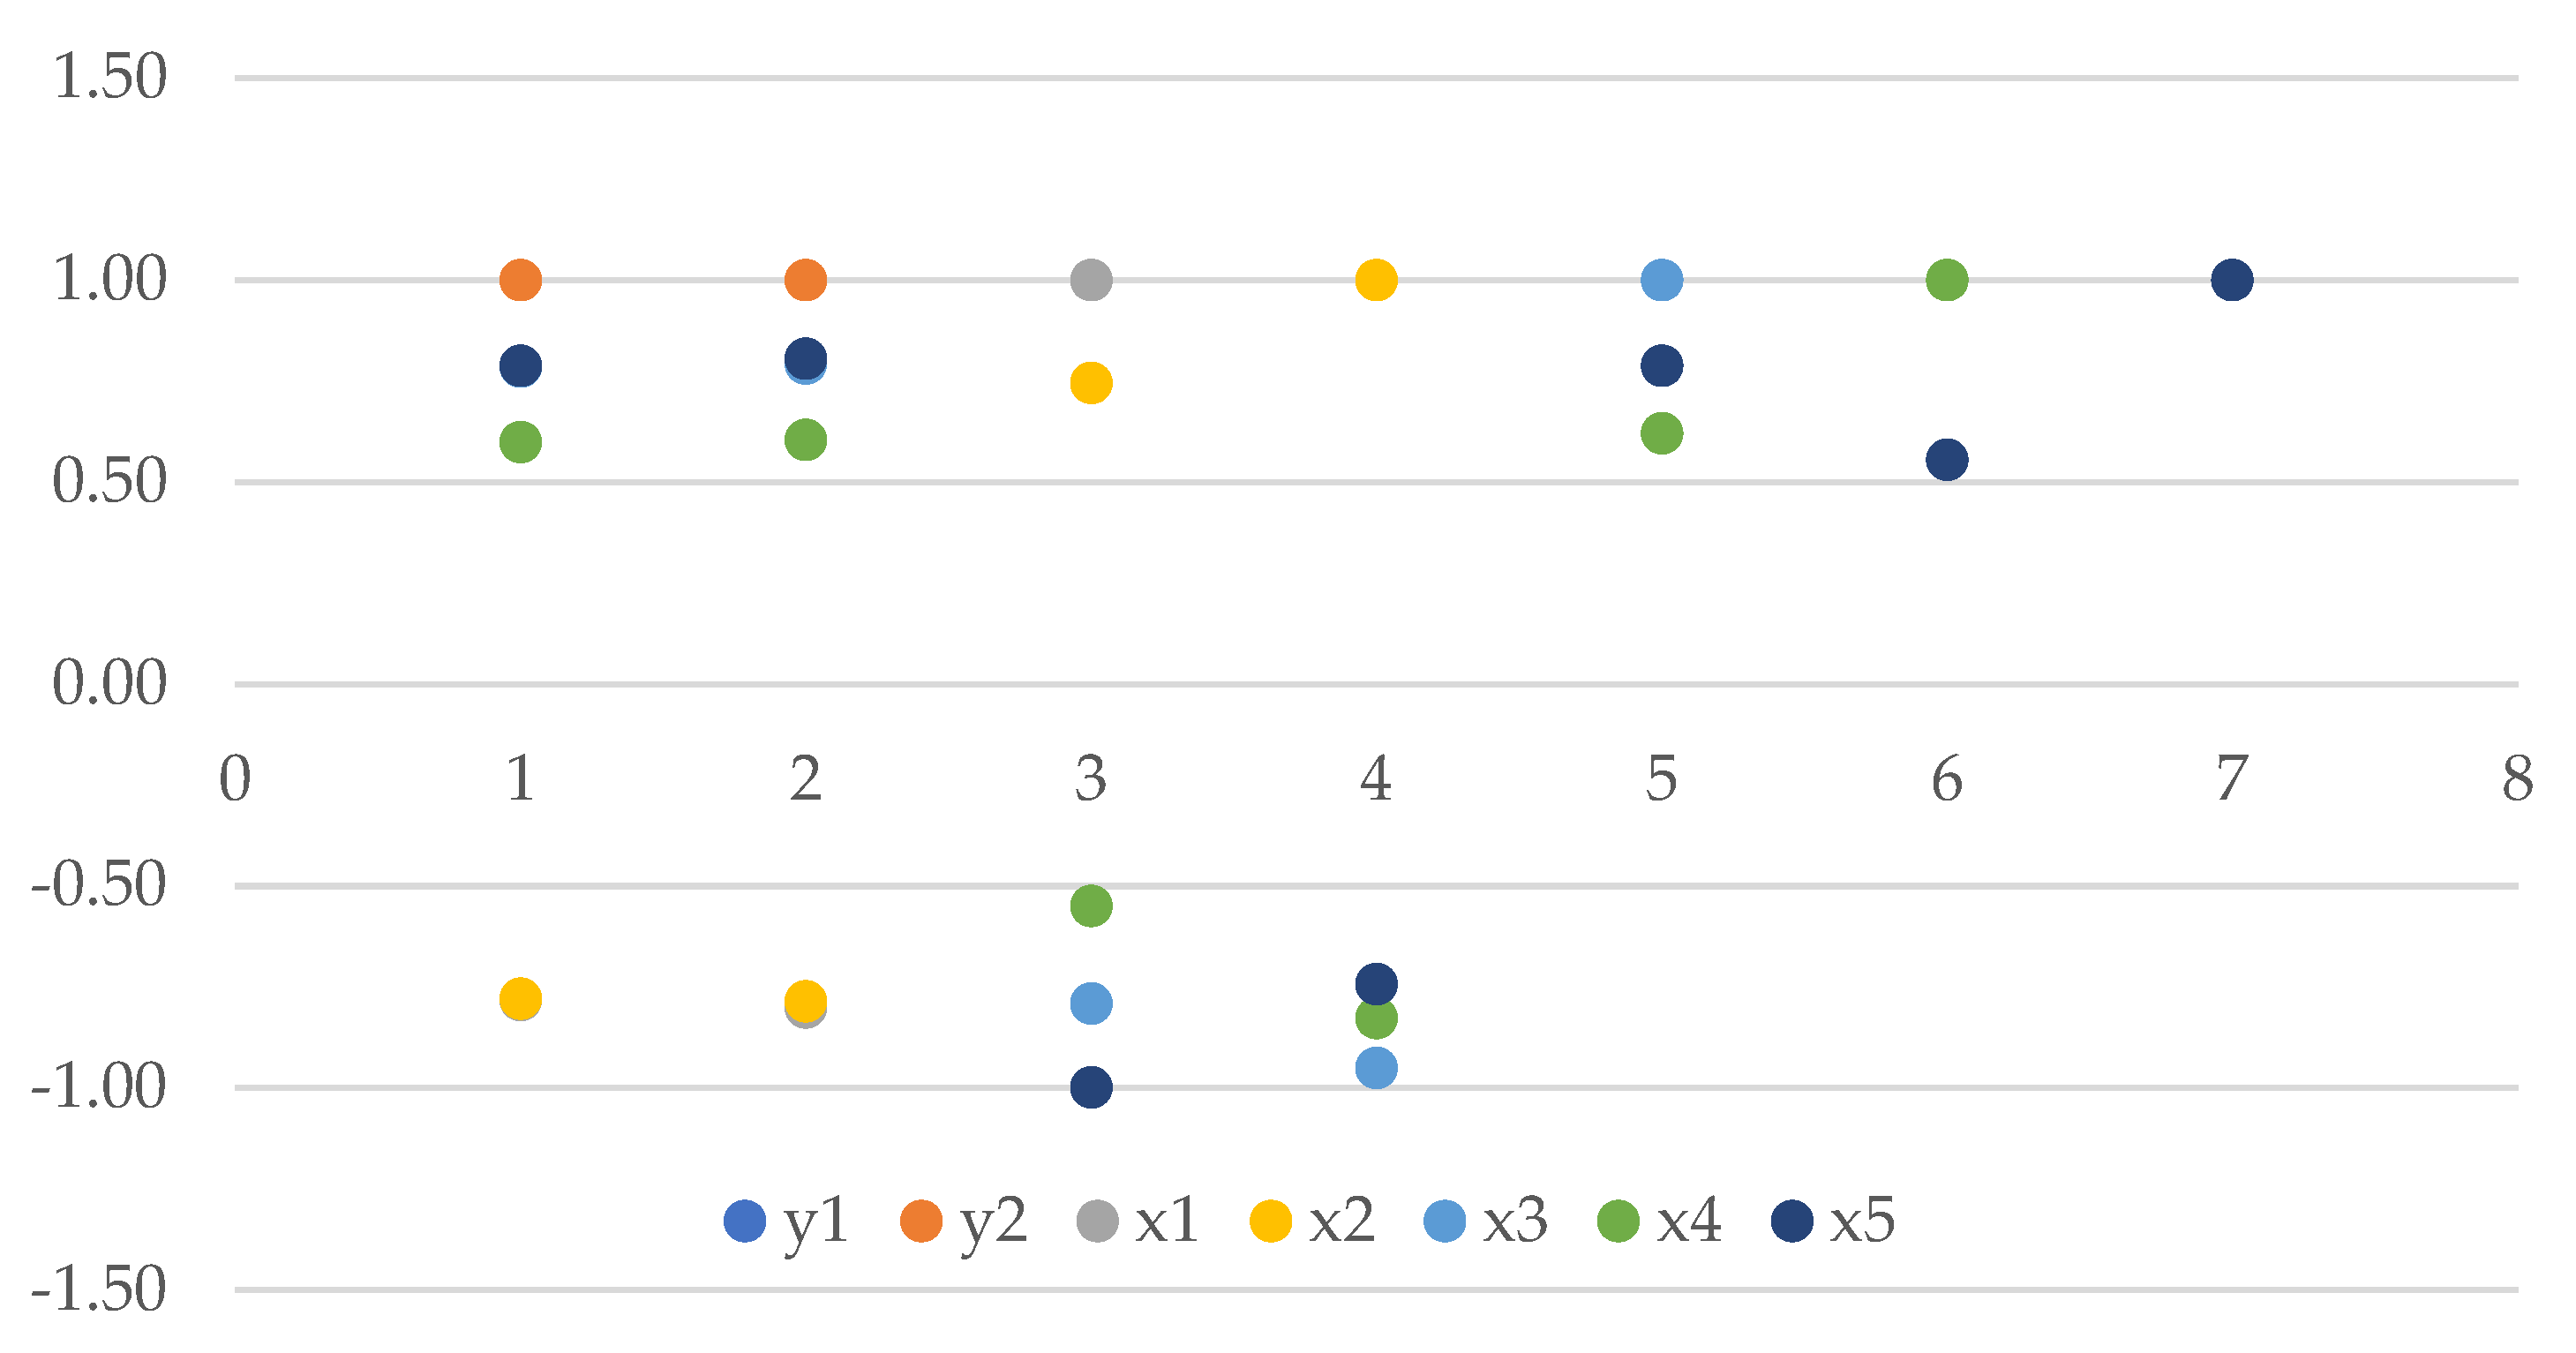
3.6. Dependence of Total and Marketable Yield on Its Structure

Figure 5 presents Pearson’s correlation coefficients between dependent (y) and independent (x) variables. Below is an interpretation of the correlations:
y1 (total yield) and y2 (commercial yield) have a perfect positive correlation of 1.00. This means that they move together in the same direction, indicating that as total yield increases, so does commercial yield, and vice versa;
The variable x1 (percentage of tuber mass with a diameter <36 mm) exhibits a robust negative correlation of r = −0.78 with y1 (total yield). An increase in the percentage of small tubers is associated with a decrease in total yield;
x2 (percentage of the mass of tubers with a diameter 36–50 mm) and y1 (total yield) also have a strong negative correlation of r = −0.78. This suggests that an increase in the percentage of tubers in the 36–50 mm range is associated with a decrease in total yield;
x3 (percentage of the mass of tubers with a diameter 51–60 mm) and y1 (total yield) have a strong positive correlation of r = 0.79. This means that an increase in the percentage of tubers in the 51–60 mm range is associated with an increase in total yield;
x4 (percentage of the mass of tubers with a diameter >60 mm) and y1 (total yield) have a moderate positive correlation of r = 0.60. This indicates that as the percentage of large tubers (>60 mm) increases, the total yield tends to increase as well;
x5 (percentage of commercial yield) and y2 (commercial yield) have a perfect positive correlation of r = 1.00. This shows that they are directly proportional, with increases in one corresponding to increases in the other (Figure 5).
In summary, the Figure 5 reveals various correlations between the variables, providing insights into how changes in one variable relate to changes in another. These correlations can be valuable for understanding the factors influencing total and commercial potato yields. Descriptive statistics of the analyzed data serve as a valuable source for a comprehensive overview of the dataset, enabling further analysis and interpretation. It emphasizes the characteristics, distribution, and variability of both dependent and independent variables, which are crucial for making informed decisions and drawing meaningful conclusions from the data.

4. Discussion

Research on ultrasound in agriculture contributes to sustainable development by introducing innovative methods to improve crop yields and quality while minimizing negative environmental impacts. Our research supports sustainable development through:
Resource Efficiency: Research on ultrasound allows for the efficient use of resources such as water and fertilizers. By increasing the permeability of plant cell membranes, ultrasound helps with the better absorption of nutrients, potentially reducing the amount of fertilizers used and minimizing excessive water consumption in the cultivation process [2,4].
Reduction in Chemical Usage: The application of ultrasound in combating pathogens and pests can contribute to reducing the need for chemical plant protection products. The reduced use of pesticides (only three fungicide treatments were applied against Phytophthora infestans, providing full protection against this pathogen, and the Colorado potato beetle was controlled 2–3 times in the L2–L3 stage of the pest) promotes biodiversity conservation and minimizes negative impacts on the environment [20,21].
Improvement of Soil Quality: Research on ultrasound can influence soil structure by stimulating microbiological processes. This may increase soil fertility, enhancing its ability to retain nutrients and supporting sustainable agri-food production [5,6,7].
Increased Energy Efficiency: Effective ultrasound methods can lead to increased energy efficiency in agriculture by optimizing cultivation processes, contributing to the reduction of greenhouse gas emissions [2,4].
Optimization of Manufacturing Processes: In ultrasound research, there is potential for optimizing food manufacturing processes. These processes may include storage, packaging, or food processing, impacting sustainable food production by reducing losses and eliminating unhealthy substances [15,16,17].
Sustainable Plant Production: Through the application of ultrasound to stimulate plant growth, accelerate seed germination, or optimize yields, this research contributes to sustainable plant production, which is crucial for global food security [13,24,26].
The conducted research demonstrates that the implementation of ultrasound in potato cultivation significantly enhanced both total and commercial tuber yield compared to the control group. Similar outcomes were achieved by other researchers [11,22,24,26].
The authors established that various species and cultivars of crops exhibit diverse responses to sound waves transmitted at low frequencies (20 Hz to 20 kHz) or higher frequencies, such as ultrasound (US) (>20 kHz). Consequently, their growth can be either stimulated, suppressed, or even inhibited by acoustic waves. These waves from the environment of plants, whether occurring naturally or artificially, influence processes such as seed germination in various crops. The induction of the antioxidant system, alterations in soluble protein levels, increased sugar content in plant tissues, enhanced ATPase activity in the plasmalemma leading to elevated Ca2+ concentration in the cytosol, modifications during the cell cycle by influencing the number of cells in a specific phase, and developmental changes in vitro are among the observed effects of acoustic signals on plants. Additionally, it is recognized that acoustic signals can induce changes in gene expression [6,10,11,12,13,24,26]. These sound stimuli have the potential to prime plants for self-defense against various abiotic stresses (e.g., drought) or biotic stresses (e.g., insect invasion) [6,50]. Mishra et al. [50] developed a model for the signaling of sound or acoustic waves in plants, revealing that these molecular events, whether penetrating or overlapping across frequencies (20 Hz to 20 kHz) or at higher frequencies such as ultrasound (US) (>20 kHz), can either stimulate or suppress plant growth, acting as a stimulus or a stressor. Depending on the species, both sound vibrations (SVs) and ultrasound (US) may serve as abiotic stressors [51], potentially negatively impacting the cellular and genetic integrity of the plant [52].
The issue associated with employing ultrasound stems from the fact that it induces heating, depending on the duration and intensity of the treatment given to the plants [13]. Under the influence of prolonged use of ultrasound in the treated plants, the number of proteins, such as heat shock proteins, increases. Some heating may also occur as a side effect of the ultrasound application. Somewhat later, in the case of the PE-US treatment, an increase in the level of heat shock proteins was detected. Hence, plant material should be kept at a constant temperature (25 °C) to avoid the side effects of heating [13]. In the case of AB-US, the treatment conditions may not be suitable to maintain a constant temperature of the plant material (i.e., it has not been possible to cool the plant material directly).
Teixeira da Silva et al. [13], to explain the molecular differences caused by ultrasound, applied two different types of ultrasound treatment (using different media transmitting ultrasound waves (air and water). They described the upregulation and downregulation of DEG related to various metabolic processes and also noted metabolic changes related to abiotic stress and drought stress relief. Therefore, all molecular data have been mapped on the basis of KEGG maps to biochemical pathways, and their possible or potential impact on the physiology, growth and development of plants has been described [13]. It was also investigated whether there was any change in the expression of potato protein genes, including enzymes that are related to plant stress defense, such as heat shock proteins, glutathione-ascorbate enzymes, or other RFT-scavenging pathways known in plants [13].
The genetic characteristics of the cultivars played a significant role in determining both the total and commercial yield of potato tubers in the conducted research. All cultivars were characterized separately due to different levels of genetic determination of these traits. The cultivar of these economic characteristics of potatoes has been confirmed by many authors [21,22,31,53]. The attractiveness of potatoes on the market is determined by the genetically determined parameters of the tuber appearance (shape and regularity, the depth of the eyes, and the color and character of the skin). Due to the increasing requirements of table potato recipients regarding the presence of mechanically damaged, deformed, or cracked tubers in the offered batch, as well as with flesh defects (hollowness, rusty blotch, glassy flesh), it is worth paying attention to the fact that this cultivar should be less sensitive to abiotic stresses manifested by such defects. A similar dependence also applies to the cultivar’s resistance to skin diseases, which is also vital for the appearance of the tubers.
The reaction of the tested cultivars to ultrasound varied in relation to the proportion of commercial tubers and their yield. This is due to the cultivar’s different response to abiotic factors. When low-frequency sound waves (20 Hz to 20 kHz) or high-frequency ultrasound (>20 kHz) are applied to plants, it can pose a significant abiotic stress for them [51]. Researchers tested potato plants grown in ‘in vitro’ cultures and demonstrated that piezoelectric ultrasound constitutes acute abiotic stress for potato plants [13,26]. However, the potato metabolic system showed a strong defense against stress, accompanied by a modification of the growth processes, but ultimately, the recovery of growth occurred within four weeks. The authors emphasize that the shoot length decreased by approximately 20% in 4-week-old potato plants from in vitro cultures exposed to piezoelectric ultrasound, while the weight and parameters associated with the root system (root length and weight) improved by 23–68%. A more detailed explanation for the diverse responses of potato cultivars to ultrasound is provided by researchers who assessed the in vitro transcriptome of potato (Solanum tuberosum L.) subjected to airborne (AB-US) or liquid (PE-US) ultrasound. They uncovered the upregulation or downregulation of several differentially expressed (DEG) genes related to abiotic stress. To better characterize the stress-related elements over the four weeks, the AB-US transcriptome was compared to the PE-US transcriptome. Upon comparing the control groups of both treatments, DEG associated with hypoxia was not detected. However, DEG associated with hypoxia was identified in the combination of a liquid medium and ultrasound. DEG encoding chitinase, peroxidase, glutathione S-transferase, transcription factors ERF (ethylene-responsive factor), DREB (binding of dehydration-responsive elements), WRKY, and MYB were also significantly more strongly expressed in PE-US compared to AB-US. The upregulation and downregulation of DEG related to metabolic processes and enzymes of the antioxidant system further confirm that PE-US imposes a more substantial abiotic stress than AB-US. The transcriptomic analysis suggests that liquid-based ultrasound serves as a more potent abiotic stressor than airborne ultrasound. Despite the ultrasonic stress in the experiment, the germinated tubers survived and produced a higher tuber yield. It is plausible that heat shock proteins and transcription factors played a significant role in this context [9].
In the conducted research, ultrasound, employed as a transplant treatment, significantly enhanced both the total and commercial yield of tubers and exerted a beneficial effect on the yield structure. Studies by other researchers [13,52] have demonstrated the harmful effects of ultrasound on cellular and nuclear integrity in various plant species. According to other sources [24,26], the use of acoustic sound or ultrasound under extreme conditions, such as high frequencies or prolonged exposure, can be detrimental and even fatal for plants. However, under milder conditions, the impact may vary, either improving or negatively affecting plant growth and development, contingent on the plant species.
Transcriptomic analysis revealed that liquid-based ultrasound poses a more significant abiotic stress than airborne ultrasound [9]. Notably, heat shock proteins and transcription factors emerged as crucial factors in this comparison. Despite the ultrasonic stress, in vitro plants not only survived but also developed into seedlings.
Improving the propagation material before sowing or planting by using ultrasound in the aquatic environment is aimed at improving the germination capacity and conditions and, consequently, increasing the quantity and health quality of the crop.
According to several studies [54,55,56], the yield and stability of potato cultivars are intricately linked to their genotype, phenological traits, and morphological characteristics. However, the overall yield and stability, particularly across different years, are influenced by the adaptation of cultivars to environmental conditions (G×E). The conducted research affirms that the genetic characteristics of potato cultivars and their interactions with meteorological conditions during the study years exert the most significant impact on both total and commercial tuber yield. In this study, no significant correlation was demonstrated between climatic conditions and the applied ultrasound in relation to any of the examined traits. There is no widely available scientific literature directly addressing the impact of climate on the application of ultrasound in potato cultivation. However, the influence of climate on agriculture, including potato cultivation, may indirectly affect the effectiveness of various technologies, including ultrasound. Climate factors such as temperature, humidity, sunlight, and rainfall can influence plant growth, water availability, and the overall condition of the crop. These conditions, in turn, may affect how plants respond to different cultivation methods, including the application of ultrasound [11,13,26].
Ultrasound (US) has the potential to influence the growth and development of plants [9]. Previous transcriptome analyses of potatoes (Solanum tuberosum L.) exposed to airborne ultrasound (AB-US) or liquid-borne ultrasound (PE-US) demonstrated the up- or downregulation of various differentially expressed genes (DEGs) associated with abiotic stress. In a study aimed at characterizing stress-related elements over a four-week period, researchers compared the transcriptomes of AB-US and PE-US. When examining controls for both treatments (water and air), no differentially expressed genes related to hypoxia were observed. However, hypoxia-related DEGs were identified in the combination of a liquid medium and ultrasound [6].
The research results provide important information about the relationship between various independent and dependent variables (e.g., potato yield). These conclusions may be valuable in understanding the factors influencing overall and commercial potato yield. It has been observed that different tuber fractions have different effects on the overall yield, which may help farmers optimize potato cultivation.

5. Future Prospects

The adoption of sonication as an innovative technology in potato cultivation practices holds potential for a wider array of applications in the future, extending beyond marketable production to include potato seed production. Due to the broad spectrum of the impact of ultrasound on biological materials, research should be focused on a deeper understanding and description of phenomena and their effects. An essential feature of ultrasound applications is the ability to adapt solutions to the needs of both small and large farms. According to some researchers [5,57], ultrasound can cause unfavorable changes in the structure and properties of organic compounds. Hence, it is necessary to thoroughly understand the impact of acoustic wave energy, especially on plants and organic materials, so that production can be carried out to minimize negative sonication.
Both the frequency and duration (time) of ultrasonic treatment can have significant effects on crops. Different frequencies and exposure times may lead to varied responses in plants. Therefore, it is crucial to investigate and optimize these parameters for specific species and cultivars.
In future research, it is recommended to explore the influence of different ultrasonic frequencies and treatment durations on crop growth, development, and yield. This can help identify the optimal conditions that maximize the benefits of ultrasonic treatment while minimizing any potential negative effects. Including this consideration in the Future Prospects section of a research study would provide valuable insights into potential avenues for the further investigation and improvement of ultrasonic applications in agriculture.
Conclusions from research on ultrasound provide a significant contribution to the development of modern, sustainable agricultural practices. Their implementation can contribute to achieving a balance between food production and environmental protection, supporting the long-term productivity of agriculture.

6. Conclusions

The genetic attributes of the tested cultivars exerted the most substantial influence on the values of the examined traits. The cultivar ‘Zagłoba’ exhibited the highest yield potential, while ‘Syrena’ proved to be homogeneous in this regard. The cultivars also shaped the structure of tuber yield. ‘Zagłoba’ was characterized by the highest proportion of large tubers, with a diameter of 51–60 mm and >60 mm. The varieties ‘Owacja’, ‘Syrena’, and ‘Satina’ had the highest proportion of tubers with a diameter suitable for seed potatoes and were homogeneous in terms of this trait.
The sonication of potato seed material yielded the anticipated outcome, resulting in a 5.7% increase in total yield and a 5.8% increase in commercial yield compared to the control group.
The application of ultrasound did not result in a significant alteration in the structure of tuber yield compared to the control group. The predominant influence on these traits was attributed to the meteorological conditions during the study years. In years characterized by optimally distributed rainfall, the highest yields of tubers within the smallest fractions (<35 mm and 36–50 mm) were observed, along with the highest proportion of tubers having a diameter of 51–60 mm and >60 mm.
The variable meteorological conditions during the study years exerted a notable impact on all the examined yield traits. In the context of climate change, the implementation of ultrasound in potato cultivation may potentially mitigate the adverse effects of drought.

Author Contributions

Conceptualization: P.P. and B.S.; Methodology: P.P. and B.S.; Software: P.P.; Validation: B.S.; Formal analysis: P.P.; Investigation: P.P.; Data curation: P.P.; Writing: P.P. and B.S.; Original draft preparation: P.P. and B.S.; Writing—review and editing: B.S.; Visualization: P.P., Supervision: B.S.; Project administration: P.P.; Funding acquisition: P.P. All authors have read and agreed to the published version of the manuscript.

Funding

This research received no external funding—own financing.

Institutional Review Board Statement

Not applicable.

Informed Consent Statement

Not applicable.

Data Availability Statement

Data sharing not applicable. No new data were created or analyzed in this study. Data sharing is not applicable to this article.

Conflicts of Interest

The authors declare no conflict of interest.

Abbreviations

AB-USAir-based Ultrasound
PE-USPiezoelectric Ultrasound
USUltrasonic
SFWShoot Fresh Weight
DEGDifferentially Expressed Gene
KEGGKyoto Encyclopedia of Genes and Genomes
WRKYTranscription Factor
RFTReactive Oxygen Species
MYBProto-Oncogene, Transcription Factor
DREBPDehydration Responsive Element Binding Protein
G × EGenotype × Environment Interaction

References

  1. FAO. Food Security and Nutrition. In Statistical Yearbook. World Food and Agriculture; FAO: Rome, Italy, 2020; Chapter 3; Available online: https://www.fao.org/3/cb1329en/online/cb1329en.html (accessed on 29 October 2023).
  2. Śliwiński, A. Ultrasound and Their Applications; WNT: Warszawa, Poland, 2001; p. 426. [Google Scholar]
  3. Wu, M.; Wu, J. In-vitro investigations on ultrasonic control of water chestnut. J. Aquat. Plant Manag. 2007, 45, 76–83. [Google Scholar]
  4. Kaczmarski, Ł.K.; Lewicki, P.P. Application of Ultrasound in Food Processing; SIGMA-NOT: Ronkonkoma, NY, USA, 2005; Volume 59, pp. 34–36. [Google Scholar]
  5. Miłowska, K. Ultrasound—Mechanisms of action and application in sonodynamic therapy. Postępy Hig. Med. Dośw. 2007, 61, 338–349. [Google Scholar]
  6. Dobrowolska, D.; Kolasa, J. Acoustics, Ultrasounds, Mechanical Vibrations, Field Guide; GUM: Warszawa, Poland, 2020; pp. 1–76. Available online: https://gum.gov.pl/ftp/pdf (accessed on 29 October 2023).
  7. Gagliano, M.; Mancuso, S.; Robert, D. Towards understanding plant bioacoustics. Trends Plant Sci. 2012, 17, 323–325. [Google Scholar] [CrossRef]
  8. Gagliano, M. Green symphonies: A call for studies on acoustic communication in plants. Behav. Ecol. 2013, 24, 789–796. [Google Scholar] [CrossRef]
  9. Dobránszki, J.; Hidvégi, N.; Gulyás, A.; Tóth, B.; Teixeira da Silva, J.A. Abiotic stress elements in in vitro potato (Solanum tuberosum L.) exposed to air-based and liquid-based ultrasound: A comparative transcriptomic assessment. Prog. Biophys. Mol. Biol. 2020, 158, 47–56. [Google Scholar] [CrossRef]
  10. Chowdhury, E.K.; Lim, H.-S.; Bae, H. Update on the effects of sound wave on plants. Research in Plant 2014. Disease 2014, 20, 1–7. [Google Scholar] [CrossRef]
  11. Teixeira da Silva, J.A.; Dobránszki, J. Sonication, and ultrasound: Impact on plant growth and development. Plant Cell Tissue Organ Cult 2014, 117, 131–143. [Google Scholar] [CrossRef]
  12. Jung, J.; Kim, S.-K.; Kim, J.Y.; Jeong, M.J.; Ryu, C.M. Beyond chemical triggers: Evidence for sound361 evoked physiological reactions in plants. Front. Plant Sci. 2018, 9, 25. [Google Scholar] [CrossRef]
  13. Teixeira da Silva, J.A.; Hidvégi, N.; Gulyás, A.; Tóth, B.; Dobránszki, J. Transcriptomic Response of In vitro Potato (Solanum tuberosum L.) to Piezoelectric Ultrasound. Plant Mol. Biol. Rep. 2020, 38, 404–418. [Google Scholar] [CrossRef]
  14. Dolatowski, Z.J.; Stadnik, J.; Stasiak, D. Application of ultrasound in food technology. Acta Sci. Pol. Technol. Aliment. 2007, 6, 89–99. [Google Scholar]
  15. Witrowa-Rajchert, D. Ultrasound in designed food production. Przemysł Spożywczy 2012, 66, 41–43. [Google Scholar]
  16. Kentish, S.; Feng, H. Applications of Power Ultrasound in Food Processing. Annu. Rev. Food Sci. Technol. 2014, 5, 263–284. [Google Scholar] [CrossRef]
  17. Konopacka, D.; Plocharski, W.; Siucinska, K. The possibilities of ultrasound application in the fruit and vegetable processing industry. Przemysł Ferment. I Owocowo-Warzywny 2015, 59, 16–21. [Google Scholar]
  18. Fijałkowska, A.; Nowacka, M.; Witrowa-Rajchert, D. The influence of ultrasound pre-treatment on drying kinetics and the color and betaines content in beetroot. Zesz. Probl. Postępów Nauk Rol. 2015, 581, 11–20. [Google Scholar]
  19. Maksymiec, M.; Frąckiewicz, A.; Stasiak, D.M. Ultrasonic assisted production of food. In Review of Selected Issues in the Field of the Food Industry; Szala, M., Kropiwiec, K., Eds.; Wydawnictwo Naukowe TYGIEL: Lublin, Poland, 2016; pp. 199–213. [Google Scholar]
  20. Sawicka, B.; Noaema, A.H.; Barbaś, P.; Skiba, D.; Bienia, B. Environmentally friendly methods used to improve the quality seed potatoes. In Contemporary Research on the State of the Environment; Chwil, M., Skoczylas, M.M., Eds.; Wydawnictwo Uniwersytetu Przyrodniczego w Lublinie: Lublin, Poland, 2019; pp. 109–123. [Google Scholar] [CrossRef]
  21. Sawicka, B.; Pszczółkowski, P.; DanilČenko, H.; Jarienė, E. Impact of ultrasounds on physicochemical characteristics of potato tubers. Agron. Sci. 2020, 75, 85–104. [Google Scholar] [CrossRef]
  22. Sawicka, B. Physical method of stimulation of seed—A new technology in the production of potatoes. Pol. Ziemn. 2013, 1, 13–18. [Google Scholar]
  23. Safari, M.; Ghanati, F.; Behmanesh, M.; Hajnorouzi, A.; Nahidian, B.; Mina, G. Enhancement of antioxidant enzymes activity and expression of CAT and PAL genes in hazel (Corylus avellana L.) cells in response to low-intensity ultrasound. Acta Physiol Plant 2013, 35, 2847–2855. [Google Scholar] [CrossRef]
  24. Dobránszki, J.; Hidvégi, N.; Gulyás, A.; Teixeira da Silva, J.A. mRNA transcription profile of potato (Solanum tuberosum L.) exposed to ultrasound during different stages of in vitro plantlet development. Plant Mol Biol 2019, 100, 511–525. [Google Scholar] [CrossRef]
  25. Wang, W.; Vinocur, B.; Shoseyov, O.; Altman, A. Role of plant heat-shock proteins and molecular chaperones in the abiotic stress response. Trends Plant Sci. 2004, 9, 244–252. [Google Scholar] [CrossRef]
  26. Dobránszki, J.; Asboth, G.; Homoki, D.; Bíró-Molnár, P.; Teixeira da Silva, J.A.; Remenyik, J. Ultrasonication of in vitro potato single node explants: Activation and recovery of antioxidant defence system and growth responses. Plant Physiol Biochem 2017, 121, 153–160. [Google Scholar] [CrossRef]
  27. Hidvégi, N.; Gulyás, A.; Dobránszki, J.; Teixeira da Silva, J.A. Mining sequences with similarity to XTH genes in the Solanum tuberosum L. transcriptome: Introductory step for identifying homologous XTH genes. Plant Signal Behav. 2020, 15, 1797294. [Google Scholar] [CrossRef]
  28. Laschimke, R.; Burger, M.; Vallen, H. Acoustic emission analysis and experiments with physical model systems reveal a peculiar nature of the xylem tension. J. Plant Physiol. 2006, 163, 996–1007. [Google Scholar] [CrossRef]
  29. Perel’man, M.E.; Rubinstein, G.M. Ultrasound vibrations of plant cells membranes: Water lift in trees, electrical phenomena. arXiv 2006, arXiv:physics/0611133. [Google Scholar]
  30. Wu, J.Y.; Ge, X.C. Oxidative burst, jasmonic acid biosynthesis, and Taxol production induced by low-energy ultrasound in Taxus chinensis cell suspension cultures. Biotechnol. Bioeng. 2004, 85, 714–721. [Google Scholar] [CrossRef]
  31. Sawicka, B.; Dolatowski, Z. The variability of tuber flesh darkening of new potato cultivars under the action of ultrasound. Zesz. Probl. Postępów Nauk Rol. 2007, 517, 639–649. [Google Scholar]
  32. Natural Resources Conservation Service Soils. Soil Texture Calculator. United States Department of Agriculture. Soil Classification. 2021. Available online: https://www.nrcs.usda.gov/wps/portal/nrcs/detail/soils/survey/?cid=nrcs142p2_054167 (accessed on 29 October 2023).
  33. Lenartowicz, T. Descriptive List of Agricultural Cultivars; COBORU Publishing House: Słupia Wielka, Poland, 2017; p. 38. ISSN 1641-7003. (In Polish) [Google Scholar]
  34. Polish Standard PN-IEC 60038; Standard Voltages IEC. Polish Committee for Standardization: Warsaw, Poland, 1999.
  35. Duer, I.; Fotyma, M.; Madej, A. Code of Good Agricultural Practice; Ministry of Agriculture and Rural Development: Warsaw, Poland, 2004; p. 93.
  36. Roztropowicz, S.; Czerko, Z.; Głuska, A.; Goliszewski, W.; Gruczek, T.; Lis, B.; Lutomirska, B.; Nowacki, W.; Rykaczewska, K.; Sowa-Niedziałkowska, G.; et al. Methodic of Observation, Measurements and Sample Take in Agricultural Experiments with Potato; Plant Breeding Acclimatization Institute, Section: Jadwisin, Poland, 1999; p. 50. [Google Scholar]
  37. Bleinholder, H.L.; Weber, E.; Buhr, L.; Feller, C.; Hess, M.; Wicke, H.; Meier, U.; Van Den Boom, T.; Lancashire, P.; Buhr, D.L.; et al. Compendium of growth stage identification keys for mono- and dicotyledonous plants. In BBCH Monograph, 2nd ed.; Federal Center for Agricultural and Forest Biological Research Uwe Meier, Ed.; EPPO: Luxembourg, 2001. [Google Scholar]
  38. Agriculture and Food Economy in Poland. Collective Work Edited by the Institute of Agricultural and Food Economics; Ministry of Agriculture and Rural Development: Warsaw, Poland, 2015; p. 155.
  39. Lenartowicz, T. Potato. Methodology of Economic Value Analysis of Cultivars (WGO); COBORU: Słupia Wielka, Poland, 2013; p. 34.
  40. Polish Standard PN–R–04031:1997P; Chemical and Agricultural Analysis of Soil. Sampling. Polish Committee for Standardization: Warsaw, Poland, 1997.
  41. Polish Standard PN-ISO 10390:1997P; Soil Quality—Determination of pH. Polish Committee for Standardization: Warsaw, Poland, 1997; p. 15.
  42. Barančíková, G.; Makovníková, J. Comparison of two methods for determining organic carbon in soil. Pol. J. Soil Sci. 2015, 48, 47–56. [Google Scholar] [CrossRef]
  43. Mocek, A. Soil Science; State Scientific Publisher: Warsaw, Poland, 2015; p. 571. [Google Scholar]
  44. Polish Standard PN-R-04023: 1996P; Chemical and Agricultural Analysis of Soil. Determination of Available Phosphorus Content in Mineral Soils. Polish Committee for Standardization: Warsaw, Poland, 1996.
  45. Polish Standard PN-R-04022: 1996 +Az1: 2002P; Chemical and Agricultural Analysis of Soil. Determination of Available Potassium Content in Mineral Soils. Polish Committee for Standardization: Warsaw, Poland, 2002.
  46. Polish Standard PN-R-04020 1994 + Az1: 2004P; Chemical and Agricultural Analysis of Soil. Polish Committee for Standardization: Warsaw, Poland, 2004.
  47. Skowera, B. Changes of hydrothermal conditions in the Polish area (1971−2010). Fragm. Agron. 2014, 31, 74–87. [Google Scholar]
  48. SAS Institute Inc. SAS/STAT®9.2 User’s Guide; SAS Institute Inc.: Cary, NC, USA, 2008. [Google Scholar]
  49. StatSoft. Electronic Textbook of Statistics PL, Krakow. 2006. Available online: http://www.statsoft.pl/textbook/stathome.html (accessed on 29 October 2023).
  50. Mishra, D.; Shekhar, S.; Singh, D.; Chakraborty, S.; Chakraborty, N. Heat shock proteins and abiotic stress tolerance in plants. In Regulation of Heat Shock Protein Responses, Heat; Asea, A., Kaur, P., Eds.; Springer International Publishing AG: Berlin/Heidelberg, Germany, 2018; pp. 41–69. [Google Scholar] [CrossRef]
  51. Wang, B.C.; Zhou, J.; Wang, Y.C.; Zhu, L.C.; Teixeira da Silva, J.A. Physical stress, and plant growth. In Floriculture, Ornamental, and Plant Biotechnology: Advances and Topical Issues, 1st ed.; Teixeira da Silva, J., Ed.; Global Science Books, Ltd.: London, UK, 2006; Volume II, Chapter 7; pp. 68–85. [Google Scholar]
  52. Rokhina, E.V.; Lens, P.; Virkutyte, J. Low-frequency ultrasound in biotechnology: State of the art. Trends Biotechnol. 2009, 27, 298–306. [Google Scholar] [CrossRef]
  53. Nowacki, W. Polish potato sector during the COVID-19 pandemic. Pol. Potato 2020, 2. Available online: http://ziemniak-bonin.pl/ziemniak-polski-02-2020/ (accessed on 29 October 2023).
  54. Nowacki, W. Opportunities and threats of potato market in Poland: Association of Agricultural Economists. Sci. Ann. 2018, 17, 169–175. [Google Scholar]
  55. Arvanitoyannis, I.S.; Mavromatis, A.G.; Vaitsi, O.; Korkovelos, A.; Golia, E. Effect of genotype and geographical origin on potato properties (physical and sensory) for authenticity purposes. J. Agric. Sci. 2012, 4, 63–74. [Google Scholar] [CrossRef]
  56. Pszczółkowski, P.; Sawicka, B. Phenotypic variability of the yield and structure of mid-early potato cultivars. Acta Sci. Pol. Agric. 2017, 16, 147–161. [Google Scholar]
  57. Pingret, D.; Fabiano-Tixier, A.S.; Chemat, F. Degradation during application of ultrasound in food processing A review. Food Control 2013, 31, 593–606. [Google Scholar] [CrossRef]
Figure 1. Potato tubers in an aquatic environment in a bath sonication device. Source: own.
Sustainability 16 00108 g001
Figure 2. Normality chart for total tuber yield.
Sustainability 16 00108 g002
Figure 3. Tuber weight structure [%].
Sustainability 16 00108 g003
Figure 4. Normality chart for the commercial yield of tubers.
Sustainability 16 00108 g004
Figure 5. Pearson’s correlation coefficients between dependent (y) and independent (x) variables. y1—total yield, y2—marketable yield, x1—percentage of tuber mass with a diameter <36 mm; x2—percentage of tuber mass with a diameter 36–50 mm; x3—percentage of tuber mass with a diameter 51–60 mm; x4—percentage of tuber mass with a diameter >60 mm; x5—percentage of marketable yield.
Sustainability 16 00108 g005
Table 1. Levels of fungicides and insecticides used in potato plant protection from 2015 to 2017.
201520162017
Fungicides
Infinito 687.5 SC (propamocarb hydrochloride + fluopicolide) (625 + 62.5)—1.6 dm3·ha−1
Ridomil Gold MZ 67.8 (mancozeb + metalaxyl) (640 + 38.3)—2 kg·ha−1
Infinito 687.5 SC (propamocarb hydrochloride + fluopicolide) (625 + 62.5)—1.6 dm3·ha−1
Acrobat MZ 69 WG (dimethomorph + mancozeb) (90 +600)—2.0 kg·ha−1
Infinito 687.5 SC (propamocarb hydrochloride + fluopicolide) (625+62.5)—1.6 dm3·ha−1
Acrobat MZ 69 WG (dimethomorph + mancozeb) (90 + 600)—2.0 kg·ha−1
Infinito 687.5 SC (propamocarb hydrochloride + fluopicolide) (625 + 62.5)—1.6 dm3·ha−1
Acrobat MZ 69 WG (dimethomorph + mancozeb) (90 + 600)—2.0 kg·ha−1
Insecticides
Apacz 50 WG (clothianidin 500)—0.04 kg·ha−1
Proteus OD 110 (thiacloprid + deltamethrin) (100 + 10)—0.4 dm3·ha−1
Actara 25 WG (thiamethoxam 250)—0.08 kg·ha−1
Nuprid 200 SC (imidacloprid 200)—0.15 dm3·ha−1
Apacz 50 WG (clothianidin 500)—0.04 kg·ha−1
Actara 25 WG (thiamethoxam 250)—0.08 kg·ha−1
Apacz 50 WG (clothianidin 500)—0.04 kg·ha−1
Proteus OD 110 (thiacloprid + deltamethrin) (100 + 10)—0.4 dm3·ha−1
Source: own research.
Table 2. Soil particle size distribution (2015–2017).
YearComposition of Granulometric Fractions [%]Soil Classification
SandSiltLoam
mm
2.0–1.01.0–0.50.5–0.250.25–0.100.10–0.050.05–0.020.02–0.0050.005–0.002<0.002
20150.1016.5829.5612.058.6116.0211.173.302.61Sandy loam
20160.9817.8628.2711.758.3315.4011.163.562.69Sandy loam
20170.7115.0925.3913.5912.0518.4810.272.372.05Sandy loam
Mean0.6016.5127.7412.509.6616.6310.873.082.45
Source: Analysis conducted at the District Chemical and Agricultural Station in Lublin.
Table 3. Soil Properties Prior to Experiment Setup.
Year of ResearchMacronutrients Content
[mg·kg−1 Soil]
Humus Content
[g·kg−1]
pH [KCL]Micronutrients Content
[mg·kg−1 Soil]
PKMgCuMnZnFeB
201589.0109.078.00.945.97.5131840.137607.24
201683.091.070.01.065.84.9233756.739255.28
2017106.098.063.01.036.68.9916641.136006.04
Mean93.099.070.01.02-7.0227446.037626.17
Source: Analysis conducted at the District Chemical and Agricultural Station in Lublin.
Table 4. Rainfall, air temperature, and the Sielianinov hydrothermal coefficient during the potato growing season, as recorded by the meteorological station in Uhnin from 2015 to 2017.
YearMonthSum of Rainfall [mm] Air Temperature [°C]Hydrothermal Coefficient
of Sielianinov *
Decade of MonthMonthDecade of MonthMean
123123
2015April14.65.941.361.85.48.612.48.82.3
May23.413.983.0120.312.612.013.712.83.0
June5.416.524.846.717.716.316.116.70.9
July10.521.613.145.219.618.719.919.40.8
August0.405.76.123.420.620.321.40.1
September32.432.665.2130.216.017.712.815.52.8
Total 410.3
2016April11.522.213.447.110.910.19.010.01.6
May4.92.838.646.314.417.812.915.31.0
June10.143.234.087.316.617.523.019.11.5
July22.430.860.9114.119.520.121.920.51.8
August22.817.70.541.020.717.120.419.50.7
September7.60.14.111.819.515.511.515.50.3
Total 347.6
2017April6.47.238.251.810.66.86.98.12.1
May45.11.319.165.510.513.017.413.71.5
June1.99.212.023.116.617.720.718.30.4
July10.180.941.0132.017.919.021.019.42.2
August0.424.42.227.022.821.317.120.30.4
September38.735.98.783.316.315.312.814.81.9
Total 382.7
Source: The Agrometeorological Station in Uhnin; * hydrothermal coefficient was calculated according to the formula: k = 10 P t [47], where P represents the total monthly precipitation in mm, and Σt is the monthly cumulative air temperature > 0 °C. The index values were categorized as follows: extremely dry (k ≤ 0.4), very dry (0.4 < k ≤ 0.7), dry (0.7 < k ≤ 1.0), rather dry (1.0 < k ≤ 1.3), optimal (1.3 < k ≤ 1.6), rather humid (1.6 < k ≤ 2.0), wet (2.0 < k ≤ 2.5), very humid (2.5 ≤ k ≤ 3.0), and extremely humid (k > 3.0).
Table 5. The cultivation practices, choice of cultivars, and the passage of time all exerted significant effects on the tuber yield, measured in tons per hectare (t·ha−1).
CultivarsManagements’ Practices CultivationYearsMean
Control ObjectUltrasounds201520162017
‘Denar’43.69 a *43.47a28.59 a54.20 bc47.96 c43.58 ab
‘Lord’39.30 a43.11a29.57 a49.94 a44.11 b41.21 a
‘Owacja’37.27a40.14 a31.56 ab47.32 a37.24 a38.71 a
‘Vineta’37.53 a40.50 a27.43 a48.04 a41.56 b39.01 a
‘Satina’40.80 a45.51 a36.78 b48.09 a44.60 b43.16 ab
‘Tajfun’39.10 a39.82 a28.82 a50.36 b39.20 a39.46 a
‘Syrena’43.33 a45.57a36.67 b51.71 b44.98 b44.45 c
‘Zagłoba’46.30 a47.96 a34.07 ab60.14 c47.18 c47.13 c
LSDp0.05 ns **11.95.7
Mean40.91 a43.26 b31.69 a51.23 c43.35 b42.09
LSDp0.05 1.82.7
* The existence of identical letter indices in the means (at a minimum) indicates a lack of statistically significant differences among them. The subsequent letter indices (a, b, c) delineate the groups in ascending order; ** denotes non-significance at a p-value of 0.05 or higher.
Table 6. Influence of cultivars, management practices cultivation, and years on the tuber yield structure [%].
Factors of the ExperimentTuber Fraction Share [%]
<35 mm36–50 mm51–60 mm>60 mm
Management practices in cultivationControl object2.3 a *51.7 a38.8 a7.2 a
Ultrasounds2.2 a53.0 a38.3 a6.5 a
LSDp0.05ns **nsnsns
Cultivars‘Denar’2.3 b52.3 bc40.3 bc4.8 ba
‘Lord’2.2 b51.3 bc39.8 bc6.9 bc
‘Owacja’3.1 d55.5 c35.8 b5.4 bca
‘Vineta’2.1b47.6 b42.3 c8.0 c
‘Satina’2.2 b54.0 c38.7 bc5.2 bc
‘Tajfun’2.5 cd64.8 d30.1 a2.6 a
‘Syrena’1.7 a54.2 c38.2 bc6.0 bc
‘Zagłoba’1.9 ab38.9 a43.3 c15.6 d
LSDp0.050.66.25.33.2
Years20153.5 c69.4 c25.4 a1.8 a
20160.9 a37.3 a50.6 c11.2 c
20172.4 b50.3 b39.7 b7.5 b
Mean2.352.338.66.8
LSDp0.050.32.92.51.5
* The presence of identical letter indices among the means (at a minimum) indicates a lack of statistically significant differences between them. The subsequent letter indices (a, b, c, d) establish the groups in ascending order; ** denotes non-significance at a p-value of 0.05 or higher. ns—not significant.
Table 7. Impact of managements practices cultivation, cultivars, and years on share of commercial yield of tubers (%).
CultivarsManagements Cultivation PracticesYearsMean
Control ObjectUltrasounds201520162017
‘Denar’97.5 b *97.8 a96.1 ab99.0 a98.0 bc97.7 b
‘Lord’97.7 b97.8 a96.8 b99.1 ab97.4 ab97.8 bc
‘Owacja’96.6 a97.3 a95.2 a98.9 a96.7 a96.9 a
‘Vineta’97.9 b97.9 b96.4 ab99.4 c97.9 b97.9 bc
‘Satina’97.7 b98.0 b96.8 b99.0 a97.8 b97.9 bc
‘Tajfun’97.7 b97.2 a96.4 ab98.9 a97.1 ab97.5 bc
‘Syrena’98.3 c98.4 c97.4 c99.3 ab98.3 c98.3 c
‘Zagłoba’98.0 b98.1 b96.9 b99.4 c97.9 b98.1 b
LSDp0.05 0.91.20.6
Mean97.7 a97.8 a96.5 a99.1 c97.6 b97.8
LSDp0.05 0.20.3
* The presence of identical letter indices among the means (at a minimum) indicates a lack of statistically significant differences between them. The subsequent letter indices (a, b, c) establish the groups in ascending order.
Table 8. Impact of Potato Cultivars, Cultivation Practices, and Annual Conditions on Marketable Tuber Yield(t·ha−1).
CultivarsManagements Cultivation PracticesYearsMean
Control ObjectUltrasounds201520162017
‘Denar’42.76 bc *42.66 abc 27.47a53.66 b47.00 bc42.7 b
‘Lord’38.49 ab42.24 ab28.62 a49.49 a42.99 b40.37 ab
‘Owacja’36.14 a39.11 a 30.06 ab46.80 a36.00 a37.62 a
‘Vineta’36.84 a39.77a26.46 a47.72 a40.71 ab38.30 a
‘Satina’39.29 ab44.63 bc35.59 bc47.62 a43.61 b42.28 b
‘Tajfun’38.31 a38.79 a27.79 ab49.82 ab38.05 a38.55 a
‘Syrena’42.65 bc44.86 bc35.70 bc51.37 ab44.20 b43.76 bc
‘Zagłoba’45.46 c47.20 c33.02 b59.79 bc46.17bc46.33 c
LSDp0.05 4.26.32.1
Mean40.07 a42.41 b30.59 a50.79 c42.34 b41.24
* The presence of identical letter indices among the means (at a minimum) indicates a lack of statistically significant differences between them. The subsequent letter indices (a, b, c) establish the groups in ascending order.
Table 9. Descriptive statistics of dependent and independent variables.
Specificationy1y2x1x2x3x4x5
Mean 42.3241.482.2452.3338.566.8397.75
Standard Error 0.870.890.111.381.050.550.11
Median43.5342.492.1551.8340.565.8997.80
Standard deviations10.4910.671.2916.5612.646.581.29
Kurtosis−0.63−0.66−0.28−1.07−0.941.23−0.31
Skewness−0.19−0.160.500.05−0.301.21−0.50
Range52.0752.605.9563.2950.2230.265.90
Minimum18.8717.900.2722.7310.750.0093.80
Maximum70.9370.516.2286.0260.9730.2699.70
CV (%)24.7825.7157.3931.6432.7996.231.32
y1—total yield, y2—marketable yield, x1—percentage of tuber mass with a diameter <36 mm; x2—percentage of tuber mass with a diameter 36–50 mm; x3—percentage of tuber mass with a diameter 51–60 mm; x4—percentage of tuber mass with a diameter >60 mm; y5—percentage of marketable yield.
Disclaimer/Publisher’s Note: The statements, opinions and data contained in all publications are solely those of the individual author(s) and contributor(s) and not of MDPI and/or the editor(s). MDPI and/or the editor(s) disclaim responsibility for any injury to people or property resulting from any ideas, methods, instructions or products referred to in the content.

