1. Introduction
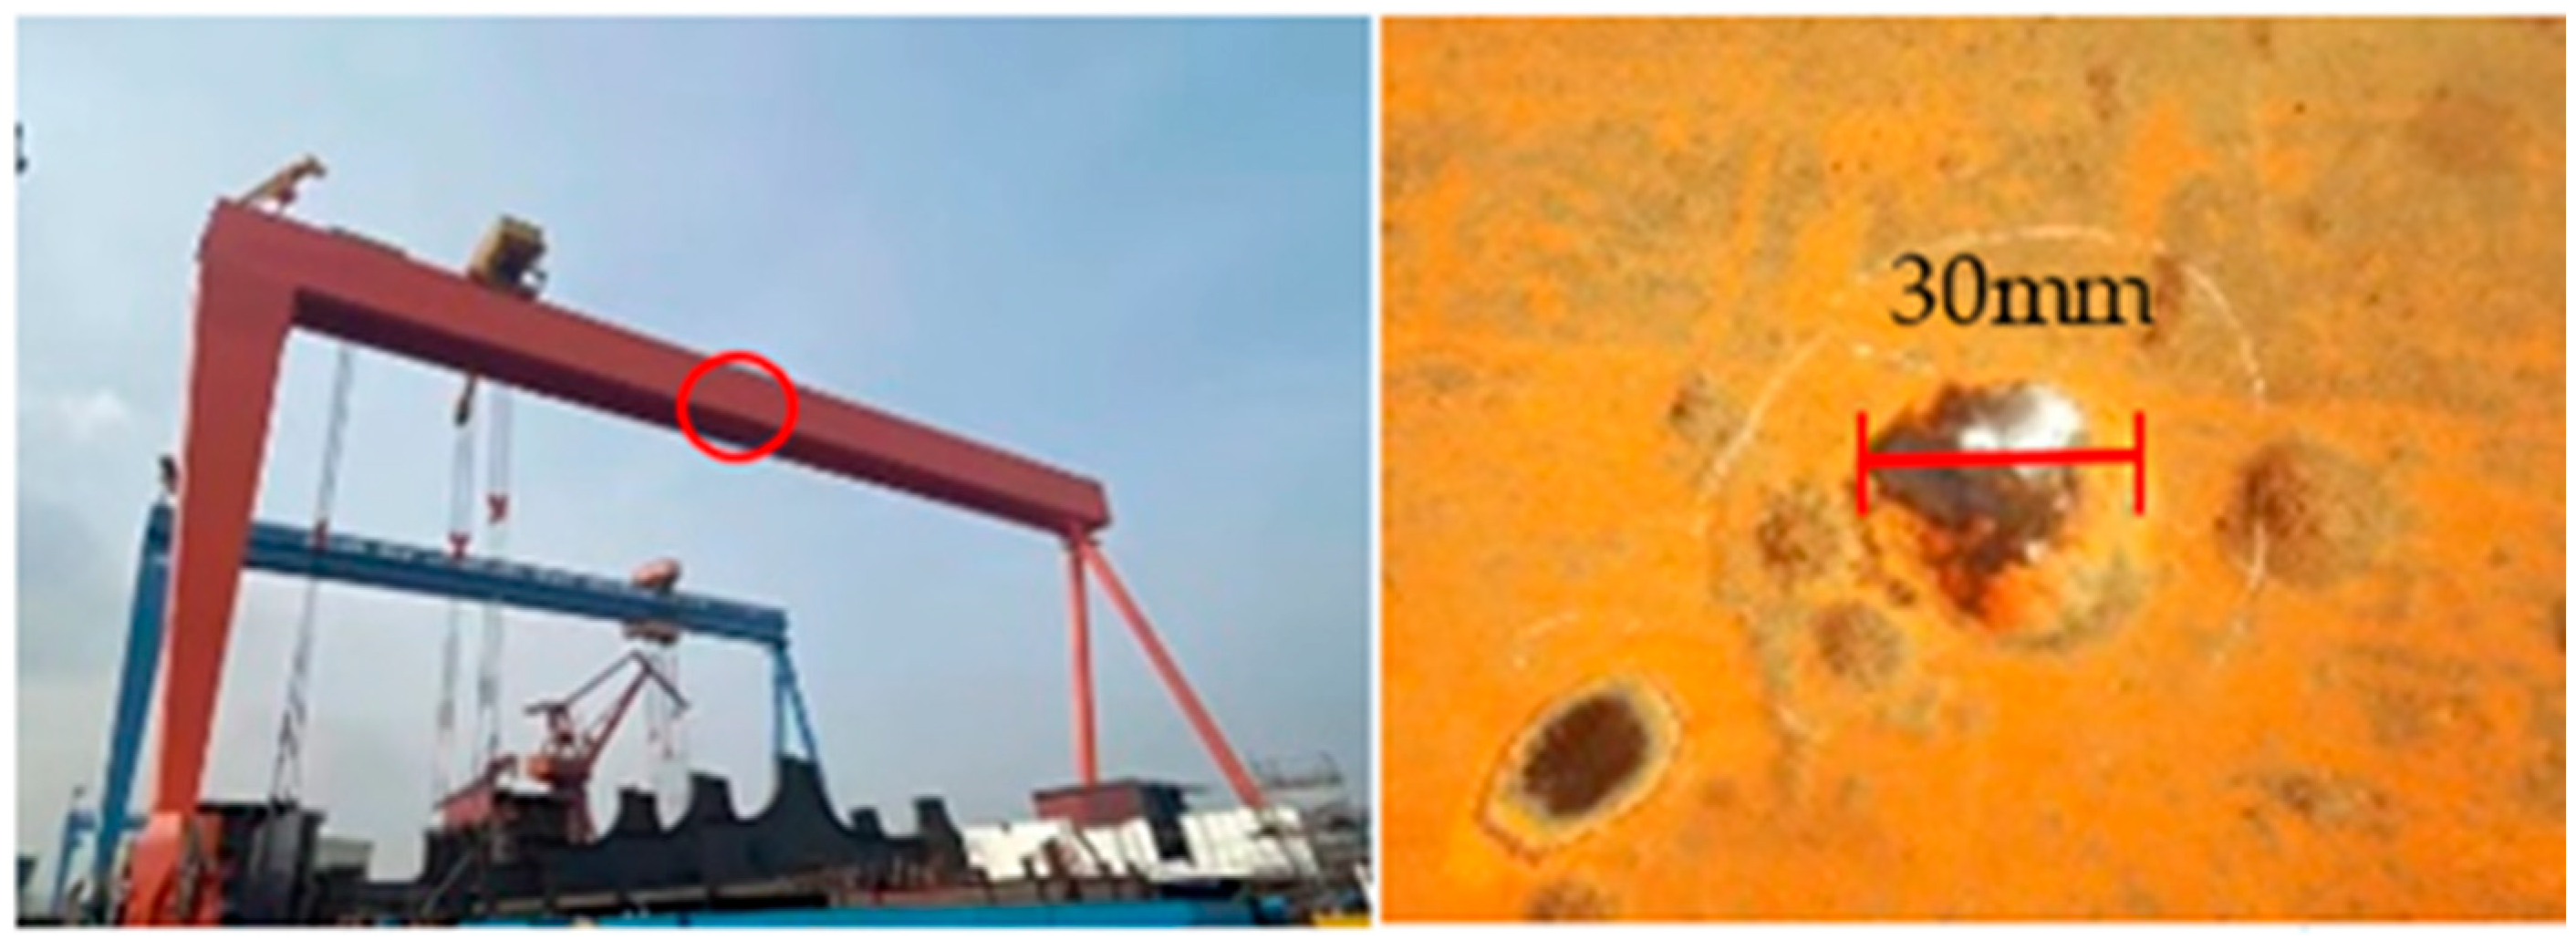
The gantry crane main girder is a box structure, consisting of side walls, a top plate and a lower cover plate, which has high strength and resistance to deformation and is usually used to carry heavier loads. The girder structure of the gantry crane is subjected to corrosion by salt and chloride ions in the open ocean environment for long periods of time and produces large corrosion pits, as shown in
Figure 1. The extent to which these larger pits affect the gantry crane structure is the key to studying its remaining fatigue life. When the gantry crane is under load, the edges of the corrosion crater profile will produce severe stress concentration phenomena leading to the emergence of cracks, seriously jeopardising the strength and damage tolerance performance of the components, which eventually leads to fracture failure of the sheet metal.
In order to understand the effect of pitting corrosion on crack initiation and expansion, a number of in-depth studies have been carried out by Pidaparti et al. [
1], who systematically analysed the stress concentration at the edges of pitting corrosion; Kondon [
2] first studied the transition from corrosion pits to corrosion fatigue cracks and proposed a theoretical model. Pyun et al. [
3] carried out further research based on the model proposed by Kondon and found that early pitting evolution dominated during the coupled corrosion fatigue action and was subsequently replaced by fatigue crack extension. Rokhlin et al. [
4] investigated the location of crack initiating at the corrosion pits; Huang Xiaoguang et al. [
5] studied the energy principle of pitting evolution and corrosion fatigue crack nucleation, which determined the critical pitting size for crack nucleation based on the stress intensity factor criterion for the transformation of pitting to corrosion fatigue crack nucleation and predicted the corrosion fatigue crack nucleation life based on the energy principle. David Taylor and Pluvinage et al. [
6,
7] proposed a unified model of pitting and cracking based on the critical distance and the concept of pitting stress intensity factor through theoretical analysis and experimental validation. Heikki R et al. [
8] proposed a simulation method of microscopic short cracks based on the fatigue mechanism of plastic irreversibility of the slip zone, and obtained the crack nucleation and the expansion law of microscopic short cracks. Tsunehiro T [
9] et al. proposed the Tanaka–Mura model based on the nucleation mechanism of microscopic short cracks.
Many scholars have also used theories related to corrosion fatigue in engineering practice. Ziguang Chen [
10] et al. used a near-field kinetic model to simulate the evolution of pitting damage; Alexander Hermann [
11] et al. proposed a computational framework to predict the decrease in mechanical strength of metal models; Xu Shanhua et al. [
12] studied the fatigue performance and fatigue fracture mechanism of rusted high-strength steel wires in bridges and provided an experimental basis for fatigue life evaluation of rusted high-strength steel wires based on the fracture mechanics theory; Song Deshuang and Yu Jianxing et al. [
13,
14] studied the pitting pit-crack stress intensity factor of pipes under the action of internal pressure; Yu Dazhao et al. [
15] conducted fatigue tests on aerospace aluminum alloys and analysed the feasibility of equating corrosion pits to surface cracks.
When the metal components are subjected to corrosion and alternating loads at the same time, stress concentration is easy to occur at the initial defect, and corrosion fatigue damage also accumulates at this place. When the damage value reaches the critical state when the crack begins to sprout, many scholars in the metal specimens of pre-corrosion fatigue loading experiments found that cracks always initiate and expand from the corrosion pit [
15,
16,
17,
18]. In this paper, by analysing the stress values at the shoulder and bottom of the corrosion pits with different dimensional parameters and depth-to-diameter ratios, it was found that the maximum stress concentration gradually transitions from the bottom of the pit to the shoulder of the pit as the depth-to-diameter ratio increases, and the edges of the pit are also prone to cracking, as shown in
Figure 2, which is different from the critical depth of crack initiation assumed by Kondon and the crack model prefabricated at the bottom of the pit used by other scholars [
13,
14,
15]; therefore, it is still important to further study the stress concentration at the pit and analyse the effect of the pit as an initial defect on crack initiation and the critical size of crack nucleation at the pit. The semi-ellipsoidal pitting theory is applied to analyse the relationship between crack nucleation at the corrosion pit and the corrosion pit size depth-to-diameter ratio, and to calculate the critical characteristic stress value for crack nucleation at the pit and crack nucleation life prediction, the results of which can provide a reference for portal crane life safety assessment.
2. Crane Finite Element Modelling and Sub-Modelling
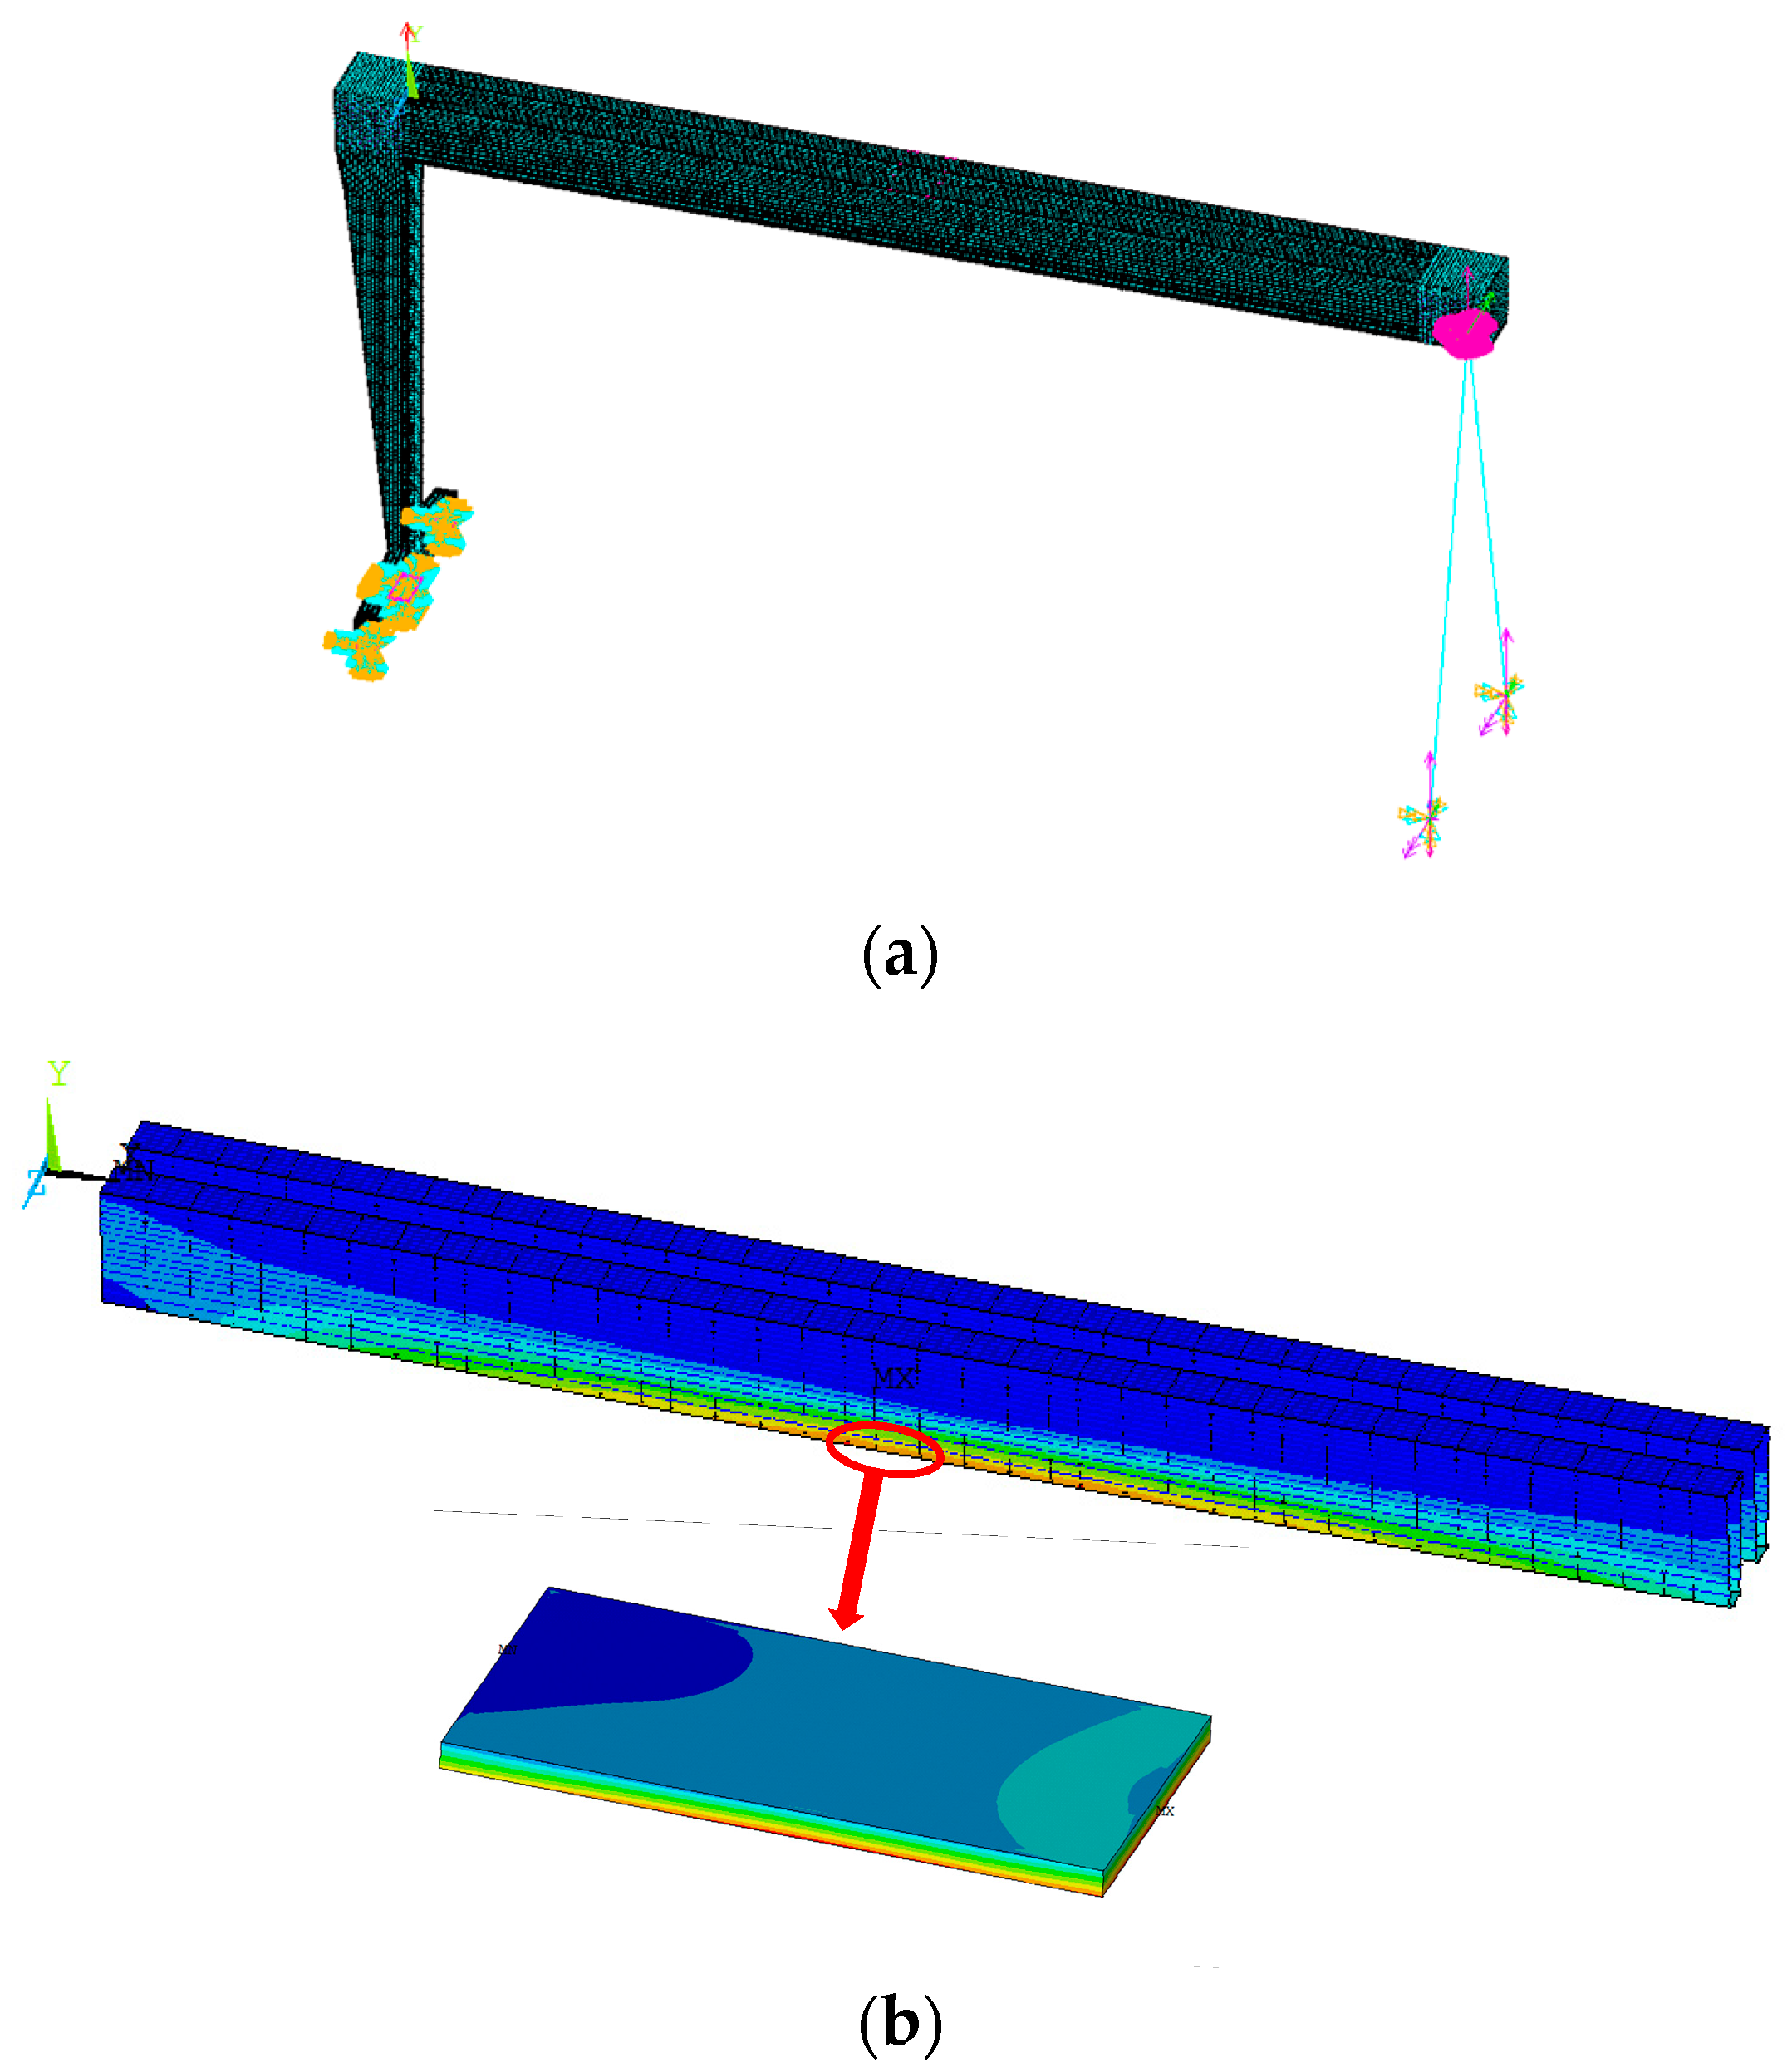
According to the research object 900 t × 182 m shipbuilding portal crane structure, for the establishment of the finite element plate and beam cell model, as shown in
Figure 3a, the total number of cells is 386,916 and the total number of nodes is 425,224, with boundary conditions according to the study conditions and 900 t load applied at the span of the main beam. As the overall structural finite element model of the portal crane is established by the plate and shell unit, it cannot directly simulate the tiny ellipsoidal erosion pits, and the size of the overall model mesh division is large, and the mesh needs to be refined when conducting local analysis, so the sub-model method of local structural analysis is used. The sub-model method, also known as the cut boundary displacement method or the specific boundary displacement method, is based on St. Venant’s principle and allows for refined analysis and the conversion of boundary conditions between different units using the sub-model method. This process is used to calculate the overall structural model, cut the locations to be analysed, extract the plate and shell unit boundary conditions for the difference calculation and apply them to the sub-model, and finally carry out the solution of the sub-model.
The sub-model is a flat plate with an ellipsoidal pit in the centre, with dimensions of 2000 × 1000 × 80 mm
3, positioned at the lower cover at the span of the main beam of the portal crane plate and shell model, as shown in
Figure 3b. The finite element crane integral model established for the plate and shell unit is extracted here to extract the boundary conditions and applied to the sub-model, where the effect of the stress intensity factor can be studied.
In the finite element method to calculate the stress intensity factor there is mainly the mutual integration method and the extended finite element method. In order to verify the accuracy of the mutual integration method and extended finite element method, two methods are used to simulate the crack in the sub-model, in the main beam lower cover plate smooth lower surface (no corrosion pits) perpendicular to the span direction of the main beam pre-set semi-circular crack, and the crack is a two-dimensional surface crack with zero thickness; the shape is shown in
Figure 4a. The stress intensity factor is calculated when the crack is loaded in the portal crane span and the mutual integration method is used to calculate the type I, II and III stress intensity factor results as shown in
Figure 4b–d.
Analysis of the main girder section of the portal crane can be seen, as shown in
Figure 5a, when the load at the midspan of the main girder section box structure withstands the bending moment, as the main girder upper and lower cover plate are far away from the shape of the centre. Mechanical analysis can be considered as these are only subject to compressive and tensile stresses along the axis direction, and finite element calculation results also show that the span of the lower cover plate sub-model location of the first main stress along the section width direction of the stress gradient distribution is small in absolute value, as shown in
Figure 5b. Thus, in the calculation of the stress intensity factor it is equivalent to the main girder lower cover plate which is subject to uniform tension in the axis direction, and theoretical calculations and finite element simulation results also show its reasonableness.
The crack front strength factor for a surface crack with a semi-elliptical profile subjected to uniform tensile forces can be written as [
19]
where the stress
σ is given by the results of the sub-model under the calculated working conditions, taking a value of 152.36 MPa. The lower cover plate thickness
h at the span of the portal crane is 80 mm;
E(
k) is the second type of fully elliptical integral;
Mf is the surface shape correction factor, taking a fixed value of 1.03 according to the table; a is the crack radius;
b is the crack depth; and the crack shape ratio
b/a is 1.
The comparison of the results of the mutual integration method and the extended finite element method with the theoretical calculation Equation (1) is shown in
Table 1. The mutual integration method has the same boundary conditions as the extended finite element method for calculating the model. It can be seen that the mutual integration method is more accurate, as its use of symmetric mesh can reduce the local discretization error, and the mutual integration is path-independent, which can bypass the crack tip singularity zone. The physical description of the crack tip by the XFEM method is still approximate, and although its solution is not grid-dependent, an accurate description of the stress-strain field at the crack tip still requires the use of the cells and nodes of the grid. When the crack tip is located inside the mesh, the crack tip profile will be cut into tiny line segments, which will not adequately describe the stress distribution at the crack tip, resulting in less accurate calculation results.
Therefore, the stress intensity factor of the pit-crack model is calculated by the mutual integration method in all subsequent analyses in this paper, and the pitting pit and crack are taken as a whole model, to investigate the influence of pitting pit morphology and crack morphology on the crack stress intensity factor on the surface of the lower cover plate of the main beam under load in gantry cranes.
3. Corrosion Pit-Crack Model
As the pits are mostly found in the middle of the main beam cover where the water accumulates, away from the weld, the pit model is built at the base metal without considering the influence of the weld etc. The pit model is shown in
Figure 6. The crater surface shape is a circle with radius
r, the vertical profile is semi-elliptical,
d is the crater depth,
d varies along the depth direction when studying the crater model with different depth-to-diameter ratios, the cracks in the crater-crack model are simplified to semi-circular surface cracks, and the direction is perpendicular to the gantry crane main beam span direction, as shown in
Figure 6b. The crack-sprouting process at the corrosion pit occurs under the combined influence of corrosion and fatigue loading. Tianliang Zhao et al. [
20] found through corrosion fatigue tests that when the peak stress was close to or higher than the material yield stress, the crack sprouted from the corrosion pit into a nucleus, and then transformed into a crack at the bottom of the pit or at the stress concentration at the shoulder. The main reason for this process is the stress concentration caused by the etch pits, which causes the stress intensity factor at the crack nucleation to exceed the threshold stress intensity factor value ΔK
th.
As can be seen from
Figure 7, for the same depth-to-diameter ratio of the corrosion pits, the expansion of the corrosion pits along the radius direction has a weak effect on the stress concentration, with an increase in the depth-to-diameter ratio of the stress concentration coefficient with the curve of the corrosion pit radius rise rate, but it is also limited and not obvious; the greater impact on the stress concentration is the change in the depth-to-diameter ratio, for the same radius of the corrosion pits, and the increase in the depth-to-diameter ratio greatly causes the stress concentration phenomenon. For different radii of the pit, the stress increase is more or less the same, with the maximum stress increase being around 50%; the stress concentration at the bottom of the pit is more obvious than at the shoulder of the pit when the depth-to-diameter ratio is low, and as the depth-to-diameter ratio increases, the maximum stress concentration area gradually transitions from the bottom of the pit to the shoulder of the pit, which means that cracks are more likely to emerge from the bottom of the pit when the pit is shallow, and surface cracks from the shoulder of the pit are more likely to occur when the pit is deeper.
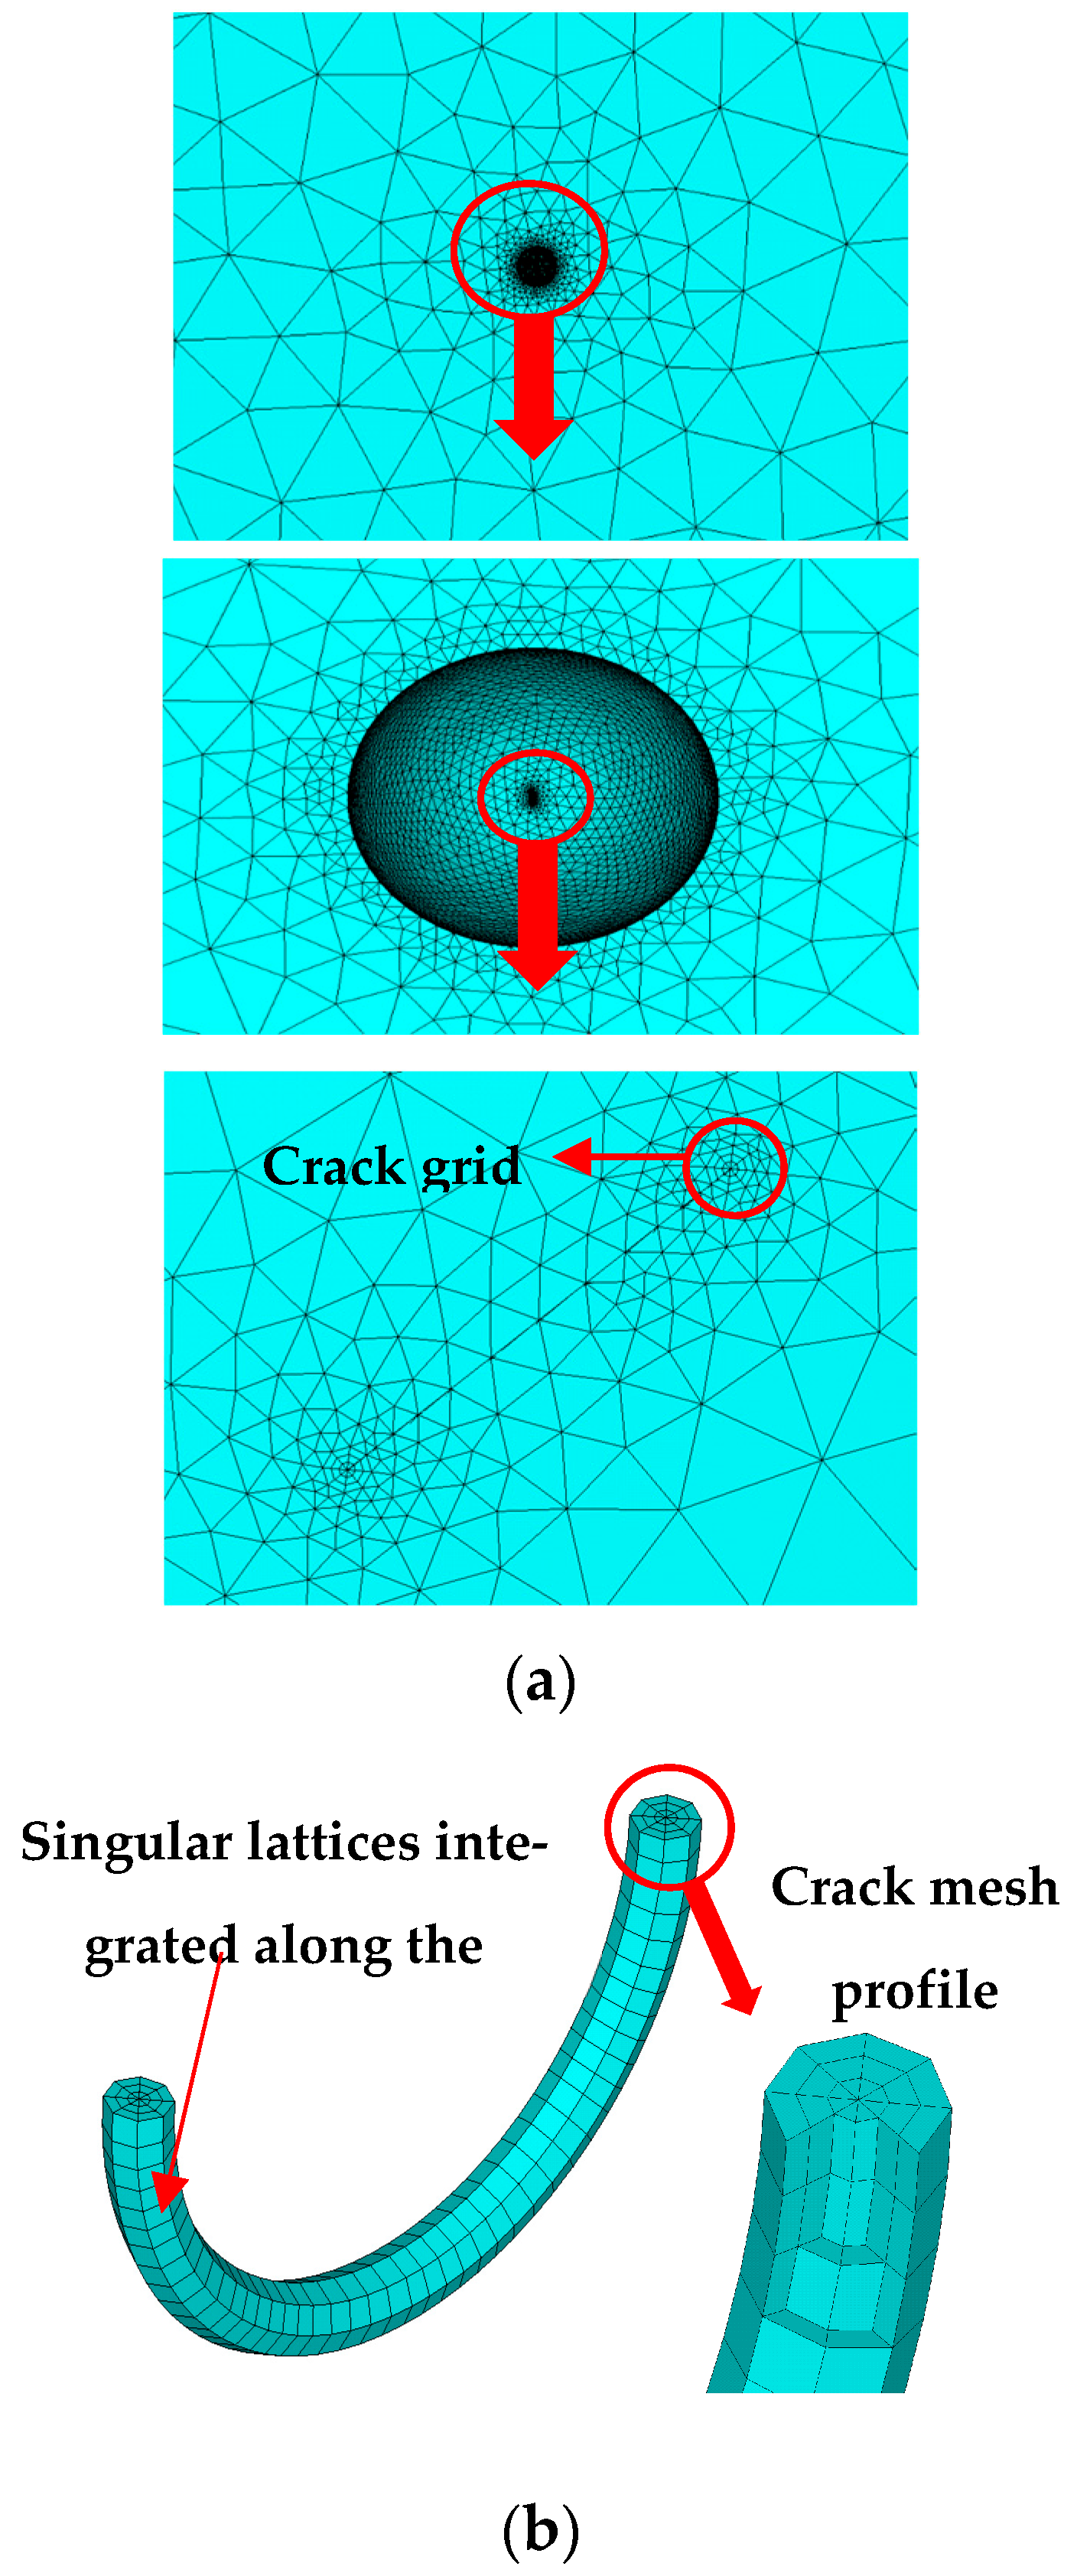
By studying the evolutionary distribution of pitting on metal surfaces, Harlow and Wei [
21] concluded that pitting pit evolution is always a semi-long ellipsoid, and therefore ellipsoidal pits with different depth-to-diameter ratios (
d/r) were used to simulate pitting in the solid modelling of pitting-cracking, as shown in
Figure 8a. The cracks at the pitting corrosion need to be implanted with singular units at the crack tips due to the need to use the mutual integration method to ensure the accuracy of the stress intensity factor calculation, as shown in
Figure 8b.
4. Stress Intensity Factor Analysis of the Pit-Crack Model
The pit-crack model established in this paper is based on the “single dominant flaw approach” [
22], i.e., although the actual sheet metal produces multiple corrosion pits at the same time (individually or in a series), only the deepest pits reaching a critical depth are considered for transformation into cracks. As the crane main beam lower cover plate is under the surface of the three-way stress to the tensile stress, for the possible emergence of the main beam cross-sectional direction of the most dangerous open type of crack,
Figure 6 shows the stress intensity factor calculation, and it also shows that the type I stress intensity factor is dominant. The type II and III stress intensity factors are too small to be negligible, so this paper mainly analyses the most dangerous type I stress intensity factor and the relationship between the different corrosion pit sizes.
A corrosion pit-crack model with different depth-to-diameter ratios was developed and the effect of corrosion pits on the stress intensity factor of prefabricated cracks at different initial depths is shown in
Figure 9. It can be seen clearly that the different sizes of the corrosion pits all greatly affect the stress intensity factor at the crack fronts, and the stress intensity factor increases when the depth-to-diameter ratio increases; with the increase in the depth of the precast crack, the growth trend of the stress intensity factor decreases continuously, which corresponds to the stress intensity factor in the expression of the stress intensity factor proportional to the 1/2 power of the crack radius. The increase in the stress intensity factor at different depths of cracks becomes progressively slower as the pit depth-to-diameter ratio increases, which may be due to an increase in the depth-to-diameter ratio of the pit resulting in a change in the location of the maximum stress concentration in the inner wall of the pit. The previous analysis of the stress concentration at the corrosion pits also showed that as the depth-to-diameter ratio increases, the maximum stress concentration area gradually transitions from the bottom of the corrosion pits to the shoulders of the corrosion pits, resulting in a weakening of the stress concentration at the bottom of the corrosion pits and a slowing of the increase in the stress intensity factor. Based on this pattern, the effect of different depth-to-diameter ratios on the stress intensity factor of surface cracks at the bottom of the pit and the stress intensity factor of cracks at the shoulder of the pit were investigated.
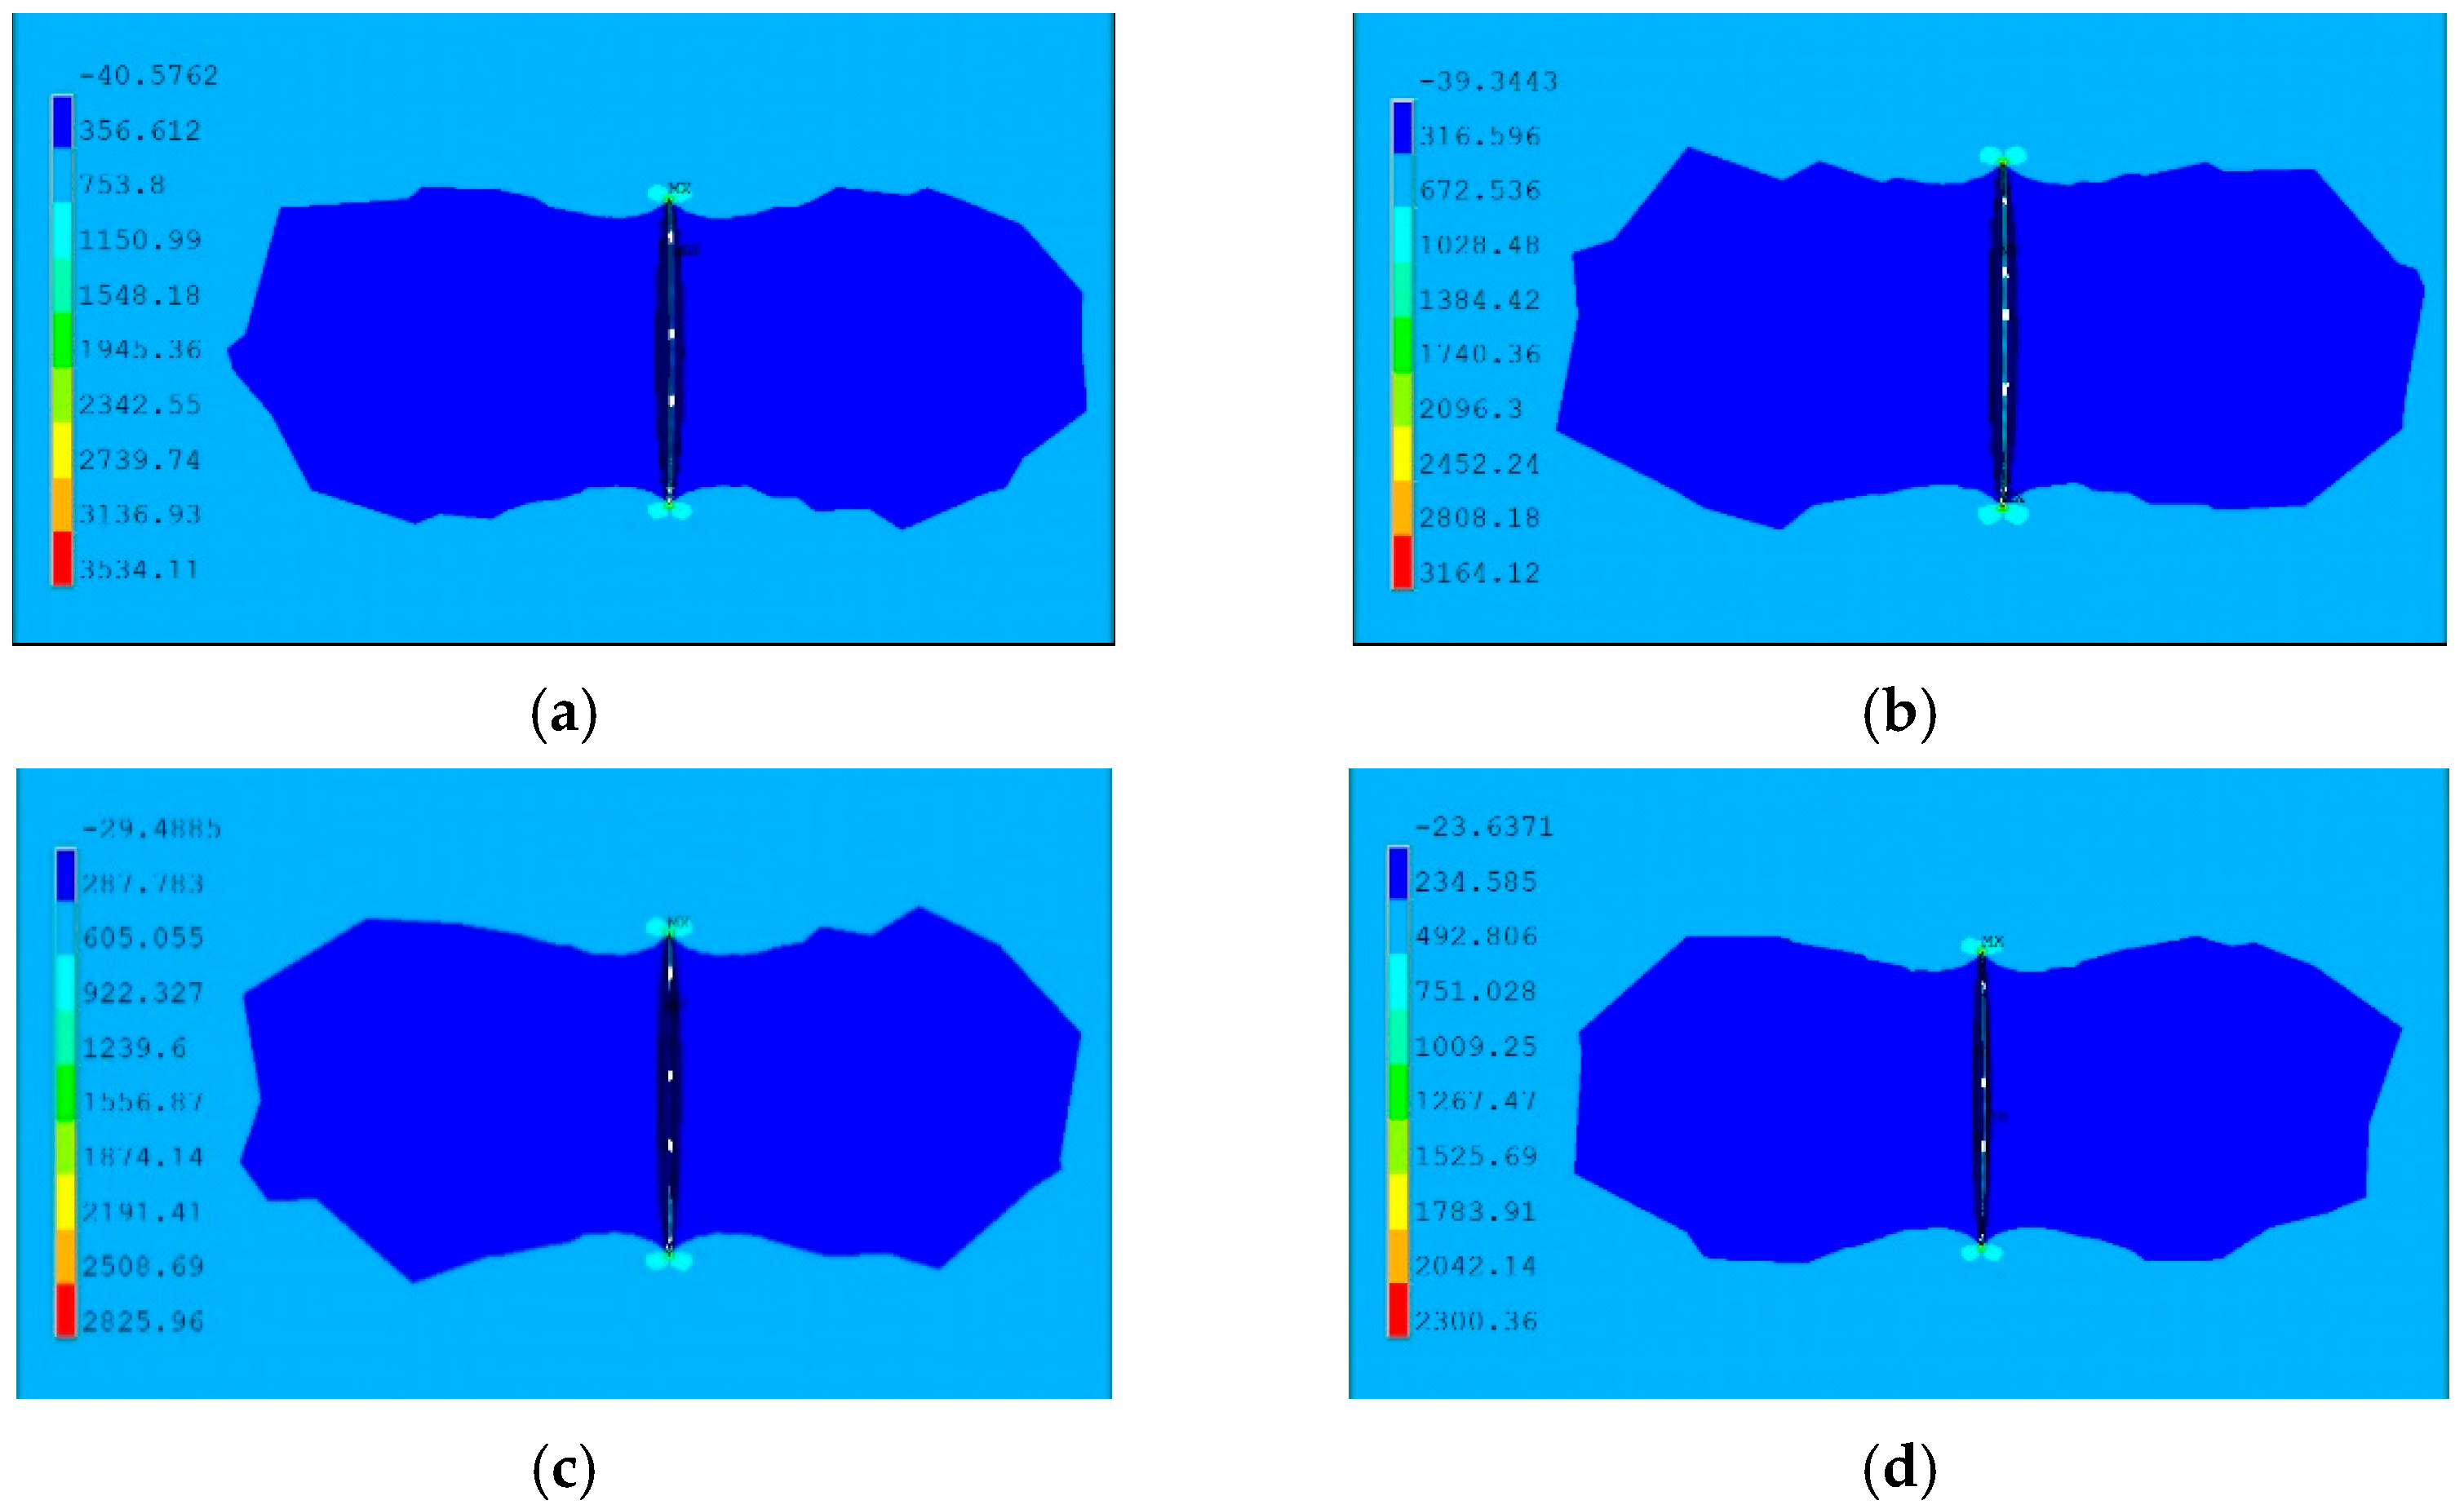
This paper studies the critical conditions for the transition from pits to cracks. The size of the crack in the pit-crack model needs to be much smaller than the size of the pit, but it is generally considered that the crack expansion is slow when the microcrack size is too small, and the crack “starts to expand” only when the stress intensity factor reaches the expansion threshold. A semi-circular crack with a radius of 0.1 mm was selected as a prefabricated crack for subsequent analysis. Set different sizes and depth of the etch pits, the size parameters are shown in
Table 2. The trend of the stress intensity factor for different sizes of pits is shown in
Figure 10, and the stress cloud at the location of the crack at the pit is shown in
Figure 11. It can be seen that the stress intensity factor is not sensitive to the change in pit radius, and the rising trend of all four curves in the figure is relatively flat when the pit radius has a large increase, while the stress intensity factor of different pit radii has a large increase when the depth-to-diameter ratio increases, and this phenomenon is the same as the change in stress values at the shoulder and the bottom of the pit with different size parameters, as in the previous paper. The crack nucleation process may not be directly associated with the expansion of the pit, but the pit acts as a medium in the process of being subjected to the coupling effect of corrosion and fatigue, and its macroscopic and microscopic morphological changes cause severe stress concentration phenomena.
By further analysing the correlation between the stress concentration phenomenon and the stress intensity factor, according to the semi-ellipsoidal pitting assumption, a semi-infinite body containing a hemispherical pit is equivalent to an infinite plane containing a two-dimensional semi-circular surface crack [
23], so the stress intensity factor K
p at the pit can be written as an expression for the stress concentration factor, stress and crack size.
where K
t is the stress concentration factor,
b is the crack depth,
σ is the stress value and
Mf is the shape correction factor; the above equation can be written further in the form of Equation (3).
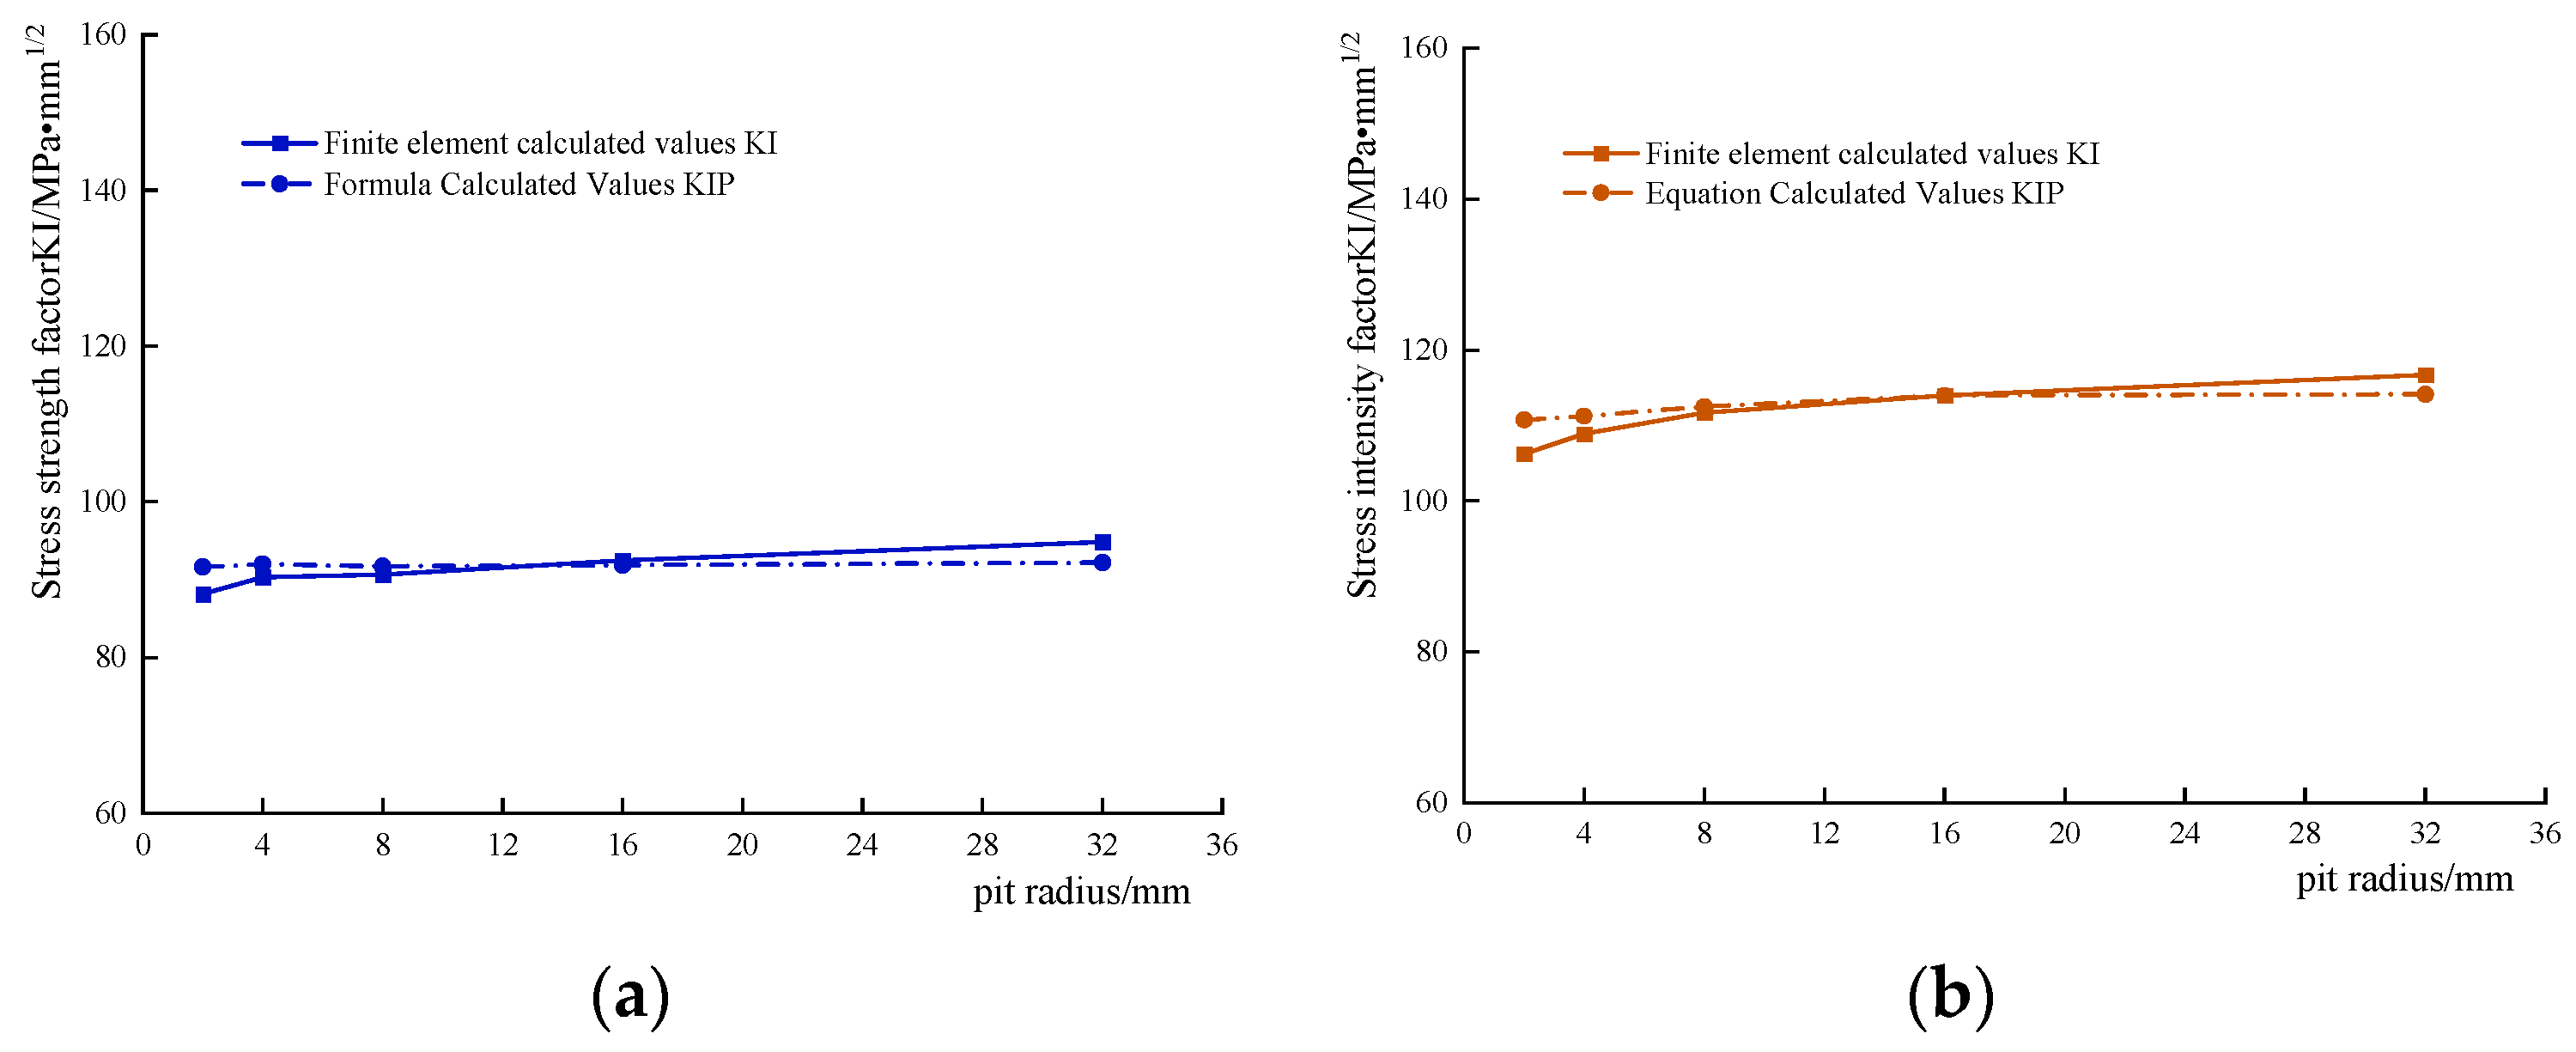
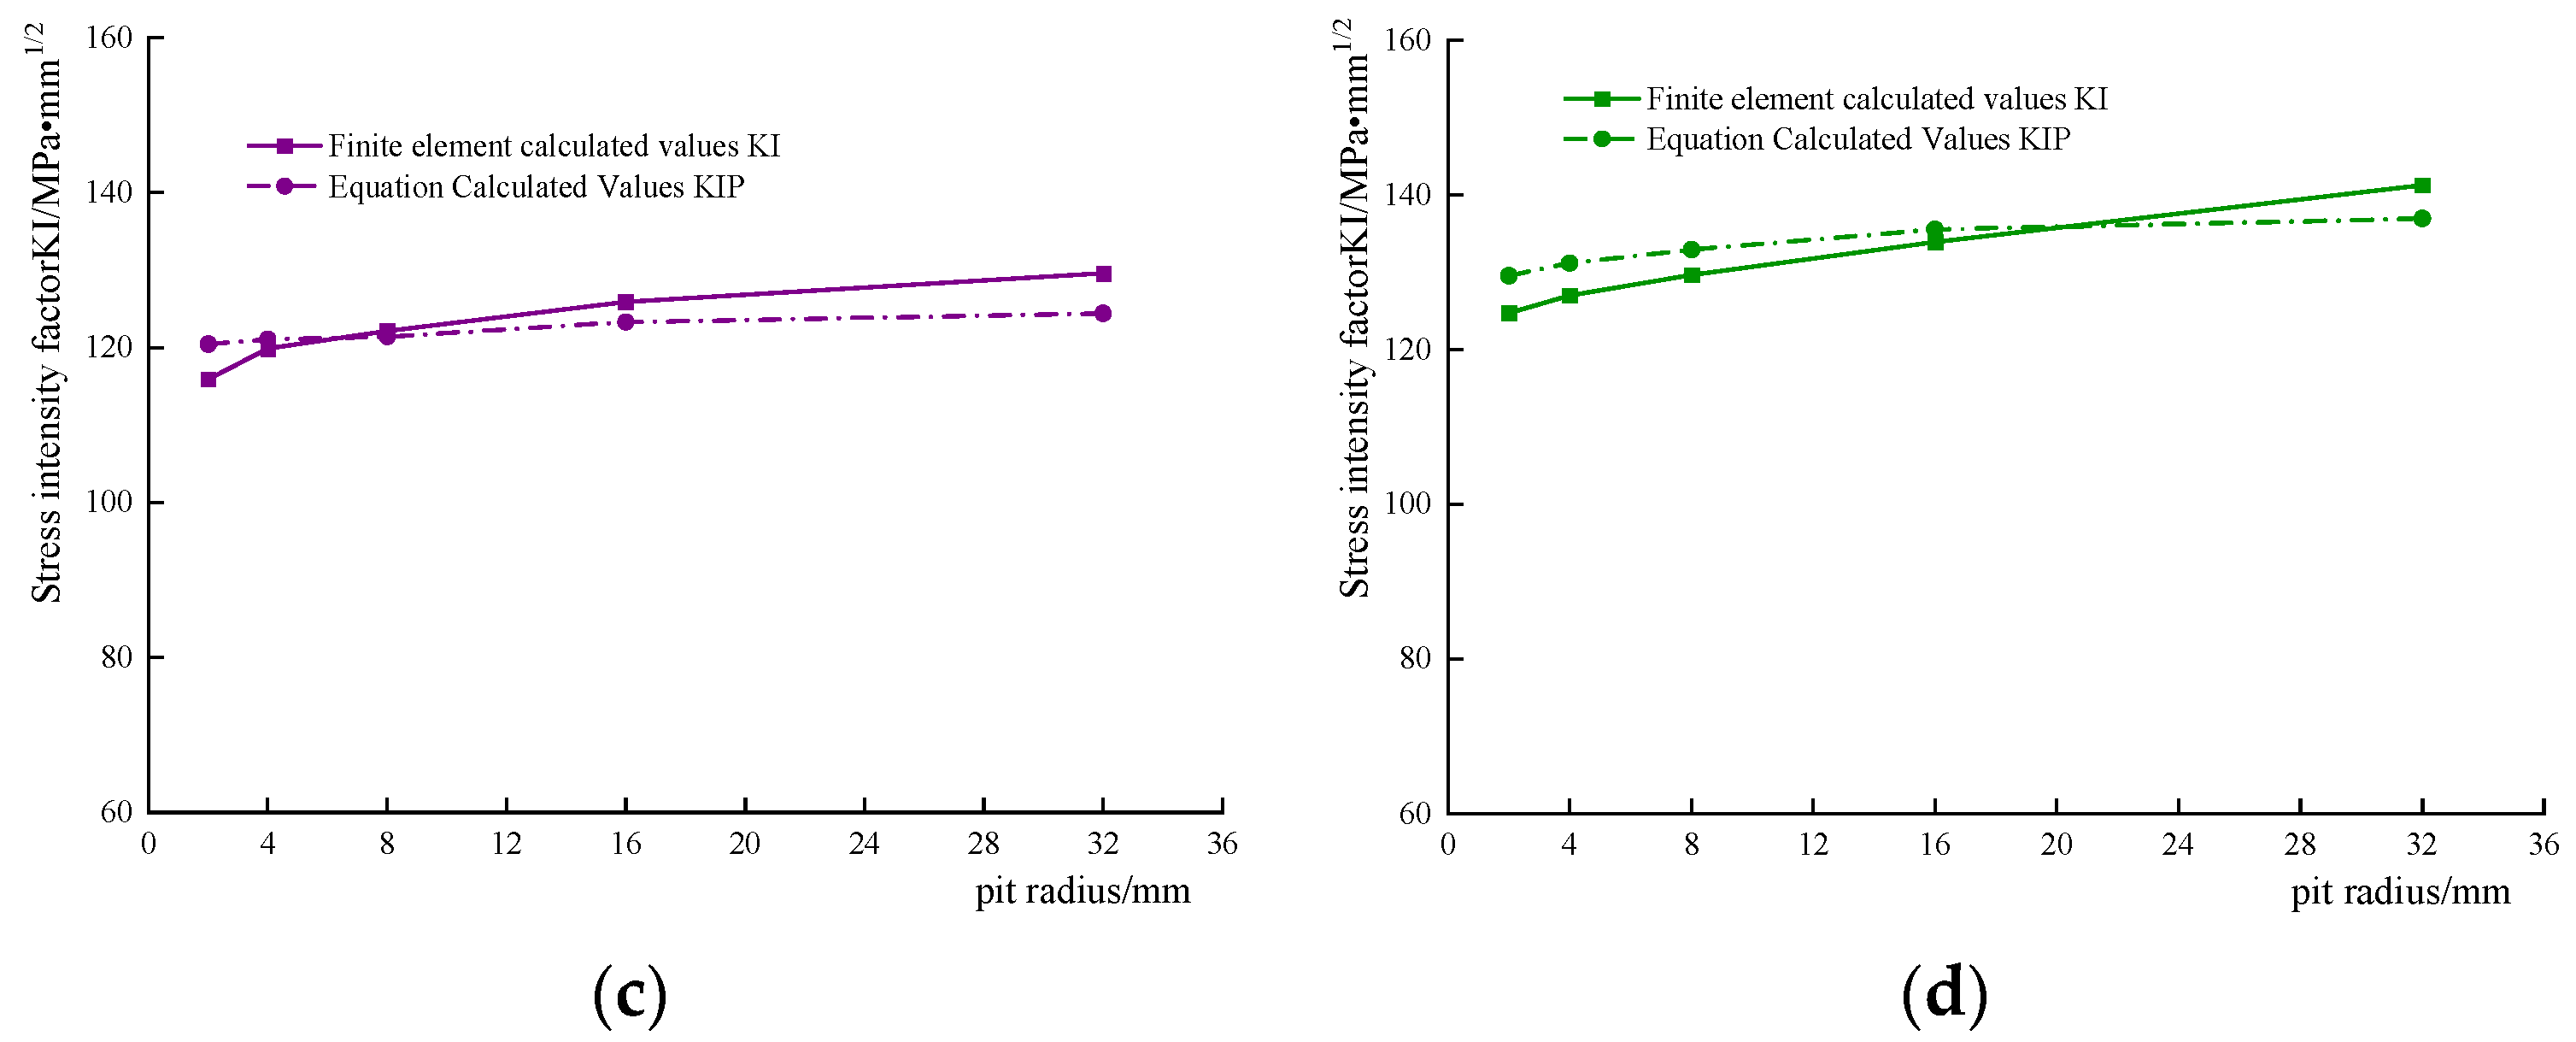
where K
I is the type Ⅰ stress intensity factor under smooth and defect-free material, and the analysis is replaced by the value calculated by the mutual integration method in
Table 1, which is brought into Equation (3) and the theoretical assumption K
IP is calculated, compared with the stress intensity factor calculated for the precast cracks at the corrosion pits, as shown in
Figure 12. There is an interval effect of the pit depth-to-diameter ratio on the value of the shape correction factor, and the shape correction factor
M under different depth–diameter ratios is shown in
Table 3, which increases slowly with the increase in the depth–diameter ratio. It can be seen from
Figure 12 that the assumed stress intensity factor curves at different depth–diameter ratios fit well with the finite element calculation curves, and the accuracy of the K
IP calculation is higher when the depth–diameter ratio is smaller, and the overall error is within 5%, so it can be considered that Equation (3) can calculate the stress intensity factor value of the crack at the pit with good accuracy. This also indicates that crack nucleation may not be directly related to the corrosion depth of the pit, but due to the macroscopic and microscopic morphological changes caused by the corrosion of the pit, which are caused by the local stress concentration caused by the crack, and the location of the stress concentration from the above analysis is not always in the bottom of the pit.
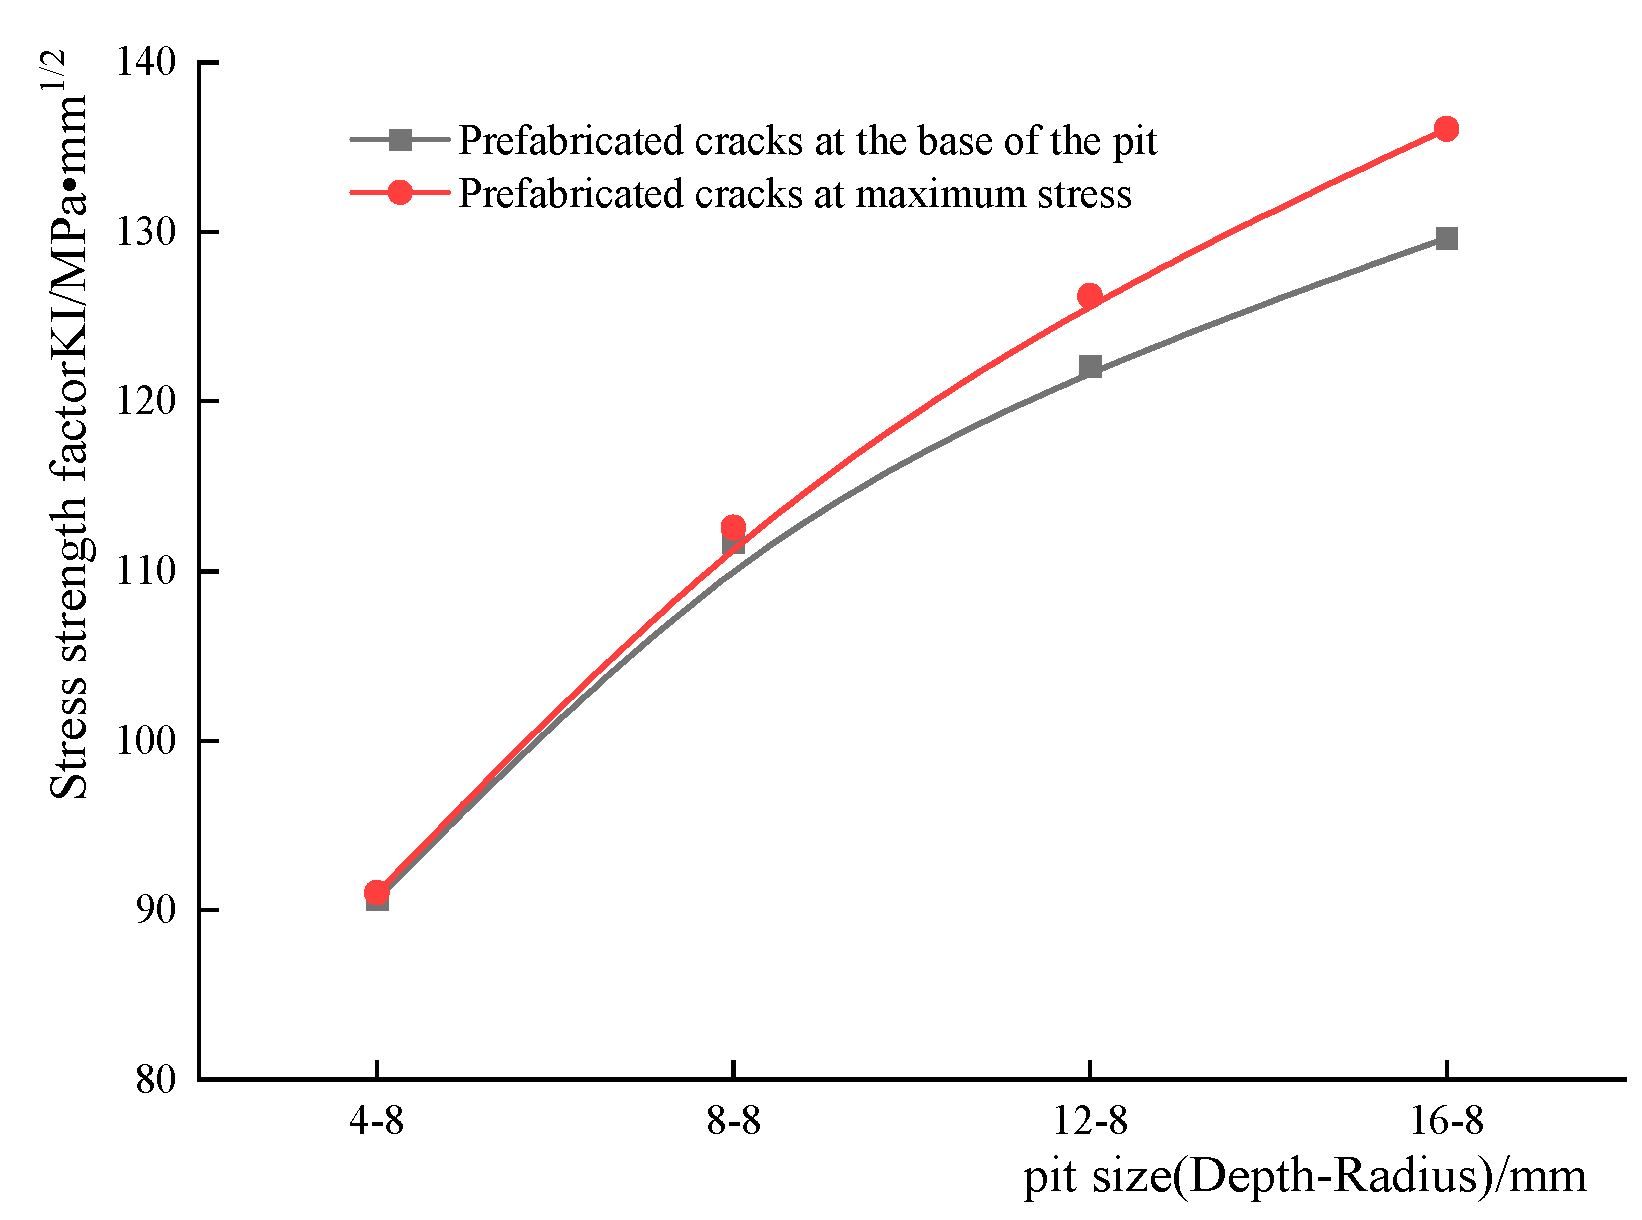
To further investigate the etch pit-crack sprouting, the location of the maximum stress concentration for each etch pit with different size parameters was identified on the basis of the previously established etch pit model, and cracks were prefabricated at the maximum stress concentration and compared with the previously calculated stress intensity factor for the prefabricated cracks at the bottom of the etch pit as shown in
Figure 13. It can be seen that when the depth-to-diameter ratio is small, although the location of the stress concentration does not coincide with the bottom of the corrosion pit, the stress intensity factor values of the two are relatively close to each other. As the depth-to-diameter ratio increases, the maximum stress moves closer to the shoulder of the corrosion pit and there is a significant increase in the stress intensity factor value of the crack preformation at the maximum stress, with cracks more likely to sprout close to the shoulder of the pit when the depth-to-diameter ratio exceeds 1.
5. Corrosion Fatigue Crack Nucleation Life Prediction
Even if a metal component is defect-free (ideally a smooth part without cracks) although the nominal stresses applied are less than the yield limit of the material, the material is not homogeneous at the microscopic level and local areas of the component surface can still slip. The process of repeated cyclic slip under external alternating loads produces a slip band of metal extrusion and squeezing, resulting in the formation of a nucleus of microcracks, and typically the process of corrosion fatigue crack nucleation takes up most of the overall corrosion fatigue life.
During the evolution of corrosion fatigue, the initial phase is dominated by pitting, which is then replaced by fatigue cracking extension. Kondon [
2] proposed a criterion for the transformation of pitting to corrosion fatigue cracking based on the competing mechanisms between pitting evolution and corrosion fatigue crack extension, i.e., the development of pitting pits into corrosion fatigue, and cracks are subject to certain conditions:
This paper assumes that cracks leading to material damage only form “immediately” at the corrosion pit where a critical stress concentration is reached, but the time of crack initiation is actually the time between the growth of the pit and this stage, i.e., the transition from pit to crack when the fatigue crack growth rate exceeds the pit growth rate. Corrosion pit growth law can be expressed as:
where
Cp is the coefficient,
t is the time,
N is the number of stress cycles,
f is the frequency, and
dp is the corrosion pit depth.
Mura and Nakasone [
24] proposed a theory of Gibbs free energy change based on fatigue crack initiating, which assumes that the accumulated energy from the number of stress cycles reaches a critical value and causes crack initiating, but it does not consider the effect of cyclic loading and the interaction of the corrosive environment. The emergence and growth of pits is not only related to electrochemical corrosion but also influenced by fatigue stresses [
25], and Ishihara [
26] et al. found that the effect of stresses is expressed in the exponential form
Cσ, and the relationship between pit depth and time can be further expressed as:
where
M is the molecular weight of the corroding material,
ρ is the density,
n is the number of electrons released during corrosion,
F is the Faraday constant, and
Ip is the pitting current. Equation (2) in the critical stress intensity factor corresponds to the depth of the corrosion pit
dPth, which is brought into the formula (6), and it can be obtained by:
It is important to note that although Equation (8) is expressed by dPth as the critical life depth of crack nucleation for pit growth, it is clear from the previous analysis that crack nucleation is not directly related to pit depth, but only when the actual stress concentration level at the pit reaches the critical threshold, causing the crack to initiate when the stress intensity factor exceeds ΔKth, at which point the time used for pit growth and the number of stress cycles can be approximated by Equations (7) and (8).
Through the above analysis, it can be seen that the crane main beam should be inspected with more attention to small and deep pits, which are more likely to produce more serious stress concentrations and thus cause cracks. The larger and gentler pits are smaller in diameter and should be inspected for small cracks at the bottom of the pits. Large pits that are prone to cracking can be polished to change their morphology and reduce the level of stress concentration to greatly extend the crack nucleation life.


