1. Introduction
Humanity cannot become independent from nature, since the environment in which we install our habitats must be seen as a support system for life on Earth [
1]. Population growth increases negative impacts on the environment, forcing cities to make sustainable decisions in areas that guarantee the reduction of energy consumption [
2]. Sustainable design is necessary to manage the available space and live with nature until the completion of its useful life without generating major effects on the environment [
3]. The building sector is experiencing increasing pressure to use greener and more sustainable materials that are possibly based on natural and biological products that, regardless of their cost, can reduce environmental impacts while improving the quality of indoor environments and reducing energy consumption [
4].
The increasing compliance of stakeholders in the construction industry for green procurement, insightful decisions, and the understanding of environmental characteristics reinforces the urgency of unambiguous, impartial, and independent data on the environmental performance of construction products [
5]. This may be the result of some governmental policies, such as the promotion of new energy-efficient buildings, the energy performance described in building regulations, the renovation of older ones, and decentralized renewable energy sources [
6]. This kind of sustainable approach is becoming necessary because this activity influences the environment, as we are consumers of natural resources and generators of large amounts of waste, users of non-renewable energy, and creators of greenhouse gas emissions [
7], so there is a need to build eco-efficient buildings [
8].
The green building movement has grown considerably according to case studies of buildings, where it has reached 40% of the total energy consumption today. This makes it essential to study the greening process while considering aspects such as the economic benefits of ecological adaptation and social/organizational participation in the process [
9]. The main idea is to improve the quality of life of communities while giving priority to “environmental justice” through a modeling tool based on information collected on the current situation and a data analysis of social behavior [
10].
Eco-efficiency is a strategy that allows companies and institutions to improve their environmental performance while generating significant economic savings [
11]. By measuring eco-efficiency, one can analyze the impacts of inputs such as energy, water, soil, and raw materials to maximize the benefits for humans or minimize the negative results, such as pollution and CO
2, which can damage our environment [
12]. Developing technologies for a smart, eco-efficient built environment can provide a pool of innovative knowledge, which is known to be critical for entrepreneurs in transforming innovative ideas into commercial products and services [
13].
The methodology of the Eco-Efficiency Matrix (EEM) developed by the Ministry of Territory, Habitat, and Housing (MTHH) of the city of Quito contributes to energy efficiency in buildings. This is because the strategies that it proposed to meet parameters such as water and energy consumption have contributed to their reduction through more efficient equipment that meets the range of standardized energy labeling. These result in collaboration for self-supplying the infrastructure, thus favoring the reduction of energy demands in the municipal network [
14]. Concerning the elements of mobility and public space, the Eco-Efficiency Resolution established a system of computable qualification points that allow an increase in the number of floors in a building and a reduction in the number of parking spaces in homes and offices. Optimizing the integration of buildings into the public space with contributions that allow the improvement of habitability conditions in an area and the unification of lots will contribute to urban development.
New definitions can be applied to this class of buildings, such as biomimetics, a science in which architects are inspired by solutions to human problems through the study of designs, systems, and natural processes for the facades of an entire building. Biomimetics demonstrate the interaction of buildings with the environment, and they can significantly reduce energy demand [
15]. The use of materials whose life cycles represent a greener ecological footprint helps to reduce waste or optimize production processes at the source [
16]. The implementation of household waste management in which the user is directly involved has turned out to be a challenging aspect of strategies that have not been concretely defined by cities in developing countries, which is due either to government regulations or limited resources. Over time, this poorly managed waste becomes a potential pollutant with effects on the health and safety of inhabitants [
17].
Urban sprawl’s negative effects on the environment are particularly noticeable in the rise in carbon emissions caused by increasing energy use during travel. Hence, Edward Glaeser claimed that people should be able to live in high-rise structures in which the elevator is the star, rather than in areas of unchecked urbanization in which car use is prioritized [
18].
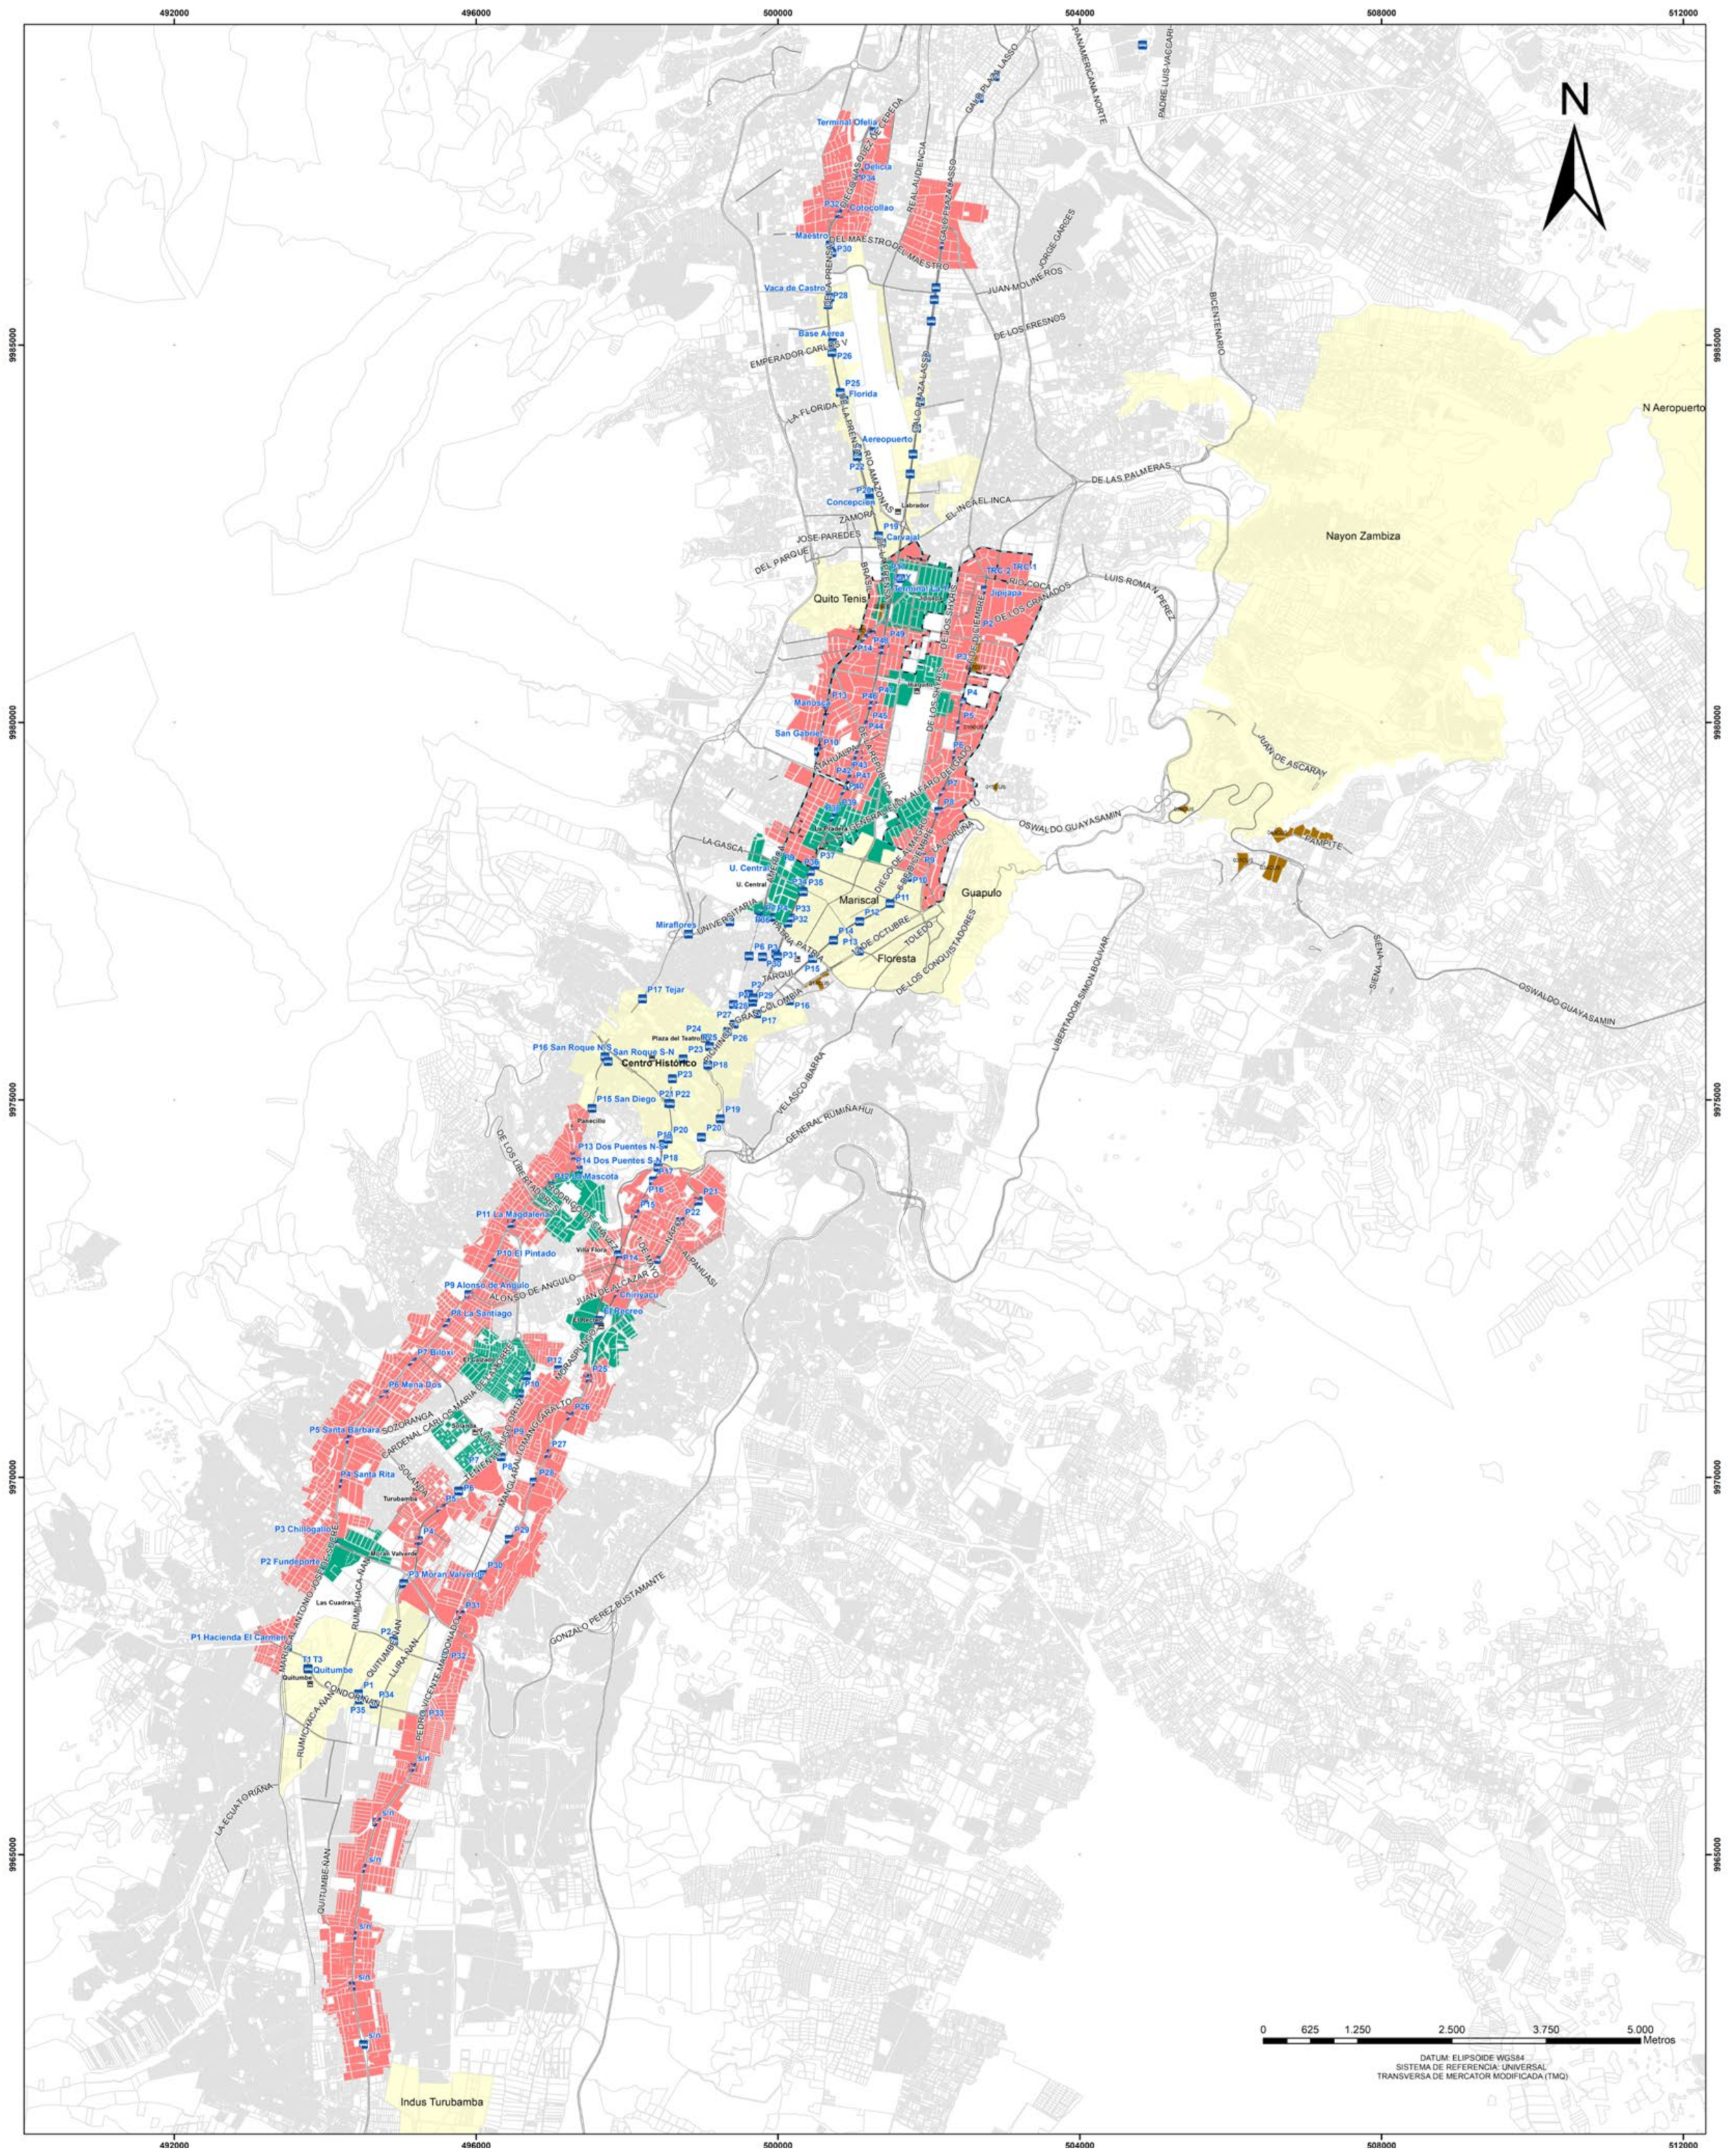
The municipality of Quito created a road plan called Vision of Quito (2040) and a New City Model to address this major issue. They were particularly interested in implementing the suggestions made at the Habitat III Conference, which was held in Quito (Ecuador) in 2016. The Quito Metropolitan District (QMD) had 893,000 residents about 30 years ago, and the city took up 16,297 acres, with a population density of 55 people per hectare. With a population density identical to that indicated before, the population and urbanization virtually tripled by the present. Because the area is both formally and informally inhabited, making eviction more challenging and significantly raising the cost of providing equipment, infrastructure, and services, the current low density reflects the dispersal of people around the region. This has led to a costly metropolis with many undeveloped lands [
19].
The details of architectural designs take on an important role in the construction of buildings. They relate a kind of manipulation between the central core and the external envelope of any composition with a harmonious dialogue. This dialogue creates a comfortable thermal environment that is mainly influenced by adaptation to climatic, social, and economic conditions. Digital modeling tools allow architects to manipulate these elements to seek improved thermal performance of buildings and to control energy consumption in the appropriate available range [
20].
Green construction seeks to increase energy savings and reduce carbon emissions throughout the life cycle of a building, in addition to creating a harmonious and focused link between human beings and nature. The construction of green buildings and the implementation of design and monitoring methodologies are not only important ways to save energy and reduce emissions in cities, but are also ways to implement sustainable development [
21].
The existing interconnections among plans, strategies, and policies related to the use of water and other indicators of efficient construction allow the generation of an integrated framework of urban water security. The plans, strategies, and policies that have been implemented address various issues related to the management of resources in each city that was studied, and they were taken from official action plans and already approved master plan documents that are in practice in these cities. This has generated a vision for 2050 to show its reality and future problems [
22].
The construction industry and its development depend on the number of buildings and projects that are developed over time in order to cover a population’s housing deficit. The natural resources that are required during the construction phase and the serious damage to the environment caused by the waste generated are constantly increasing. The construction of green buildings can reduce these negativities caused by construction, for which sustainability indicators must be defined and classified. To assess green buildings, 12 criteria in four dimensions were developed by using the Fuzzy Level-Based Weight Assessment (LBWA) [
23].
Transport users in the city of Quito do not travel far and use various means of transportation, so high-rise housing densification in Quito is significantly more sustainable than disorderly housing dispersion. This allows for a reduction in the first phase of use of a building in terms of consumption and energy generation, resulting in a more sustainable urban system. The use phase, which includes urban transport, is more likely to increase the GWP because it consumes more energy. A concentrated model driven by the application of the TOD-based Eco-Efficiency Matrix is a strategy that contributes to reductions in the environmental impacts of a city [
24].
The Eco-Efficiency tool has priority levels for managing sustainability at the start, during the operation, or at the closure of a project. The current regulations are focused on meeting first-level sustainability standards regarding transportation and efficiency in energy consumption, since the areas of application of the tool are areas influenced by the metro and BRT services. On the second level of priority are the conservation and use of natural resources, such as water, soil, and materials from a site. Finally, this tool focuses very little on complying with and promoting innovation and strategies for optimizing designs in search of sustainability [
25].
For these reasons, this research was developed to analyze the influence of eco-efficient buildings by comparing the optimized energy efficiency in various scenarios with that of traditional building systems by using the EEM [
20].
3. Results and Discussion
The percentages of compliance with the EEM depended very much on the investments of the construction companies. However, normally, they chose to increase their numbers of flats by 50%, and for this, they needed to comply with a minimum of 70% of the parameters. The three buildings were chosen for their similarity, since they were to be used for housing, and they met the requirements indicated in
Table 6. The compliance of the buildings according to their area was broken down into the thematic axes of water, energy, contributions, and population density, as shown in
Table 7.
As shown in
Table 8, the eco-efficient Tesla building had 70% compliance with the EEM and could obtain 50% more floors, that is, from 10 to 15 floors, with five additional floors. The Imagine building was under construction on the last floors and had 70% compliance with the EEM; thus, it could obtain 50% more floors, i.e., from 16 to 24, with eight additional floors. It was confirmed that most eco-efficient buildings would comply with 70% of the matrix, so the parameters could be considered accessible and profitable, regardless of whether the construction company was large or small.
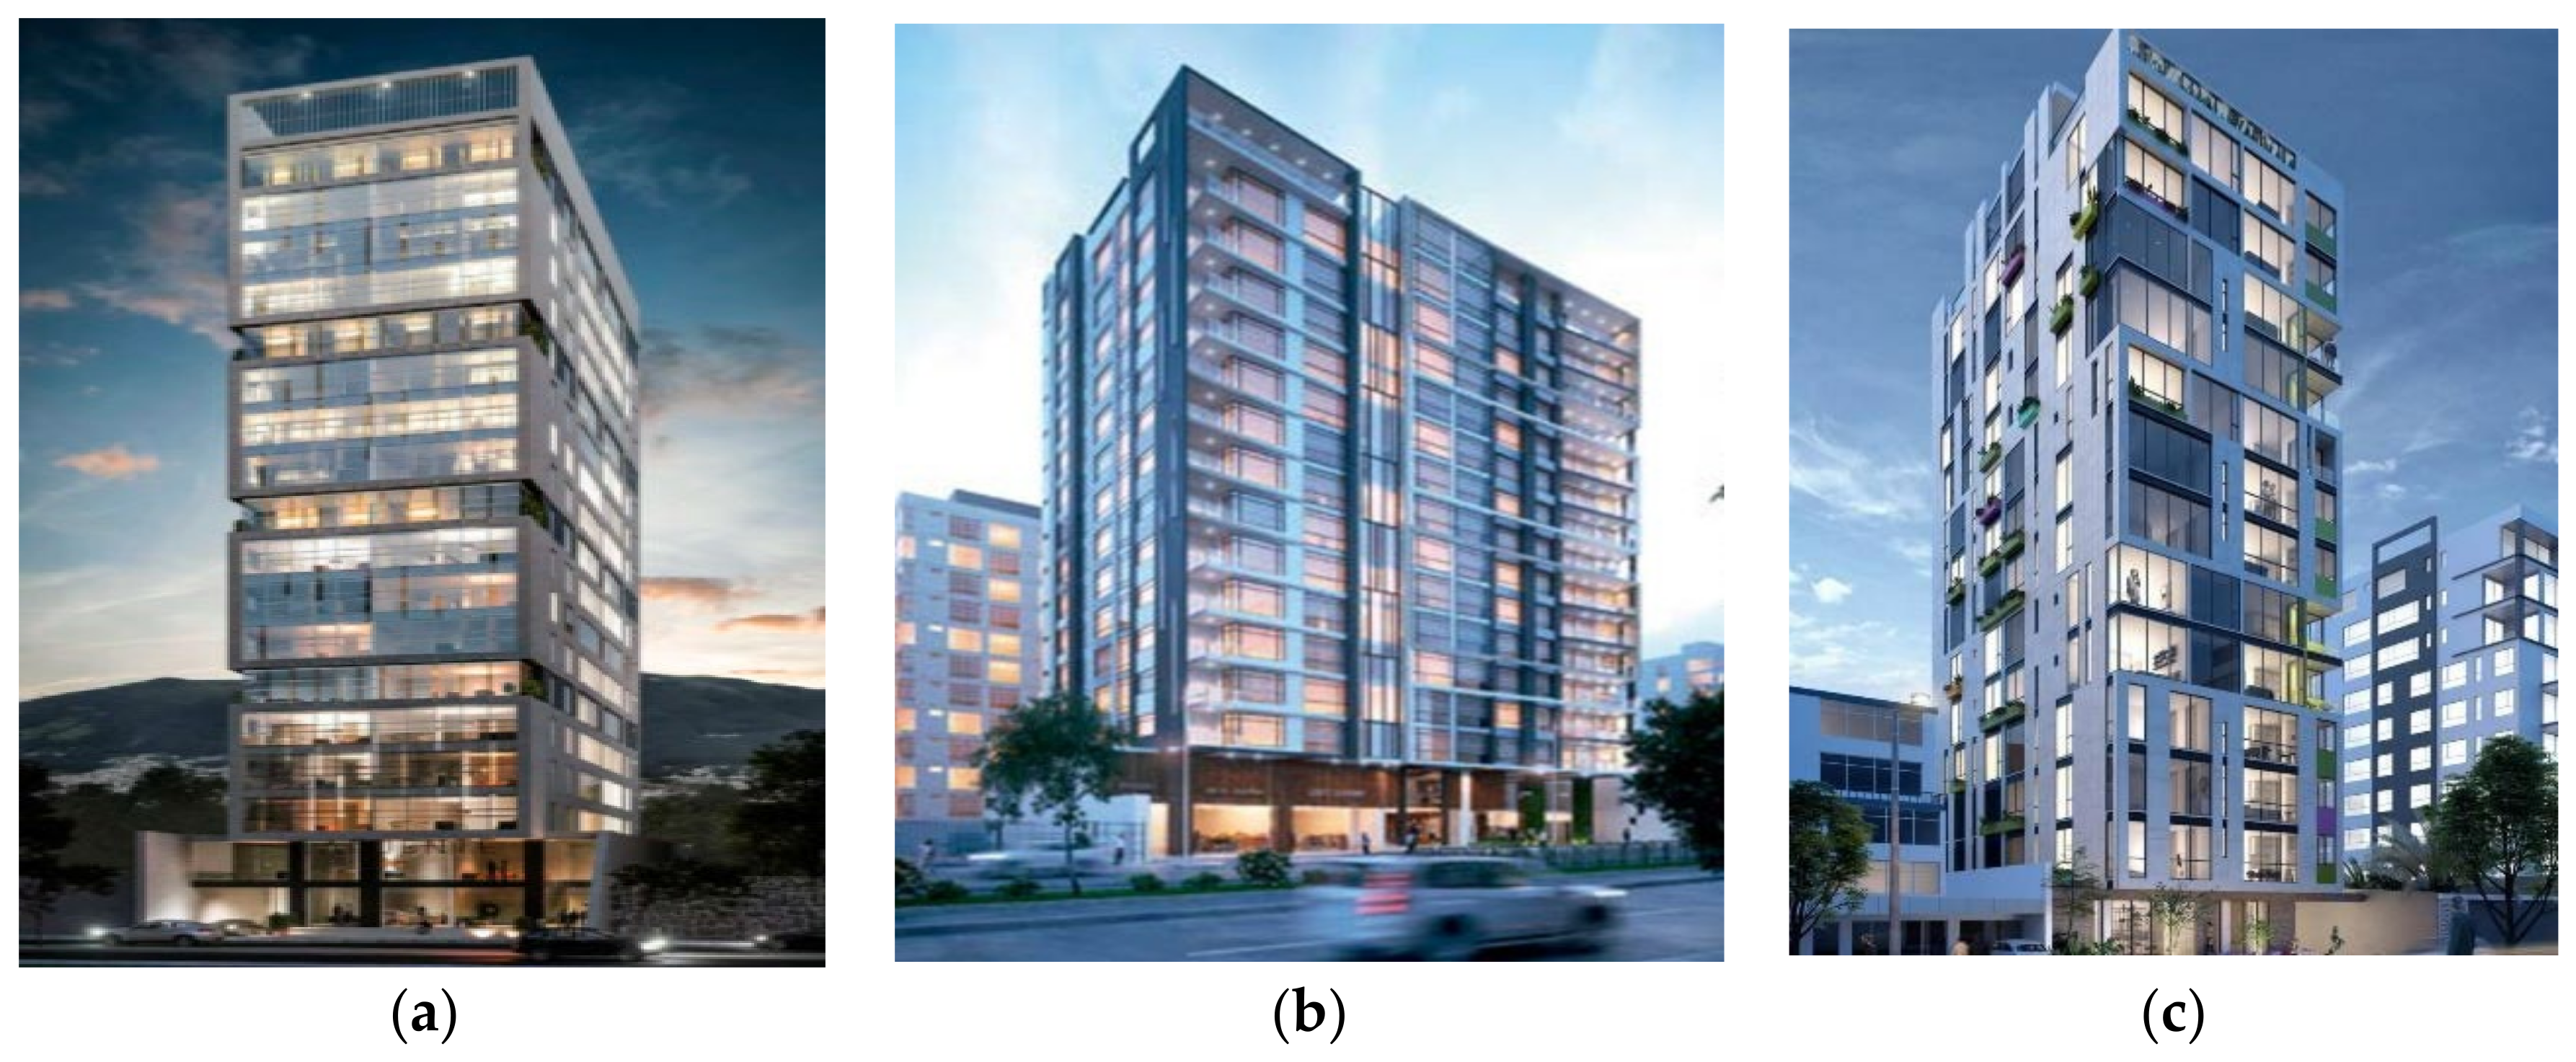
All of the buildings were in a state of construction—Lafuente was involved in excavations and underground work, Essence was involved in expanding the number of floors, and Huma was involved in finishing. Certain data for the modeling of the investigation of the Lafuente building were complemented with data from more advanced buildings, such as Tesla and Imagine, which were from the same construction company (Alpha Builders). A rendered model of the buildings evaluated in this study is shown in
Figure 2.
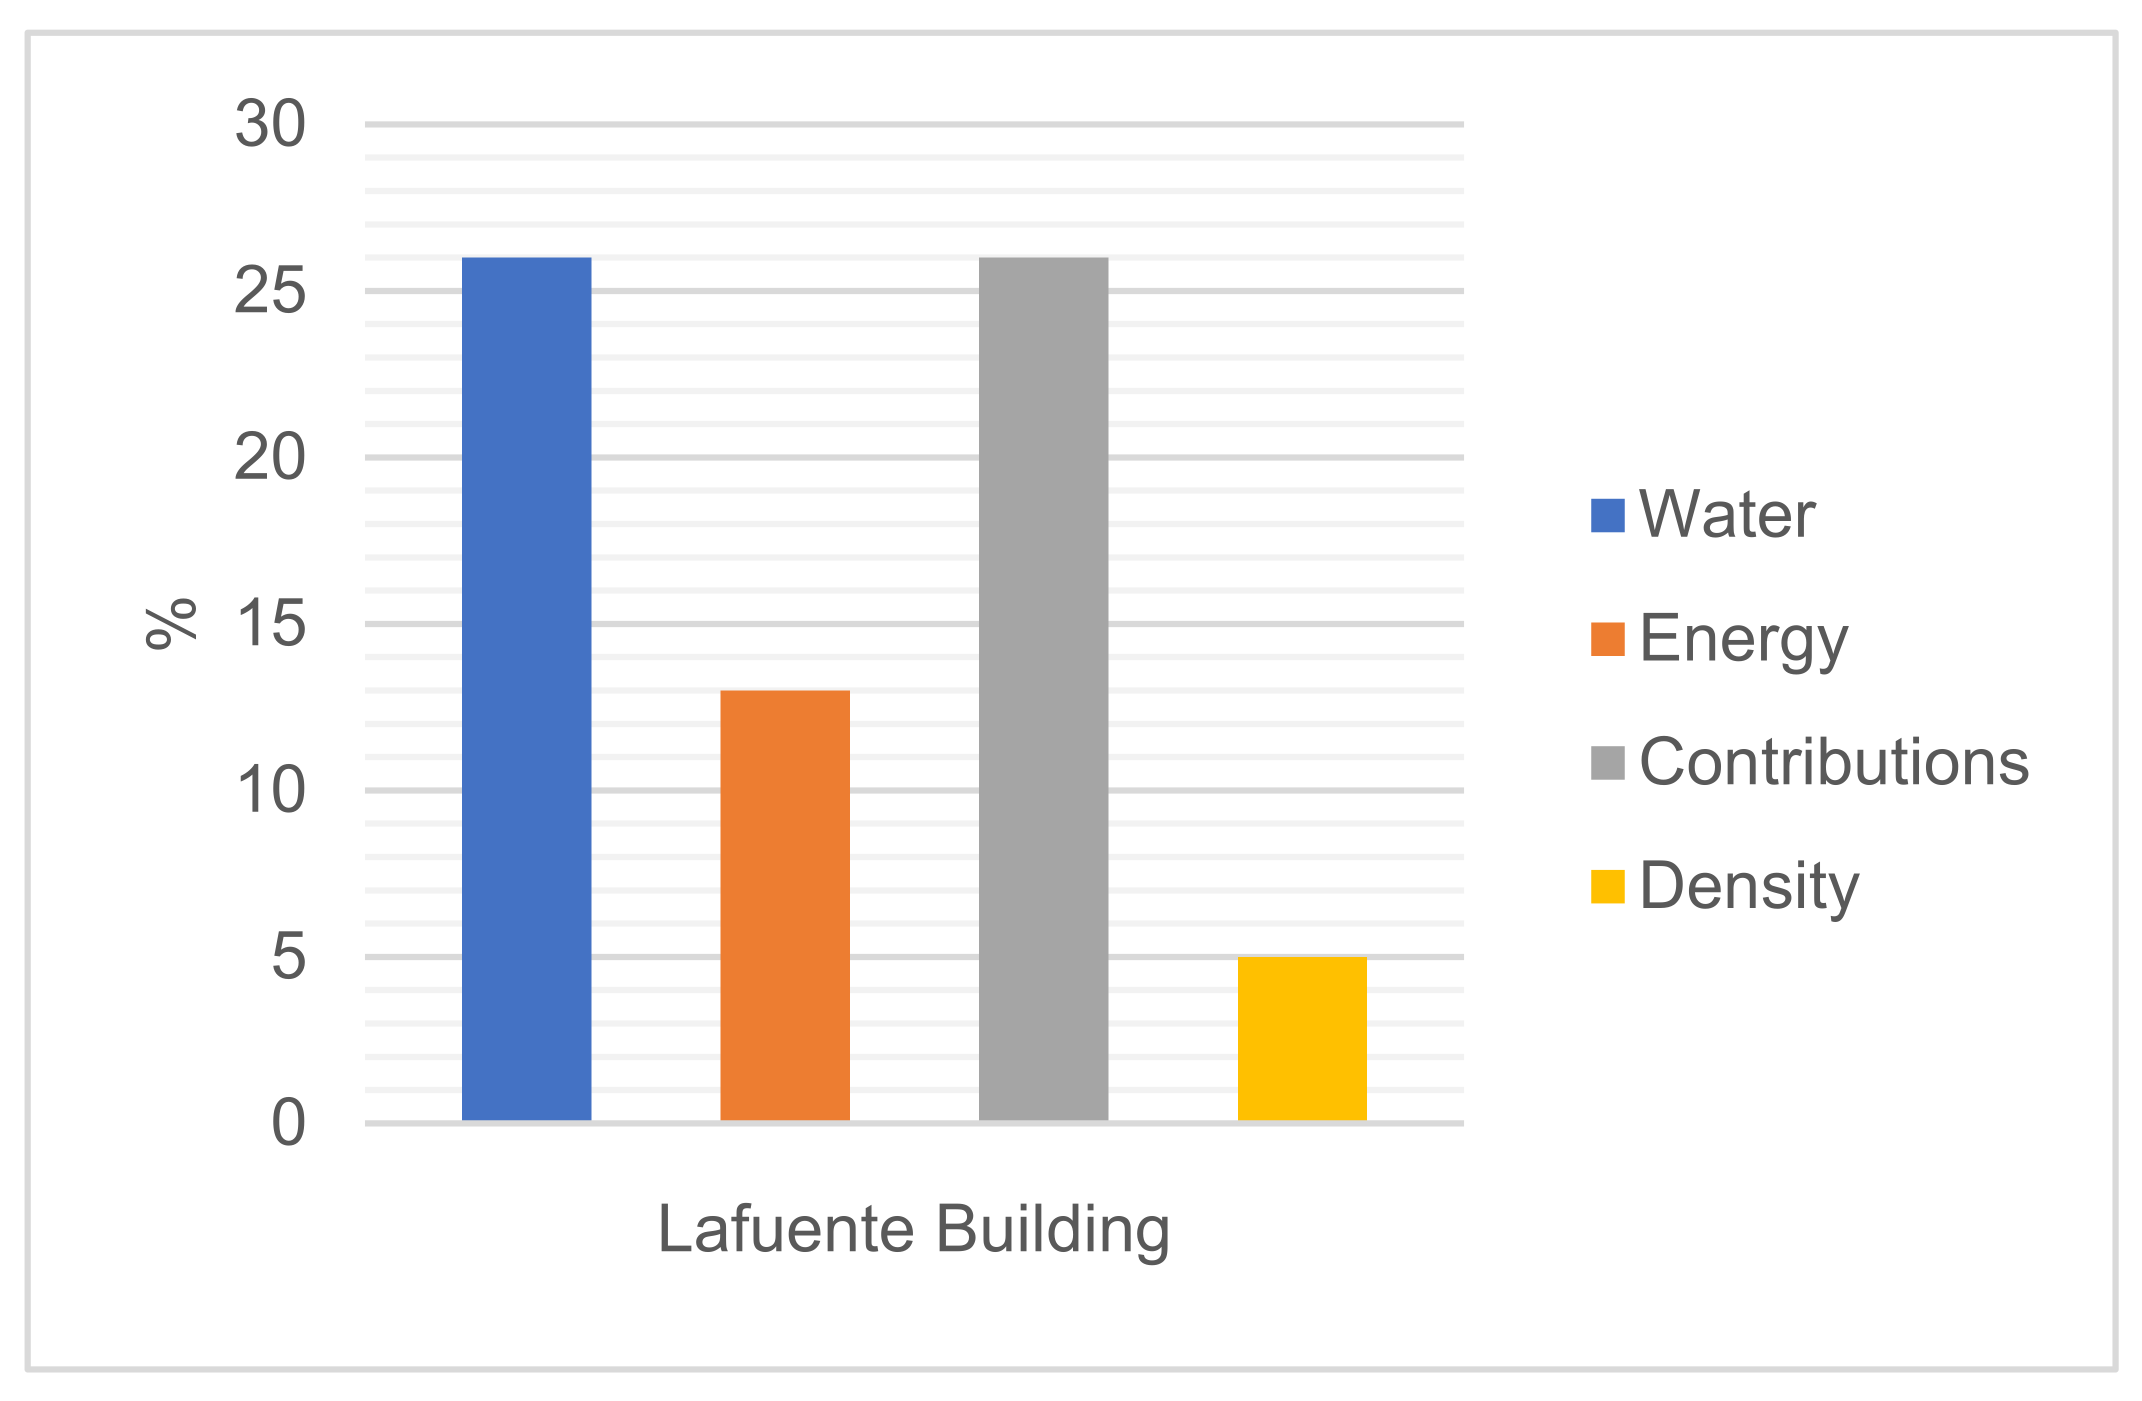
The Lafuente building project was located in the BRT–Hipercentro area, as was the construction company Alpha Builders. According to
Figure 3, it complied with the water parameter by 26%; this parameter was that in which the Lafuente building was most invested. This meant that its costs may have been higher than those of the other two buildings because it implied the implementation of extra systems in terms of hydrosanitation. In energy, the compliance was 13%, which was the constant in several typical buildings, and in contributions, it was 26%, which is a parameter that can vary due to the influence of an infrastructure’s environment and the lot.
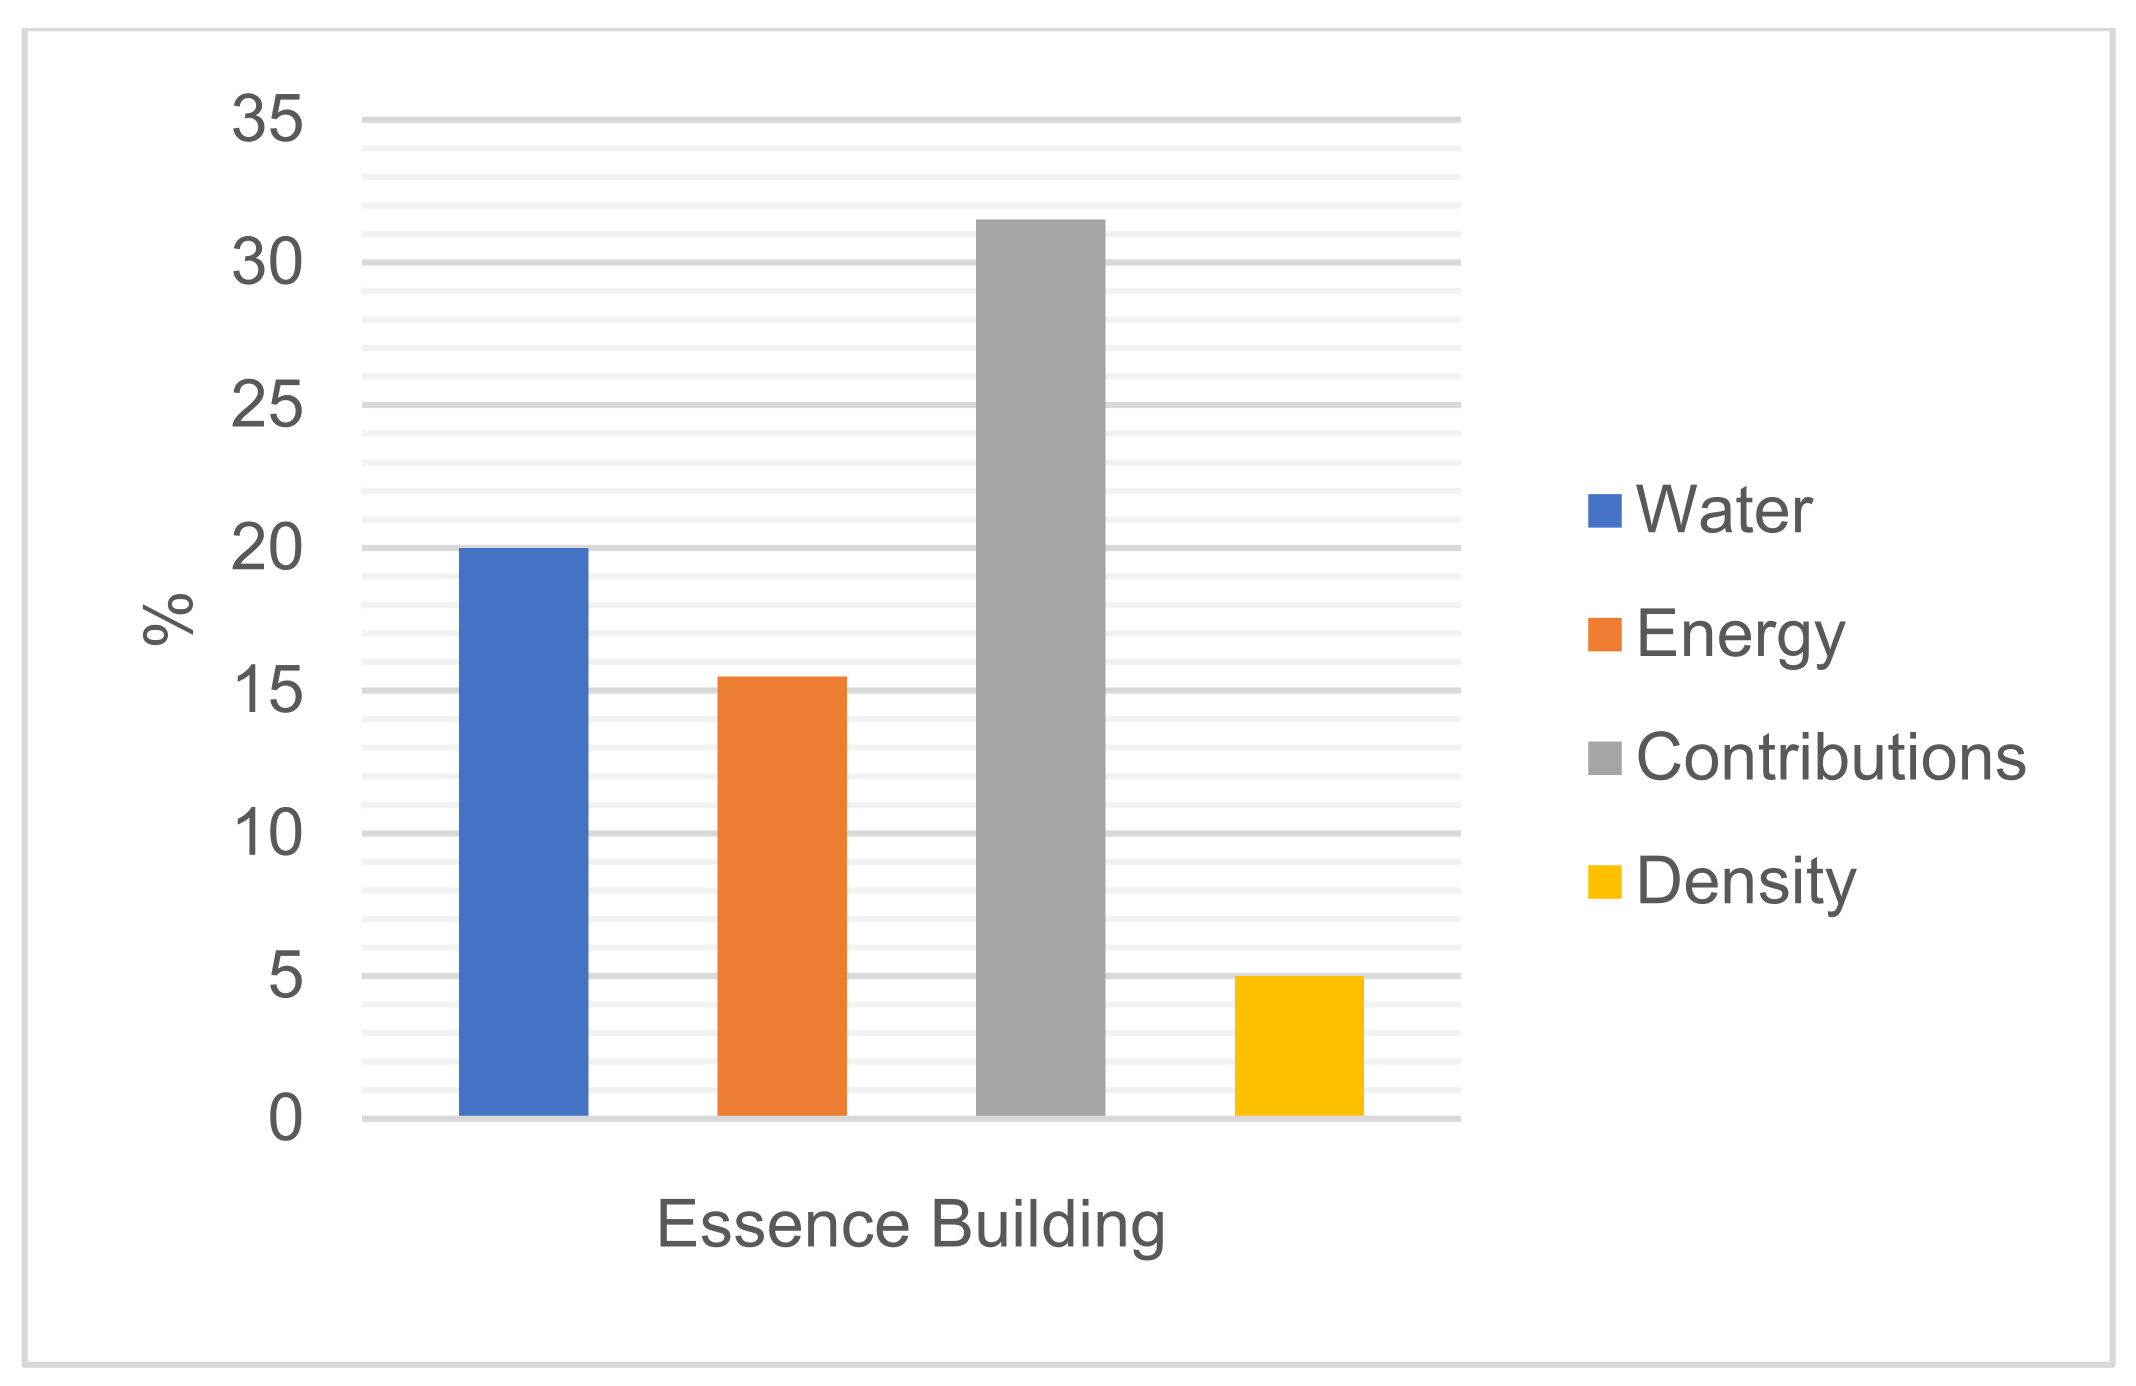
The Essence building project was located in the BRT–Hipercentro area, where it was decided to invest in the percentages of compliance with the ME shown in
Figure 4. The building’s compliance with water was 20%, which was the average percentage of the parameter. It complied more with the use of low-consumption equipment, depending on the demand. For energy, the compliance was 15.50%, which was the constant in several typical buildings. It was also based more on equipment, and its contributions reached 30.25%. This building showed more compliance with this parameter by having a score in the “unification of lots” parameter, which is a rare and costly feature to have.
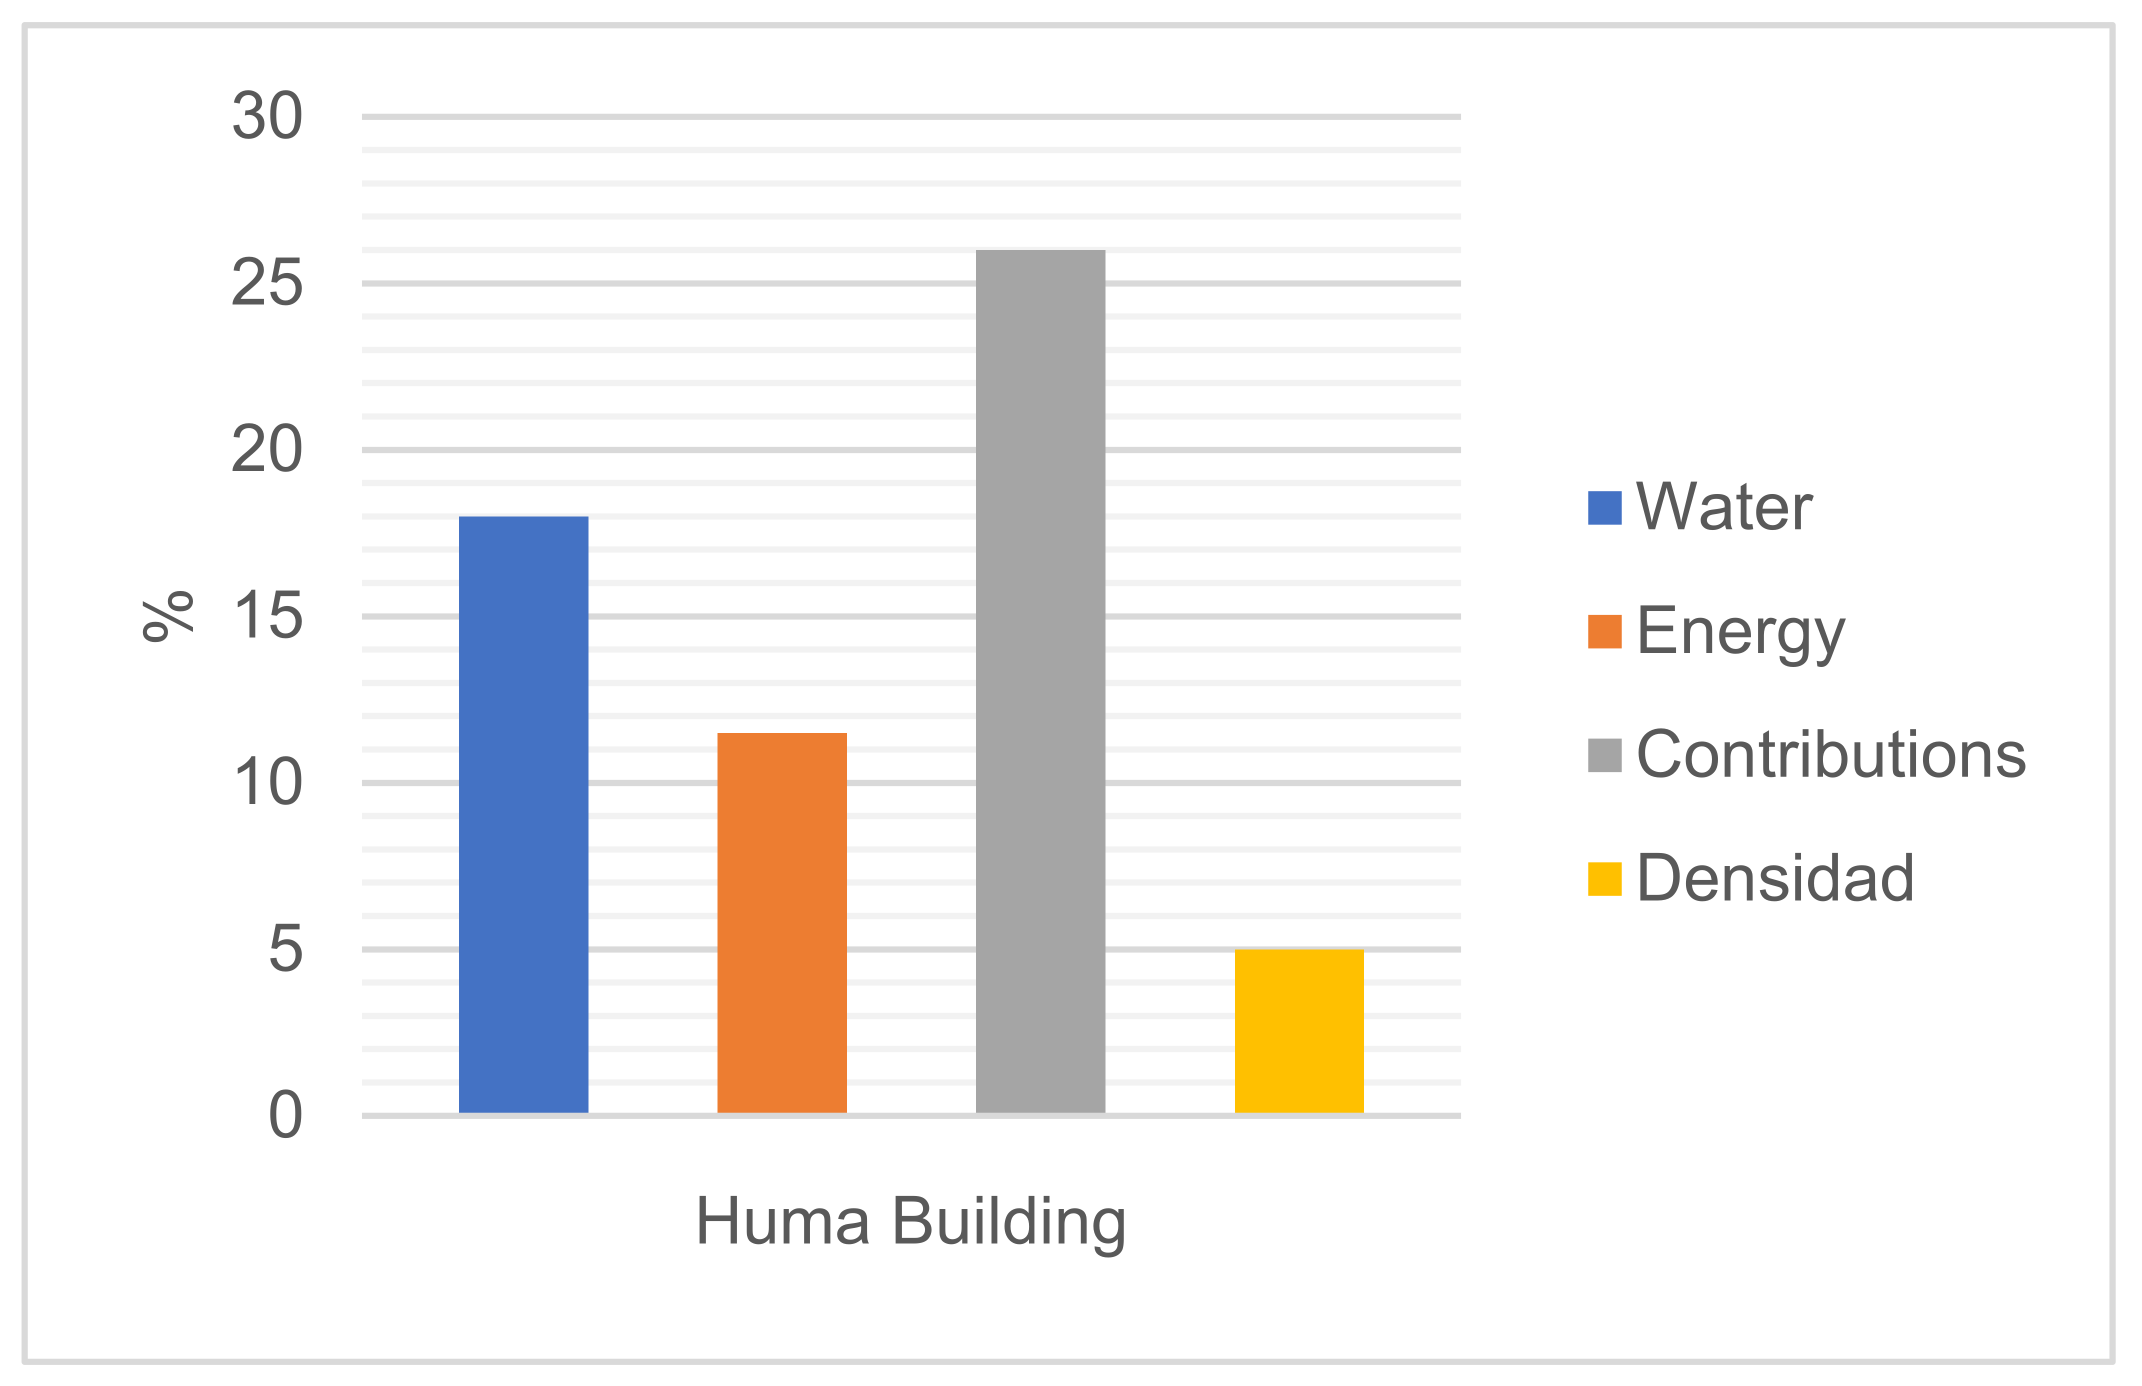
The Huma building project was located in the BRT–Hipercentro area. The Álvarez Bravo construction company decided to invest in the percentages of compliance with the EEM shown in
Figure 5. According to the graph, we could interpret that the construction company invested in water at 18% and in energy at 11.5%. This showed that this building complied with these parameters the least. For contributions, it reached 26%, which was the average in typical buildings. It should be taken into account that its percentages were lower than those of the other buildings shown because it also had 10% less compliance with the EEM due to its minimal extension.
The energy consumption calculations for the buildings were based on basic household electrical equipment while considering two scenarios: traditional and optimized buildings. The latter was differentiated by the use of extra active and passive strategies, such as motion sensors, more efficient illumination, and heat pumps for water heating. Optimized equipment is not considered a white line, since users are not dependent on its use, even though that would be the ideal way to improve the scenario. To improve the standard strategies, it was proposed to implement domotic systems. Consequently, the whole building was automated to achieve lower losses and comfort for users. Additionally, a card technology could be implemented in which a user could activate and deactivate their space. In addition, all of the equipment was disconnected, except for devices that always needed to be connected, such as refrigerators.
On the other hand, to minimize the consumption of electrical energy, the modeling and simulation of the thermal behavior of the building as a function of climatological variables allowed the consideration of passive ventilation criteria, construction materials, maximization of the use of solar illumination during the day, and the orientation of the building. The main factor affecting the optimization of the building was the users, since the implementation by the construction company was limited by the purchase of eco-efficient equipment by the residents. The strategy consisted of delivering infrastructure with luminaires and developing plans on the part of the building administration that considered the energy ranges of equipment; users could choose any product contained in these plans. A comparison of the electrical consumption of a traditional building with that of an eco-efficient building is presented in
Table 9, where it is important to mention that the activity of the building was residential; thus, the comparisons were more specific and did not have many variables due to changes in use; 85 apartment units with a total of 282 users were considered.
In certain cases, a determining factor was the construction company because of the investment in a profitable economic analysis with the extension of the number of floors that an eco-efficient project requires. Nevertheless, it was almost always in the interest of the construction company to have more apartments in the same building than to buy a new piece of land and build something new. It was determined that in eco-efficient consumption, there were savings of 46%, which represented support for the other parameters of the matrix, as shown in
Table 10.
This analysis was very variable, since it depended directly on the size of the land and the location, so in this project, it was estimated that the profitability could be in the range of 30% to 40% more than expected, considering that its land area was 740 m
2, as indicated in
Table 11. In reality, prices can greatly vary according to market fluctuations, and buyers sometimes want to change the design of a space of interest or make unifications, which can result in them negotiating new prices with the construction company. In addition, a construction company can generate discounts if it is promoting a company or plans.
For the electrical energy, the analysis was divided into the areas of influence according to an optimized strategy. All data were converted into kW and given an identification for modeling. The strategy that was employed consisted of minimizing the energy consumption, which, in turn, reduced the project’s operating costs. A third scenario was also added, and it considered traditional, eco-efficient, and optimized buildings. For the latter, the savings were increased by 10% due to the extra strategies related to automation mentioned above. This could be corroborated by other eco-efficient buildings that had that percentage of increase with this system, as detailed in
Table 12.
Among the variables considered were illumination, water heating, and general services; the data were taken from eco-efficient buildings, as indicated in
Table 13. In the case of equipment, since it was not optimized, so users could not be forced to use it, the same data were used for all buildings.
With the total cost for each parameter defined in
Table 13 and the analyses above, the parameters were defined in an objective function, as indicated in Equation (1):
The data were obtained by taking the basis that when a building started to operate, 40% of the space was occupied during the first months. This is because many people buy apartments as an investment rather than to inhabit them. The minimum use was calculated based on this percentage of kWh, and the maximum use was calculated based on the entire infrastructure occupied. Hence, the entire building was saturated, since it could not exceed this number of users per unit. In this way, the restrictions in each area shown in
Table 14 were defined.
The comparative analyses of the three scenarios for buildings mentioned above—subdivided into the areas of influence with their average consumption according to the strategy applied—are shown in
Table 15.
The development of the linear programming model was based on the use of the LINDO software for the resolution of the system of equations [
32]; as a summary, the different data that were identified were obtained together with their objective functions, restrictions, and costs, as shown in
Table 16.
The optimization function of the energy system resulted in 1498,454 kWh/month in its minimization, and the restriction values shown in
Table 17 were obtained.
From this result, it could be interpreted that the system was still improved because a suite would not always be occupied by two users, and so on for the rest of the units. Finally, by conditioning the optimized control parameters for the EEM, the percentage of compliance per improved area was obtained for each building, as shown in
Table 18.
The results presented by Cáceres et al. [
24] established that the urban concentration on height reduced the environmental impact of the area of the Hypercenter of Quito; in Model 1, the environmental impact (5,521,467.89 kgCO
2_eq) was reduced to almost half of that in Model 2 (9,624,023.94 kgCO
2_eq). In other words, the users in Model 2, who had to travel long distances to carry out their activities (work, study, shopping, leisure, etc.), had a greater impact on the city, since they used different means of transportation to move around, unlike the users in Model 1, who could make more journeys on foot. In this sense, and considering the results shown regarding the relationship that existed between the mobility of the inhabitants, the housing area, and the number of floors that a building could have, it was shown that generating optimization models focused on the energy consumption of buildings in their operation phase allowed a reduction in the energy consumption generated by excessive population growth in a city.
Liu et al. [
33] presented a study of the eco-efficiency of buildings in China that went through a process of evolution, which showed that the growth gradient of efficient buildings gradually passed from an area of low-medium/medium efficiency to an area of medium/medium-high efficiency. For this reason, they recommended implementing green building policies, making the most of local comparative advantages, and coordinating and improving support policies for green buildings and related industries by generating tools for monitoring and optimizing the energy consumption of buildings. For this, the generation of vertical growth policies in the design and operation phases of buildings allows an increase in their population density.
Shiripour and Mohammadnejad [
32] analyzed the management of fossil fuel and electrical energy usage that was included in the planning of construction projects. The objective was to determine the ideal number of periodic services for machines that consumed fossil fuels, as well as the ideal service times, so that the objective function value could be minimized, in addition to providing an optimal schedule for the electrical energy consumption of electric machines (in what period and for how long each machine could be used each day). According to this, a linear mathematical programming model was developed, in which all costs associated with the consumption of power, services, and fossil fuels throughout the project were taken into account. The collected results demonstrated that as the project completion time and the number of machines used increased, so did the objective function value of the presented problem.
4. Conclusions and Recommendations
The impacts of eco-efficient buildings were investigated by contrasting their designs according to energy efficiency requirements and based on an optimization that took scenarios with typical construction systems into account. The evaluation revealed that the water consumption criteria were the most expensive for any construction business to control and had a very erratic percentage of compliance because they were dependent on local customs.
The construction companies were interested in applying at least 50% extensions of floors. This meant, on average, at least five additional floors, since the investment in resources made the benefits greater. The parameters of the EEM were connected, i.e., one parameter strengthened others or was directly proportional. For example, if one parameter was not met, the other could not be applied either. The most expensive area to implement for construction companies was “water”, among other strategies that required the modification of the building or the use of its spaces to comply with this objective, due to the implementation of treatment plants and their maintenance. For this reason, it was usually the most variable parameter in the results, and other areas, such as “contributions”, always maintained their consistency, regardless of the construction company.
The percentages of compliance with each parameter should have a better technical basis. This also includes the extra points that occurred in certain areas. They could reach a higher score to motivate builders to improve their buildings or add extra points for the parameters of energy consumption and renewable energy generation. For example, using technological initiatives that reduce energy consumption and contribute to the city, such as photovoltaic glass applied to facades, windows, skylights, or floors, allows several renewable innovations to be used at the same time.
The advantage offered by the EEM is that when a city has more buildings of this type, a more tangible change into a sustainable place can be seen. For example, if a building can better control electricity consumption with efficiency strategies, electricity demands will decrease in order to supply users with much more infrastructure. The disadvantage of the EEM is that, as it still requires much research, some parameters can be subjective for the technician who uses it, making the results relative as well. In the short time that this type of methodology has been used, there has been a notable improvement in the development of sustainable urban spaces.
By optimizing the eco-efficient scenario, it was possible to discover that the main influencers were the users. This can be explained by the fact that at the time of the operation of the project, they were integral participants in maintaining the best scenario. However, this parameter is difficult to control for construction companies, so training could be provided to the inhabitants of an infrastructure on domestic waste management issues to generate environmental awareness.
The eco-efficient scenario showed that the main influence on energy consumption was the users, since, at the time of project operation, they were integral participants in the management of the energy scenario. This was something out of the control of the construction companies because, within the operation of the building, their support could only go as far as generating training for the co-owners to generate environmental awareness.
The proper use of energy must be optimized by choosing patterns, using techniques, and enforcing laws that are both economically advantageous and guarantee the durability and sustainability of energy, as well as the continuity of life and motion. Today, practical steps have been made to reduce energy consumption. Despite previous research, there is still a great deal of room for improving energy consumption, which, when done properly, can produce a variety of benefits, such as reduced energy demand, a slower rate of capacity expansion for existing power plants, better consumption patterns, and higher rates of system utilization.
Eco-efficient buildings have been a new construction trend in the city of Quito since 2016 in an effort to generate strategies that make the most of all of the resources involved from the construction phase to the operational phase. In this case, when using an optimization model with linear programming, the most representative variables are considered according to costs and their variability,
A linear mathematical programming model was developed as a consequence, and it included all of the costs associated with electricity usage, service prices, and occupancy rates. A global solver from the LINGO optimization program was used to solve the suggested mathematical model. Many sample issues of various sizes were looked at to better understand the behavior of the proposed problem. The collected results demonstrated that when the project completion time and machine count grew, so did the objective function value of the presented problem.
Furthermore, as the project completion time increased, the model’s solving time also logarithmically ascended. The collected findings showed that the suggested model was capable of reducing the costs associated with energy consumption in construction projects by offering the best possible planning for the electric system.


