Article

Quantitative Identification Study of Epidemic Risk in the Spatial Environment of Harbin City

School of Landscape, Northeast Forestry University, Harbin 150040, China
*
Author to whom correspondence should be addressed.
Sustainability 2023, 15(9), 7558; https://doi.org/10.3390/su15097558
Submission received: 2 April 2023 / Revised: 29 April 2023 / Accepted: 3 May 2023 / Published: 4 May 2023
(This article belongs to the Section Sustainable Urban and Rural Development)

Abstract

:
Global pandemics pose a threat to the sustainable development of urban health. As urban spaces are important places for people to interact, overcrowding in these spaces can increase the risk of disease transmission, which is detrimental to the sustainable development of urban health. Therefore, it is crucial to identify potential epidemic risk areas and assess their risk levels for future epidemic prevention and the sustainable development of urban health. This article takes the main urban area of Harbin as the research object and conducts a cluster spatial analysis from multiple perspectives, including building density, functional density, functional mix, proximity, intermediacy, and thermal intensity, proposing a comprehensive identification method. The study found that (1) functional density is the most significant influencing factor in the formation of epidemic risks. Among various urban functions, commercial and public service functions have the strongest impact on the generation and spread of epidemic risks, and their distribution also has the widest impact range. (2) The spaces with higher levels of epidemic risk in Harbin are mainly distributed in the core urban areas, while the peripheral areas have relatively lower levels of risk, showing a decreasing trend from the center to the periphery. At the same time, the hierarchical distribution of urban space also has an impact on the spatial distribution of the epidemic. (3) The method proposed in this study played an important role in identifying the spatial aggregation of epidemic risks in Harbin and successfully identified the risk levels of epidemic distribution in the city. In spatial terms, it is consistent with high-risk locations of epidemic outbreaks, which proves the effectiveness and feasibility of the proposed method. These research findings are beneficial for measures to promote sustainable urban development, improve the city’s epidemic prevention capabilities and public health levels, and make greater contributions to the sustainable development of global public health, promoting global health endeavors.

1. Introduction

In recent years, numerous pandemics that spread through human contact have ravaged the world, affecting the stability and sustainable health development of cities. Among the many infectious diseases, the COVID-19 pandemic is the most typical. Since 2020, due to its strong infectivity and rapid spread, cities have been repeatedly ravaged by the virus, posing unprecedented challenges to people’s productivity and life [1]. Against this background, urban health sustainable development and urban functional health issues have become research focuses in related fields both at home and abroad. Although the COVID-19 pandemic has been effectively controlled through the efforts of the people, similar infectious diseases may reappear in the future. Humans may coexist with pandemic-like diseases for a long time, which may cause large-scale outbreaks due to the mutation of new viruses [2]. In order to enhance the sustainability of cities and improve their resilience to potential risks such as epidemics, it is important to quantitatively identify hidden hazards in urban spaces. This can help us detect and solve potential risks in cities in a timely manner, ensuring the safety of residents and promoting the sustainable development of cities. Therefore, quantitative identification of hidden risks in urban spaces is necessary and important. Before the outbreak of the pandemic, urban areas with high accessibility, population density, and concentration of relevant infrastructure were often the central areas of urban development with high vitality. However, after the outbreak, these places with large population concentrations, high transportation accessibility, and high density of facilities have become spaces with high hidden risks of epidemic hazards in cities, which are not conducive to the healthy and sustainable development of cities. Prior to the COVID-19 outbreak, many scholars had already conducted research on the prevention and control, prediction, and identification of epidemics from relevant professional perspectives. As early as 2017, Shao Piaopiao and others selected seven representative indicators such as case data, transmission media, and media quantity and used the weighted comprehensive index method to assess the risk of malaria in the sample area [3]. Afterwards, related research on various communicable diseases became more extensive, which provided a certain foundation for studying the hidden risks of urban epidemic transmission. In recent years, numerous scholars have summarized the experience of their predecessors and conducted research on the prevention and control, prediction, and identification of epidemics from relevant professional perspectives. In 2020, Li Luanqiong and others used national epidemic data and Baidu Migration big data from 1 January to 7 May 2020 and combined them with the DTW algorithm to conduct cluster analysis on the time series curve of the recovery of urban vitality under the impact of COVID-19 in China [4]. This will help us understand the relationship between urban vitality reflected by population distribution and the distribution of the epidemic. Subsequently, Li Xin and others pointed out that the analysis and verification of urban spatial factors are beneficial for adopting effective urban planning and architectural design in response to future sudden public safety crises. This view will help prevent future public health events [5]. This study has triggered scholars to consider other factors related to the spatial spread of viruses in urban areas. Then, Chen Xiao and others proposed that service facilities such as shops, supermarkets, and catering are significantly related to the spread of infectious viruses, and it was also suggested that interactions between streets are important factors in the occurrence of clustered epidemics [6]. Wang Jiaoe and others explored the spatial diffusion of the epidemic in various provinces of China and found that factors such as geographic proximity, population size, traffic flow, human flow, and epidemic prevention and control management have a significant impact on the spread of the epidemic [7]. These studies have enriched the system of factors affecting epidemics and laid the foundation for further research. Subsequently, other scholars began to explore the spatial clustering patterns of cases of epidemic occurrence, trying to identify some regularities. Mo et al. used space–time cubes to analyze the local outlier and emerging space–time hotspots of COVID cases and explored the hotspots of the epidemic-prone space in various cities in China [8]. Desjardins et al. used daily case data at the county level provided by Johns Hopkins University to detect the spatial aggregation of the epidemic in various counties and cities in the United States using the SaTScan algorithm [9]. The above studies are of great significance for the prevention and identification of hidden dangers of the epidemic in China. Their research results are helpful in preventing and identifying hidden dangers in the work of responding to infectious diseases, and this provides important clues for future research in this field. However, there are still some important issues that need to be addressed. First of all, in previous studies on the clustering of epidemics, most of them have taken a large-scale perspective, while the research and exploration of small-scale spaces are relatively weak [10]. Small-scale spaces, as the basic public spaces where urban populations have close interactions, may lead to the spread of highly contagious diseases such as COVID-19 if they are not given enough attention, which is very detrimental to epidemic prevention and control in cities [11]. In order to enrich the study of epidemic hazards at different scales, this article takes the spatial distribution of Harbin city as the research object. Using multiple sources of big data and geographic information data, the main urban area of Harbin city is divided into several grids, and the data are aggregated into multiple cells for analysis. The study identifies spatial clustering hotspots of epidemic hazards and explores the spatial zones of clustered hazardous neighborhoods [12]. Secondly, in previous studies on epidemics, the number of factors involved is relatively small, which may result in insufficient interpretation of the research. Therefore, this article starts from multiple perspectives, establishes an indicator system related to the epidemic from the human perspective, and identifies epidemic risks in the urban spatial structure of Harbin city. This will help to make up for the shortcomings of research on epidemic risks in small-scale spaces. Based on the above reasons, this article is committed to providing a method for identifying the spatial risk of epidemic hazards in urban areas using multi-source big data and starting from the perspective of geographical space, building on the rich research related to epidemic hazard risks. The goal is to enhance the city’s ability to prevent, control, and respond to epidemics and provide a reference for epidemic prevention and control strategies [13].

2. Materials and Methods

2.1. Research Scale

This article focuses on Harbin, the capital city of Heilongjiang Province, which has a large population and a significant number of external inputs. Due to the city’s circular radial spatial layout and relatively complete infrastructure, its transportation impact and attraction are very significant, often leading to large-scale gatherings of people and increasing the potential risk of epidemic outbreaks. This study mainly focuses on the main urban area of Harbin, exploring the risk of communicable diseases in this area and using government-reported epidemic case data to verify the identification results. Considering the division of administrative districts, the spatial development status, and economic development status of Harbin, as well as the completeness of the research scope in the urban area, this article selects the area within the Fourth Ring Road of Harbin as the research scope. The study area is divided into four ring roads: the Inner Ring Road, the Second Ring Road, the Third Ring Road, and the Fourth Ring Road. It mainly covers five district groups, including Songbei District, Daoli District, Daowai District, Xiangfang District, and Nangang District (Figure 1).

2.2. Data Selection and Processing

In urban areas, hidden dangers often exist in certain regions where the risk of disease transmission is significantly higher than in other areas. Many scholars have found that streets and buildings in cities provide platforms for communication and interaction among people, and there is a certain correlation between various facilities of interest (such as shops, restaurants, supermarkets, etc.) and the spread of human-to-human disease transmission [14]. In addition to considering attractive elements, this article believes that the vitality of a neighborhood can reflect the trend of population changes over time. Therefore, the population clustering characteristics of urban areas should be included in the research on identifying hidden epidemic risks. This article summarizes the previous achievements of scholars in epidemic-related research and identifies the use of four types of data, including road networks, building contours, points of interest, and heat maps, to identify the spatial clustering of epidemic risks in Harbin neighborhoods [15].

2.2.1. Road Network Data and Point-of-Interest Data

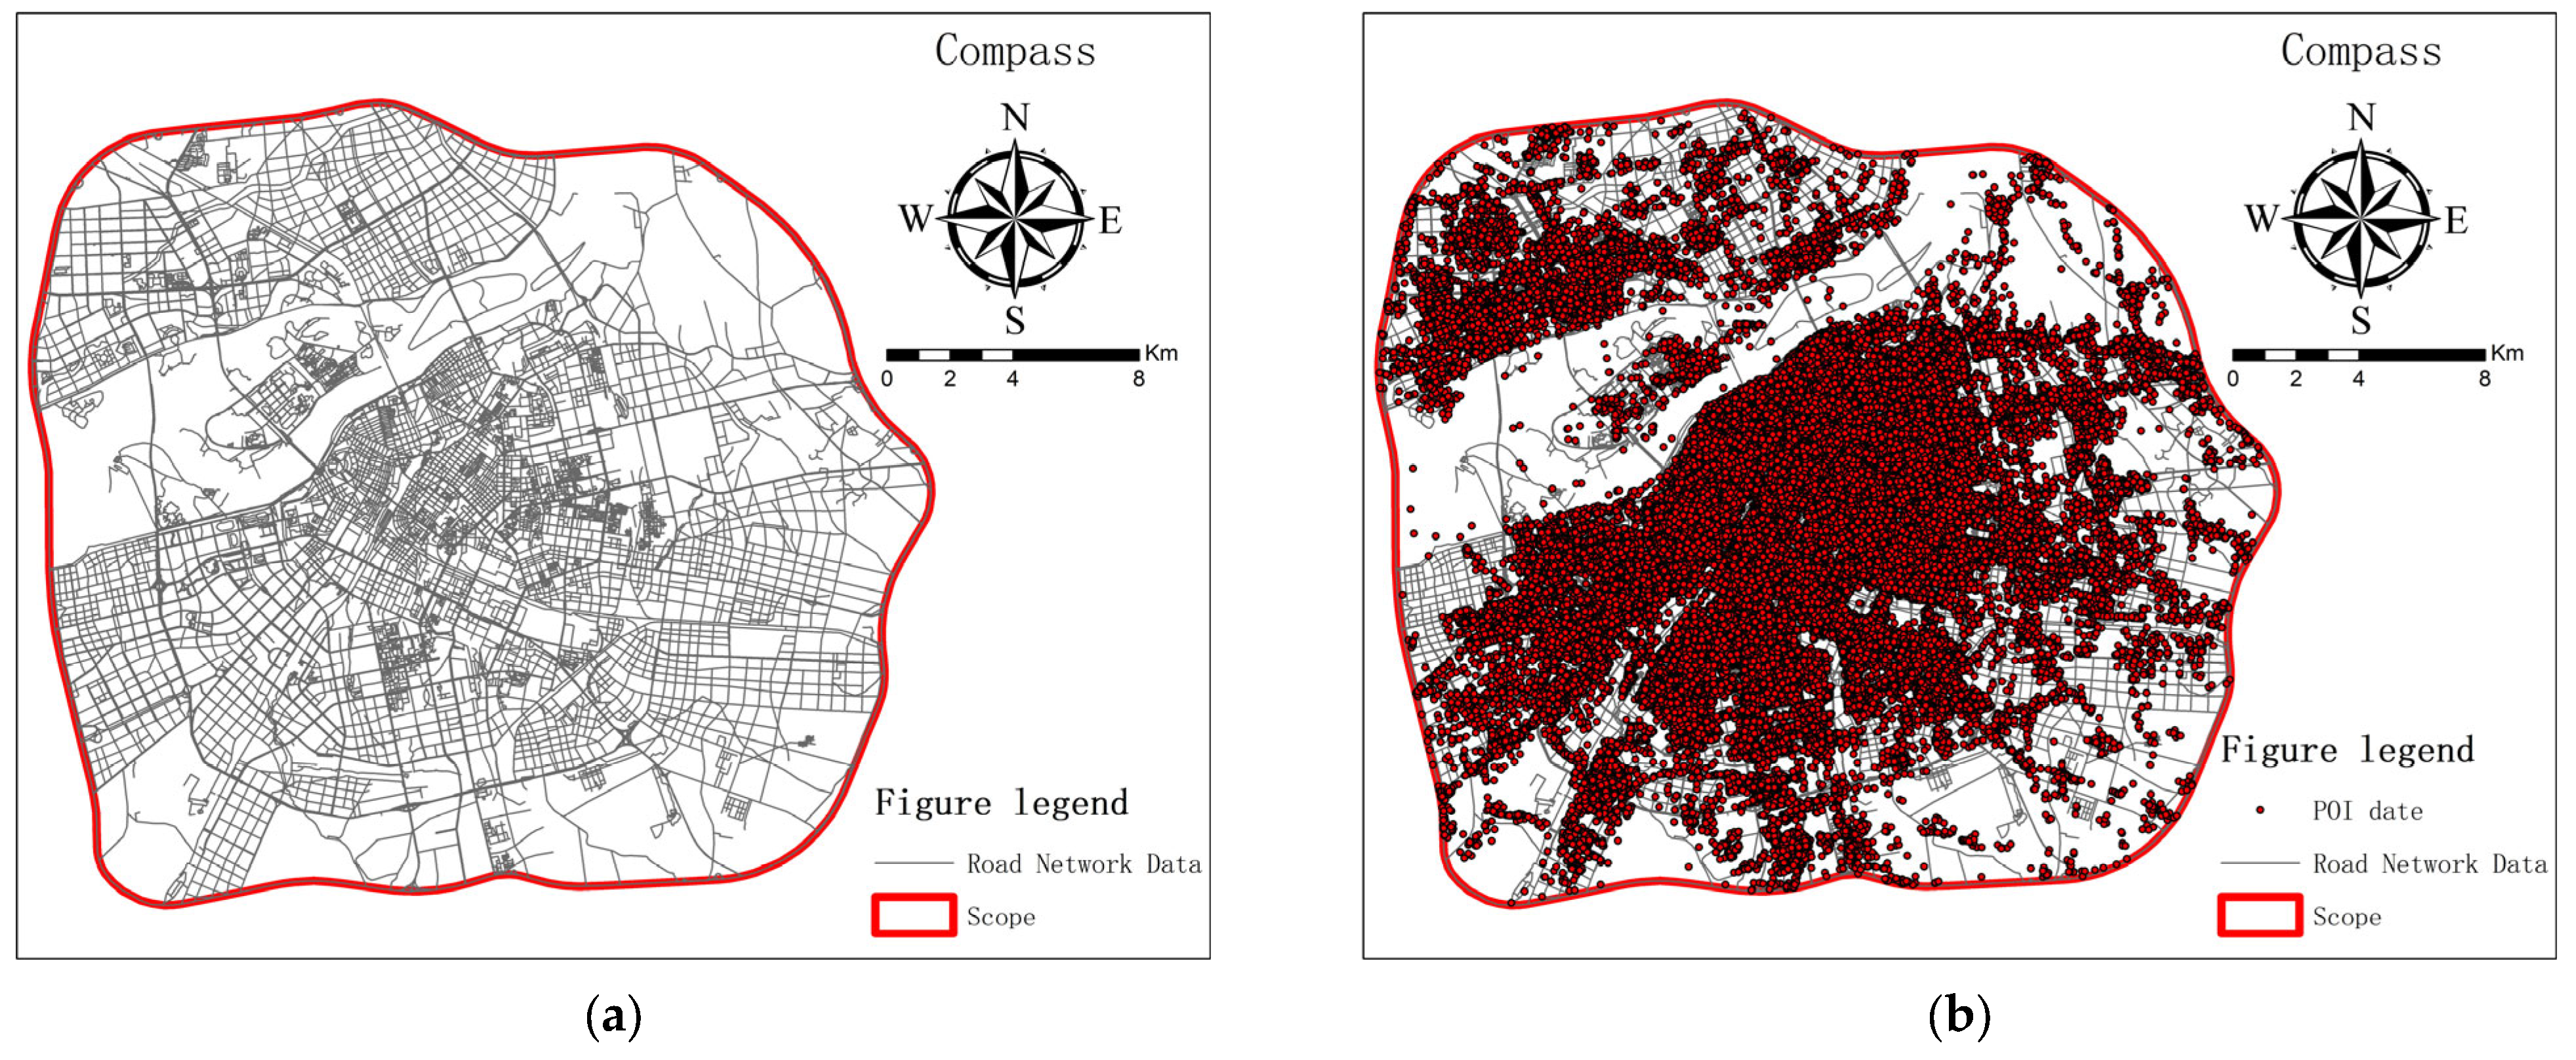
The road network data are one of the important data used in this article (Figure 2). The road network data used to establish the Spatial Design Network Analysis (SDNA) model were obtained in June 2022, and the data source is from Open Street Map (OSM). The identification of clustering vulnerabilities in the road network data that we studied is actually about studying human walking scales in space [16]. Therefore, the spatial syntax model drawing needs to add some roads that people can reach on the basis of the original road network. When drawing, it is necessary to refer to satellite maps and Baidu maps to finally obtain the spatial syntax model.
Point of interest (POI) refers to the abstraction of geographic entities, especially human-related facilities such as residences, schools, etc., into a single point, with its relevant information such as name, category, coordinates, and classification saved within it. The point of interest (POI) data were obtained by using Python programming language to call the Amap API open interface, and a total of 423,525 POI data were obtained from Amap. After extracting and cleaning the data within the study area, 222,266 POI data were obtained (Figure 2). The data were obtained in February 2022, referring to the “Classification of Urban Land Use and Standards for Planning and Construction Land Use” and the reclassification of points of interest in the context of Long Ying’s study on the use of points of interest to identify functional areas in Beijing [17,18]. After sorting, they were divided into six major functional categories: 6.22% for industrial functions, 16.03% for public service facilities, 11.82% for road and traffic facilities, 8.54% for residential areas, 0.41% for green areas and squares, and 56.98% for commercial areas. The number and proportion of POI data for each type were obtained after summarizing (Table 1).

2.2.2. Heat Map Data and Building Profile Data

The Baidu Map Heat Map is a visual data map based on mobile phone users. Through the location information of users visiting Baidu products, the number of population activities is counted. After density analysis, the spatial distribution of the population is reflected in different colors and brightness (Figure 3) [19]. In this study, we utilized the Baidu Maps developer API platform interface to retrieve heat map data for the primary urban area of Harbin City on 17 April and 20 April 2022, representing weekdays and weekends, respectively. The data were collected starting at 8 am each day and were crawled every two hours until 10 pm, resulting in a total of 16 heat maps. When processing the data, we first loaded Band 4 (the fourth band) of the image data into the system. Next, we used the reclassification function to categorize the heat values into seven levels, utilizing the natural break method for classification. Specifically, heat values 1 to 3 were classified as low heat zones, 4 to 5 as medium heat zones, and 6 to 7 as high heat zones. The higher the heat value was, the stronger the population aggregation in that area was. After reclassification, the data were converted from raster to vector format, and the coordinates were projected onto the UTM coordinate system for heat value quantification and calculation. Finally, a heat map was generated to visually illustrate the distribution of population aggregation in the primary urban area of Harbin City.
The building vector data obtained in this study come from Baidu Map (Figure 3). The vector data of building outlines are a type of data that can be used to observe the spatial distribution of urban buildings. By analyzing the building outline data, the distribution of buildings between different areas can be initially understood, thereby better understanding the possibility of the spread of the epidemic [20]. In addition, based on the building outline data, other elements and data in the city can be combined to comprehensively explore the relationship between influencing factors and aggregated spaces and then evaluate the degree of risk of hazards generated in a space. In other words, building outline data has potential application value in epidemic identification and can provide important reference and guidance for urban managers and decision-makers, helping them to better formulate strategies and measures to deal with the epidemic [21].

2.2.3. Create Spatial Analysis Units

This study uses ArcGIS 10.0 software to create a fishnet grid to partition space, which can be refined and adjusted through geographic information systems (GIS). A “fishnet” is a regular rectangular grid composed of horizontal and vertical lines, typically used to divide an area into equally sized cells. These cells can be used for statistical analysis and to quantitatively link the data involved in this study to the fishnet. Considering the scope of Harbin and the goal of fine identification in this paper, a fishnet size of 500 m by 500 m was ultimately chosen as the minimum spatial unit for identifying epidemic hazards. After cropping the study area, 2486 squares remained. This method can provide strong support for epidemic identification, monitoring, and prevention and control and has broad application prospects and important social value [22].

2.3. Research Methodology

2.3.1. Nuclear Density Analysis

This passage describes a research method that utilizes point of interest (POI) data in Harbin city as a basis for analysis. The method employs kernel density analysis in ArcGIS 10.2 to identify the density distribution of POIs throughout the city [23]. Areas with high POI density have a strong ability to attract pedestrian traffic, a large population density, and frequent interactions, making them more prone to epidemic risks [24]. On the contrary, areas with low POI density have relatively weaker attraction to pedestrian traffic, a smaller population density, and thus a lower probability of forming epidemic risks. Therefore, it is possible to identify the spatial distribution of epidemic risks in neighborhoods by analyzing the density of POIs. The formula for calculating kernel density is also provided. The nuclear density is calculated as follows:
f s = i = 1 n 1 r 2 k ( d i s r )
In this formula, f(s)0 refers to the mathematical kernel density function at point s. r represents the path distance attenuation value; n represents the number of facility points within a distance of r or less from point s; d i s refers to the shortest distance from point i to point s; and k represents the weight function.

2.3.2. Hot Spot Analysis

This article uses Getis-Ord G i * statistics in ArcGIS 10.2 to identify hotspots and cold spots of significant statistical risk clustering in street space [25]. When conducting hotspot analysis, P values and Z scores should be considered together. The higher the Z value is, the stronger the hotspot clustering is, while the lower the Z value is, the stronger the cold spot clustering is. The P value refers to the probability of random distribution of data, and when the P value is very small or even 0, the probability is very low. In addition, to be a hotspot with significant statistical significance, the element itself should have a high value and be surrounded by other elements with high values [26]. If the G i * score is positive and relatively high, it indicates that the space shows high-value clustering units, while the opposite indicates low-value clustering units. When observing the G i * value, it is necessary to consider the p-value to determine whether the analysis result is significant. When p < 0.05, G i * is considered to be significant. The z-score reflects the strength of clustering of the G i * value. The specific formula for hot spot analysis is as follows:
G i * = j w i j x ¯ j w i j j x j 2 n n j w i j 2 j w i j 2 n 1
In this formula, W i j represents the spatial weight between street features i and j within the study area, and n is the total number of features; x j is the attribute value of space unit j.

2.3.3. Space Network SDNA Analysis

SDNA is a program that can be embedded in the GIS software platform for use. The parameter mainly used in this study is the proximity (NQPDA) index in SDNA [27]. Proximity, also known as integration in spatial syntax, refers to the convenience of reaching other roads within the search radius from a certain road segment, playing a direct connecting role. It represents accessibility and has a certain attraction to urban populations [28]. Therefore, Proximity is also an important parameter in generating the space for potential aggregation of hazards. Its calculation formula is as follows:
N Q P D A x = y R x W y P y d x , y
In this equation, NQPDA(x) stands for proximity index; R represents the search radius; x and y refer to two line segments; and d(x,y) is the shortest path between x and y. W(y) represents the weight of y, and P(y) represents the proportion of y within the range of R. In discrete space analysis, it is always either 0 or 1, while in continuous space, 0 ≤ P(y) ≤ 1.
In spatial syntax, betweenness centrality is referred to as choice degree, which measures the potential for traffic flow to pass through a certain road segment within a certain search radius. It measures the frequency at which a road in the street network is selected for traversal, playing a role in intermediate connectivity and explaining both transversality and concatenation [29]. The SDNA algorithm for betweenness centrality is essentially the same as traditional syntactic operations, except that it takes into account the centrality value of the road segment itself and includes the line segment itself in the calculation between the start and end points. Its calculation formula is as follows:
T P B t x = y N Z R y O D y , z , x W y P y t o t a l   w e i g h t y
In this metric, OD(y,z,x) represents the shortest path between line segment x, line segment y, and line segment z, and this path is within a search radius of R. W(z) represents the weight of z, and P(z) is the proportion of z within the radius R. Total weight(y) refers to the total weight of all paths starting from y within the radius R.

2.3.4. Entropy Method

The entropy weighting method can be used to explain the degree of difference within data indicators. The greater the difference between data indicators is, the more prominent the internal data dispersion and the greater the impact on the weighted comprehensive evaluation results are and vice versa [30]. Therefore, in this paper, the entropy weighting method is used to assign weights to the evaluation indicators. Since the data are not unified in dimension, it is necessary to normalize the indicators using the method of maximum and minimum value normalization. The formula is
X n e w = X X m i n / X m a x X m i n
In the formula, X represents the original data, and X n e w represents the normalised metrics of the original data; X m a x represents the maximum value in the data; Xmin represents the minimum value in the data [31]. Then, a rating matrix is established, and the weight f i j and entropy value H j of the indicators are calculated using the rating matrix. The formula is
f i j = x i j i = 1 m x i j H j = k i = 1 m f i j ln f i j
The value of k in the formula is related to the number of research samples; m is the sample size, where k is the equilibrium parameter, k = 1/lnm. After determining the entropy value, the entropy weights of each indicator can be calculated. The formula is
W j = 1 H j i 1 n 1 H j
In the formula, 1 H j represents the coefficient of variation of the epidemic impact indicators, and W j represents the weight of the indicators.

2.4. Functional Mix

Functionality mix refers to the degree of spatial mixing of various functions in the city—that is, the distribution of different types of functional facilities in the city. The high or low level of functionality mix depends on the quantity and types of functional facilities in the city and can reflect the diversity and complexity of the city. Cities with high functionality mix usually have higher social and economic vitality and attractiveness because they provide more services and conveniences and can also promote communication and interaction in the city. Therefore, the quantitative research and analysis of functionality mix are of great significance for urban planning and management. The functional mix degree discussed in this article is quantified using the index of information entropy. Information entropy is originally a concept in the field of physics, which is applied to the city to quantify and interpret the functional complexity and balance of functional distribution to a certain extent. The high or low value of information entropy represents the high or low degree of functional mix. In this article, the quantification of information entropy is carried out using the POI data of different functional types in Harbin. The higher the value is, the more functional types there are in the city block and the smaller the differences in POI quantity between different functional types are, indicating a more balanced distribution of functional facilities. When the POI quantity of each function is the same, the information entropy reaches its peak, indicating that the functional types in the block are relatively complete. The specific formula for functional mix degree is as follows:
H = i N P i × ln P i
In the formula, H refers to the functional mix information entropy value; N is the total number of samples obtained; and P i refers to the ratio of functional POIs of category i to the number of POIs of all categories in the block cell. The larger the value of H is, the higher the functional mix in the block study cell is.

2.5. Functional Density

Functional density refers to the ratio of the number of certain functional facilities in a given area to the area of that area, i.e., the number of functional facilities per unit area. The level of functional density reflects the degree of supply and distribution of certain functional facilities in the area and can provide a reference basis for urban planning and management. The formula for functional density is
p = n s
where p represents functional density; n represents the number of functional facilities; and s represents the area of the region.

2.6. Research Framework

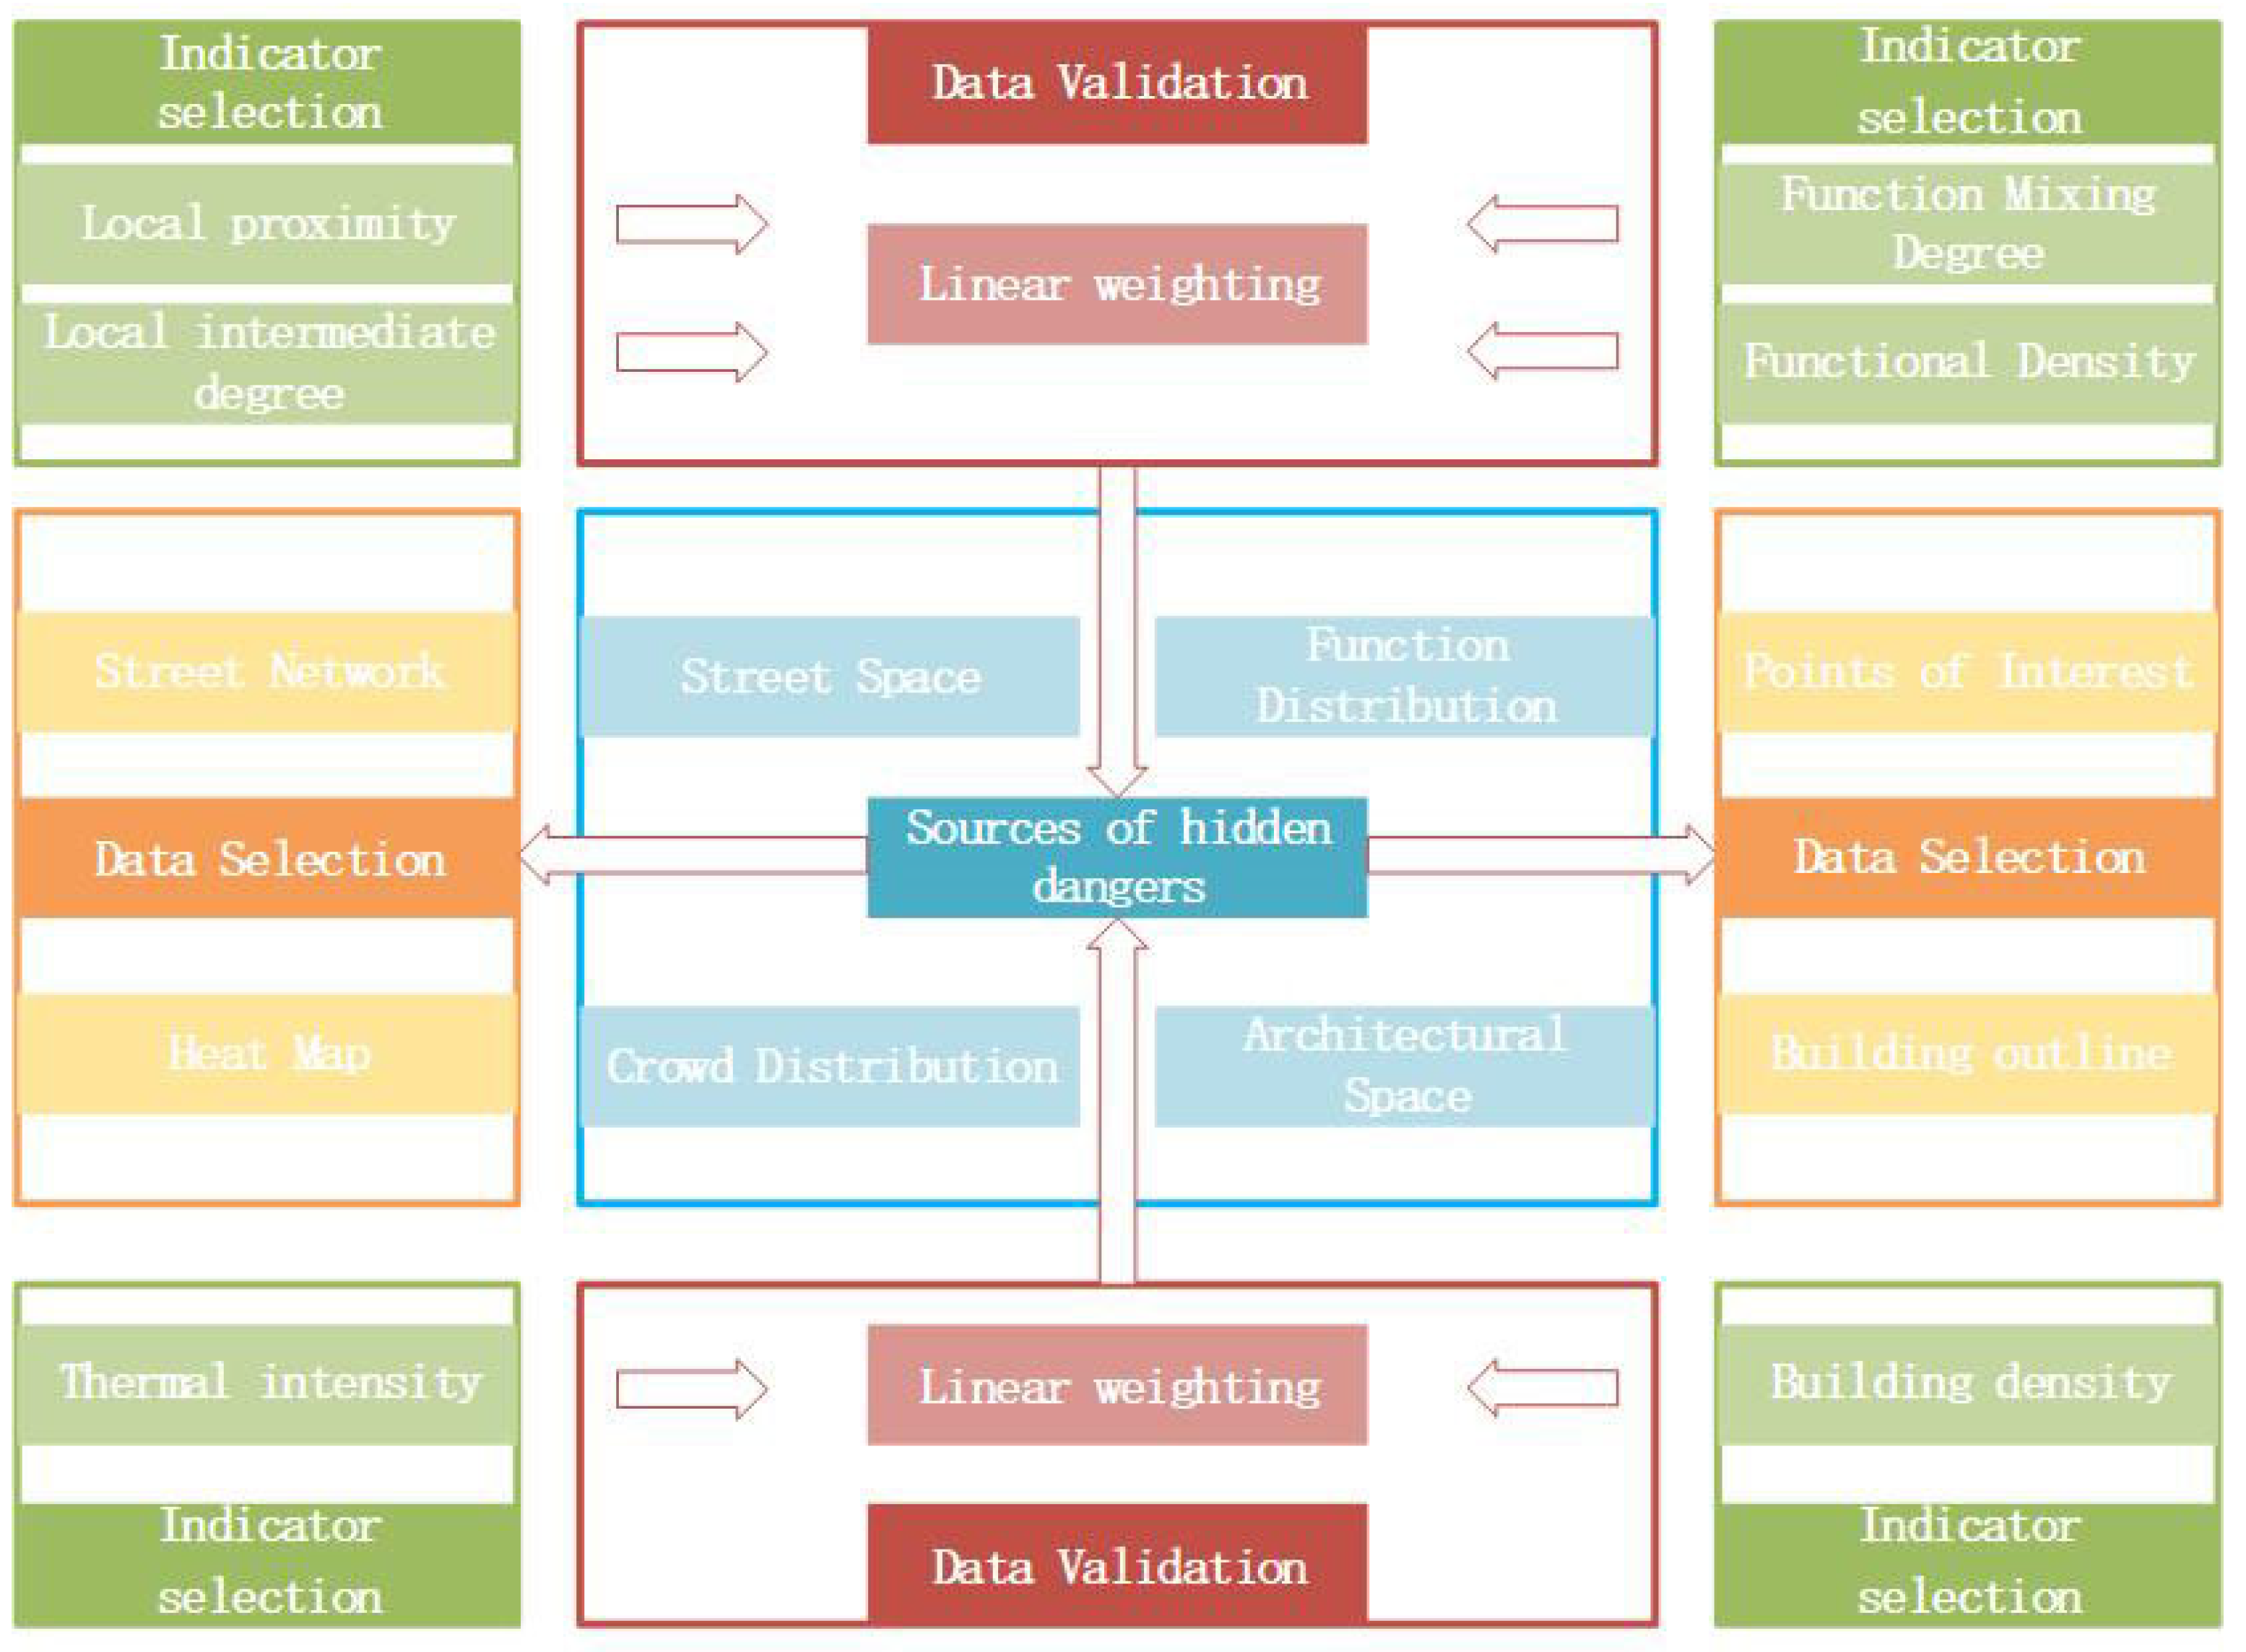
The research process of this article is divided into four parts. The first part aims to identify the sources of potential hazards and classify them accordingly. In the second part, data selection takes place, where the corresponding data indicators are selected based on the identified potential hazards. The third part involves indicator selection, where the indicators are further determined based on the data source and quantitatively analyzed from multiple perspectives. The fourth part, data validation, quantifies the preliminary analysis data obtained from the third step. The impact of different factors on the final results is determined using the entropy weight method. The indicators are weighted, and the target block risk level is calculated using a comprehensive weighting method. Finally, the geographic location identification results and consistency test of epidemic occurrence examples are utilized to validate the data. The research framework diagram is shown in Figure 4.

3. Analysis of the Results

3.1. Quantification of Road Network Data Indicators

This article introduces the use of spatial syntax models for SDNA analysis in ArcGIS to evaluate the accessibility and traffic potential of road networks [32]. Given the large study area and the need for multiple experiments, a search radius of 1000 m was ultimately selected. This distance was chosen because it better reflects people’s daily mobility range within the range of human walking distance, which is typically considered to be within 15 min of walking distance. Additionally, 1000 m is a commonly used threshold for studying urban accessibility and community health [33]. In addition, when selecting the search radius, the size of the study area and the complexity of the road network should also be considered to ensure reliable and accurate results. This method can quantitatively evaluate the importance of road networks at different scales and provide a quantitative basis for identifying the risk of disease transmission due to contact between people.
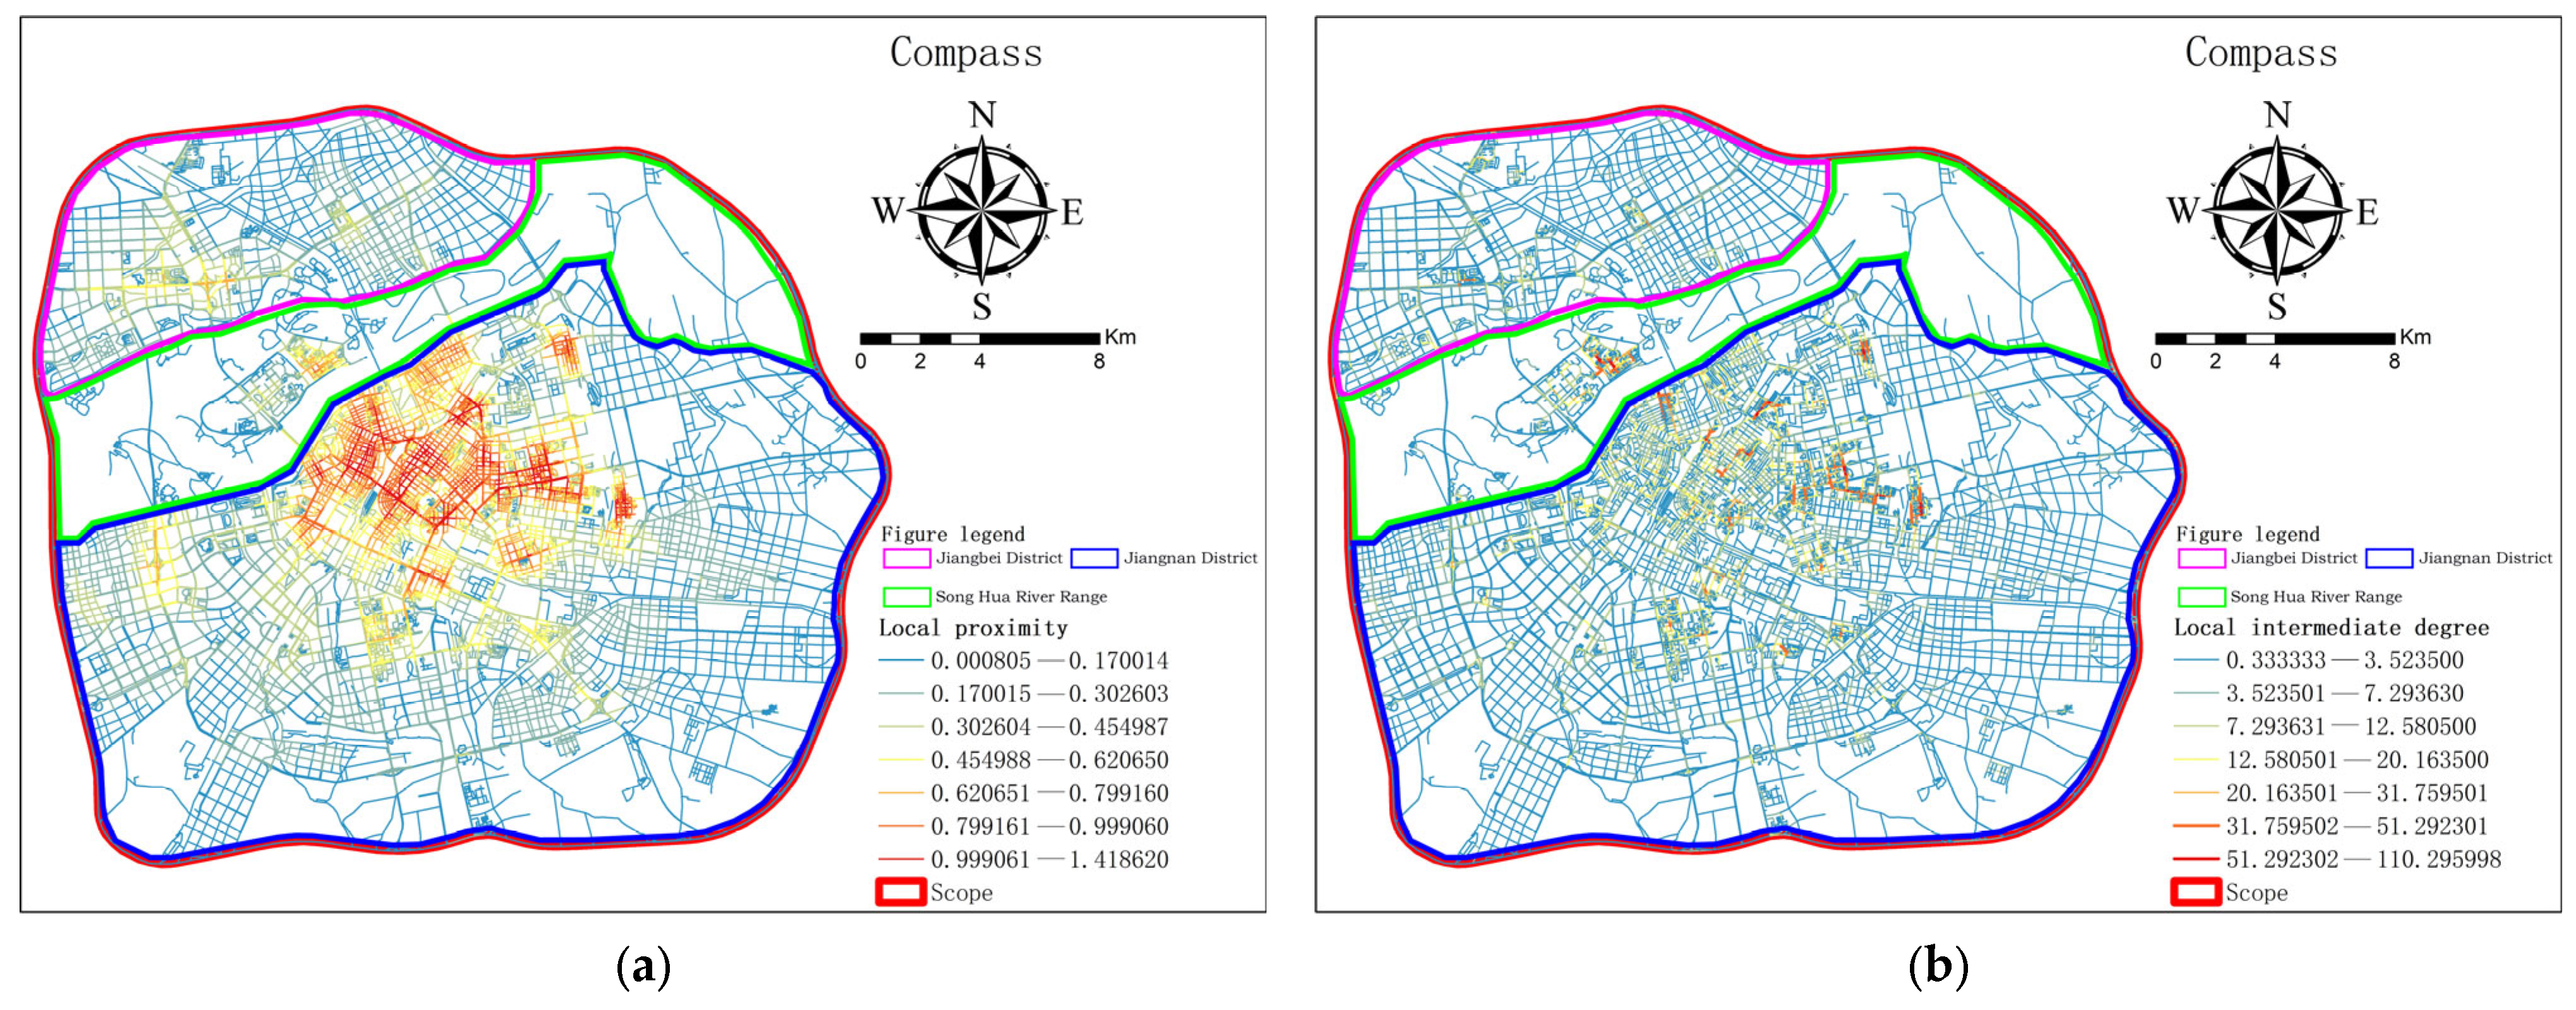
According to the accessibility analysis of the road network shown in Figure 5, it can be observed that the lowest color interval of the road network has risen to the highest color interval, indicating that the traffic network in the red area is more convenient, and people’s travel efficiency is higher. With the Songhua River as the boundary, the accessibility in the southern region is significantly higher than that in the northern region, indicating that the accessibility in the southern area is higher at the walking scale, making it easier for population agglomeration to occur and forming clustering spatial risks for disease transmission [34]. Looking at the distribution structure of the study area layers defined in this paper, the high accessibility areas are mainly distributed within the inner and second ring roads, with a decreasing trend towards the outer layers. In other words, the traffic network in the city center is more convenient, and people’s travel time is shorter, making it easier to form spatial clustering of population. Accessibility analysis is of great significance for the analysis of epidemic clustering [35]. By analyzing the accessibility within a region, we can better understand the flow of population and the possible paths of epidemic transmission. Based on the results of Figure 6, we can see that high accessibility areas are mainly distributed in the city center, where population agglomeration and clustering of spatial risks for epidemic transmission are more likely to occur. Therefore, in epidemic prevention and control, it is necessary to focus on the traffic conditions and population flow in the city center and take effective control measures to reduce the risk of population agglomeration and epidemic transmission. At the same time, it is also necessary to pay attention to the rational distribution of epidemic prevention and control resources, avoid excessive concentration of resources in the city center, and ensure that the epidemic prevention and control capabilities in the peripheral areas are not inadequate.
According to the analysis of traffic potential based on local betweenness centrality index in Figure 5, a clear spatial distribution pattern of traffic potential in high-risk areas of the epidemic is shown. Specifically, the traffic potential in the Jiangnan area is stronger than that in the Jiangbei area, indicating that the transportation network in this area is more developed, and the flow of people is denser. Moreover, the spatial distribution of the road network in the Jiangnan area shows a decreasing trend from the center to the periphery, indicating that the central area of this region is more likely to cause the gathering of people and thus increase the risk of epidemic transmission. Therefore, in identifying and monitoring the epidemic, high-risk areas in the Jiangnan area should be given priority, and necessary prevention and control measures should be taken. Although the traffic potential in the Jiangnan area is higher, the effect shown in the image is not obvious, which may be because the image displays the traffic potential of the entire area without analyzing local areas more carefully [36]. In addition, traffic potential analysis is only one aspect of identifying and monitoring the epidemic, and other factors need to be considered comprehensively in order to assess the risk and trend of epidemic transmission more comprehensively and accurately.
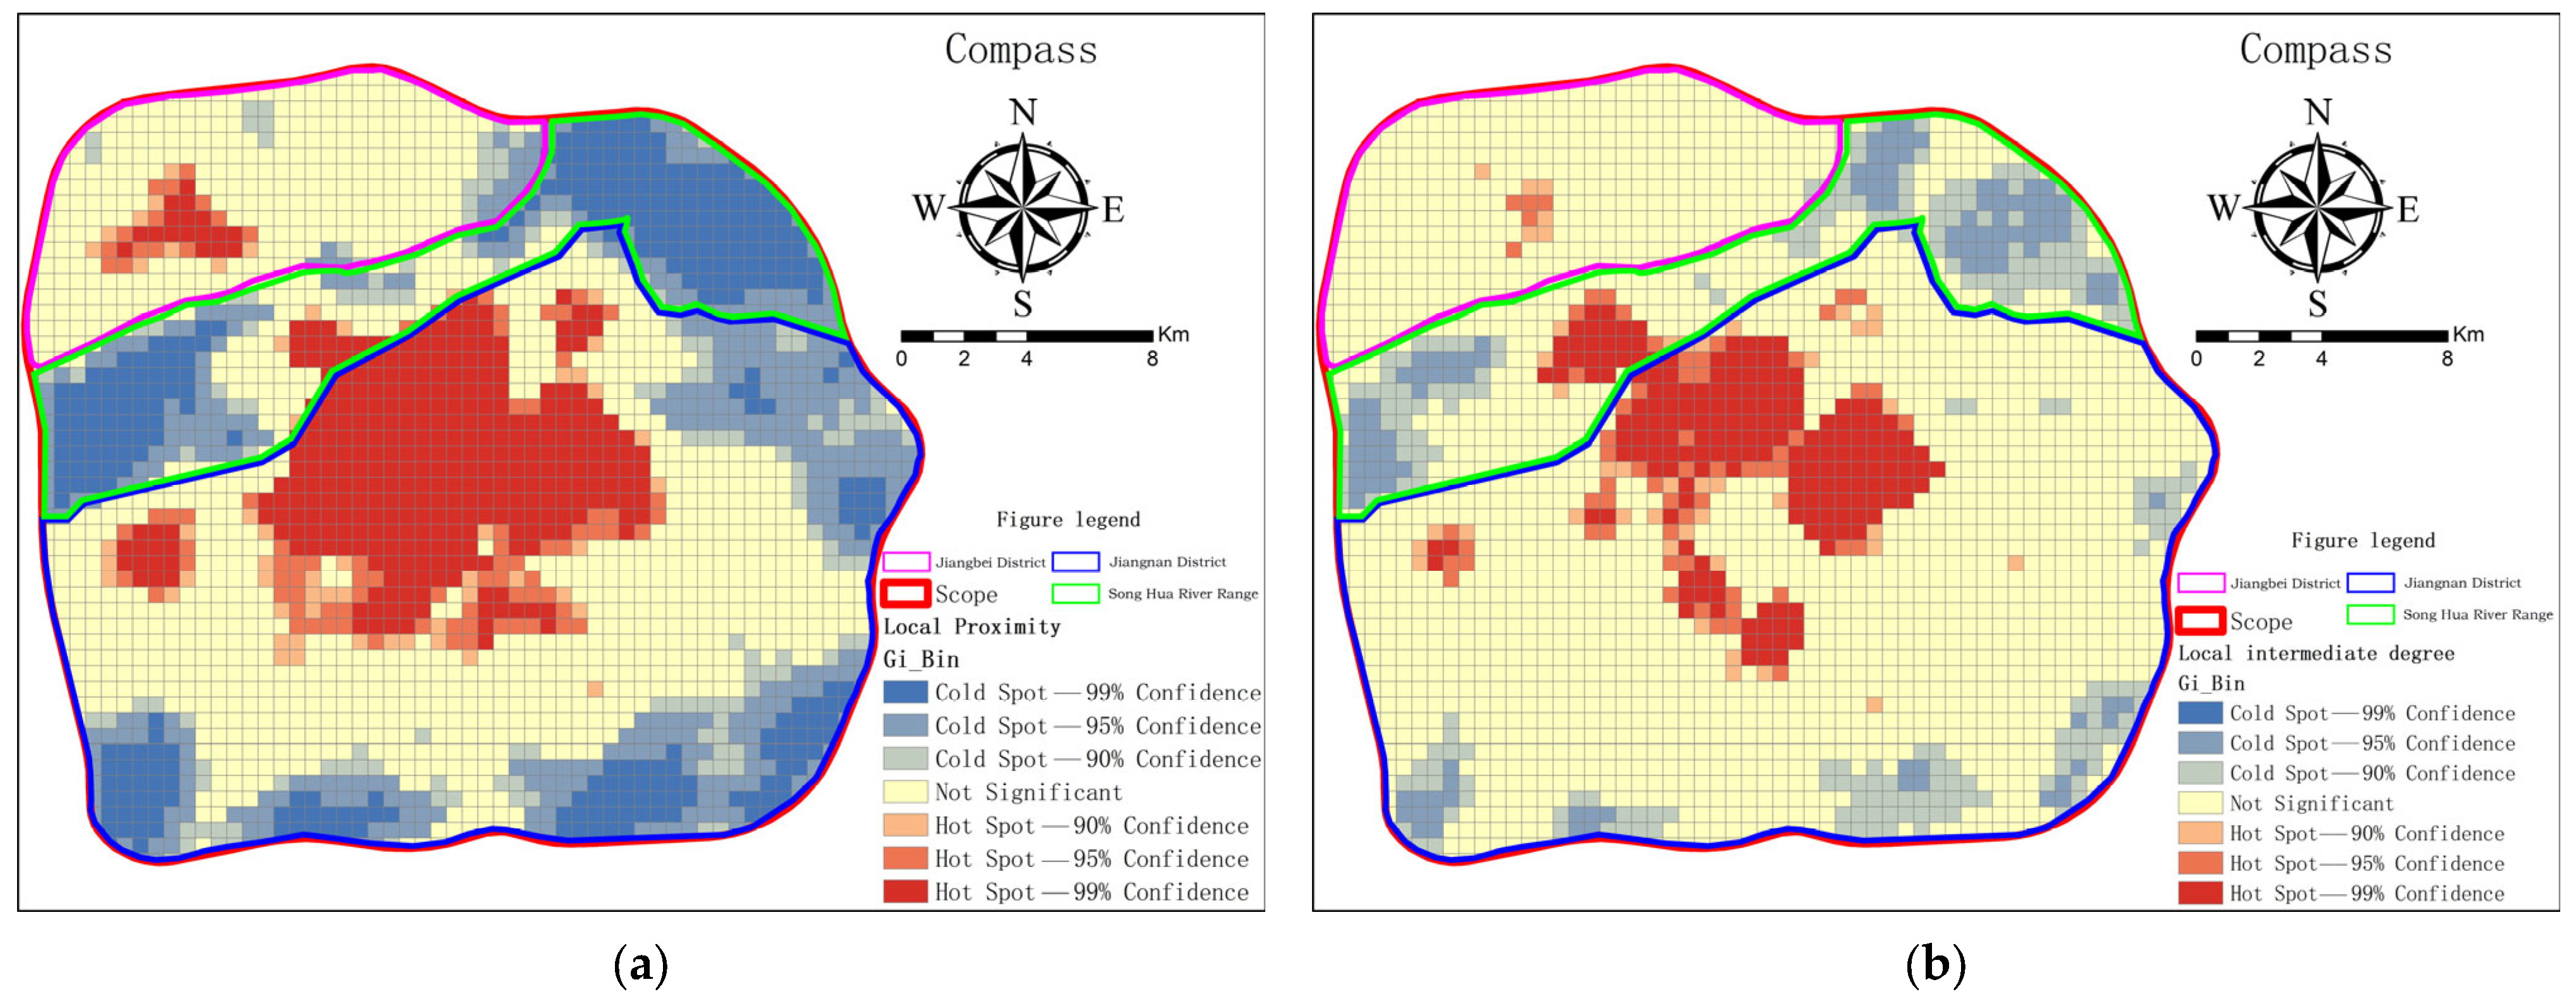
In order to more accurately determine the spatial extent of population aggregation hazards caused by road network accessibility and traffic potential, we connected the data to a 500 × 500 grid and performed further hotspot analysis [37]. By analyzing local closeness and local intermediacy, we set a search radius of 1000 m. From Figure 6, it can be seen that both accessibility and traffic potential form four distinct spatial aggregation areas [38]. Among them, the accessibility aggregation area is mainly distributed in the Jiangnan area, forming a large aggregation area and two small aggregation areas. The large aggregation area is mainly distributed within the inner and second ring roads, while the small aggregation areas are distributed between the third and second ring roads and within the Jiangnan area. The spatial aggregation areas formed by traffic potential exhibit a more obvious clustering pattern than the road network model, with higher values of local intermediacy displayed in the image. However, compared with accessibility, traffic potential is more dispersed. The largest spatial aggregation area is located in the core area, while the three smaller aggregation areas are located between the third and second ring roads, with weaker aggregation. This indicates that accessibility has a stronger attraction to the population than traffic potential and is more likely to create hidden risks for the spread of epidemics and generate risk space for epidemic transmission [39].

3.2. Quantification of Point-of-Interest Data Indicators

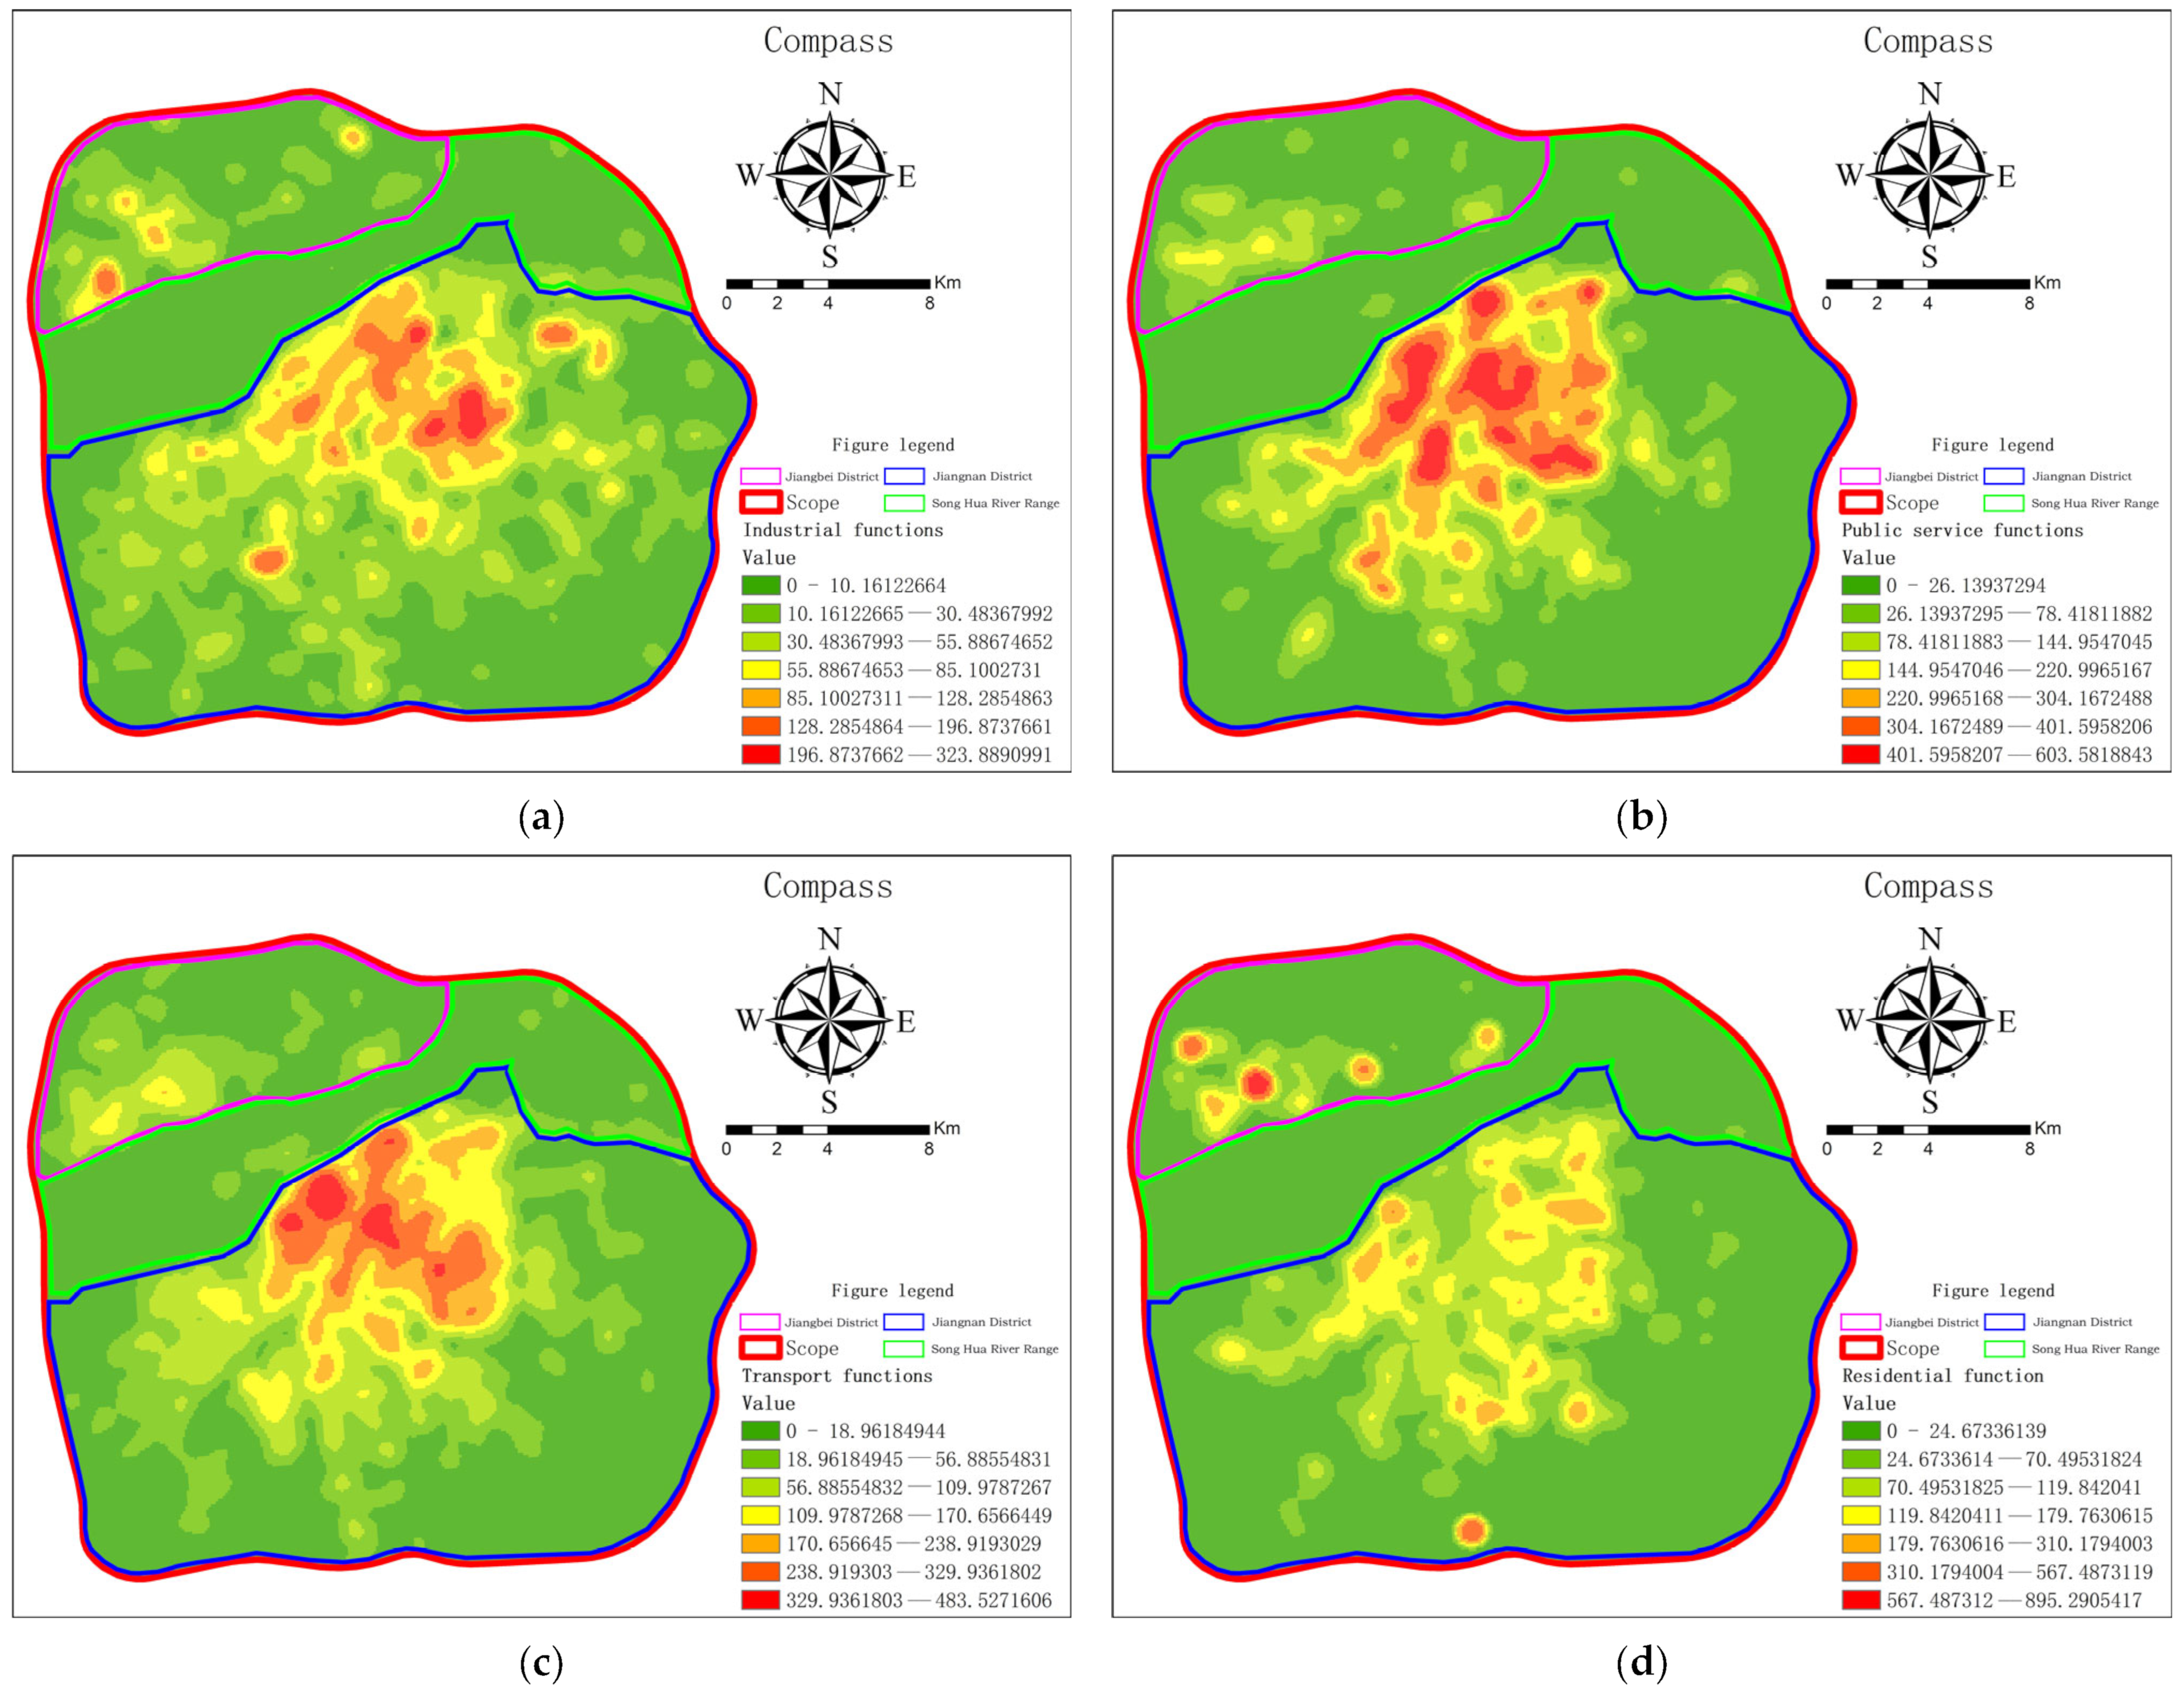
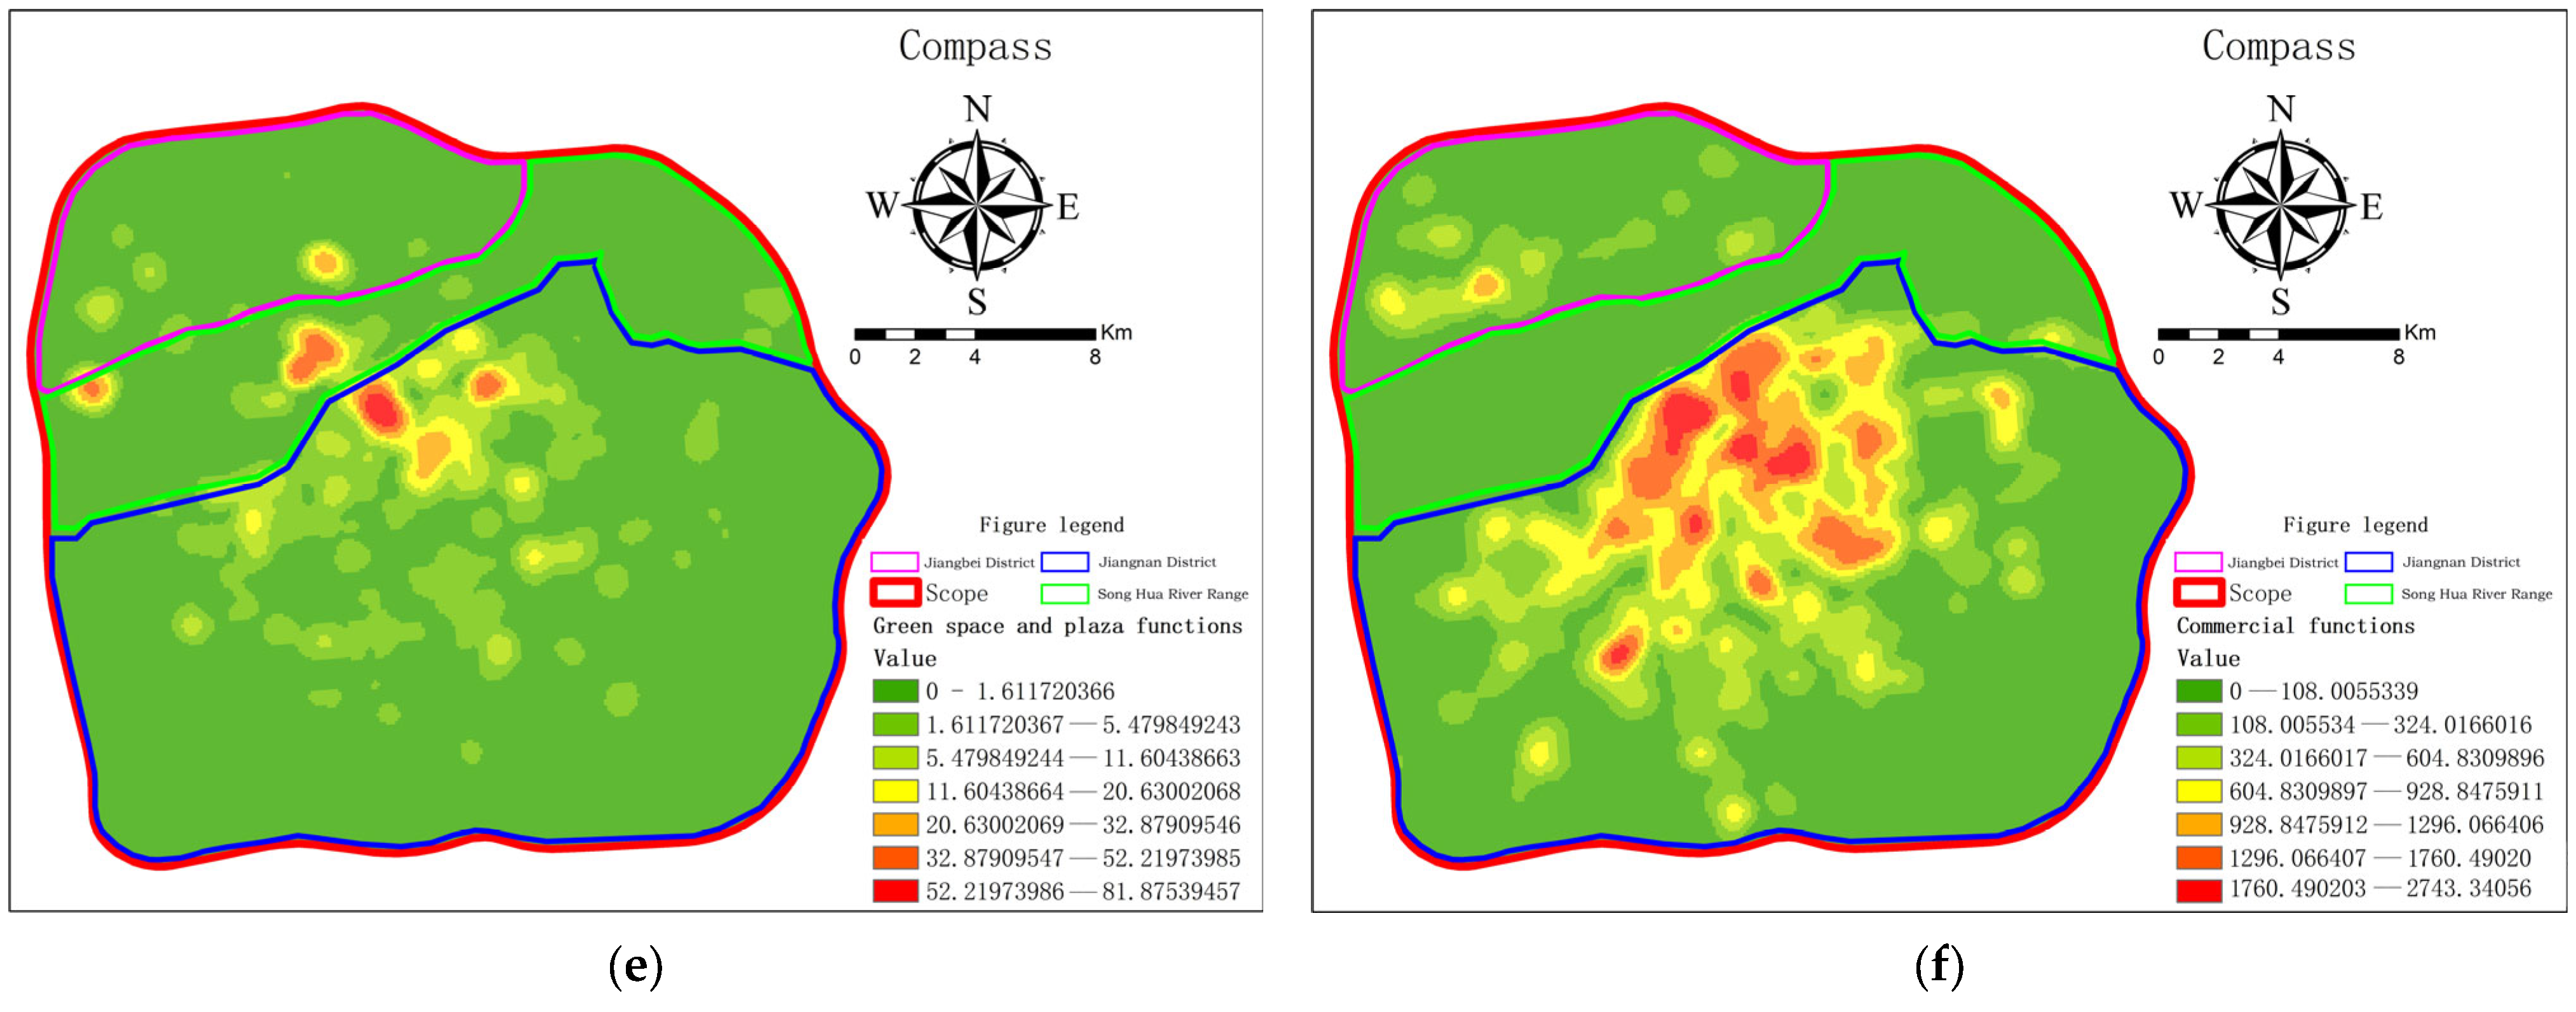
Using point of interest for functional kernel density analysis is a method for analyzing the spatial distribution of functional data. In the context of epidemic analysis, functional kernel density analysis can be used to reflect the potential risk of epidemics by analyzing the data. According to the analysis in Figure 7, the spatial distribution and clustering of industrial, public service, transportation, commercial, residential, and green space and plaza functions can be observed [40]. The analysis shows that the distribution intensity of various functions in the Jiangnan area of Harbin city is more concentrated than in the Jiangbei area, indicating that the hidden dangers in Jiangnan are greater than those in Jiangbei. Public service and commercial functions show the strongest clustering, which from the perspective of epidemic prevention, also meaning that the public service and commercial functions in the Jiangnan area may be more susceptible to becoming high-risk areas for epidemic transmission. In addition, the more dispersed distribution of residential functions means that large gatherings are less likely to be formed spatially by residential functions. At the same time, such a distribution pattern also helps to reduce the gathering and contact of inhabitants of residential spaces, which helps to prevent the spread of epidemics. However, it should be noted that if the residential density in some areas is too high and people gather and interact frequently, these areas may still become high-risk areas for epidemic transmission.
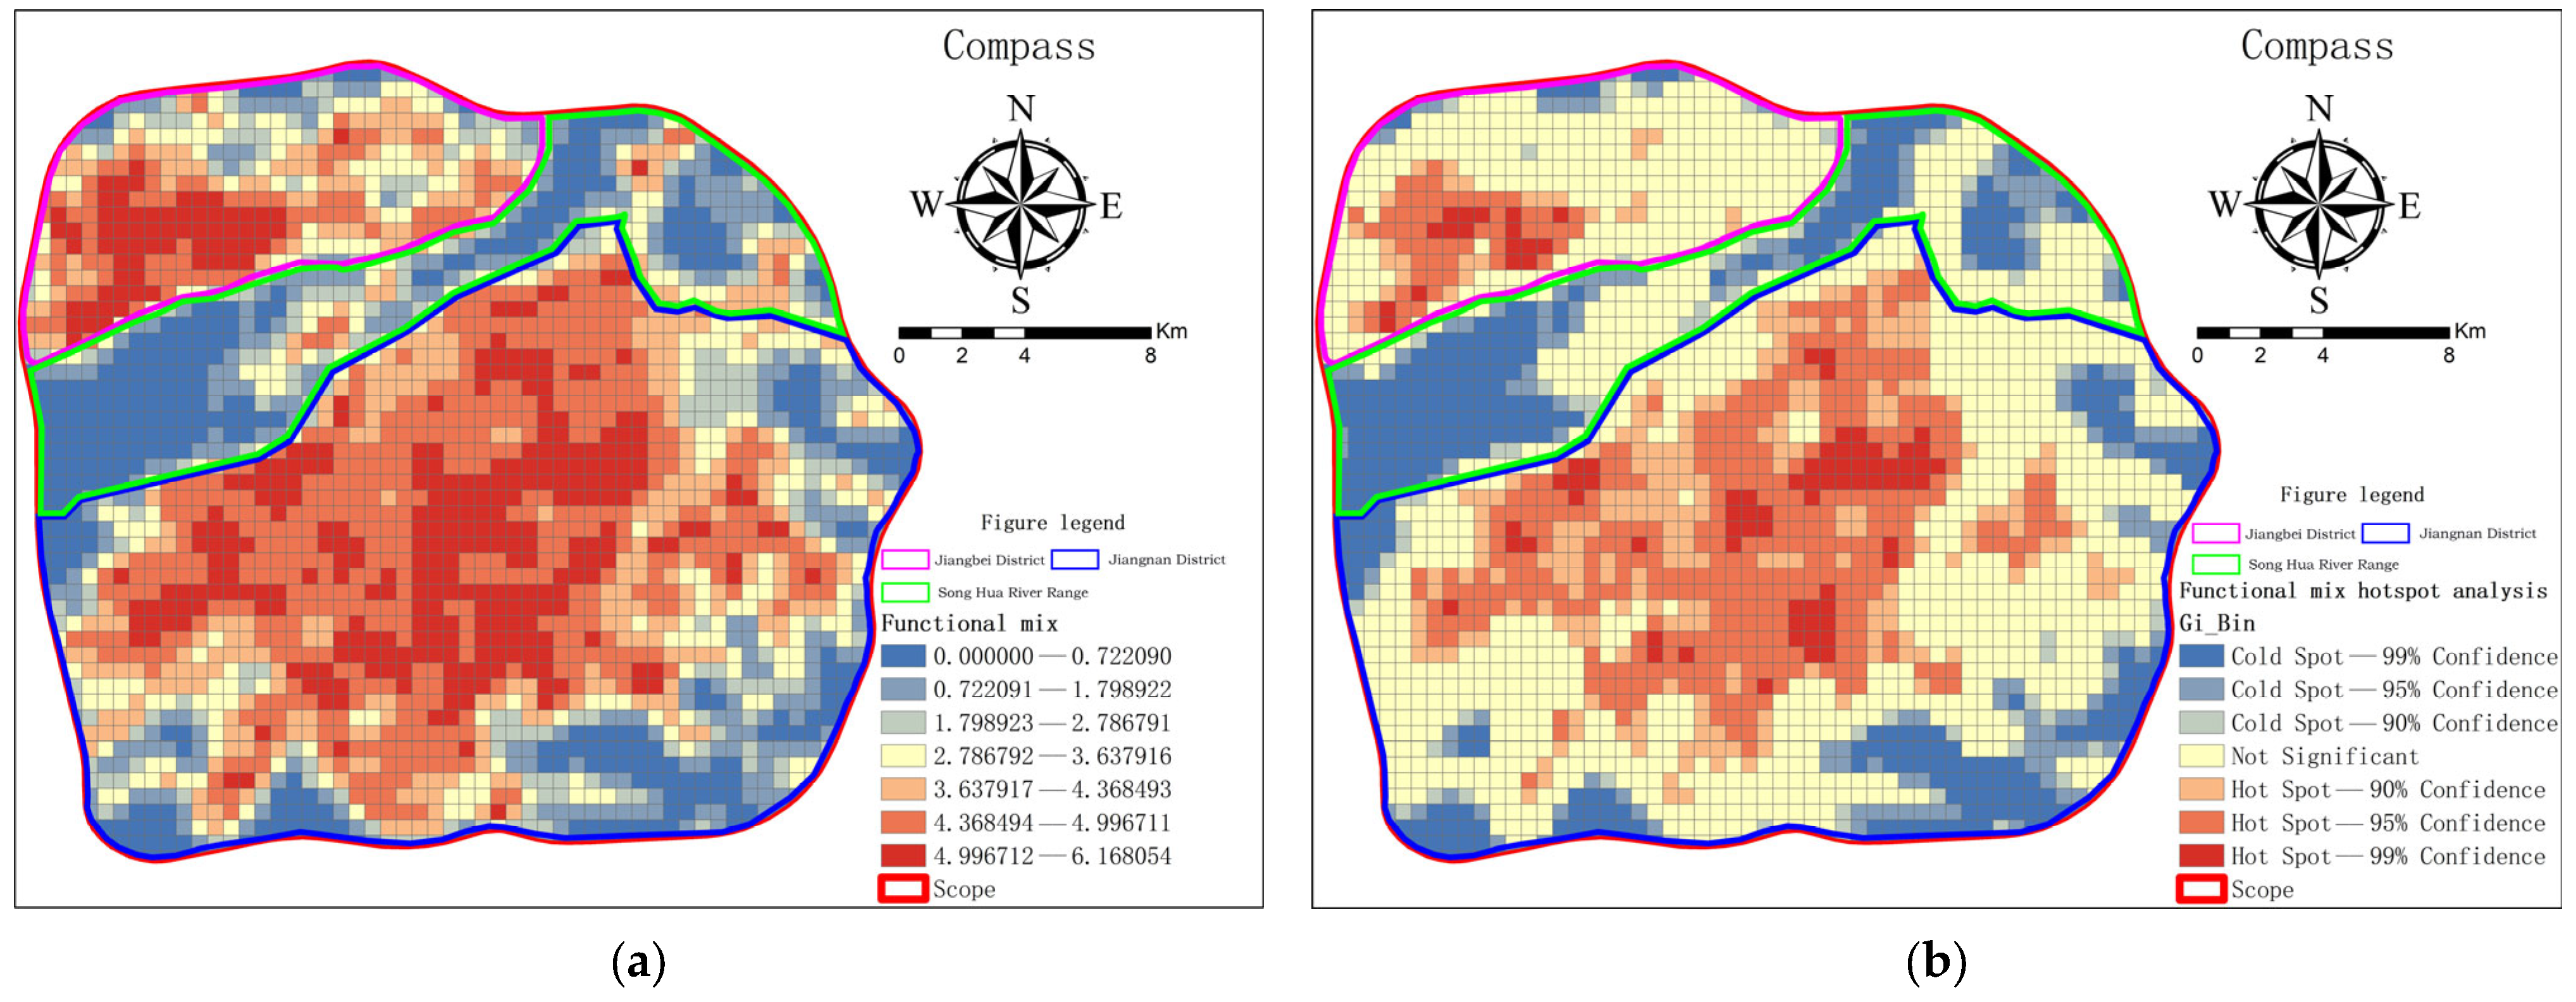
In order to further determine the level of crowd gathering caused by interest points and its impact on spatial risk, as well as to identify the location of these areas, Equations (8) and (9) are used to calculate the functional mix and functional density to investigate the impact on a space when multiple spatial functions act together in a single space. Figure 8 shows the distribution of functional diversity for each grid within the study area. By connecting the interest points with a fishnet and calculating the combination of different functions within each grid, the functional diversity values for each grid were obtained. The high-value areas are relatively scattered, while the low-value areas are more concentrated, indicating that there are multiple functions acting on the space, leading to mixing phenomena in the area. To better understand the spatial clustering of functional diversity, the researchers further conducted hotspot clustering analysis, as shown in Figure 8. The figure displays two clusters with a functional diversity of over 90% on the spatial map, one in the north and one in the south, with the one in the southern region being larger. This suggests that there are varying degrees of functional mixing in the area, and the mixing in the southern region is more pronounced, indicating a higher risk of an epidemic outbreak [41]. The mixing of different functions within the area is related to the risk of an epidemic outbreak. In high-value areas, where there is a mixture of multiple functions, there is a higher risk of the disease spreading due to frequent population mobility. Therefore, appropriate measures should be taken to reduce the risk of an outbreak in these areas, such as strengthening monitoring and prevention measures and reducing population mobility. Additionally, city planning and management should be optimized to reduce unnecessary functional mixing and lower the overall risk of an epidemic outbreak.
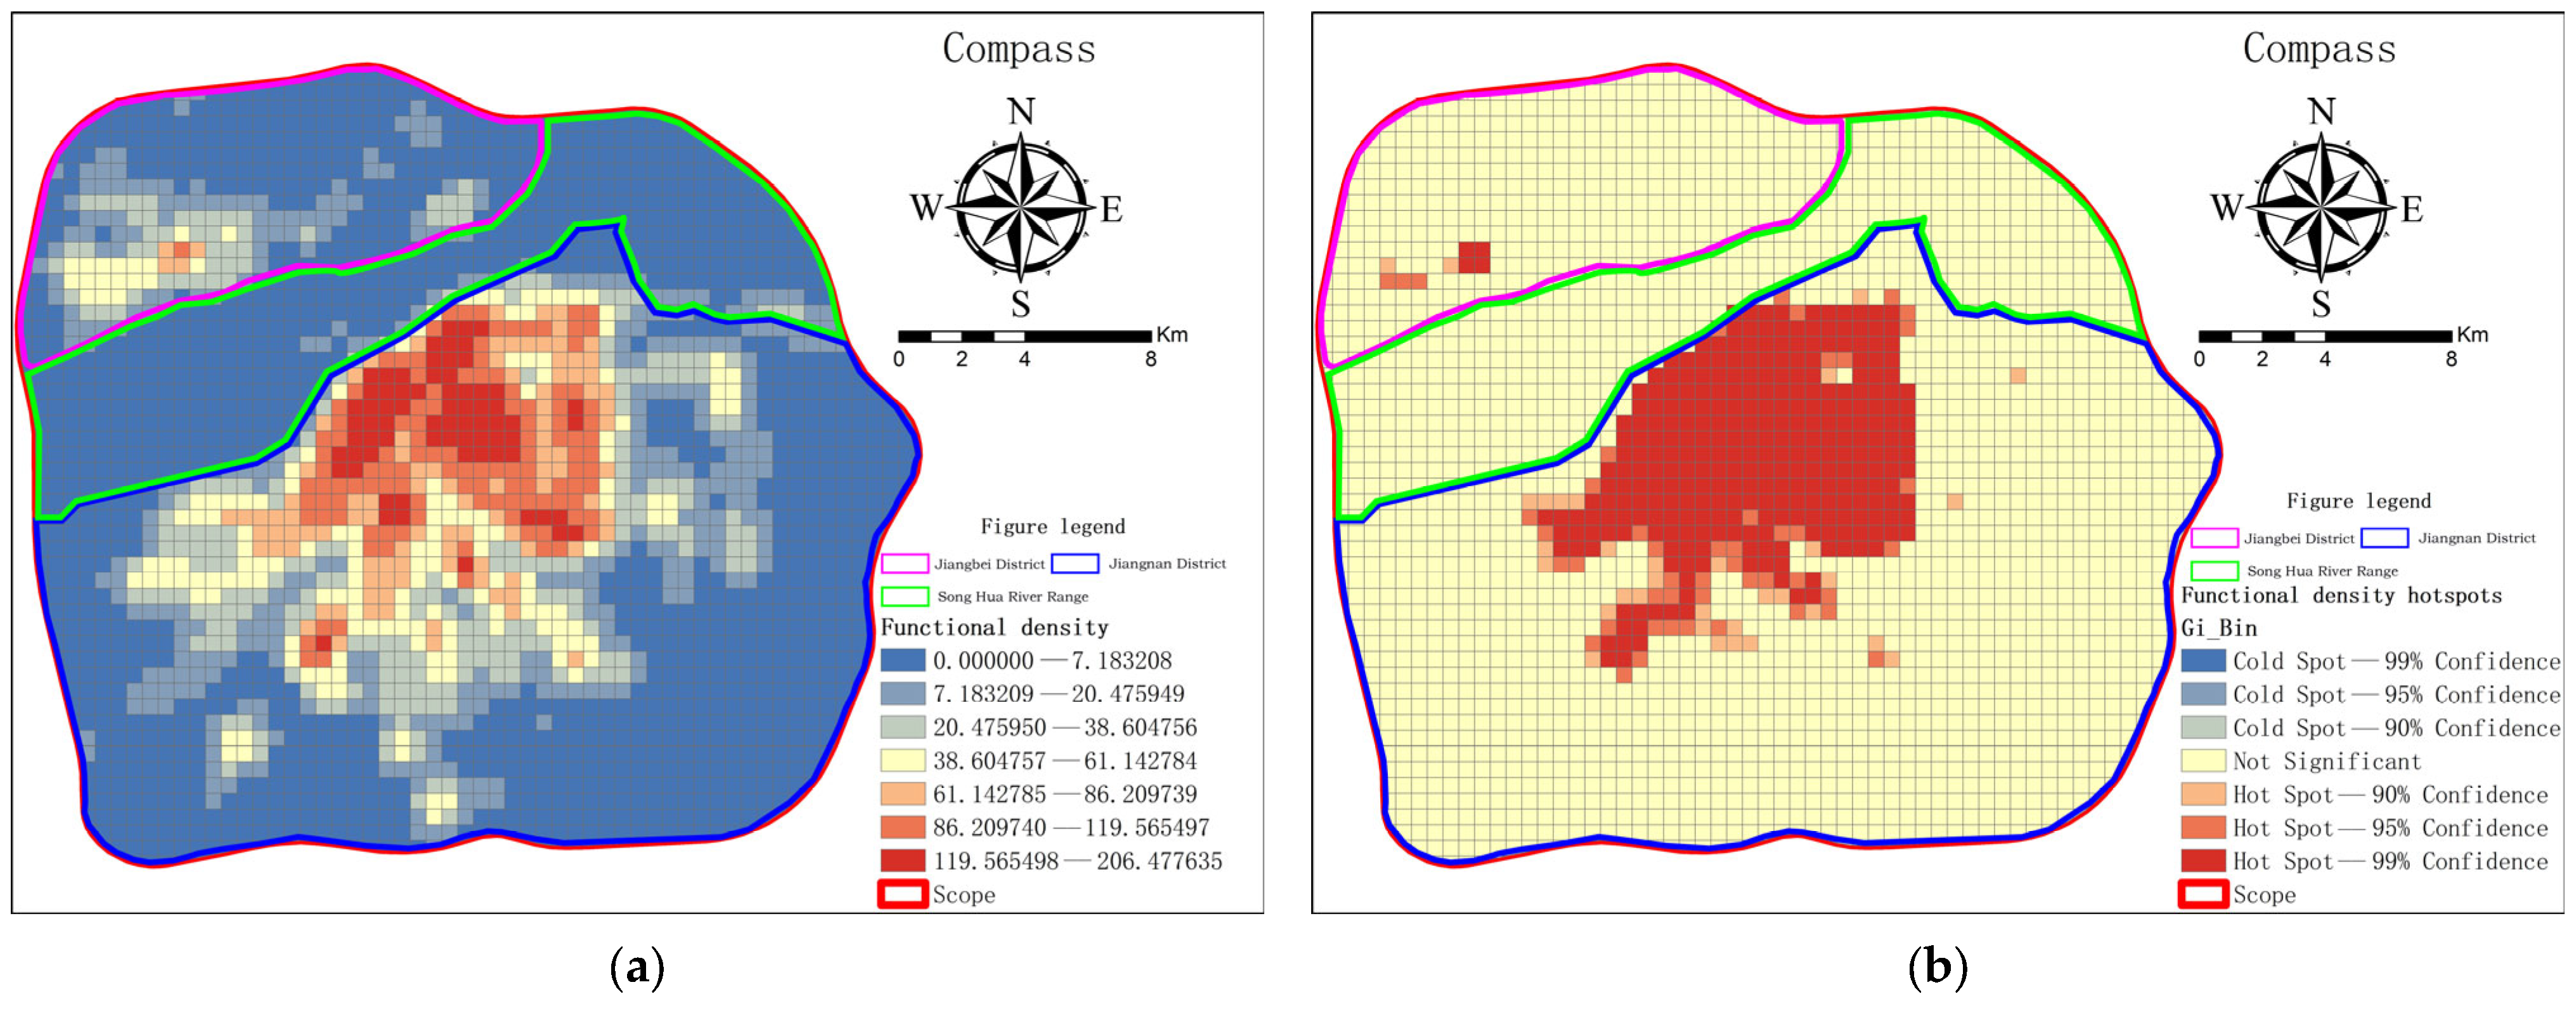
Functional density refers to the number of functions contained in a unit area or unit volume, and higher functional density usually accompanies an increase in population density, increasing the risk of virus transmission among people. Therefore, urban planning needs to consider the relationship between functional density and epidemics, reducing population density and public place density. At the same time, people need to strengthen self-protection and comply with public health measures to reduce the spread of epidemics.
According to the functional density distribution map shown in Figure 9, it can be observed that the aggregation in the Jiangnan area is more pronounced, with a larger and stronger aggregation area, indicating that different functional points are more densely distributed together in this area [42]. This means that the potential epidemic risk caused by functional density in the Jiangnan area is more severe than that in the Jiangbei area. This potential risk is mainly distributed near the Inner Ring Road, Daoli District, and Dao Wai District. In order to further study the impact of functional density on space, hotspot analysis was conducted. As shown in Figure 9, the impact is significant, with high values standing out, forming a significant large area in the Jiangnan area, with a broad and strong influence, involving multiple areas such as Daoli District, Dao Wai District, Xiangfang District, and Nangang District. This means that the epidemic risk caused by functional density cannot be ignored, and we need to take active measures for prevention and control. In conclusion, based on these analysis results, we can conclude that the functional density in the Jiangnan area is higher, which may lead to more serious epidemic risks. Therefore, we should pay high attention to epidemic prevention and control in these areas, strengthen monitoring and control, and avoid the spread of the epidemic.

3.3. Quantification of Heat Map Data Indicators

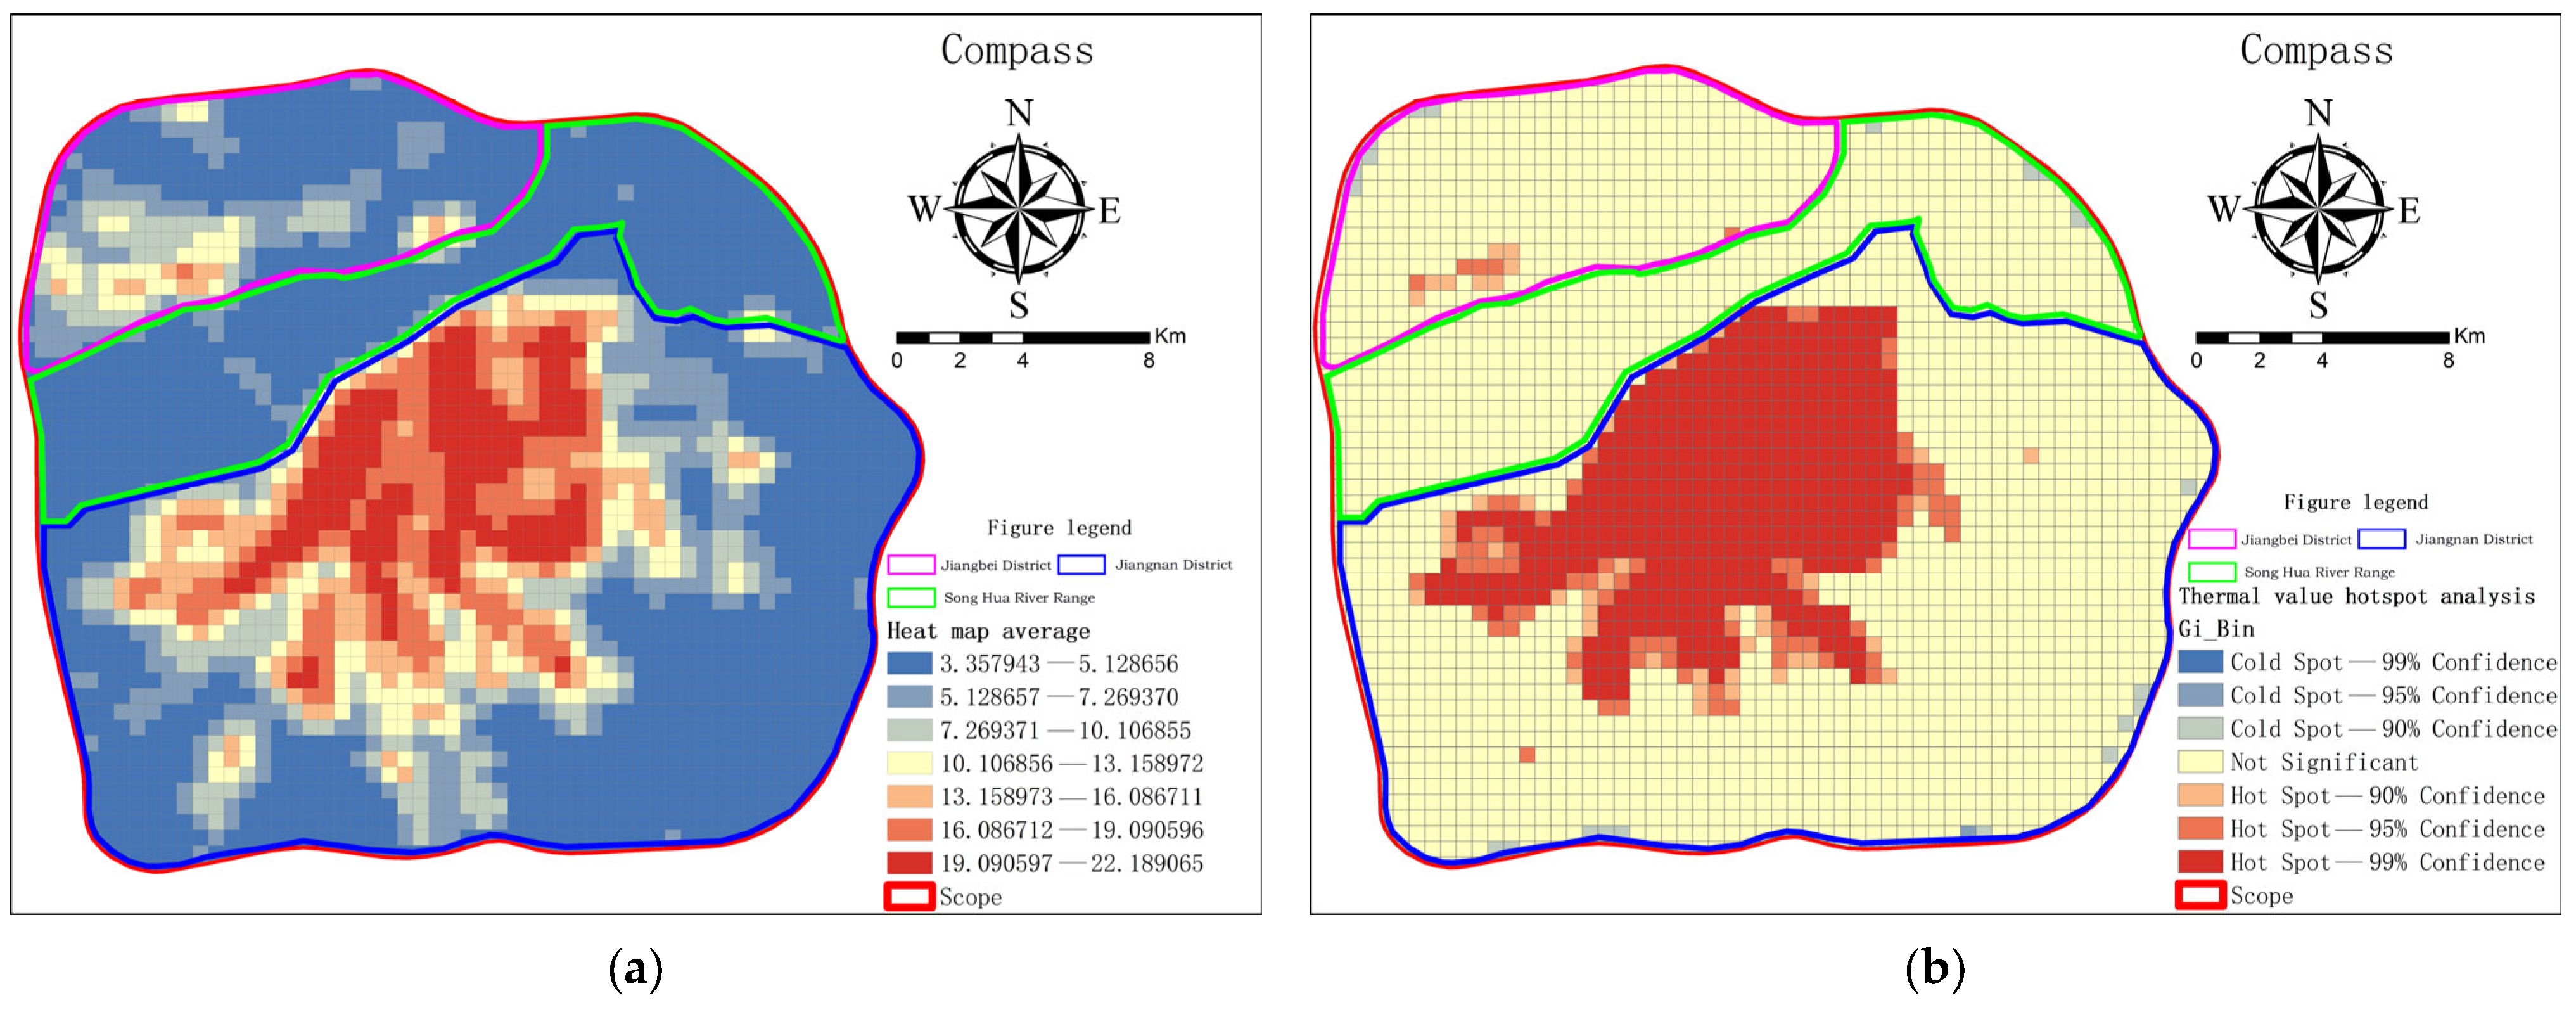
Heatmaps provide important information about the intensity and spatial clustering of vitality in Harbin, which is of great significance for studying urban development and planning [43]. Figure 10 is a weekly average heat intensity map obtained by calculating the average vitality intensity on Wednesdays as representative workdays and Sundays as representative rest days. Some high-intensity hotspots may be commercial and administrative centers, while low-vitality areas may be residential and suburban areas. Further analysis of these hotspots is shown in Figure 10, which displays the spatial distribution of hotspots caused by population vitality clustering. This clustering area extends from the inner ring road area to the third ring road area, with a large area and high intensity [44]. In this area, population density is high, and the frequency of contact between people is also high, which increases the risk of epidemic transmission. These clustering areas may become high-risk areas for epidemics. Comparing the distribution of facility density and road network spatial structure with that of hotspot clustering areas, it can be found that there is a certain similarity between these data and the distribution of hotspot clustering areas. This means that there is a close relationship between the layout of the city’s population, facilities, and transportation and population vitality and spatial clustering. Therefore, when planning and developing cities, these factors should be comprehensively considered to reduce the spread of epidemics and other health risks.

3.4. Quantification of Building Profile Data Indicators

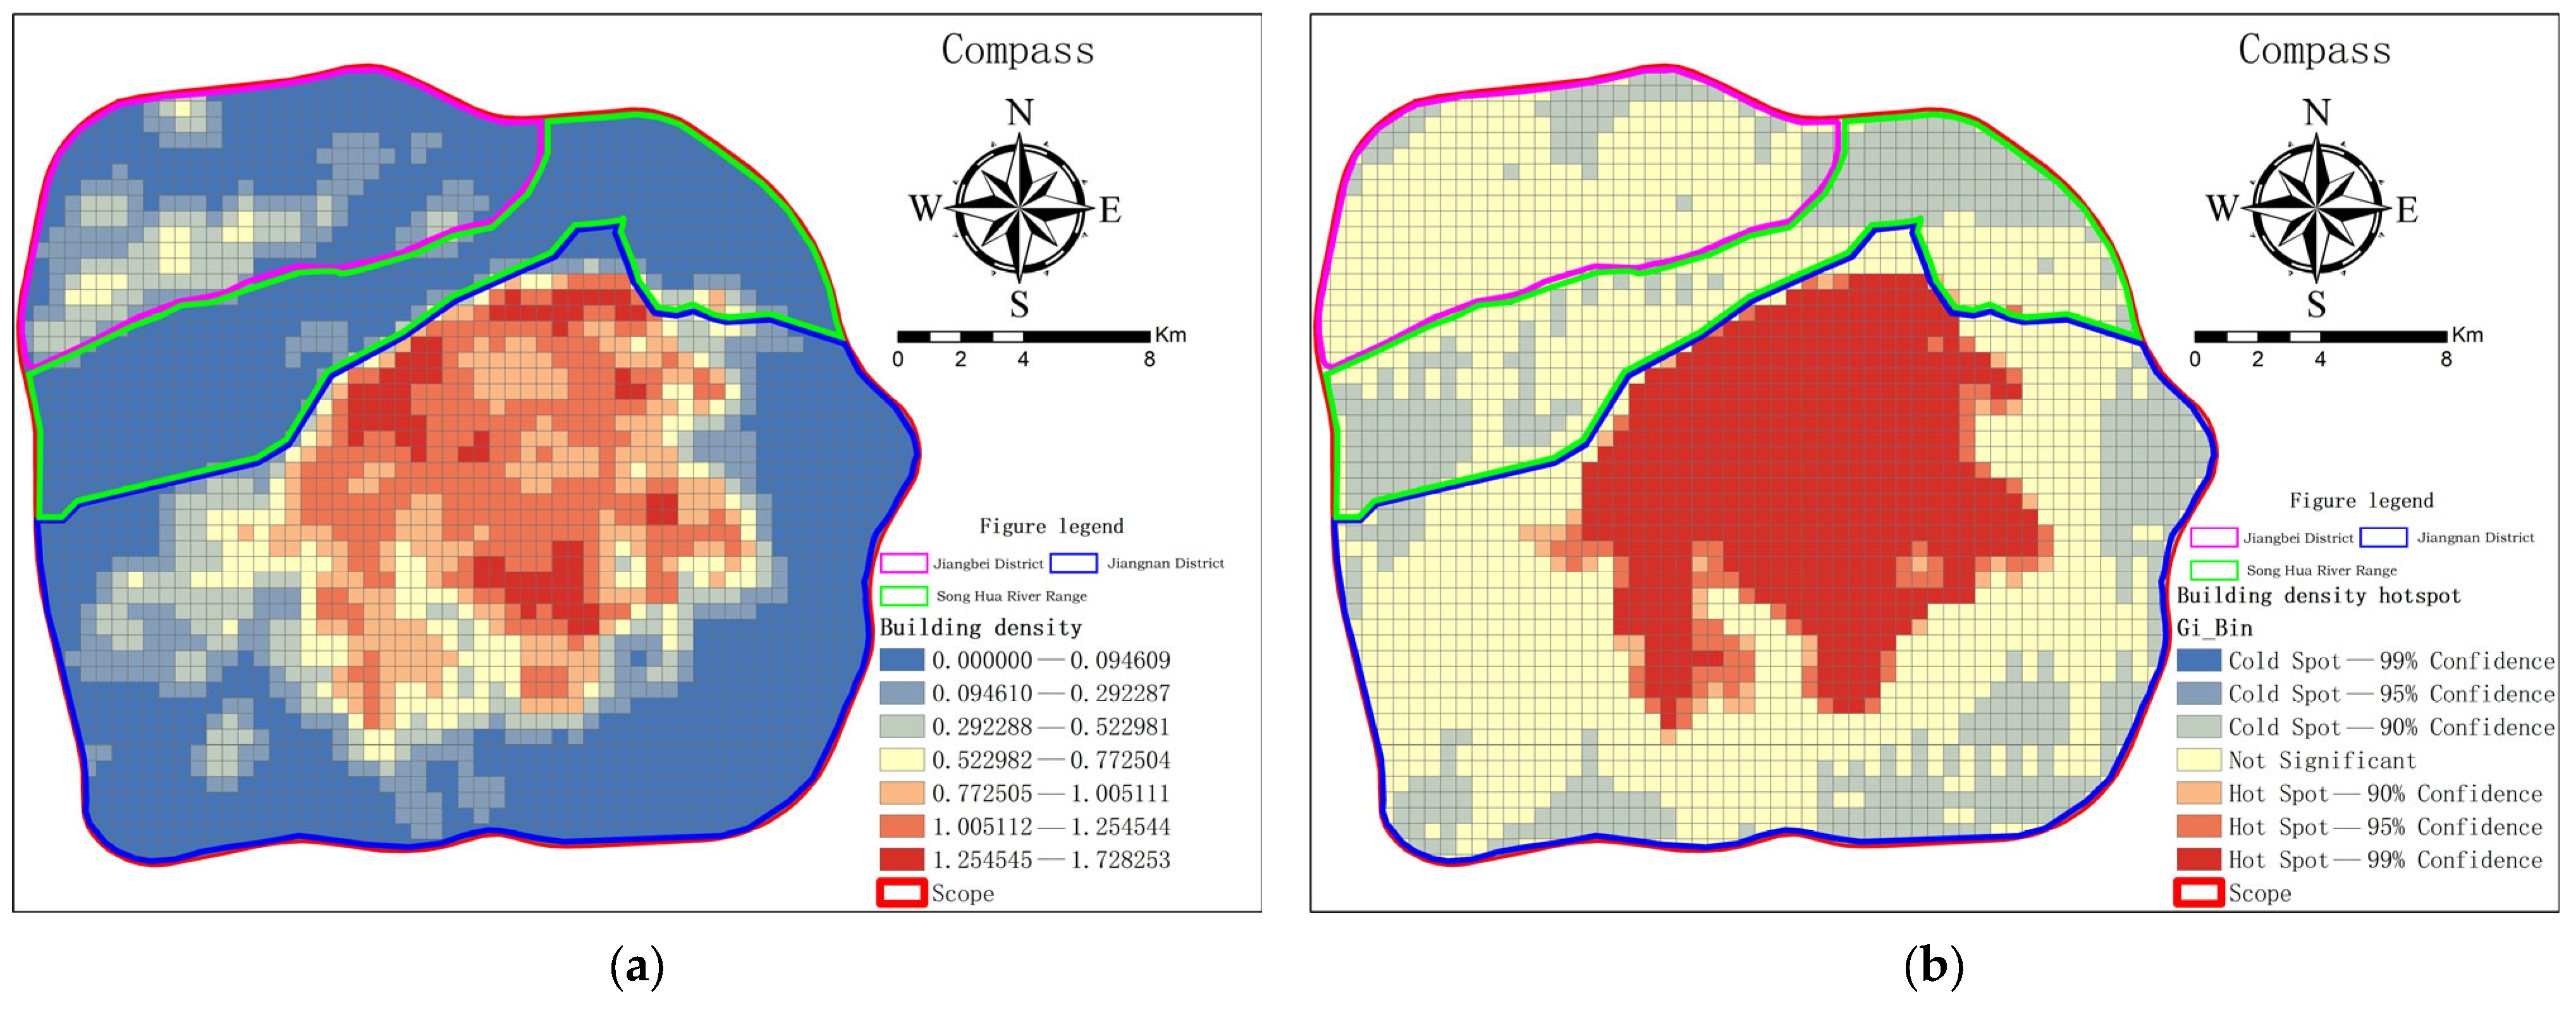
During the outbreak of an epidemic, densely populated areas in cities can increase the risk of virus transmission due to the enhanced population clustering. As shown in Figure 11, the Jiangnan region has a high building density and strong population clustering, which may lead to an increased risk of population clustering and virus transmission, particularly in the highlighted red high-value distribution areas where the epidemic risk is more pronounced. Hotspot analysis of building density reveals a widespread and high-intensity cluster distribution, with a radiating trend towards the surrounding areas. Therefore, stricter control measures are needed during the epidemic to reduce the risk of population clustering and virus transmission. Meanwhile, the Jiangbei region has a lower building density and weaker population clustering, which may help reduce the risk of virus transmission. However, this may also lead to limitations on social and economic activities in this area. Therefore, a more balanced consideration of urban planning and socio-economic development is necessary during the epidemic to reduce its impact on the city and people’s lives. In summary, analyzing building density and hotspots can better understand the spatial characteristics and population clustering of cities, which is crucial for epidemic control and sustainable urban development.

3.5. Outbreak Risk Identification and Validation

To more effectively identify potential epidemic risks in neighborhoods, we need to conduct a comprehensive assessment of disease transmission risks. Table 2 shows the weight values of influencing factors. Building on the analysis in previous sections, we need to explore the impact of six different data factors on the hidden risks of neighborhood spaces. These factors include functional mix, functional density, proximity, centrality, thermal intensity, and building density. However, different factors have different levels of influence on space, so it is necessary to use the entropy weighting method to determine the weight values of each indicator. This method can eliminate the correlation between data to ensure that the weight values of each indicator reflect its actual impact in the evaluation. These weight values will be used to measure the impact of each factor on the neighborhood space and play a key role in the comprehensive evaluation.
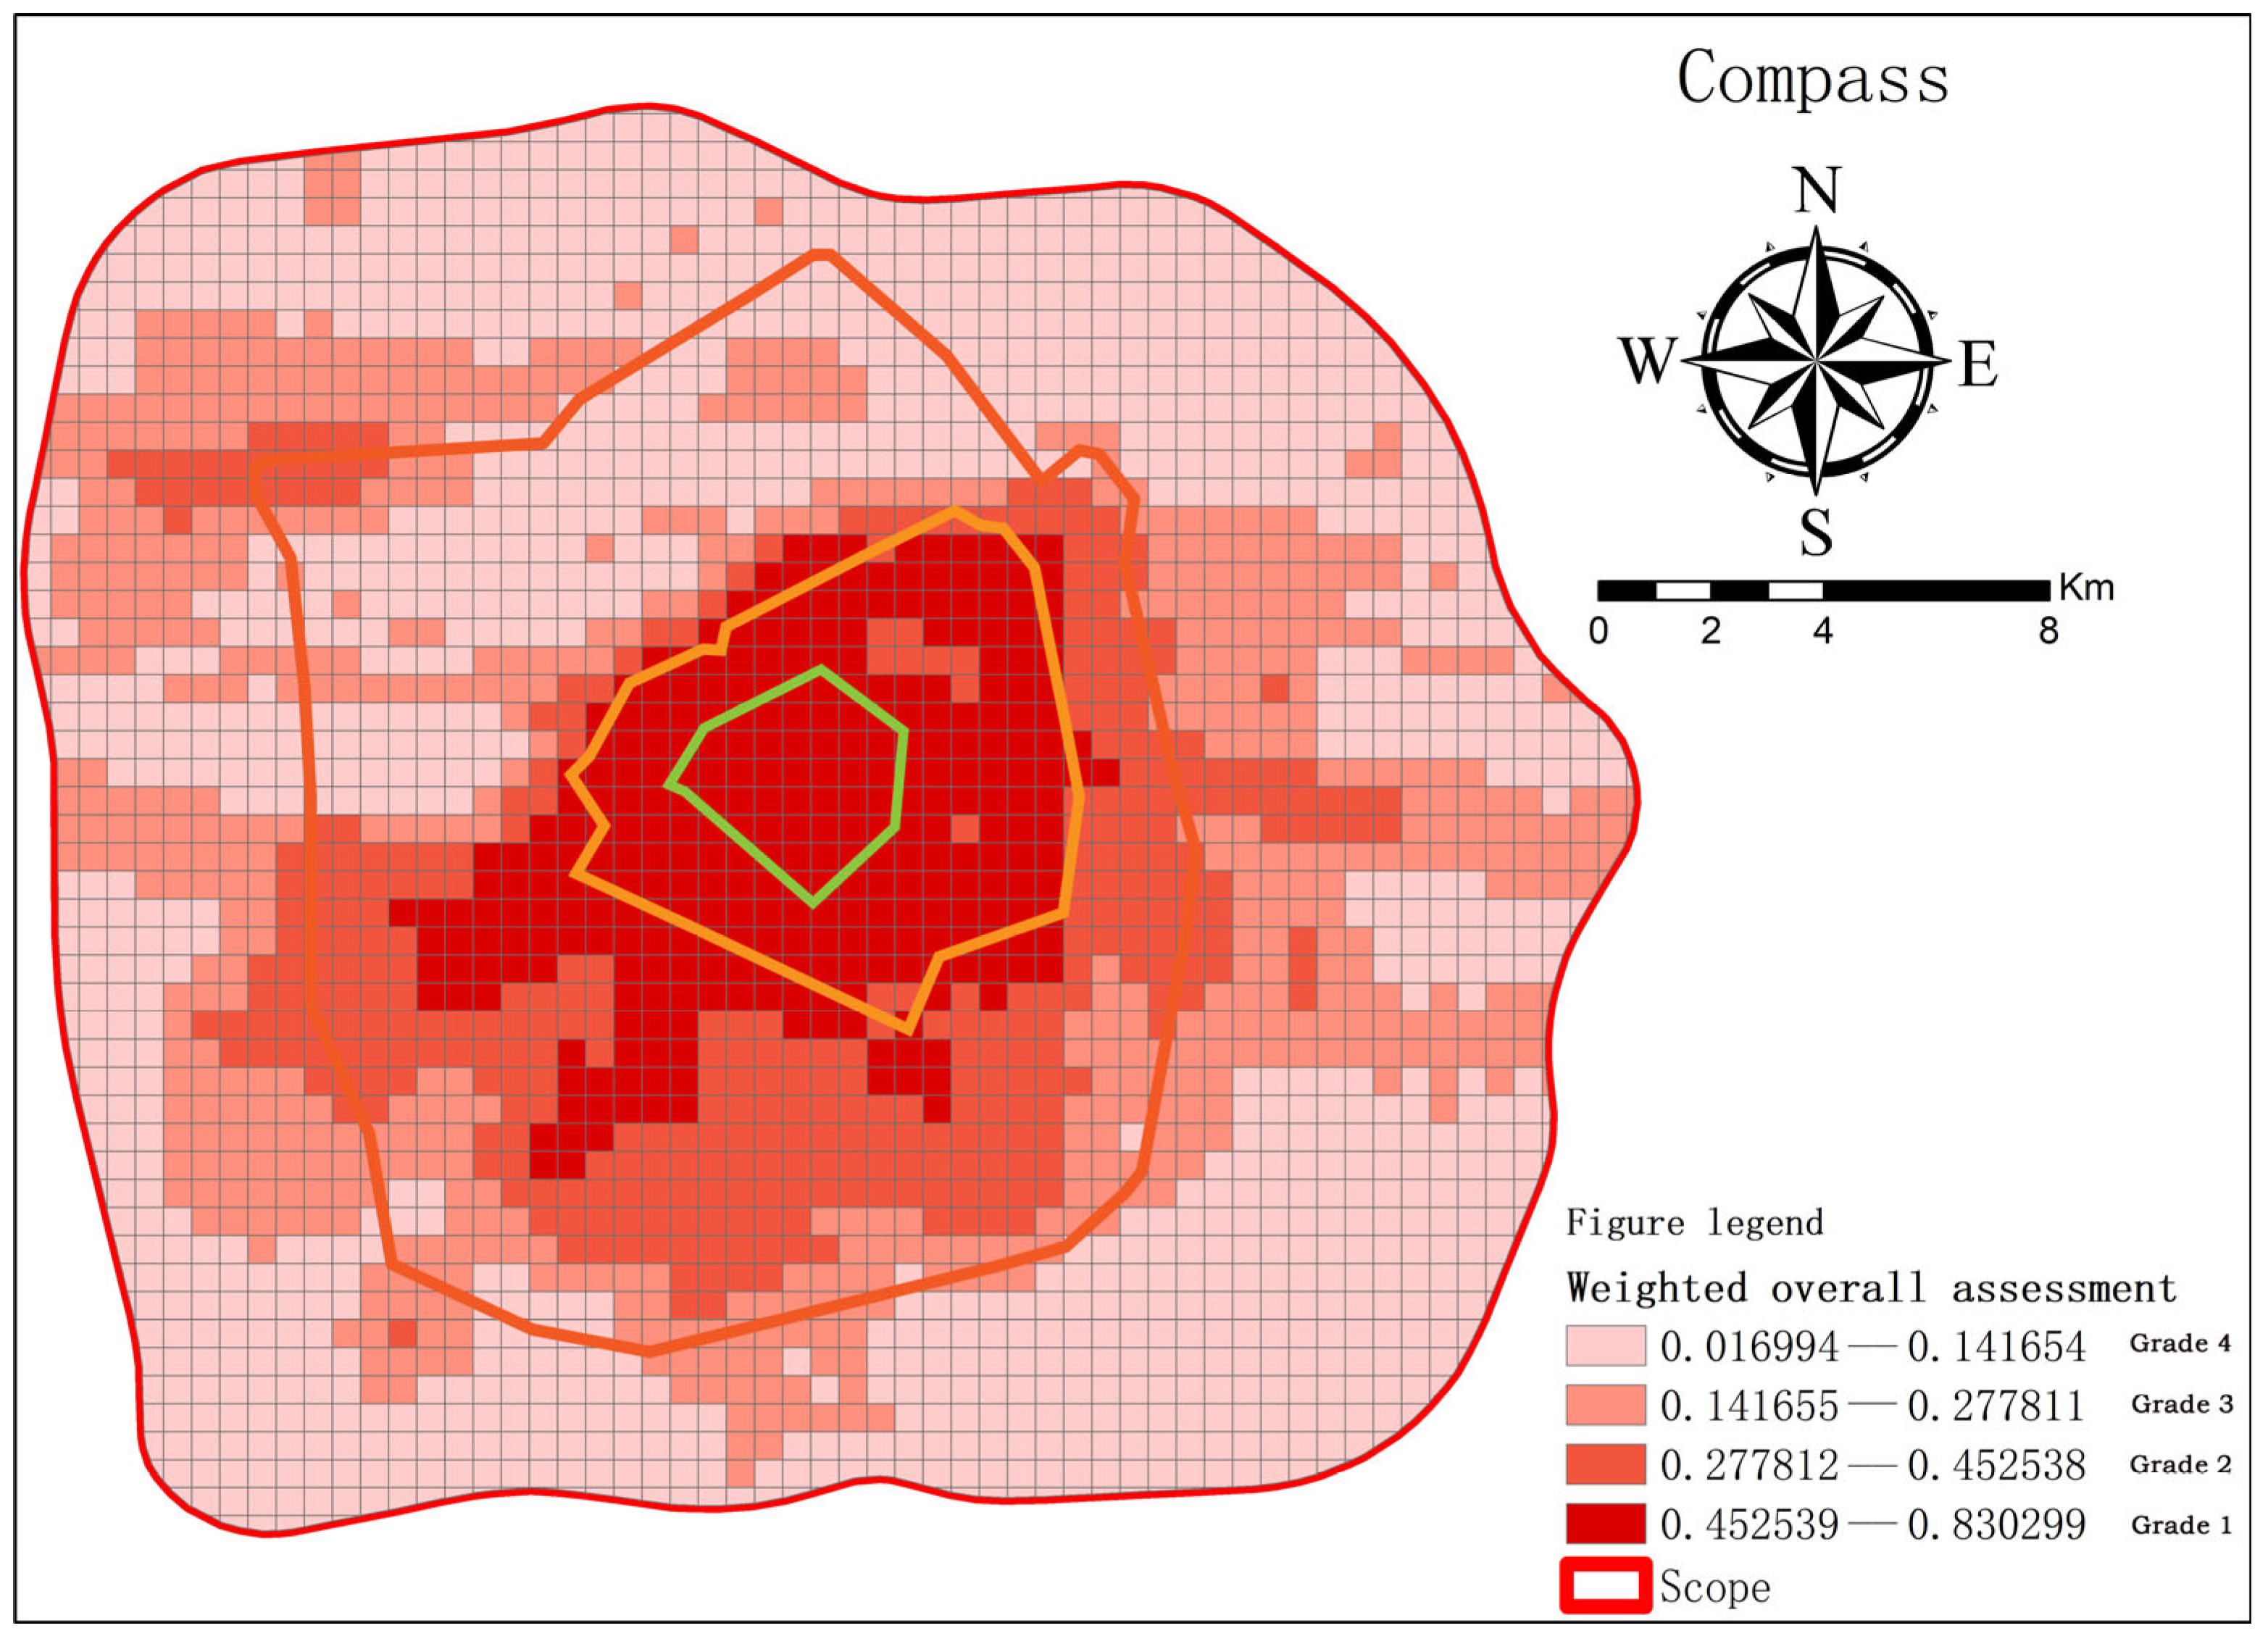
Regarding the transmission risk of infectious diseases, the weight of different indicators was calculated using the entropy weighting method. The weight of functional density was the highest, followed by building density, and functional mix had the lowest weight. Then, the data of the six indicators were linearly weighted to obtain a comprehensive score for each sample. Finally, the results of the comprehensive analysis of the risk level of Harbin’s epidemic risk were visualized through charts, as shown in Figure 12.
Based on the comprehensive evaluation results of the epidemic risk in Figure 12, the main urban area of Harbin City is divided into four levels of epidemic risk. As the study area chosen for the article is the spatial range within the fourth ring road of Harbin city, after several data analysis results, classifying the identification results into four levels can exactly have a better correspondence law with the space within the fourth ring road within the study area. Therefore, this paper chooses a four-level classification. When performing the classification, increasing the accuracy into a more hierarchical classification can indeed improve the accuracy, but the spread of the epidemic is complex, and too fine a classification will result in two clusters with influence becoming two small clusters, and the space in between them with a break being classified as a lower level, which obviously does not correspond to the actual situation; therefore, this paper chooses a four-level classification for the space instead. The identification of epidemics is more rigorous and helps us to understand the relationship between the epidemic potential of the four circles. The most dangerous level is Grade 1, which is distributed in the Jiangnan area, with a total of 317 spatial units. Grade 2 is relatively dangerous and mainly distributed between the third and second ring roads, with a total of 368 spatial units. Grade 3 is relatively light and mainly distributed between the third and fourth ring roads, with a total of 924 spatial units. Grade 4 is the safest and mainly distributed outside the fourth ring road, with a total of 877 spatial units. From the perspective of the distribution of Harbin’s urban ring layers, Level 1 is mainly distributed within the second ring road, while the Jiangbei area has a smaller area with Level 2. This means that the area within the second ring road faces the highest epidemic risk. At the same time, Level 2 is mainly distributed between the third and second ring roads, which is also a relatively high-risk area. Overall, the epidemic risk in the main urban area of Harbin City is mainly concentrated near the city center and the inner ring road, where the population density is high, the transportation network is complex, and the personnel flow is frequent, making it easy for the epidemic to spread and expand [45]. Therefore, during the epidemic prevention and control process, these areas should be closely monitored and managed; targeted epidemic prevention measures should be taken; suspected cases should be detected and isolated in a timely manner; and the spread of the epidemic should be prevented [46]. At the same time, epidemic propaganda and education should be carried out in a wider range to raise public awareness of protection and jointly maintain the city’s sustainability.
To verify the accuracy of the identification results, it is necessary to compare them with the existing outbreak situation. Due to the prolonged and fluctuating outbreak of COVID-19 in Harbin City in 2022, this study selected the government’s COVID-19 epidemic notification data on 1 December 2022 and focused on the high-risk levels adjusted by the Harbin City Command Center based on the requirements of the State Council’s Joint Prevention and Control Mechanism, as determined by comprehensive expert research. Based on this, the identification results were compared and validated.
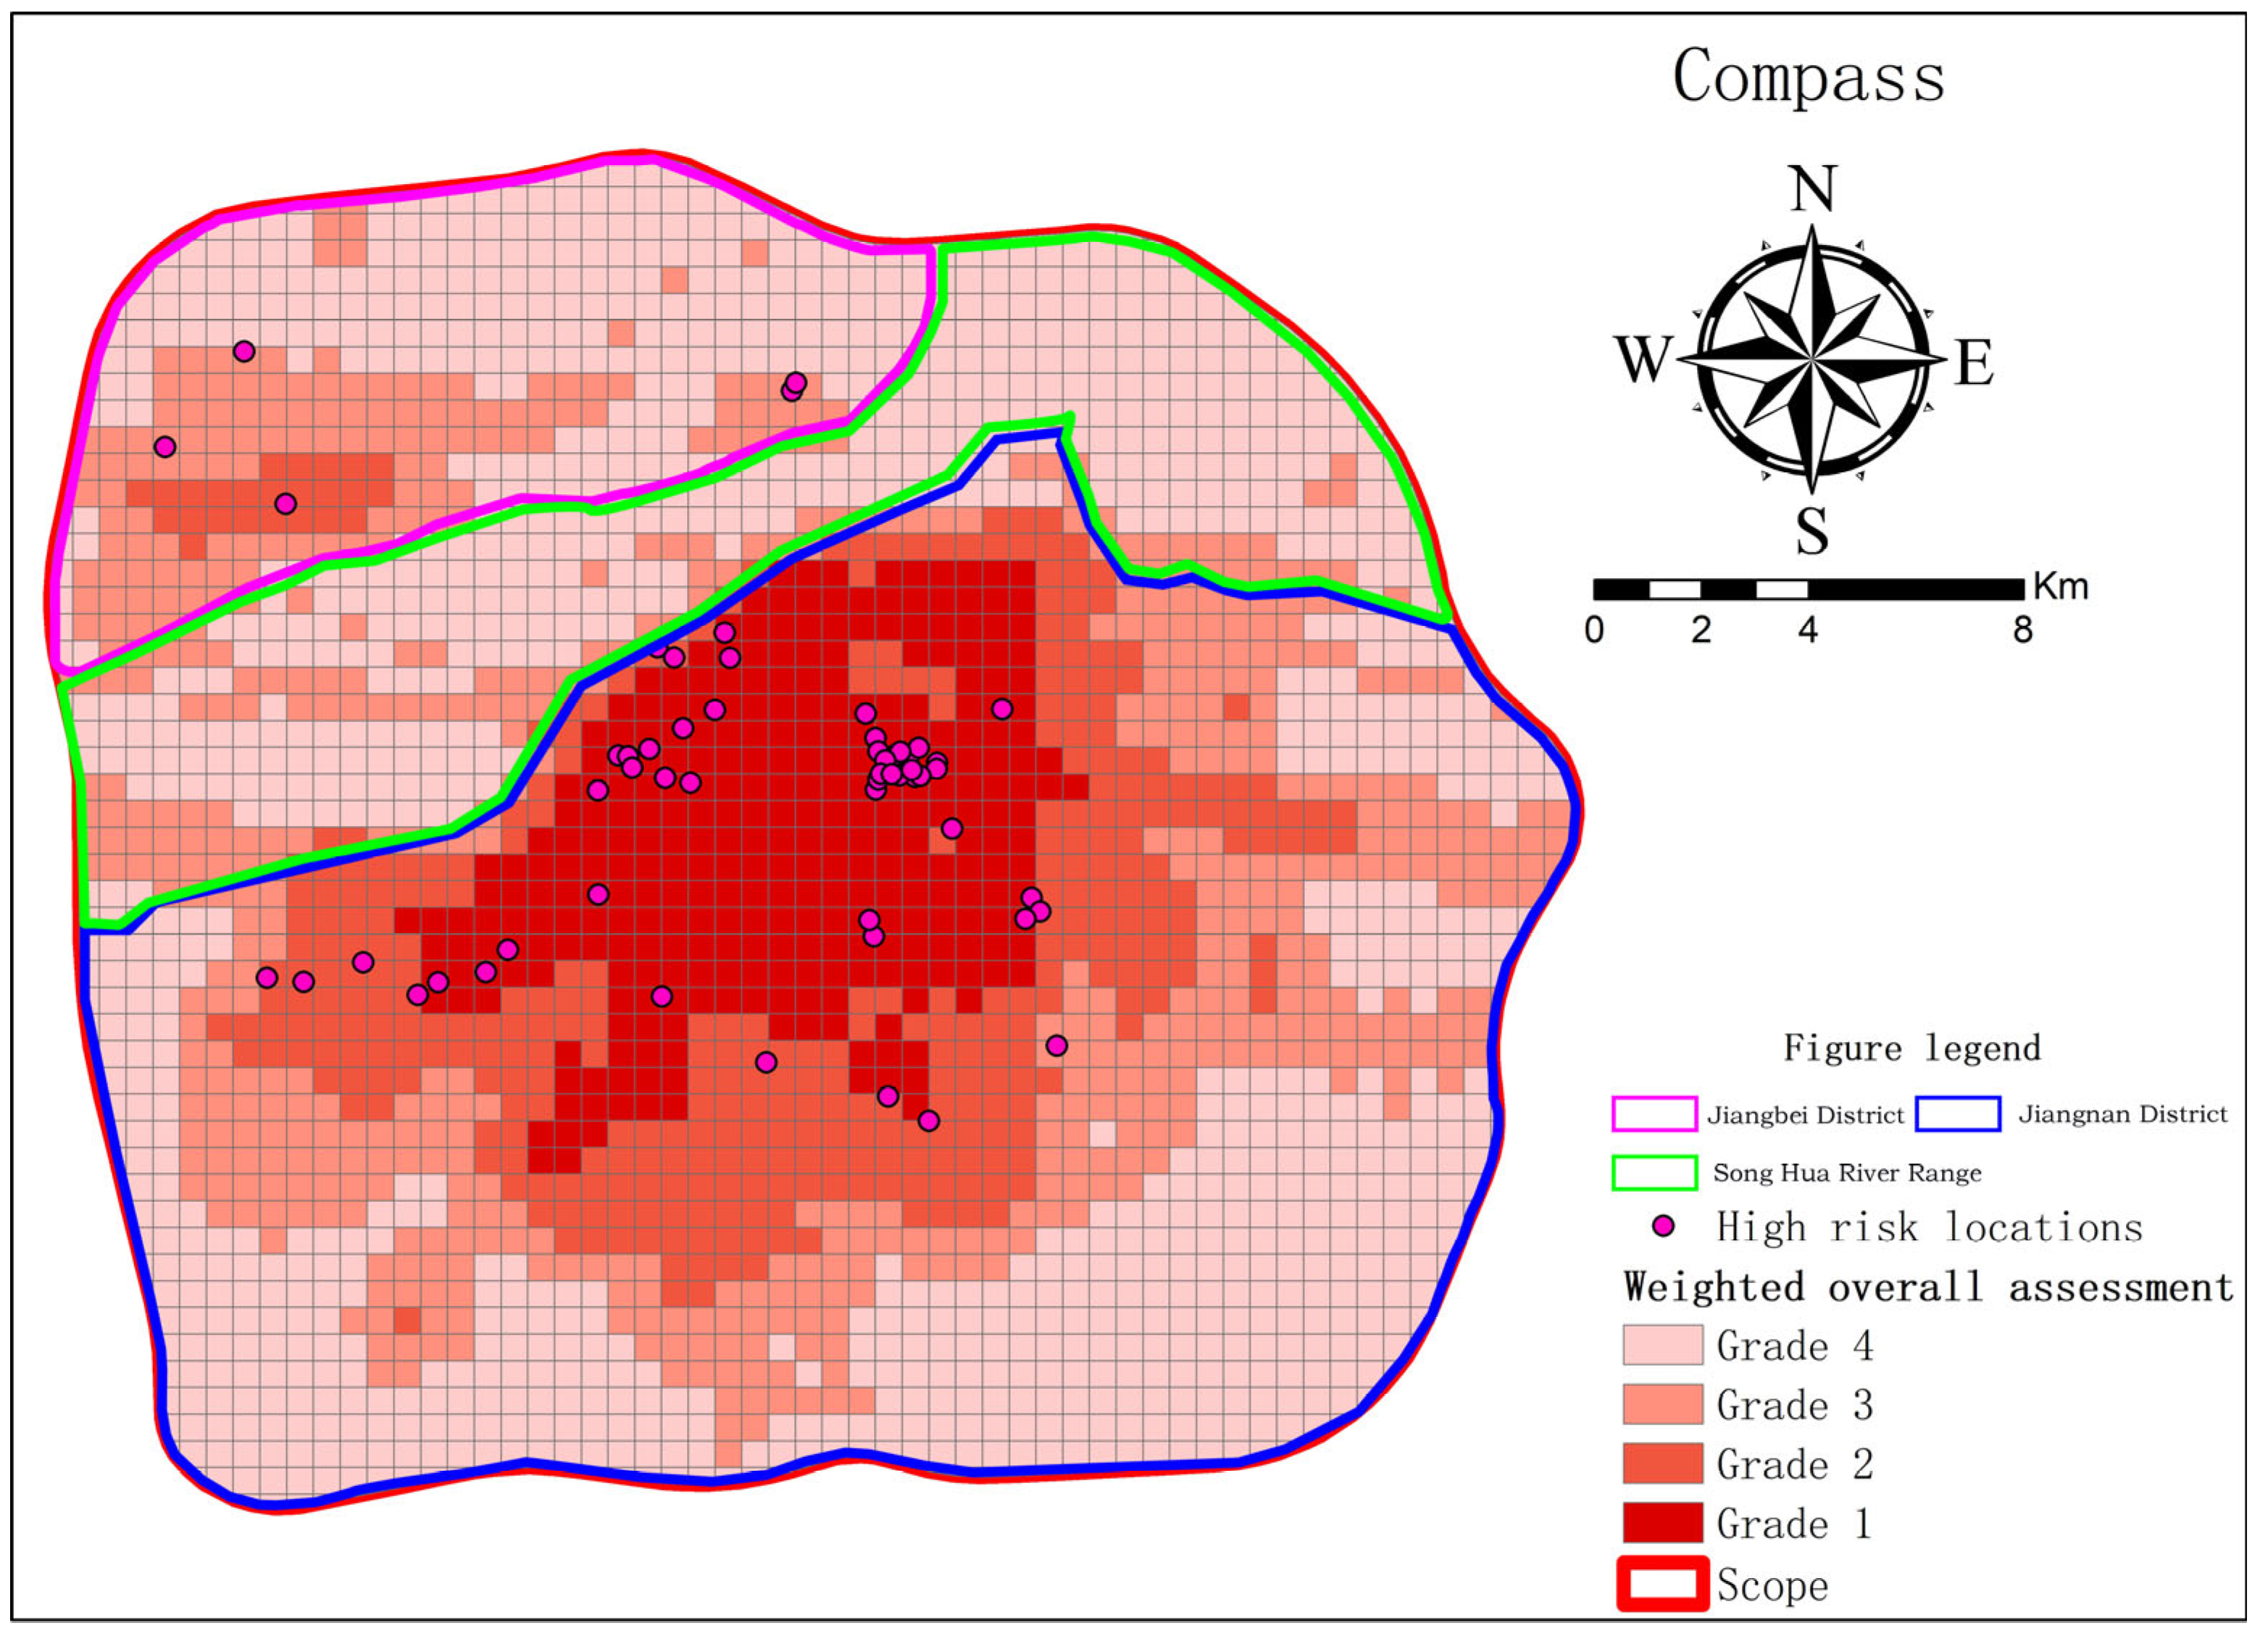
As shown in Table 3, a total of 61 high-risk areas were selected in this study for comparison with the results of identifying potential COVID-19 risks. There were 5 locations in Songbei District, 28 locations in Nangang District, 8 locations in Xiangfang District, and 20 locations in Daoli District. No locations were selected in Daowai District. To facilitate comparison, the high-risk data were summarized, and the longitude and latitude were obtained using Baidu Maps. The GIS was used to visualize the high-risk areas and to understand the distribution of COVID-19 high-risk locations.
This study analyzed the spread of COVID-19 and related factors and developed a method for identifying potential risks of the disease in spatial areas. The method achieved some effectiveness in practical applications. Figure 13 shows the distribution of COVID-19 in different regions, especially the spatial locations of key areas where outbreaks occurred in Harbin city. All of these areas fell within the comprehensive range of potential risk distribution identified in this study. Table 4 summarizes the high-risk locations within the identified risk level areas. The results showed that 45 locations fell into the first level of potential risk, 11 locations fell into the second level, and 5 locations fell into the third level, which proved the applicability and accuracy of this method in identifying potential COVID-19 risks in spatial areas. This passage also provides some guidance for epidemic prevention and control. The highest level of risk is associated with Level 1 hidden danger areas, so it is crucial to conduct thorough investigations and strengthen control measures to prevent the spread of infection in these areas while promoting urban development. Level 2 hidden danger areas are also significant and require attention due to their potential for transmission and spread of infectious diseases. Although the risks associated with Level 3 and 4 hidden danger areas are not as severe as those at Level 1 and 2, they should still be taken seriously. For example, Level 3 areas may have a small number of cases, but they have already formed a certain risk situation and should become a focus of future prevention and control measures for infectious diseases. It is important not to overlook the generation and spread of epidemic risks, as this can help to improve public health and promote sustainable urban development. The guidance provided in this research can also play a vital role in improving the efficiency and quality of epidemic prevention and control efforts [47].

4. Discussion

Analyzing the risks of human-to-human transmission from both population and physical spatial dimensions is an important direction in studying epidemic prevention and control. With the increase in population, the frequency of human interaction and contact also increases, thereby increasing the risk of infectious disease transmission [48]. In terms of physical space, people’s activities and behaviors in different spaces also affect the spread of the epidemic. Therefore, we need to comprehensively consider both population and physical spatial factors to analyze epidemic risks. Based on this, we can categorize the sources of epidemic risks into four types: street space, functional space, building space, and population distribution [49]. Street space includes bustling commercial areas, tourist attractions, and densely populated areas; functional space includes public transportation, hospitals, schools, etc.; building space includes residential buildings, commercial buildings, office buildings, etc.; population distribution includes population mobility and population density.
Based on the four major sources of epidemic risks mentioned above, we can identify six risk factors, namely functional mix, functional density, accessibility, traffic potential, thermal intensity, and building density. Using the entropy weighting method, we can determine the weights of each factor, among which the top three factors with the highest influence weight are functional density, building density, and thermal intensity. This means that for epidemic prevention and control, we need to pay more attention to areas with high functional density, building density, and thermal intensity. Among them, the analysis results of the core density of public service and commercial functions in the functional density are more concentrated and have a wider distribution of high values, which should be given top priority. The impact of functional mix is the smallest, and its weight is the lowest, so its priority for prevention and control is relatively lower.
By analyzing and understanding various sources of risks and identifying factors, we can have a certain understanding of the spread of hidden dangers from different sources [50]. However, the complexity of urban space determines that for the risk of human-to-human disease, we need to comprehensively evaluate the weighted results of these factors on space, comprehensively analyze the risks, and evaluate the level of risks. In the context of normalized epidemic prevention and control, urban development should pay attention to the characteristics of epidemic transmission and public health issues [51]. According to the risk level of urban space, manpower should be allocated in a targeted manner, and personnel flow management and monitoring should be carried out to achieve scientific and humane prevention and control [52]. At the same time, we should remain vigilant, do a good job in public health-related work, prevent the occurrence of emergencies, and ensure the life, health, and property safety of residents. Urban development strategies should incorporate the concept of urban health and attach importance to the improvement and prevention of public health, and relevant departments should do a good job in epidemic prevention, control, and response to ensure urban safety and health and promote sustainable urban development.
The method proposed in this article is feasible for cities to identify epidemic hazards at the geospatial level, but when applied to other cities or regions, it is necessary to firstly determine the appropriate size of the fishing network for gridding according to the size of the city and secondly to consider the specificity of the city and consider whether special indicators need to be added for the final comprehensive determination. This will enable the method to be better applied to other similar cities and improve the ability of other cities to develop in a sustainable and healthy manner.
There are also some limitations to this study. Firstly, the perspectives and influencing factors involved in this study are not comprehensive. Besides the factors mentioned by the authors, there may be other dimensions of research that could have an impact. Secondly, this study only involves the identification and evaluation of hidden dangers in Harbin city. Different cities may be affected by their economic environment, residents’ cultural qualities, local cultural characteristics, historical issues, and other factors, which may have an impact on the research results. In future research, the authors plan to expand the scope of the study, increase the comparative analysis of sample cases, and introduce other reasonable and scientific influencing factors in space-based research to verify the impact of hidden danger aggregation space so as to better identify hidden dangers.

5. Conclusions

This article primarily focuses on the spatial identification of human-to-human epidemic risks in Harbin. By analyzing six different influencing factors, the article investigates the impact of traffic flow on spatial aggregation and the range of epidemic risks. In other words, the article studies the influence of traffic flow on the spatial distribution of epidemic risks from a new perspective, starting with population distribution and physical space, and constructs a comprehensive urban epidemic risk assessment system by analyzing six different factors to fully evaluate the epidemic risks in Harbin.
The conclusions drawn from this study are as follows: (1) functional density is the biggest influencing factor in the formation of urban epidemic risks, with commercial and public service functions having the strongest impact on clustering and the widest distribution range, making them more likely to cause the occurrence and spread of epidemic risks. (2) Areas with high levels of epidemic risks in Harbin are mainly distributed in the city’s core area, while the risks gradually decrease from the center to the periphery, and the spatial distribution is correlated with the four major concentric circles within the study area, demonstrating that the spatial distribution of the epidemic is also affected by the city’s concentric distribution. (3) This method has an important role in identifying spatial clustering of epidemic risks in Harbin and has identified the risk levels of epidemic distribution in the city, which are consistent with the high-risk positions of epidemic outbreaks in space, demonstrating the effectiveness and feasibility of this method.
This study is based on geospatial big data and explores the spatial distribution of epidemic hazards, proposing a unique identification method. Through validation in the case of the COVID-19 epidemic, the feasibility of this method has been demonstrated, and it shows promising application prospects in dealing with virus transmission caused by spatial clustering of populations. This study provides important support for cities in responding to future epidemics and offers valuable ideas and methods for the development of global public health. Furthermore, in order to further improve the accuracy and effectiveness of this identification method, the authors plan to introduce more influencing factors and perspectives and improve the identification system in the future. The application of geospatial big data in this study can improve the ability to respond to sudden public health events and promote sustainable thinking. By comprehensively understanding the mechanism of virus transmission, we can better predict and respond to future epidemics, thereby contributing to the sustainable development of cities. In addition, this method can also help optimize urban planning and the allocation of public health resources, promoting social sustainability. Therefore, the results of this study not only have enlightening significance for research and application in the field of public health but also make an important contribution to achieving sustainable development goals.

Author Contributions

X.J. and M.S. contributed to the conception and design of the study. X.J. organized the database. M.S. performed the statistical analysis. X.J. wrote the first draft of the manuscript. M.S. wrote sections of the manuscript. All authors have read and agreed to the published version of the manuscript.

Funding

This research was funded by the 2022 Heilongjiang Province Philosophy and Social Science Research Planning Project, Heilongjiang, China, grant number 22JLB146. The project is entitled Research on the Territorial Space Optimization Strategy of Heilongjiang Resilient Cities. The project is funded by the Office of Philosophy and Social Sciences of Heilongjiang Province, China.

Institutional Review Board Statement

Not applicable.

Informed Consent Statement

Not applicable.

Data Availability Statement

Not applicable.

Conflicts of Interest

The authors declare no conflict of interest.

References

  1. Fenxia, Z. The community resilience measurement throughout the COVID-19 pandemic and beyond-an empirical study based on data from Shanghai. Wuhan and Chengdu. Int. J. Disaster Risk Reduct. 2022, 67, 102664. [Google Scholar] [CrossRef] [PubMed]
  2. Wang, Z. How should education be transformed in the post-epidemic era? Res. Electrochem. Educ. 2020, 41, 13–20. [Google Scholar]
  3. Shao, P.P.; Shao, T.; Tang, S.F. Assessment of malaria risk likelihood weighted composite index method. China Public Health 2017, 33, 520–524. [Google Scholar]
  4. Li, M.; Liu, D.; Li, Z. Analysis of the spatial and temporal characteristics of China’s urban vitality recovery under the new crown epidemic. Mod. Urban Res. 2022, 1–7+15. [Google Scholar] [CrossRef]
  5. Li, X.; Zhou, L.; Jia, T.; Wu, H.; Zou, Y.; Qin, K. Influence of urban factors on COVID-19 epidemic—Wuhan city as an example. J. Wuhan Univ. (Inf. Sci. Ed.) 2020, 45, 826–835. [Google Scholar]
  6. Chen, X.; Huang, Y.J.; Li, J.; Wang, S.; Pei, T. Characteristics of spatial and temporal aggregation of COVID-19 epidemic and analysis of the influencing factors—Case study of Chongqing city. Adv. Geogr. Sci. 2020, 39, 1798–1808. [Google Scholar]
  7. Wang, J.; Du, D.; Wei, Y.; Yang, H. Study on the spatial diffusion process and pattern of the new crown pneumonia epidemic. Geogr. Res. 2020, 39, 1450–1462. [Google Scholar]
  8. Mo, C.; Tan, D.; Mai, T.; Bei, C.; Qin, J.; Pang, W.; Zhang, Z. An Analysis of Spatiotemporal Pattern for COIVD-19 in China based on Space-Time Cube. J. Med. Virol. 2020, 92, 1587–1595. [Google Scholar] [CrossRef]
  9. Desjardins, M.R.; Hohl, A.; Delmelle, E.M. Rapid surveillance of COVID-19 in the United States using a prospective space-time scan statistic: Detecting and evaluating emerging clusters. Appl. Geogr. 2020, 118, 102202. [Google Scholar] [CrossRef]
  10. Huang, X.; Fu, Y.; Zhang, J.; Yang, J.; Hong, J. Exploration of early spatial and temporal spread characteristics and public space risk of the new crown epidemic in Guangzhou City. Trop. Geomorphol. 2020, 41, 8–17. [Google Scholar]
  11. Xiang, Y. Risk evaluation and spatial pattern analysis of major infectious disease outbreaks in China. Disaster Sci. 2021, 36, 35–40. [Google Scholar]
  12. Wu, Q.; Qian, L.; Wu, Z. Research on spatial structure identification and spatial morphology of megalopolis based on multi-source data. Geomat. World 2020, 27, 32–38. [Google Scholar]
  13. Zhang, K.; Zhang, S.; Zhang, M.; Liu, X. Spatial characteristics of epidemic communities and “epidemic prevention circles” strategy in Wuhan. Disaster Sci. 2021, 36, 175–180+227. [Google Scholar]
  14. Qin, S.Y.; Zheng, X.; Chen, Y. Prevention and community management of COVID-19, an example of epidemic rebound in Harbin. Genom. Appl. Biol. 2020, 39, 3411–3415. [Google Scholar]
  15. Zeng, P.; Sun, Z.; Chen, Y.; Qiao, Z.; Cai, L. COVID-19: A comparative study of population aggregation patterns in the Central Urban Area of Tianjin, China. Int. J. Environ. Res. Public Health 2021, 18, 2135. [Google Scholar] [CrossRef]
  16. Yao, Y.; Shi, W.; Zhang, A.; Liu, Z.; Luo, S. Examining the diffusion of coronavirus disease 2019 cases in a metropolis: A space syntax approach. Int. J. Health Geogr. 2021, 20, 17. [Google Scholar] [CrossRef]
  17. Han, Y.; Yu, X.; Long, W. Functional area identification based on Beijing bus swipe card data and interest points. Urban Plan. 2016, 40, 52–60. [Google Scholar]
  18. Fernandes, N. Economic Effects of Coronavirus Outbreak (COVID-19) on the World Economy; IESE Business School Working Paper No. WP-1240-E; IESE Business School: Barcelona, Spain, 2020. [Google Scholar]
  19. Caspi, G.; Chen, J.; Liverant-Taub, S.; Shina, A.; Caspi, O. Heat maps for surveillance and prevention of COVID-19 spread in nursing homes and assisted living facilities. J. Am. Med. Dir. Assoc. 2020, 21, 986–988.e1. [Google Scholar] [CrossRef]
  20. Liu, K.; Huang, J.; Xu, M.; Perc, M.; Li, X. Density saliency for clustered building detection and population capacity estimation. Neurocomputing 2021, 458, 127–140. [Google Scholar] [CrossRef]
  21. Zhou, C.; Su, F.; Pei, T.; Zhang, A.; Du, Y.; Luo, B.; Cao, Z.; Wang, J.; Yuan, W.; Zhu, Y.; et al. COVID-19: Challenges to GIS with big data. Geogr. Sustain. 2020, 1, 77–87. [Google Scholar] [CrossRef]
  22. Hayati, A.N.; Pawenang, E.T. Spatial Analysis of Environmental and Behavioral Health in a Pandemic Period for Determination of Vulnerability and Risk Zones. Indones. J. Public Health Nutr. 2021, 1, 164–171. [Google Scholar]
  23. Huang, X.; Xie, C.; Fang, X.; Zhang, L. Combining pixel-and object-based machine learning for identification of water-body types from urban high-resolution remote-sensing imagery. IEEE J. Sel. Top. Appl. Earth Obs. Remote Sens. 2015, 8, 2097–2110. [Google Scholar] [CrossRef]
  24. Rahmawati, R.; Parangu, K.A. Potential recovery of halal tourism in Ponorogo (Strategy analysis during the COVID-19 pandemic). J. Islam. Econ. (JoIE) 2021, 1, 97–110. [Google Scholar]
  25. Ahmad, F.; Goparaju, L.; Qayum, A. Studying malaria epidemic for vulnerability zones: Multi-criteria approach of geospatial tools. J. Geosci. Environ. Prot. 2017, 5, 30–53. [Google Scholar] [CrossRef]
  26. Zhang, C. Research on the Diffusion Characteristics of Urban Emergencies Based on Microblogs. Master’s Thesis, Wuhan University, Wuhan, China, 2017. [Google Scholar]
  27. Xia, F.; Wang, J.; Kong, X.; Zhang, D.; Wang, Z. Ranking station importance with human mobility patterns using subway network datasets. IEEE Trans. Intell. Transp. Syst. 2019, 21, 2840–2852. [Google Scholar] [CrossRef]
  28. Wu, J.; Yuan, Q. Space Syntax and Walking in a Historic Waterfront Neighborhood-Case Study of Shang Hai Hong Kou Port. Available online: http://www.tabedizioni.com/camiz/capitoli_vol_2/978889295356725.pdf (accessed on 2 May 2023).
  29. Li, Q.; Cui, C.; Liu, F.; Wu, Q.; Run, Y.; Han, Z. Multidimensional urban vitality on streets: Spatial patterns and influence factor identification using multisource urban data. ISPRS Int. J. Geo-Inf. 2021, 11, 2. [Google Scholar] [CrossRef]
  30. Le Boedec, K. Reference interval estimation of small sample sizes: A methodologic comparison using a computer-simulation study. Vet. Clin. Pathol. 2019, 48, 335–346. [Google Scholar] [CrossRef]
  31. Zhao, Y.; Kasimu, A.; Gao, P.; Liang, H. Spatiotemporal Changes in The Urban Landscape Pattern and Driving Forces of LUCC Characteristics in The Urban Agglomeration on The Northern Slope of The Tianshan Mountains from 1995 to 2018. Land 2022, 11, 1745. [Google Scholar] [CrossRef]
  32. Mao, Z.R.; Chen, X.K.; Xiang, Z.H.; Chen, Y.R. Research on the measurement and influencing factors of street vigour in historic districts: A case study of Wenming Street historic district in Kunming. SPE J 2021, 4, 54–61. [Google Scholar]
  33. Chen, Q.; Yan, Y.; Zhang, X.; Chen, J. A Study on the Impact of Built Environment Elements on Satisfaction with Residency Whilst Considering Spatial Heterogeneity. Sustainability 2022, 14, 15011. [Google Scholar] [CrossRef]
  34. Cui, J.; Liu, F.; Janssens, D.; An, S.; Wets, G.; Cools, M. Detecting urban road network accessibility problems using taxi GPS data. J. Transp. Geogr. 2016, 51, 147–157. [Google Scholar] [CrossRef]
  35. Sahitya, K.S.; Prasad, C. Evaluation of opportunity based urban road network accessibility using GIS. Spat. Inf. Res. 2020, 28, 487–493. [Google Scholar] [CrossRef]
  36. Fan, J.; Zheng, B.; Tang, Q.; Zhang, B.; Liu, N. The Changsha Historic Urban Area: A Study on the Changing Accessibility of the Road Network. Appl. Sci. 2022, 12, 2796. [Google Scholar] [CrossRef]
  37. Ba, M.; Meng, H.; Zhang, K.; Sun, Y. The analysis of spatial-temporal evolution of city accessibility based on highway network in Henan Province in China. J. Transp. Technol. 2021, 11, 296–310. [Google Scholar] [CrossRef]
  38. Yan, Y.; Guo, T.; Wang, D. Dynamic accessibility analysis of urban road-to-freeway interchanges based on navigation map paths. Sustainability 2021, 13, 372. [Google Scholar] [CrossRef]
  39. Appert, M.; Laurent, C. Measuring Urban Road Network Vulnerability Using Graph Theory: The Case of Montpellier’s Road Network Theory: The Case of Montpellier’s Road Network; Presses Universitaires de la Méditerranée: Montpellier, France, 2013; pp. 1–22. [Google Scholar]
  40. Yang, J.Y.; Shao, D.; Wang, Q.; Zhang, Y.H. Exploration on a method for precision identification of urban land use type using artificial intelligence: Based on big data of building forms and business POI data. City Plan. Rev. 2021, 45, 46–56. [Google Scholar]
  41. Hu, S.; He, Z.; Wu, L.; Yin, L.; Xu, Y.; Cui, H. A framework for extracting urban functional regions based on multiprototype word embeddings using points-of-interest data. Comput. Environ. Urban Syst. 2020, 80, 101442. [Google Scholar] [CrossRef]
  42. Zhao, W.; Li, Q.; Li, B. Extracting hierarchical landmarks from urban POI data. Yaogan Xuebao-J. Remote Sens. 2011, 15, 973–988. [Google Scholar]
  43. Sirisena, P.; Noordeen, F.; Kurukulasuriya, H.; Romesh, T.A.; Fernando, L. Effect of climatic factors and population density on the distribution of dengue in Sri Lanka: A GIS based evaluation for prediction of outbreaks. PLoS ONE 2017, 12, e0166806. [Google Scholar] [CrossRef]
  44. Bouzid, M.; Colón-González, F.J.; Lung, T.; Lake, I.R.; Hunter, P.R. Climate change and the emergence of vector-borne diseases in Europe: Case study of dengue fever. BMC Public Health 2014, 14, 781. [Google Scholar] [CrossRef]
  45. Sun, M.; Ren, Q. A new method to explore the abnormal space of urban hidden dangers under epidemic outbreak and its prevention and control: A case study of Jinan City. Open Geosci. 2022, 14, 1356–1379. [Google Scholar] [CrossRef]
  46. Velavan, T.P.; Meyer, C.G. The COVID-19 epidemic. Trop. Med. Int. Health 2020, 25, 278. [Google Scholar] [CrossRef] [PubMed]
  47. She, K.; Li, C.; Qi, C.; Liu, T.; Jia, Y.; Zhu, Y.; Liu, L.; Wang, Z.; Zhang, Y.; Li, X. Epidemiological characteristics and regional risk prediction of hemorrhagic fever with renal syndrome in Shandong Province, China. Int. J. Environ. Res. Public Health 2021, 18, 8495. [Google Scholar] [CrossRef] [PubMed]
  48. Sun, M.; Jiao, X. Identification of spaces with cluster infection risks in small cities in China based on spatial syntax and GIS. J. Comput. Methods Sci. Eng. 2022, 22, 1081–1097. [Google Scholar] [CrossRef]
  49. Ren, Q.; Sun, M. Exploring the Quantitative Assessment of Spatial Risk in Response to Major Epidemic Disasters in Megacities: A Case Study of Qingdao. Int. J. Environ. Res. Public Health 2023, 20, 3274. [Google Scholar] [CrossRef]
  50. Sheng, Q.; Cui, S. A study on the distribution of pedestrian flow in commercial complexes before and after epidemic control—Take Taikoo Li Sanlitun, Beijing as an example. New Archit. 2022, 9–14. [Google Scholar] [CrossRef]
  51. Sahin, A.R.; Erdogan, A.; Agaoglu, P.M.; Dineri, Y.; Cakirci, A.Y.; Senel, M.E.; Okyay, R.A.; Tasdogan, A.M. 2019 novel coronavirus (COVID-19) outbreak: A review of the current literature. EJMO 2020, 4, 1–7. [Google Scholar] [CrossRef]
  52. Li, Y.; Wu, X.; Wang, J. Netizens’ risk perception in new coronary pneumonia public health events: An analysis of spatiotemporal distribution and influencing factors. BMC Public Health 2022, 22, 70. [Google Scholar] [CrossRef]
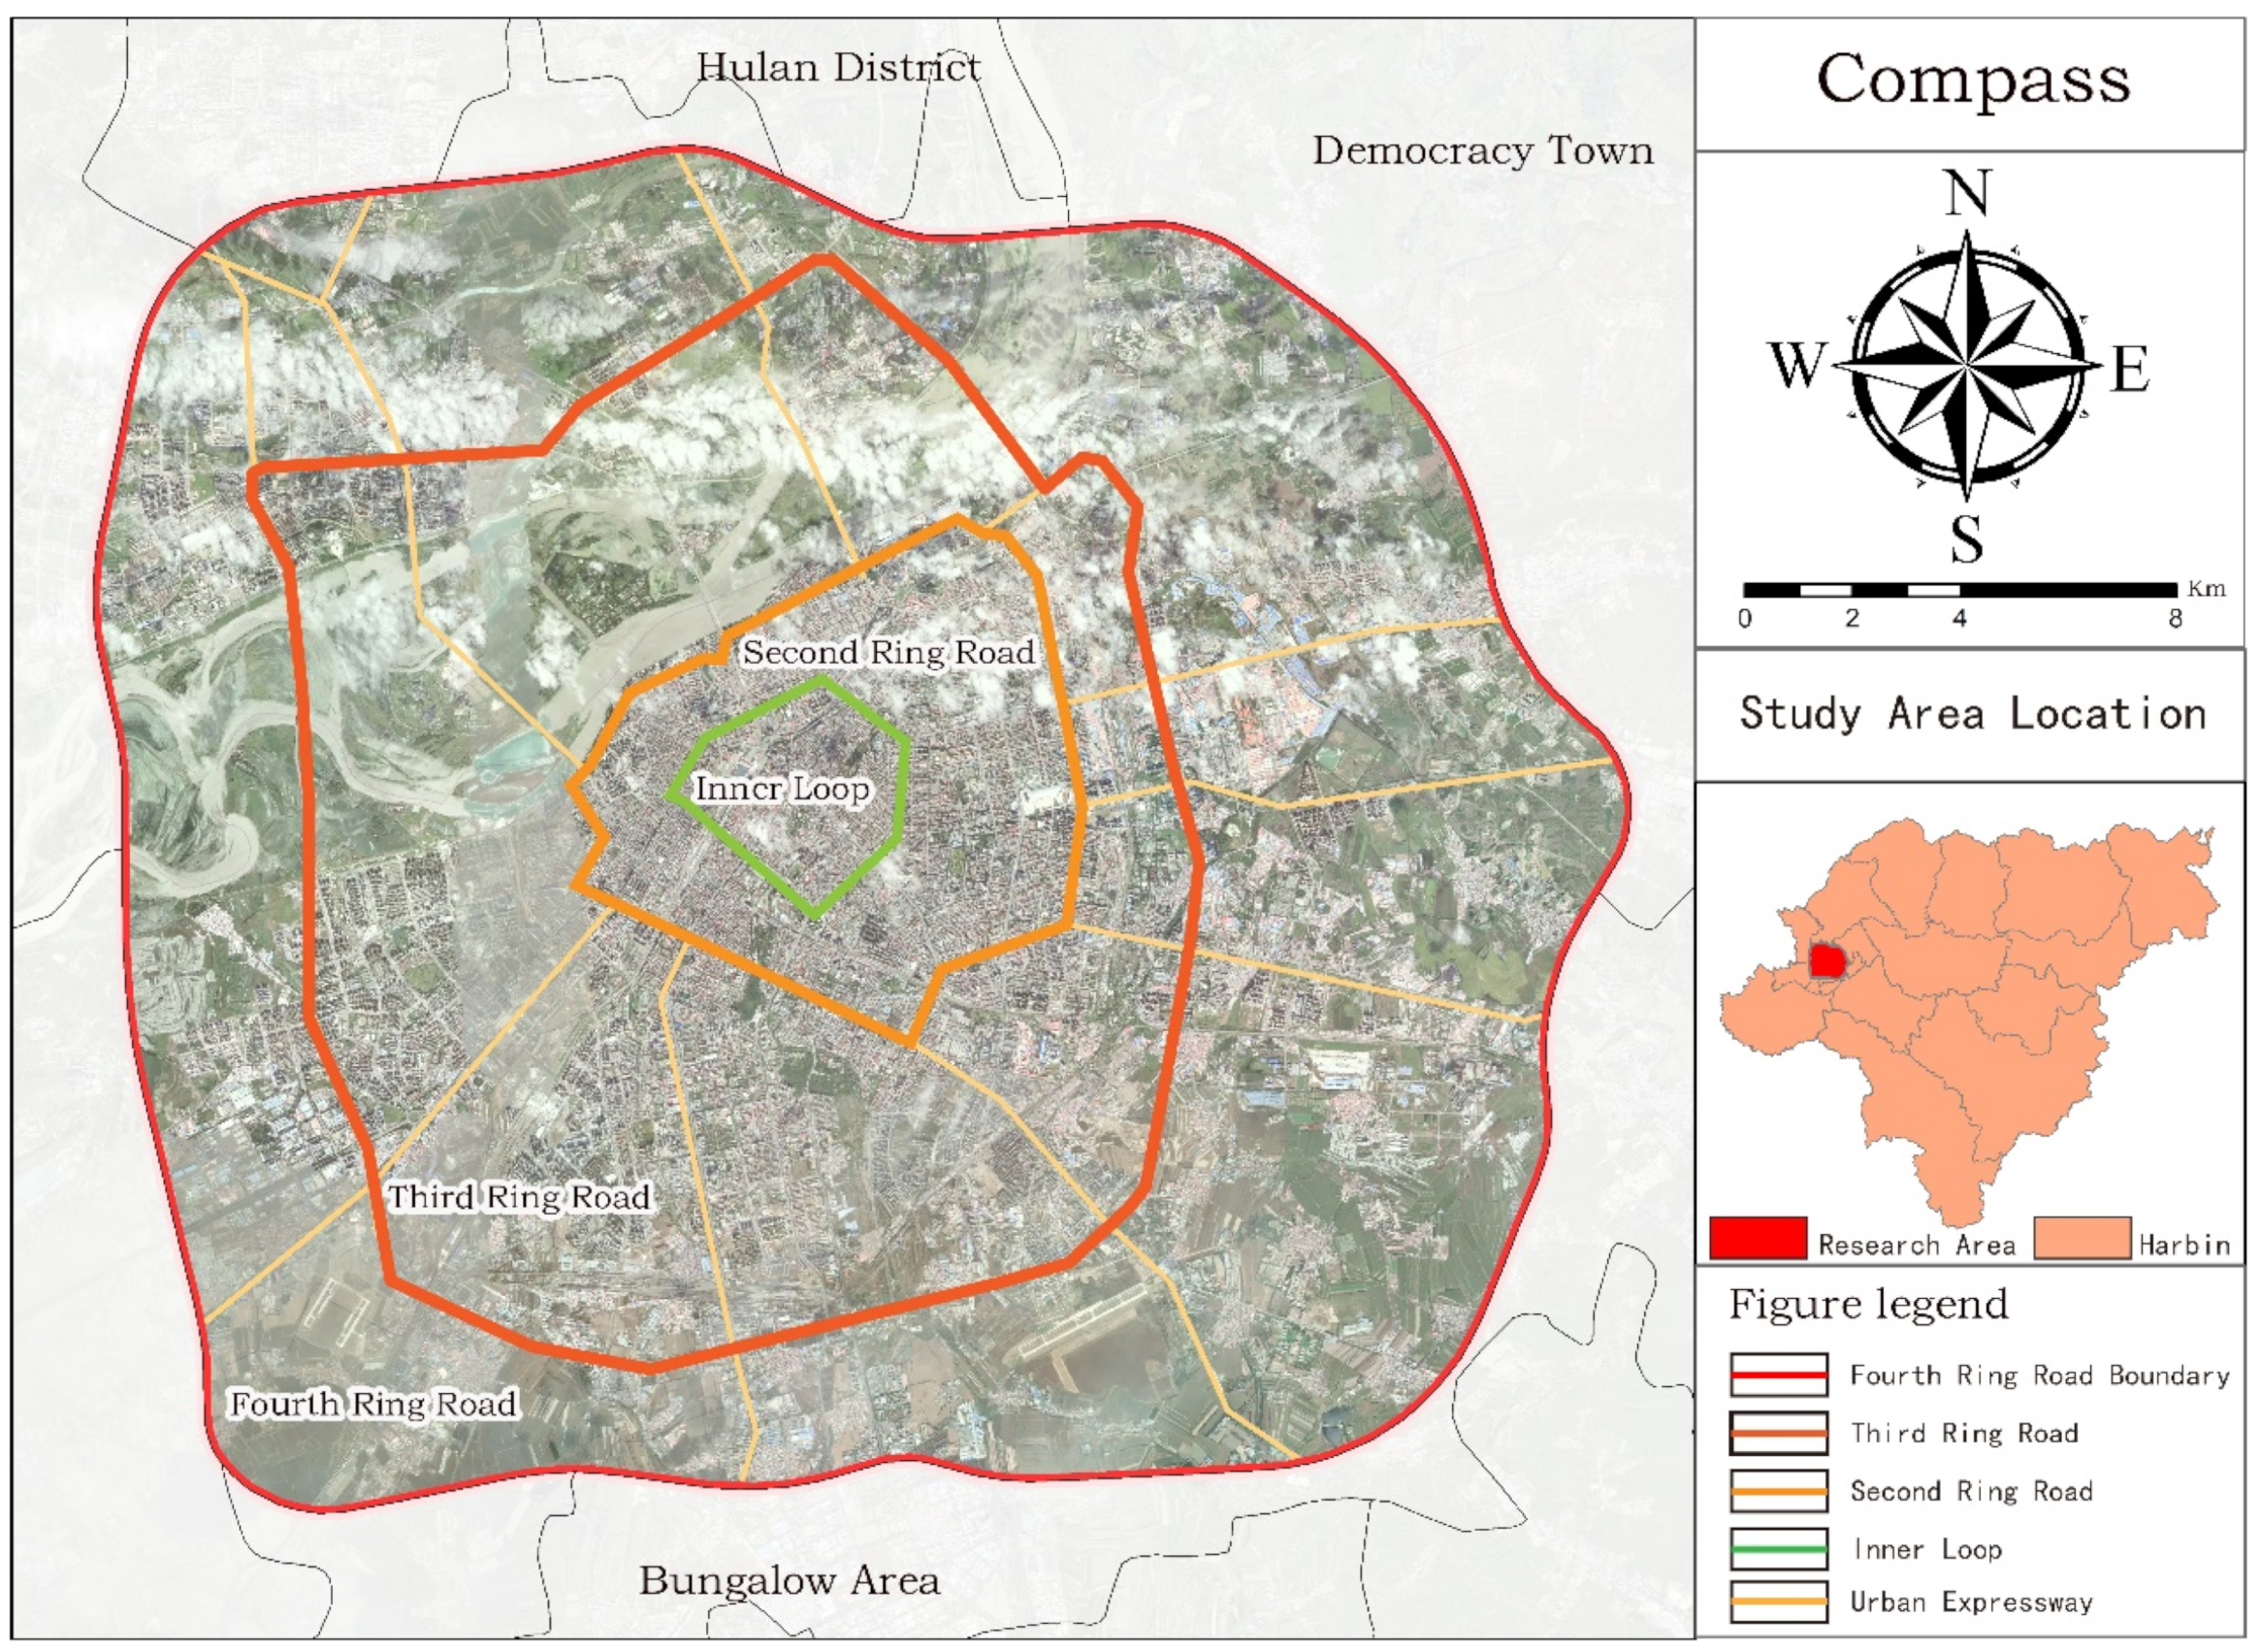
Figure 1. Diagram of the study area.
Sustainability 15 07558 g001
Figure 2. (a) Urban Road Network. (b) Point-of-interest data distribution.
Sustainability 15 07558 g002
Figure 3. (a) Heat map data (b) Building profile data.
Sustainability 15 07558 g003
Figure 4. Research Framework Diagram.
Sustainability 15 07558 g004
Figure 5. (a) Local proximity of the road network. (b) Local median of the road network.
Sustainability 15 07558 g005
Figure 6. (a) Local proximity hotspot analysis. (b) Local intermediate degree hotspot analysis.
Sustainability 15 07558 g006
Figure 7. Six functional kernel density analysis charts. (Note: The diagram shows the kernel density analysis from (af) for industrial functions, public service functions, transport functions, residential functions, green space and plaza functions, and commercial functions).
Sustainability 15 07558 g007aSustainability 15 07558 g007b
Figure 8. (a) Functional mix. (b) Functional mix hotspot analysis.
Sustainability 15 07558 g008
Figure 9. (a) Functional density. (b) Functional density hotspot analysis.
Sustainability 15 07558 g009
Figure 10. (a) Weekly average thermal intensity. (b) Thermal intensity hotspot analysis.
Sustainability 15 07558 g010
Figure 11. (a) Building density. (b) Building density hotspot analysis.
Sustainability 15 07558 g011
Figure 12. Integrated epidemic potential analysis chart. The green line represents the inner ring road boundary, the yellow line represents the second ring road boundary, the orange line represents the third ring road boundary and the red line is the fourth ring road boundary.
Sustainability 15 07558 g012
Figure 13. Distribution of high-risk locations for the new crown pneumonia outbreak.
Sustainability 15 07558 g013
Table 1. Classification of POI data within the study area of Harbin City.
TypePOI QuantityPercentage (%)
Industrial function13,8146.22%
Public Service Function35,62416.03%
Traffic function26,29711.82%
Residence function18,9878.54%
Green space and square function9050.41%
Business Function126,63956.98%
Total222,266100%
Table 2. Risk indicator weights.
Indicator ItemsFunctional MixFunctional DensityProximityIntermediate DegreesThermal StrengthBuilding Density
Weighs0.050.280.150.120.170.23
Note: The weights in the table are calculated using the entropy weighting method.
Table 3. Statistical table of high risk areas.
RegionSongbei
District
Nangang
District
Xiangfang
District
Daoli
District
Daowai
District
Number5288200
Table 4. Risk Level Segment.
Risk AreasSongbei DistrictNangang DistrictXiangfang
District
Daoli
District
Daowai
District
Total
Grade 1024415045
Grade 21346011
Grade 3400005
Disclaimer/Publisher’s Note: The statements, opinions and data contained in all publications are solely those of the individual author(s) and contributor(s) and not of MDPI and/or the editor(s). MDPI and/or the editor(s) disclaim responsibility for any injury to people or property resulting from any ideas, methods, instructions or products referred to in the content.