Article

Multidimensional Ecosystem Mapping: Towards a More Comprehensive Spatial Assessment of Nature’s Contributions to People in France

by
Stanislav E. Shmelev
1,2,3,*,
Linus Agbleze
4,5 and
Joachim H. Spangenberg
2,6
1
Environment Europe Limited, Oxford OX2 6JG, UK
2
Environment Europe Foundation Stichting, 2511CJ The Hague, The Netherlands
3
School of Management and Economics, University of Torino, Via Verdi, 8, 10124 Turin, Italy
4
Institute for Environment and Human Security, United Nations University, D-53113 Bonn, Germany
5
Rising Hope Foundation for Change eV, D-53117 Bonn, Germany
6
Sustainable Europe Research Institute SERI Germany, D-51103 Cologne, Germany
*
Author to whom correspondence should be addressed.
Sustainability 2023, 15(9), 7557; https://doi.org/10.3390/su15097557
Submission received: 21 February 2023 / Revised: 12 April 2023 / Accepted: 18 April 2023 / Published: 4 May 2023
(This article belongs to the Special Issue Smart and Sustainable Cities and Regions)

Abstract

:
Ecosystems are experiencing significant pressure from human activities, with 1 million species at risk of extinction. This is threatening to undermine the resilience of ecosystems, which provide multiple benefits to support human existence and are essential for the support of life on Earth. A number of conceptual frameworks have been developed as a guide for the assessment of ecosystem services (ESs) and nature’s contributions to people (NCPs), including Millennium Ecosystems Assessment, The Economics of Ecosystems and Biodiversity report, France’s National Ecosystems Assessment, the Common International Classification of Ecosystem Services, and the Global Assessment of the Intergovernmental Science-Policy Platform on Biodiversity and Ecosystem Services. In this paper, we compare the existing conceptual frameworks for the assessment of ESs and NCPs and derive a unified structural framework. Several indicators for characterizing the ESs/NCPs provided are selected and integrated through normalization. On this basis, and enriched by a number of culture-specific indicators, we conduct a mapping exercise illustrating the ES/NCP provision for the whole of France in a spatially explicit form based on a 1 × 1 km scale. Finally, we generate integrated maps depicting distribution patterns of different services and contributions across the landscapes of France focusing on economic, social and ecological dimensions. The results indicate that a non-monetary assessment of the complexity and diversity of NCPs is feasible and presents tangible advantages as compared to monetary frameworks. The paper concludes that provisioning, regulating and cultural services and contributions are geographically unevenly distributed and further analysis is required to assess the degree of complementarity, feedback loops and tipping points among different services. Our pilot research clearly illustrated the feasibility of conducting a highly disaggregated multidimensional assessment of ESs/NCPs at the national scale to inform decision making.

1. Introduction

Ecosystems have provided the resource base for human survival, economic progress and global development. This is manifested in their multiple contributions to different aspects of human life. They comprise direct economic use (provision of food, fiber and raw materials for a variety of sectors from agriculture to construction), multiple regulating functions (climate, soil regeneration, air purification, biogeochemical cycles) and cultural dimensions (inspiration, education, spiritual values, recreation). These contributions have long been described as “ecosystem services” [1,2,3]. More recently, the Intergovernmental Science-Policy Platform on Biodiversity and Ecosystem Services (IPBES) has suggested a different terminology to better reflect the diversity of benefits, the existence of disbenefits, and the wide variety of values attributed to them [4] based on the diversity of human value systems. The term “nature’s contributions to people” (NCPs) then replaces ecosystem services (ESs), which are part of it [5].
This unique heritage and many of its non-substitutable contributions to people are at severe risk on all levels. IPBES (2019) found that around 1 million animal and plant species are threatened with extinction, many within decades, more than ever before in human history. For instance, coral reefs are not only biodiversity hotspots, but also an essential habitat for many fish species on the human menu card. Almost 33% of reef-forming corals are threatened, and with the ongoing climate catastrophe, 90–99% of coral reefs are expected to disappear (at 1.5–2 °C global heating) [6]. At least 680 vertebrate species have been driven to extinction since the 16th century, many of them past sources of protein. More than 9% of all domesticated breeds of mammals used for food and agriculture had become extinct by 2016, with at least 1000 more breeds still threatened. As the climate crisis, causing irregular temperature and precipitation patterns, is bound to worsen, adaptability will be ever more important, but the narrowing gene pool undermines resilience [6]. For native species in most major land-based habitats, the average abundance has fallen by at least 20%, mostly since 1900. At the same time, 68% of the world’s species populations of mammals, birds, amphibians, reptiles and fish have been severely degraded or destroyed between 1970 and 2016 according to the Living Planet Report [7]. Healthy ecosystems are lost at unprecedented rates due to human intervention (more than a third of the world’s land surface and nearly 75% of its freshwater resources are now devoted to crop or livestock production) and to climate change, contributing to an ever-growing risk of new pandemics [8].
The deterioration of ecosystems and their services’ respective contributions to people is caused by the following: (1) changes in land and sea use; (2) direct exploitation of organisms and their populations; (3) the climate crisis; (4) pollution including persistent, bioactive substances and plastics; and (5) invasive alien species (IPBES, 2019) [6]. Three-quarters of the land-based environment and approximately 66% of the marine environment have been significantly altered by human actions, impinging on the contributions they can provide to people [9].
One of the primary drivers behind these worrying trends is the ever-increasing resource consumption, which has tripled since 1970 [10]. Resource mining and processing contribute to half of all greenhouse gas emissions, and to 90% of all biodiversity loss [11]. International trade tends to play an increasing role in facilitating the destruction of biodiversity, not least by spreading invasive species [12]. Key ESs/NCPs have increased significantly, but their generation is fast approaching or has already transgressed planetary boundaries [13,14]. For instance, the value of agricultural crop production has increased by about 300% since 1970, raw timber harvest has risen by 45% and approximately 60 billion tons of renewable and non-renewable resources are now extracted globally every year—having nearly doubled since 1980 [6]. It is clear that new approaches and concerted efforts are needed to reverse this dangerous trend.
Attempts to systematically describe and classify nature’s contributions have been going on for about 20 years; however, different authors are still using different, if related, terminologies. Describing the value of biodiversity and ecosystem services in economic terms has long been a dominating tendency. It was intended to aggregate all sorts of values by using a shared numeraire and to alert decision makers by using monetary figures [15,16]. However, although the concept of nature as “natural capital” is widely spread in environmental economics, the concept remains disputed [17,18,19]. One reason is the impossibility of determining market prices for non-market goods, and hence aggregating value dimensions [20,21]. A second one is the diversity of existing value systems [4], with monetary value (exchange value) being only a subcategory of instrumental values, which are themselves a subcategory of subjective values. In other value theories, going back to ancient Greece, this kind of value simply does not even exist [22].
These fundamental challenges also apply to the economic concepts of total economic value and, if discounted, the net present value, which pretend to capture different value dimensions [23] but are essentially still restricted to expressing the instrumental values held by current generations, despite all modifications suggested [22].
Consequently, when the UN Statistics tried to integrate environmental issues into a scheme based on the System of National Accounts (SNA), they chose an approach combining monetary and physical data in the System of Environmental Economic Accounting, and in the latest extension, the System of Environmental Economic Accounting–Ecosystem Accounting [24]. Finally, the limited use made of monetary assessments of ecosystem value in real-world decision making, and hence outside the economics profession, is not a result of understanding or willingness on the side of decision makers in politics and planning as many economists believe, but a result of their limited usefulness in decision making. While monetary figures can be impressive, decision makers prefer information in the units used in real-world assessments, initiatives and monitoring [25].
The differences between the various classification schemes for types of ESs/NCPs have led to the situation where there is the risk that the use of one framework inherently leads to analysis of some ESs/NCPs at the expense of others, covered by other systems. As a result, comprehensively accounting for all the multiple and overlapping ESs/NCPs in a landscape would not possible under any single approach. Choices would have to be made, but need to be transparent, and each assessment would be understood as providing a partial picture, which could be enriched by adding different approaches. These divergences can be in the services and contributions identified, and regarding the way they are assessed or measured. Hence, the first objective of this paper is to comparatively review the various ES/NCP classification schemes to find out if the sets of ESs/NCPs covered tend to converge. If so, normalization of the results would allow, independent of the individual methodologies used, the aggregation of the findings in a systematic fashion. On this basis, common indicators could be defined, with qualities corresponding to their purposes. Such indicators need to fulfil five core quality criteria (from [26], modified). They have to be (i) indicative; i.e., an indicator must be truly representative of the phenomenon it is intended to characterize. They must be (ii) derived from a sound scientific basis (which can be a challenge in particular for interdisciplinary work where few integrative methodologies and cross-cutting datasets are available). Indicators must be (iii) relevant; i.e., they have to cover crucial aspects of sustainable development. Moreover, they have to be (iv) transparent; i.e., their selection, calculation and meaning must be obvious even to non-experts. Finally, good indicators should be (v) measurable; i.e., they should be based as far as possible on data that are easy to access and to update. Such data do not necessarily have to be cardinal figures but can also be ordinal or (least meaningful but easiest to derive) nominal metrics. In many cases, indicators will have to be based on spatially explicit assessments, a rapidly developing field, but with still urgent research needs [27,28].
Furthermore, to generate a simplified but sufficiently reliable description of reality, indicator methodologies must be chosen to ensure that the resulting indicators are reproducible, to be endorsed by the relevant scientific and political communities; robust, i.e., immune to small variations in data and methodology not indicating a changing trend; and general, i.e., not specific for a single case but broadly applicable.
Finally, for successful monitoring, indicators must be sensitive, i.e., react early and clearly to relevant changes in what they are intended to monitor.
For obvious reasons, it is neither necessary nor possible at all times to meet all these criteria to the same extent (for instance, the more robust an indicator is, the less sensitive it may be).
The second objective of our study is then to use the shared categories to identify suitable indicators, and enrich them with some cultural-specific, territory-based indicators to enhance local resonance and derive a comprehensive indicator set. Then this set will be used in spatially explicit mapping, showing the distribution of the jointly identified and the additional cultural indicators, and by overlaying the maps, an integrated ES/NCP distribution mapping will be generated as an innovative basis for communication, planning and decision making (for details of the methodology used, see the Supplementary Materials).

2. Comparative Analysis of Classification Schemes

ES/NCP assessment and monitoring require the identification and categorization of services/contributions, selection of the assessment method, selection of indicators and analysis of the indicators [29]. Identification and categorization of services/contributions are strongly influenced by the conceptual approach of the respective framework. The first ground-breaking effort was the Millennium Ecosystem Assessment; its classification of ESs was a milestone, both for science and for policy development [29,30]. However, as IPBES found, many ecosystem services as defined in the MA framework belong to more than one category, constituting a challenge in evaluation exercises. The state of the art is now the system suggested and used by IPBES, which acknowledges different dimensions of value and integrates the knowledge of local and indigenous communities [31]. The 2019 launch of the Global Assessment significantly enhanced the interest in the subject of ecosystems and biodiversity [6], and the growing recognition of the economic and social importance of ESs/NCPs contributed to the growing perception of policy relevance [32,33].
From a comparative analysis of the ES/NCP classification schemes, we will select a set of joint and hence rather archetypical landscape characteristics in Section 3, as the basis for the spatial distribution analysis in Section 4.
The set of classification schemes we compare comprises the Millennium Ecosystem Assessment [29], The Economics of Ecosystems and Biodiversity [16], the IPBES Global Assessment on Biodiversity and Ecosystem Services [6] and the Common International Classification of Ecosystem Services [34]. Between them, these frameworks exhibit subtle differences in the extensive sets of indicators, sometimes based on readily available data but not easily communicated. For the latter, we will propose an alternative framework based on the work of Shmelev [9,35,36] in Section 3.

2.1. Classification of Ecosystem Services (ESs) by Millennium Ecosystem Assessment

The MA classification of ecosystem services distinguishes provisioning, cultural, regulating and supporting services. Provisioning services are the tangible materials such as food, fiber and water directly obtained as benefits from ecosystems [29,37,38]. Regulating services are provided by ecosystem processes improving the quality and quantity of goods and services enjoyed by humans. They include climate regulation, water regulation, pollination and pest control [39]. Cultural ESs are by definition non-material; most often, they provide non-economic benefits such as aesthetic values, recreation and spiritual and religious values [40]. Supporting services are a residual category, encompassing all ecosystem functions that indirectly support the production of provisioning, regulating or cultural services [41]. For instance, soil formation and nutrient cycling support crop production [42]. The support generated by other ecosystem processes may be still unknown, but they are nonetheless already classified as supporting ESs, which makes the category a very open one. Among others, the MA [29] framework for categorizing ESs has been criticized for being less intuitive to decision makers who need to strive for goals that are easily aligned with their development objectives. As there is no scientific criterion to rule out, at any point in time, that an ecosystem function under consideration will in due time be found to be a supporting ESs, this category has been given up in most subsequent approaches, and the supporting ESs have been classified as ecosystem functions. Nonetheless, the MA, which explicitly refused monetary valuation of ecosystems and their services, was a major breakthrough in ES research.

2.2. Classification of Ecosystem Services by TEEB

Many mainstream economists were convinced that monetization of the values of ESs would be an effective way towards better integrating ecosystem services into policies, and hence economic valuation approaches were at the core of initiatives such as TEEB, The Economics of Ecosystems and Biodiversity [16]. However, this led to not only a neglect of the intrinsic values of ecosystems which are difficult to evaluate monetarily, but also—like in in many other economic studies—a limited regard for social benefits of ecosystem services [9,35]. To ecological economists, this came as no surprise—already Martinez-Alier et al. [43] in their seminal paper demonstrated that incommensurability of values is an important foundation of ecologically enlightened economics and, therefore, any attempt to reduce ecosystems complexity to one dimension would lead to distortions. Building upon such arguments, many critical economists including Norgaard [44], Spangenberg and Settele [19], Söderbaum [45] and Gomez-Baggethun et al. [46] have provided detailed critique of the monetary assessment approaches.
Mainstream economists considered the rejection of the monetary valuation of ESs as a major deficit; the Economics of Ecosystems and Biodiversity process TEEB was intended to fill this perceived gap. Focusing on economic valuation of ecosystem services, the TEEB framework proposed that almost all ecosystem services from the various categories can be aggregated and measured in monetary units [16]. According to Mace et al. [30], the aggregate, called the total economic value (TEV), can be assessed by adding up use values and non-use values. Direct use value is directly linked to utilization of ecosystem services for individual well-being in the form of consumption of food and raw materials, among others. The market value of such tradable ecosystem services is generally known.
Indirect use value is attributable to (shared) benefits without market value; regulating services such as climate regulation can be cited as examples [16], but there are no tools to determine a market price for them. Non-use values are essentially contributions to well-being without market value and are categorized as bequest and existence values. Existence value includes enjoying knowing that ice bears still exist, without any intention to visit them. Bequest value would then be the value attributed to the fact that following generations have the opportunity to do so as well. Cultural services such as religious and spiritual values are also classified as non-use values, but pose greater valuation difficulties. Non-use values are not traded and hence have no price; asking people for their “willingness to pay” is no substitute as it represents only one side of a market process, and the willingness–action gap is well known in social sciences. Both use values and non-use values recognize option values which encompass potential direct and indirect values yet to be harnessed [30]. These concepts are used to explain the spatial variation of ecosystem services. For instance, the abundance of forest resources in one region as compared to others is explained as a result of people prioritizing its direct use value over its (non-use) bequest value—an explanation contradicting local experience.
An additional source of uncertainty is that economists tend to discount future events to generate value figures for today, but the choice of the discounting function [47] and its parameters are fiercely disputed [48,49]. As a result, the monetization approach is violating several key conditions for good indicators such as sound scientific basis, transparency, reproducibility and robustness, while others such as relevance and indicativeness are disputed. The basic assumption behind the TEEB approach, that almost all ecosystem services from the various categories can be aggregated in monetary units, fails due to the inherent incommensurability of values; thus, a multidimensional approach is required [35].

2.3. France National Ecosystem Service Assessment (France NEA)

The French national conceptual framework for ES assessment [50] adopted conceptual approaches consistent with MA, IPBES, The EU process “Mapping and Assessment of Ecosystems and their Services” (MAES) [51], and the Common International Classification of Ecosystem Services [34]. The France NEA categorized ecosystem goods and services into goods from ecosystems, regulatory services and cultural services.
Ecological functions (not services!) identified in France NEA correspond with supporting services in MA [29]. Moreover, the France NEA framework differentiates between cultural ecosystem services and natural heritage in addition to maintaining that ecological functions were different from ecosystem services based on the extent of human interaction with the ecosystem [50]. Where goods obtained from the ecosystem do not benefit from additional human contributions or support, they are considered as ecological functions [50]. Aesthetic and spiritual values were categorized as natural heritage in France NEA and not as cultural service as in other conceptual frameworks. In terms of indicators considered, considerable differences are noted between France NEA and other conceptual frameworks. For instance, water quality regulation was assessed with the indicator “reduced water treatments costs”. The numerous differences between the France NEA and other conceptual frameworks, in the definition of indicators more than in the types of ESs/NCPs recognized, provide evidence in support of recommendation for standardization of terminologies for ES/NCP discussions and assessments [52], as was suggested by the CICES approach.

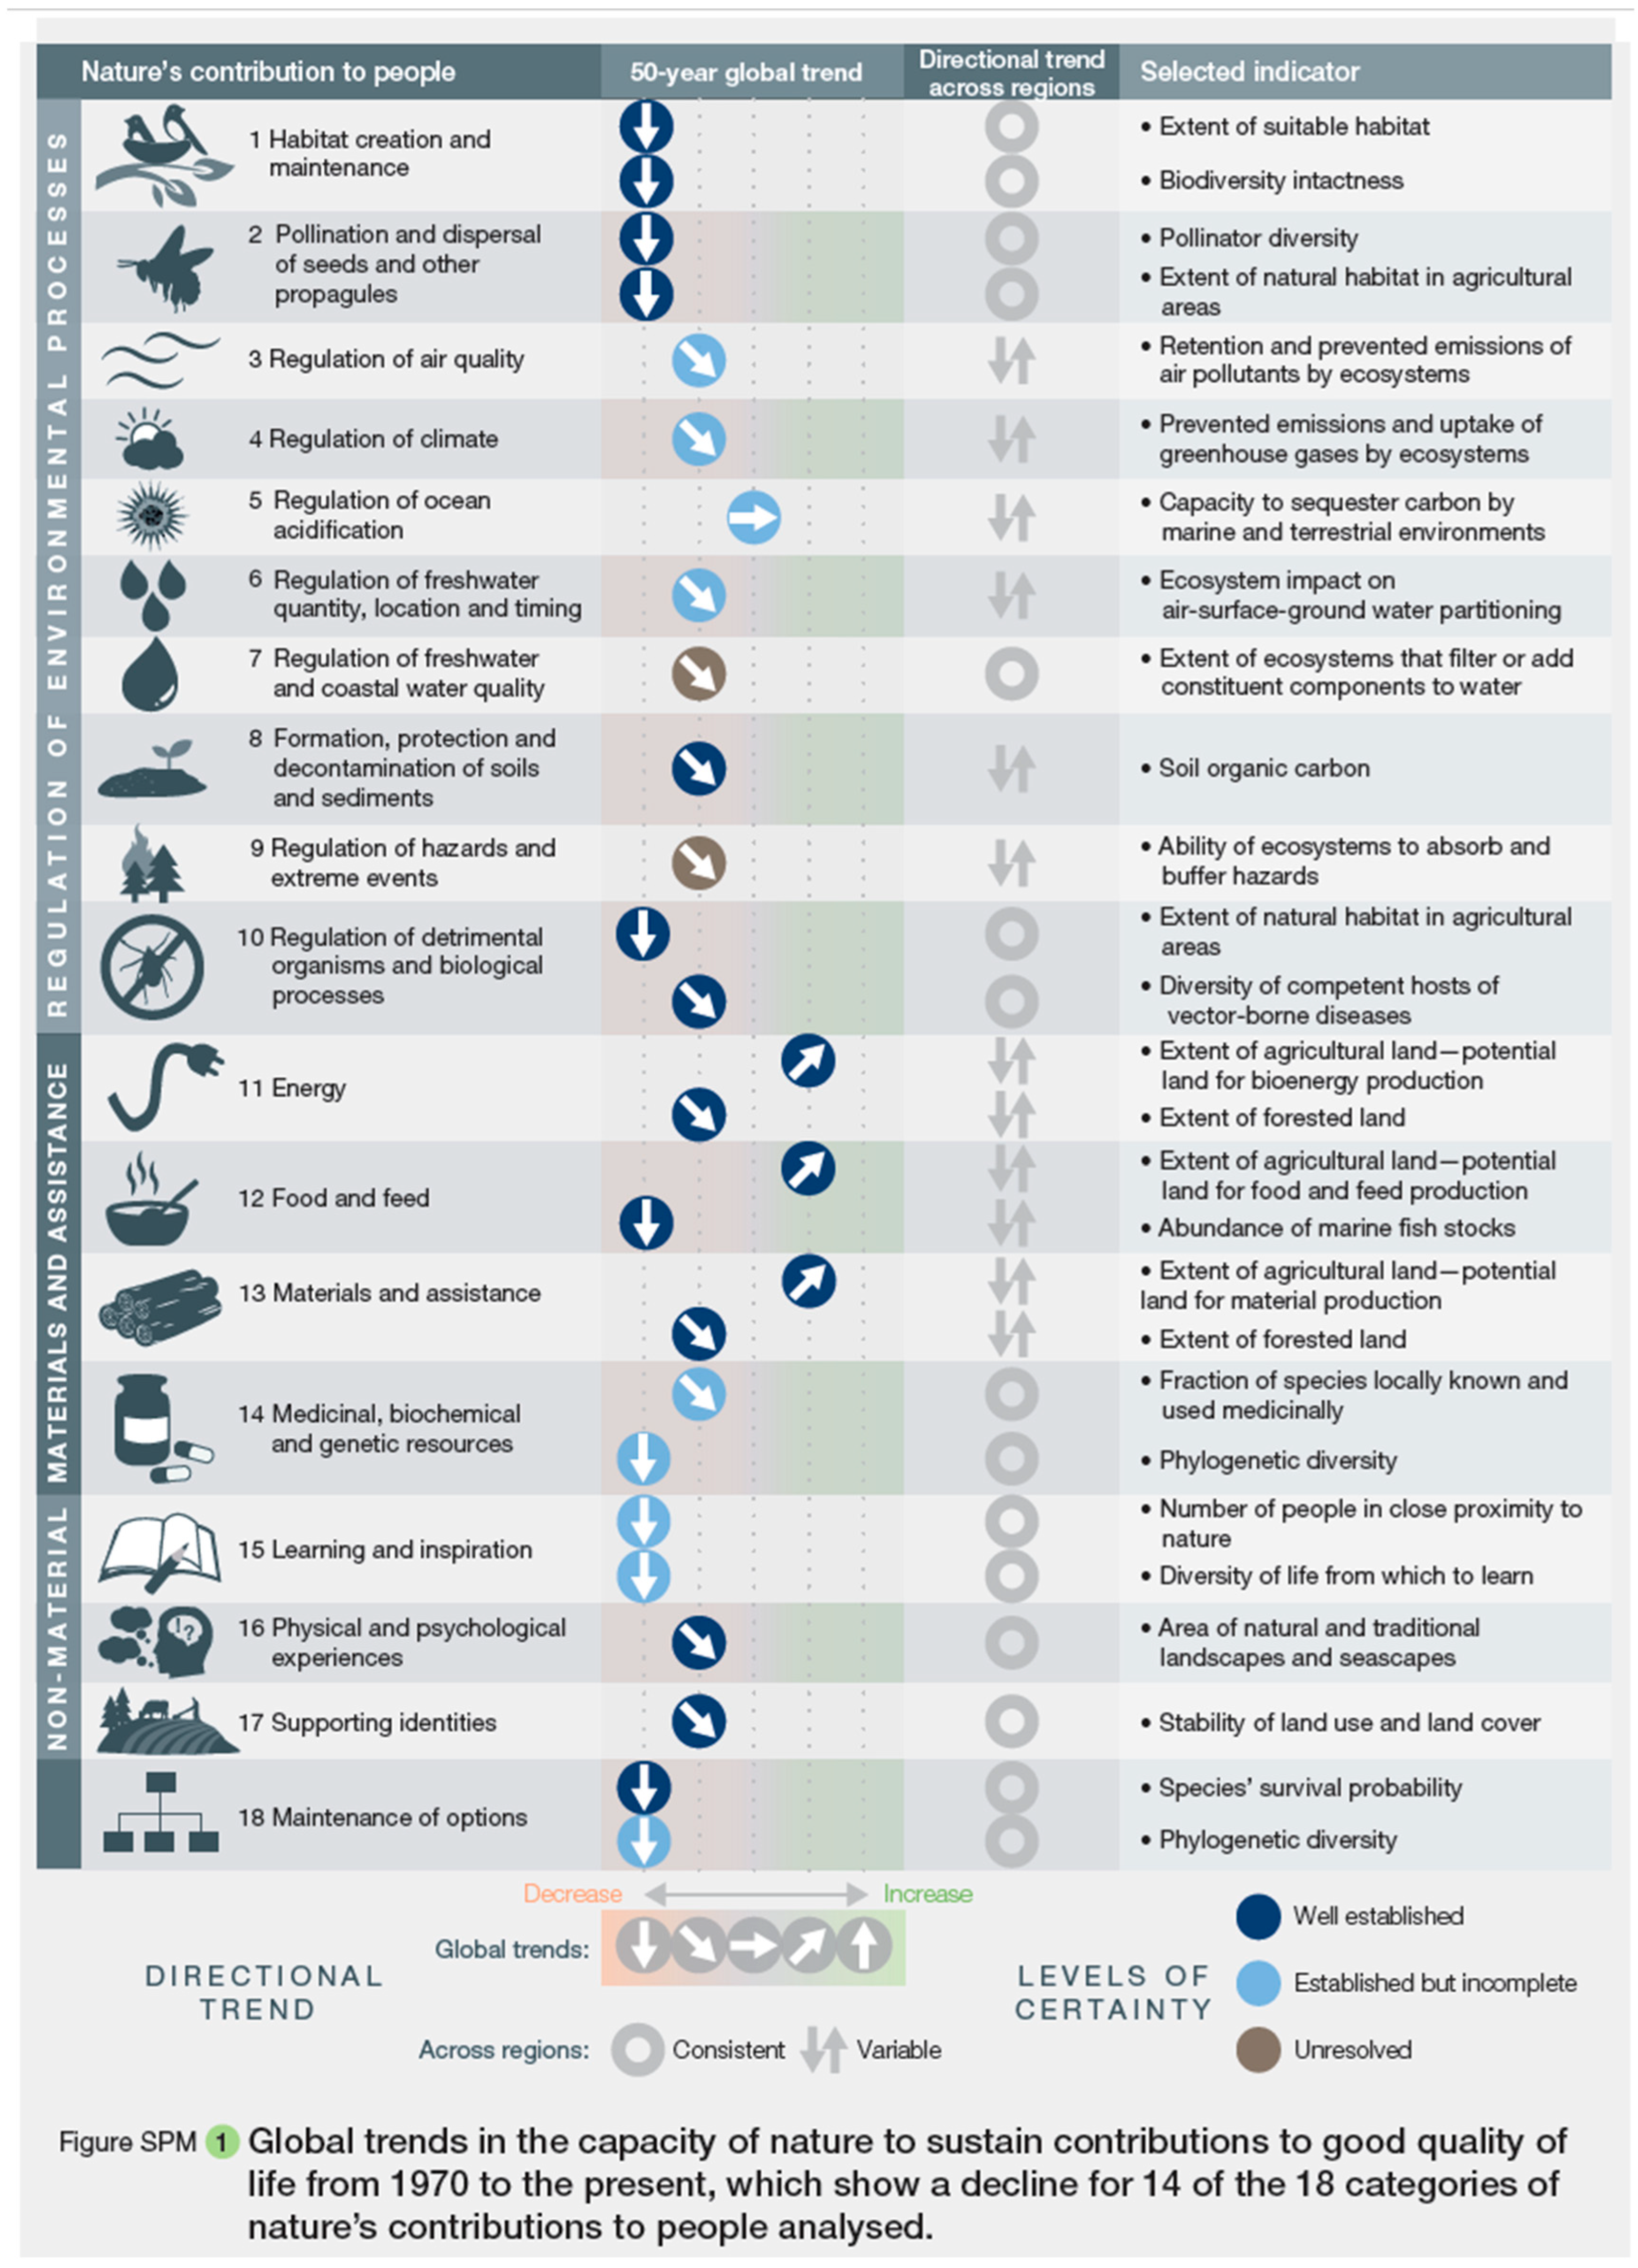
2.4. Classification of Nature’s Contributions to People by IPBES (from [6])

Nature’s contributions to people, the term used by IPBES instead of ESs, is not a synonym as it refers to all the contributions that humanity obtains from nature. Ecosystem goods and services, considered separately or in bundles, are included in this category (Figure 1). Within other knowledge systems, nature’s gifts and similar concepts refer to the benefits of nature from which people derive good quality of life. Aspects of nature that can be negative to people (detriments), such as pests, pathogens or predators, are also included in this broad category. Like most other systems since the MA, it distinguishes material, non-material and regulating contributions. Nature’s regulating contributions to people refers to functional and structural aspects of organisms and ecosystems that modify the environmental conditions experienced by people, and/or sustain and/or regulate the generation of material and non-material contributions. For example, these contributions include water purification, climate regulation and the regulation of soil erosion.
Nature’s material contributions to people are substances, objects or other material elements from nature that sustain people’s physical existence and the infrastructure (i.e., the basic physical and organizational structures and facilities, such as buildings, roads and power supplies) needed for the operation of a society or enterprise. They are typically physically consumed in the process of being experienced, such as when plants or animals are transformed into food, energy, or materials for shelter or ornamental purposes. Nature’s non-material contributions to people are nature’s contributions to people’s subjective or psychological quality of life, individually and collectively. The entities that provide these intangible contributions can be physically consumed in the process (e.g., animals in recreational or ritual fishing or hunting) or not (e.g., individual trees or ecosystems as sources of inspiration).
Based on this definition, IPBES identified 18 contributions of nature to people in these categories ([6], Supplementary Materials to Section 2.3). This is not exhaustive (numerous ESs mentioned in other systems are not covered by the list of 18, although analyzed in the full report), but according to transdisciplinary assessments and stakeholder consultations, including local and indigenous communities, they cover the relevant ESs, which is supported by sometimes rather open definitions. The main utility of the IPBES framework [6] for NCP assessments is its clear-cut discernible categorization of ESs/NCPs, including indicating the respective contributions of nature and human agents and the significant overlaps and mutual influences of different NCPs. For each NCP, IPBES suggested indicators along the causal chain from potential nature’s contributions via the output of the joint production (co-production of nature and humans) to the ultimate objective, the impact on good quality of life.

2.5. Common International Classification of Ecosystem Services (CICES)

The need for standardization in a manner that allows cross-comparison between the various conceptual frameworks has been the motivation for developing CICES, and its regular updates [52]. It comprises all categories used by the conceptual frameworks of MA, TEEB, and in its 2018 version, IPBES [53]; the equivalences for the MA, TEEB and IPBES indicators and ES/NCP categories can be viewed on the V5.1 spreadsheet [54]. The aim of CICES is not to replace other classifications of ecosystem services but to enable people to move more easily between them and to understand more clearly how people are measuring and analyzing information.
At the highest level in the classification, ESs/NCPs are grouped into three sections relating to whether the contributions to human well-being (defined by IPBES as the result of NCPs) support the following:
(a)
The provisioning of material and energy needs;
(b)
Regulation and maintenance of the environment for humans;
(c)
The non-material characteristics of ecosystems that affect the physical and mental states of people, that is, their cultural significance.
To emphasize the “purposeful” nature of CICES classes, the definition of each service is made up of two parts, namely a clause describing the biophysical output (i.e., the “ecological clause” noting what the ecosystem does) and a clause describing the contribution it makes to an eventual use or benefit (“use clause”).
To enable navigating between the various conceptual frameworks, CICES adopted a hierarchical structure comprising five levels of classifying ESs. Thus, an ES/NCP is classified based on section, division, group, class and class type in a manner that is progressively in-depth. For instance, the class type of cereals belongs to the class of cultivated plants for nutrition, which is part of the group “cultivated plants”, which in turn is part of the division “biomass” which of course belongs to the section of provisioning ESs/NCPs [54].

2.6. Conceptual Frameworks: Overlaps Dominating, but Relevant Differences

The conceptual frameworks of MA [29], TEEB [16], France NEA [50], CICES [34] and IPBES [6] exhibit a high number of overlaps, but also illustrate some of the difficulties a comprehensive characterization of the ESs/NCPs of any landscape poses (Table 1). We can also see an evolution over time from the groundbreaking first major assessment, the MA in 2005. For instance, the “supporting services” of the MA have either been transformed into elements of contributions actually delivered (as in the IPBES scheme), or been reclassified (without denying their importance!) as ecosystem functions, since their contribution to generating ESs/NCPs is indirect and not readily available for human use until further processing by the ecosystem. Hence, they no longer appear in the list of services. Economic assessment categories capture many of the provisioning services, but fail for regulating and cultural ESs/NCPs. Hence, they have been recognized as suitable for assessing economic impacts resulting from use of different management strategies, and not the absolute ecosystem value [15]. In the later ES/NCP characterizations, they are used in this way, contributing indicators for a specific aspect of specific provisioning ESs/NCPs.
Another evolutionary step is the increasing number of socio-cultural aspects included in the different assessments, with the biggest gaps in the 2005 MA and the 2010 TEEB. IPBES, as the latest approach in the set we analyzed, adds one dimension not explicitly covered by other assessments, the “maintenance of options for the future”, which is not identical with but corresponds to the bequest values addressed by TEEB.
Interestingly, the two latest approaches cover the same set of ES/NCP categories, while being of a very different, almost antagonistic structure. The very structured, hierarchical approach of CICES allows the clear description of hundreds of ESs, each in isolation with clear delineations from neighboring ESs, let alone others further away in the classification scheme. While it includes the same co-produced ESs/NCPs as the IPBES scheme, it does not as systematically describe the human contribution to every ESs, as the IPBES does for every NCPs. Another novelty with the IPBES approach is that it accounts for disservices—a necessary step as what is positive for one group of beneficiaries can at the same time have negative impacts on other stakeholders, depending on their economic and socio-cultural situation and status.
IPBES, like CICES, covers all categories, but with broader definitions, admitting overlaps and dynamic interactions between NCPs. It even indicates that such ESs/NCPs can belong to more than one category, making attempts to aggregate NCPs in multidimensional assessments all but impossible. This points to the limitations of clear-cut hierarchical order approaches in a complex developing system as dynamic as the co-evolving nature–society system, and its contributions to people. The challenge is not specific to NCPs; in general, adding up factors in multidimensional systems leads to incommensurability problems [43], and in nonlinear, dynamically evolving systems, it does not provide a system description which would allow deeper understanding and sustainable management [55]. How provisioning, regulatory and cultural ES/NCP types correspond to policy frameworks such as the UN Sustainable Development Goals (SDGs) has been illustrated by CICES, on the homepage hosted by the European Environment Agency [54]. However, a harmonization of monitoring and reporting systems for ESs/NCPs and the SDG indicators still appears some way off.
Finally, a commonality of all systems described is that they are data-heavy, not spatially explicit and hence not easy to communicate to local stakeholders. Being general categories and indicators, they are necessarily abstract, not related to objects stakeholders are familiar with in their day-to-day surroundings—which is impinging on their intuitiveness and resonance. Following the Driver–Pressure–State–Impact–Response (DPSIR) approach spearheaded by the EEA and also used by the European Statistical office, we can classify most of them as State indicators (Figure 2). Fewer indicators monitor the pressures (in IPBES parlance, the direct drivers) on ecosystems and their services/contributions, and almost none—with some of them discussed in TEEB and IPBES—monitor the underlying driving forces (IPBES: indirect drivers). However, based on past experience with local sustainable development indicators, we hold that impacts are what create resonance. The most prominent example may be the water quality indicator chosen in Seattle, USA, which did not refer to chemical measurement, but took “wild salmon runs through local streams” as an indicator resonating with the local population [56].

3. Indicator Development Methodology

3.1. Data and Processing

Secondary data from reliable sources such as European Environment Agency Copernicus program, European Commission Joint Research Centre (EC JRC), Harvard Dataverse, European Soil Data Centre (ESDAC), Open Street Maps (OSM) and UNESCO World Heritage Sites were used for geospatial analysis [57,58,59,60]. The data were in different formats, including raster, point and polygon data and even text for which spatial formation such as coordinates had to be retrieved for analysis (details on the methodology and corresponding references are available in the Supplementary Materials). In total, 39 datasets were used to assess 33 indicators of provisioning, regulating and socio-cultural ESs/NCPs on a 1 × 1 km grid for the whole of France. Different pre-processing techniques were applied to different data formats to produce raster datasets which were aggregated. Of course, each such aggregation implies a loss of detail, but this appeared acceptable for the purpose of broad communication. The main tools used for the analysis were ArcGIS 10.5.1 and QGIS 3.6.
General techniques applied to all datasets included projection, clipping of datasets with France shape file, resampling to 1000 m resolution and normalization. ArcGIS geoprocessing environment settings were modified to appropriately reflect the phenomena being analyzed. Cubic convolution was chosen as the dataset resampling method given that ESs/NCPs are mostly continuous features, spatially distributed without abrupt boundaries. Given the difference in units of measurement and incommensurability among the various datasets, normalization was undertaken using the minimum–maximum (min-max) method. This implies that datasets were rescaled to a scale of 0 to 1 in most cases; hence, no absolute values, but only relative values, could be used for mapping (with of course debatable benchmarks). Castro et al. (2015) [61], Mokondoko et al. (2018) [62] and Maes et al. (2012) [63], among others, have used this method for similar analyses. Higher values towards 1 indicate higher levels of ESs/NCPs, and lower values towards 0 indicate lower levels of ESs/NCPs. In order to maintain a consistent relation between indicators and environmental state, certain indicators such as Particulate Matter 2.5 (PM2.5) were calculated to be an inverse of the actual datasets. For this, higher pixel values were transformed to 0 while lower pixel values were transformed to 1. This depicts a negative relationship between air quality and PM2.5, where a lower PM2.5 value indicates high air quality and a higher PM2.5 value demonstrates lower air quality. However, while the expression of air quality with respect to particulate matter is straightforward using this method, the impact of elements of nature on PM2.5 concentration is anything but unambiguous. Plants can emit particulate matter, forest fires do so massively, and the reduction of PM2.5 concentration by urban green infrastructure can be significant, but depends on co-factors such as water availability and spatial organization of green spots. So, the use of this indicator is disputable, despite the relevance of air pollution for many citizens.
Point datasets were extracted from OSM. Land use, place of interest (POI) and place of worship OSM point feature classes were used as inputs. From the OSM land use feature, orchards, parks, recreation grounds and vineyards were extracted while archaeological sites, attraction sites, campsites, hunting stands, monuments, observation towers, parks, picnic sites, playgrounds, theme parks and wayside shrines were extracted from POIs. All features from the OSM places of worship were used. Further, the extracted features were grouped based on the ESs/NCPs they represented and the union of the datasets created. Ecotourism was assessed using a dataset of camping sites, picnic sites, playgrounds, theme parks and archaeological sites—again a subjective and hence disputable combination of data. Places of worship and wayside shrines were used to represent the spiritual and religious value ES. To evaluate the amount of ecosystem services produced at a location, kernel density estimation was undertaken and deduced to correspond with a flow of cultural services. In estimating kernel density of the dataset of springs as a water provisioning service, discharge was used as the population field in ArcGIS to estimate an output where springs with higher discharge have higher pixel values as a proxy of water provision. Of course, springs are not the only freshwater source (so the indicator stands for only a part of the supply), and the granularity of the kernel calculation was not very high, but at least the indicator should be resonant, given the experience with dry periods in the recent past.
Datasets in polygon formats were converted to raster datasets and aggregated accordingly. Sixty-two tree species were analyzed in this manner. The results indicated regions where higher amounts of tree species correspond to a higher level of forest genetic resources. This is equally true for fish species and other datasets analyzed. Finally, aggregation of all pre-processed datasets was undertaken, and their mean was estimated to illustrate how an integrated presentation of ES/NCP impacts can be visualized. The detailed table of all data sources for individual layers in our assessment is contained in a supplement to this paper.

3.2. France as Study Area

The French mainland, used interchangeably as France in this research, covers an area of about 558,776 km2 [64]. The climate of France is mostly temperate but is not uniform across all regions [65]. Western France, covering the regions of Atlantic Loire, Brittany, Loire Valley and Normandy, is characterized by an oceanic climate with moderate annual temperature variations and average rainfall covering many days (France.fr, 2020). Temperatures are such that Brest records an average of 6 °C and 16 °C in January and July, respectively [66]. Influences of continental climate are witnessed in Central and Eastern France where hot summers and cold winters are typical [65]. Southeastern France is more characterized by a Mediterranean climate where summers are hot and dry, and dampened by rainfall from October to April [67,68]. As regional temperature varies, the annual average temperature decreases towards the north, with 15 °C recorded in Nice and 10 °C in Lille in Northern France [66]. Annual rainfall averages more than 1270 mm at high altitudes in Northwestern France, Massif Central, Jura and Alps [66].
The influence of climate on biogeography is evident in France, which has two distinct biogeographic vegetation zones [69]. The holarctic biogeographic vegetation zone covers the larger part of France [64], characterized by natural vegetation with trees such as oak, pine, cypress and hornbeam; mountain pastures in some regions; and artificial features such as heathland [50]. The second biogeographic vegetation zone lies in the Mediterranean climatic zone where xerophytic plants strive [64]. Nationally, forest covers an area of 58,000 square miles and predominates the highlands of the Ardennes and Vosges, Jura, Alps and Pyrenees [64,66]. Poor soils in the Sologne plain are able to support lowland forest [66]. The French attach a greater recreational value to their forest than the material benefit of it being a source of wood and non-wood forest products [66]. This is particularly so for those found in urban centers such as Fontainebleau and the Île-de-France region [66].

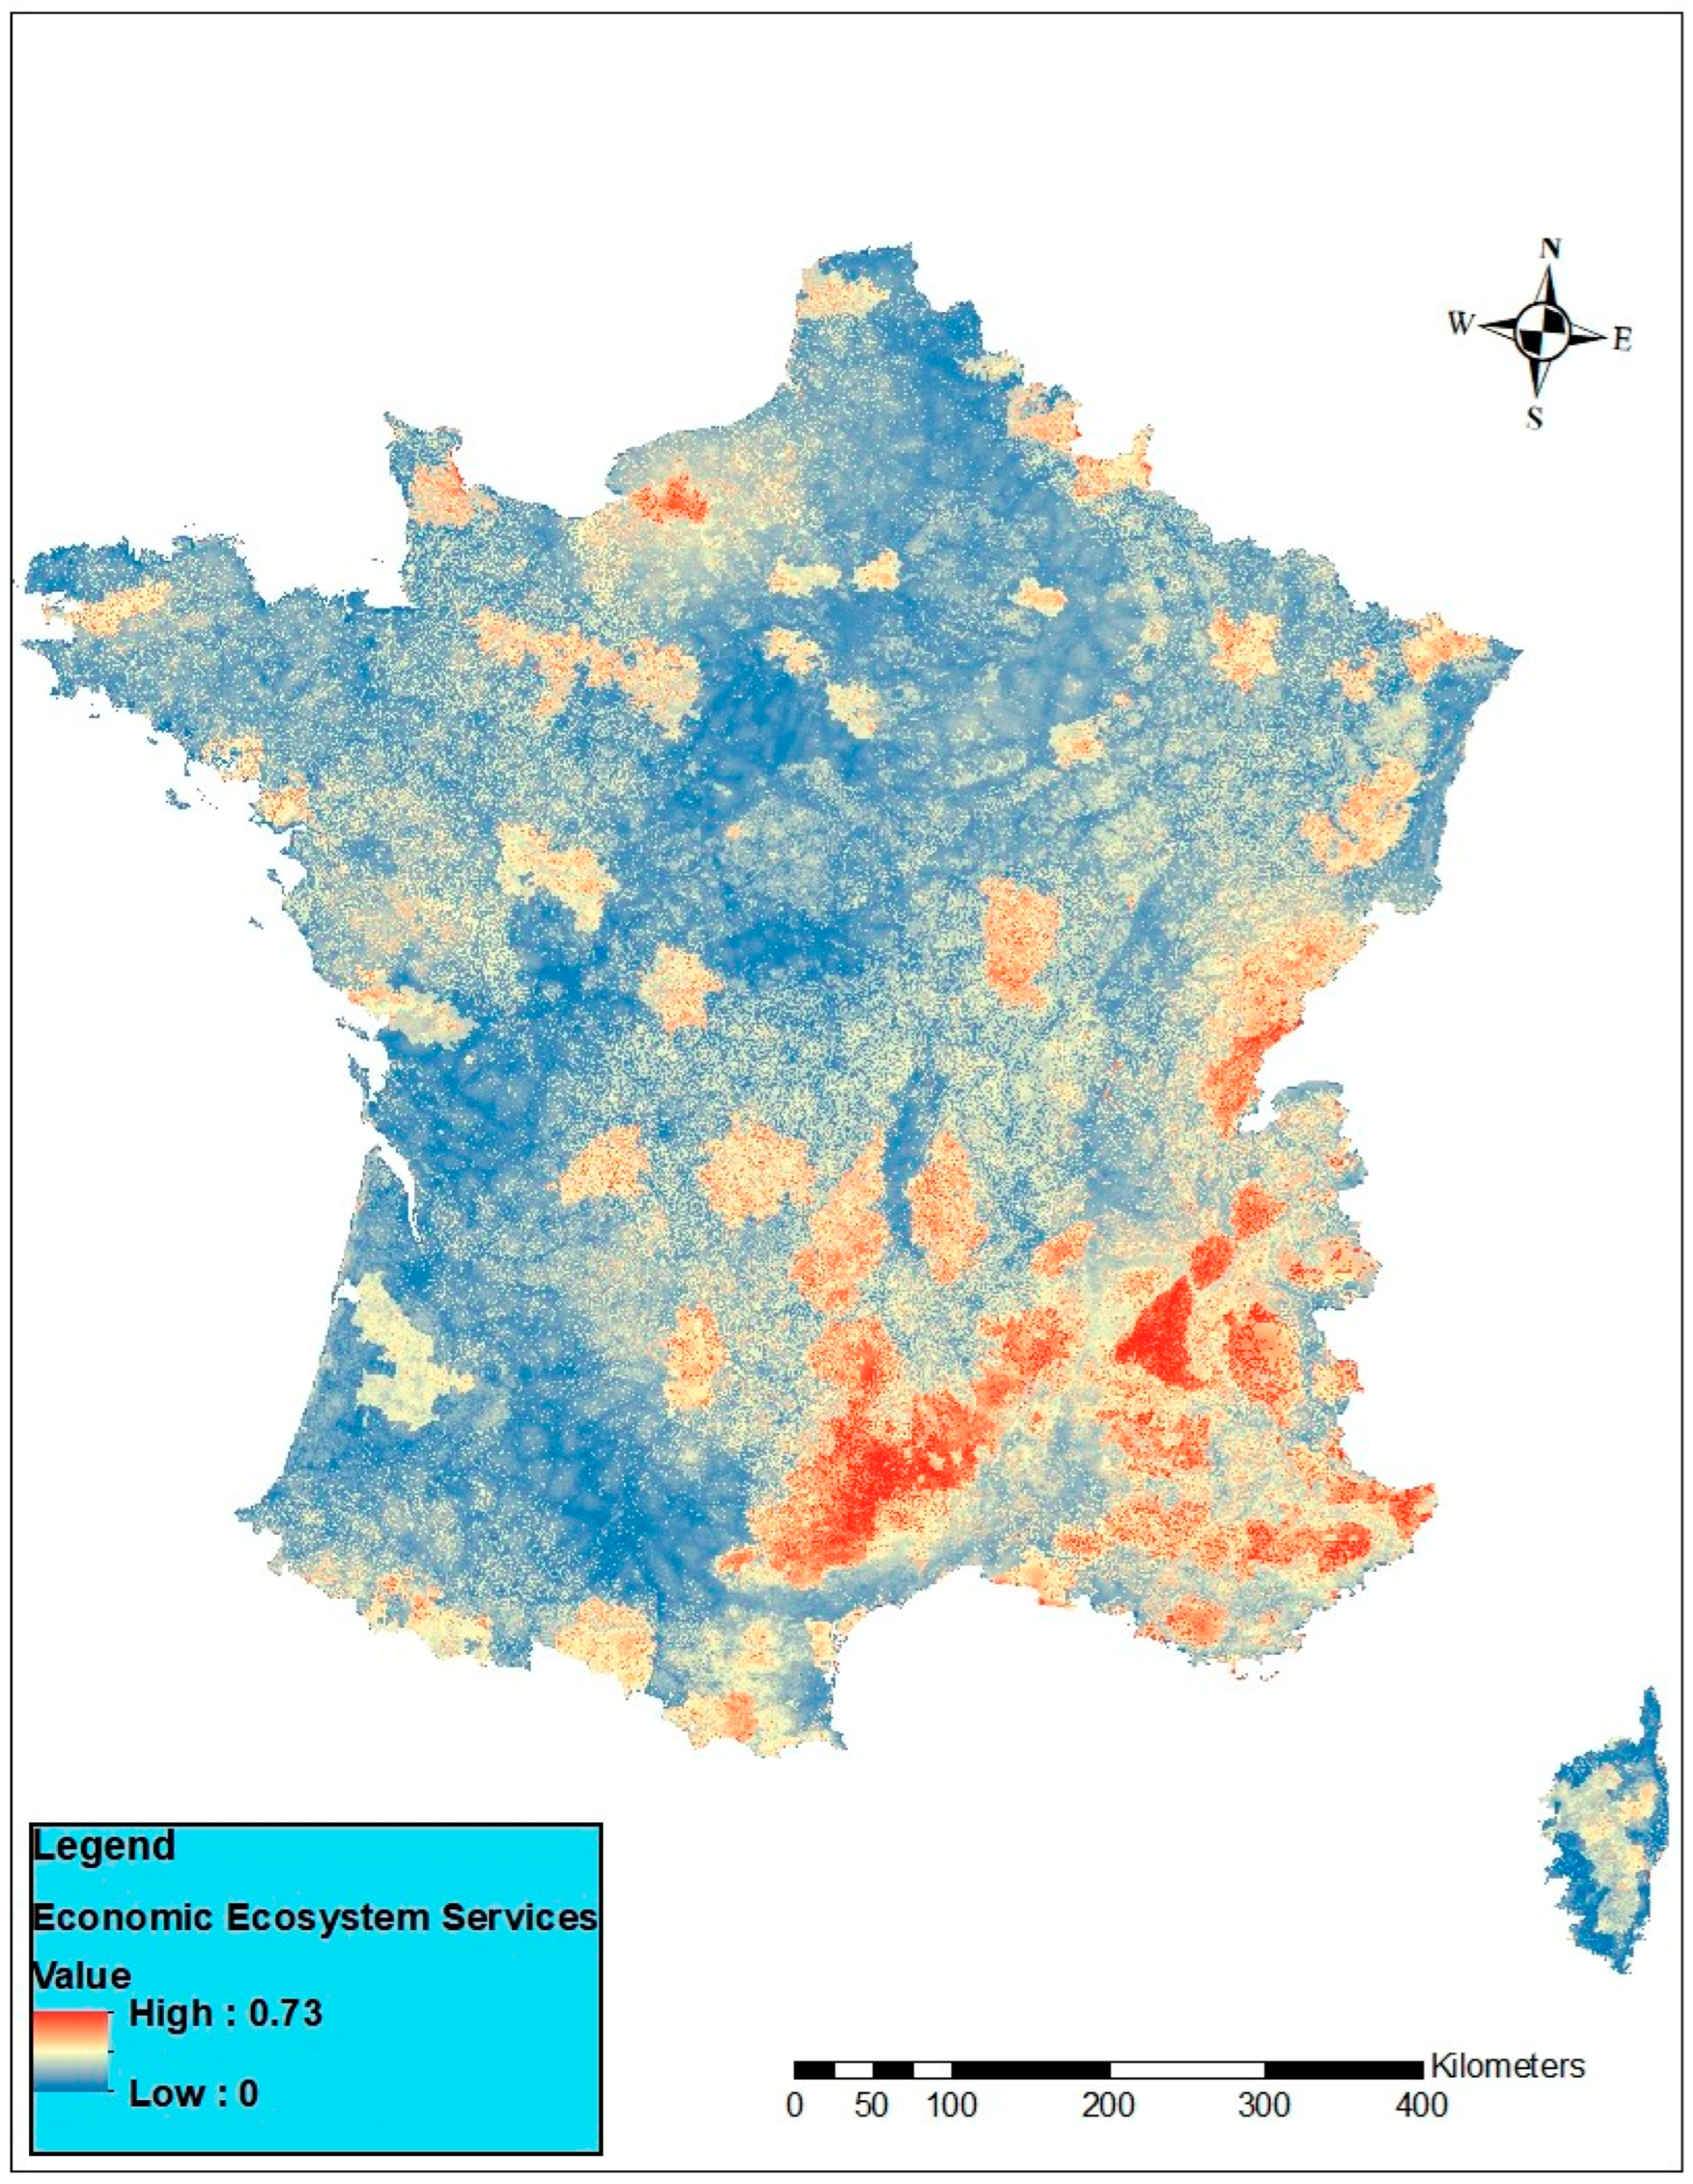
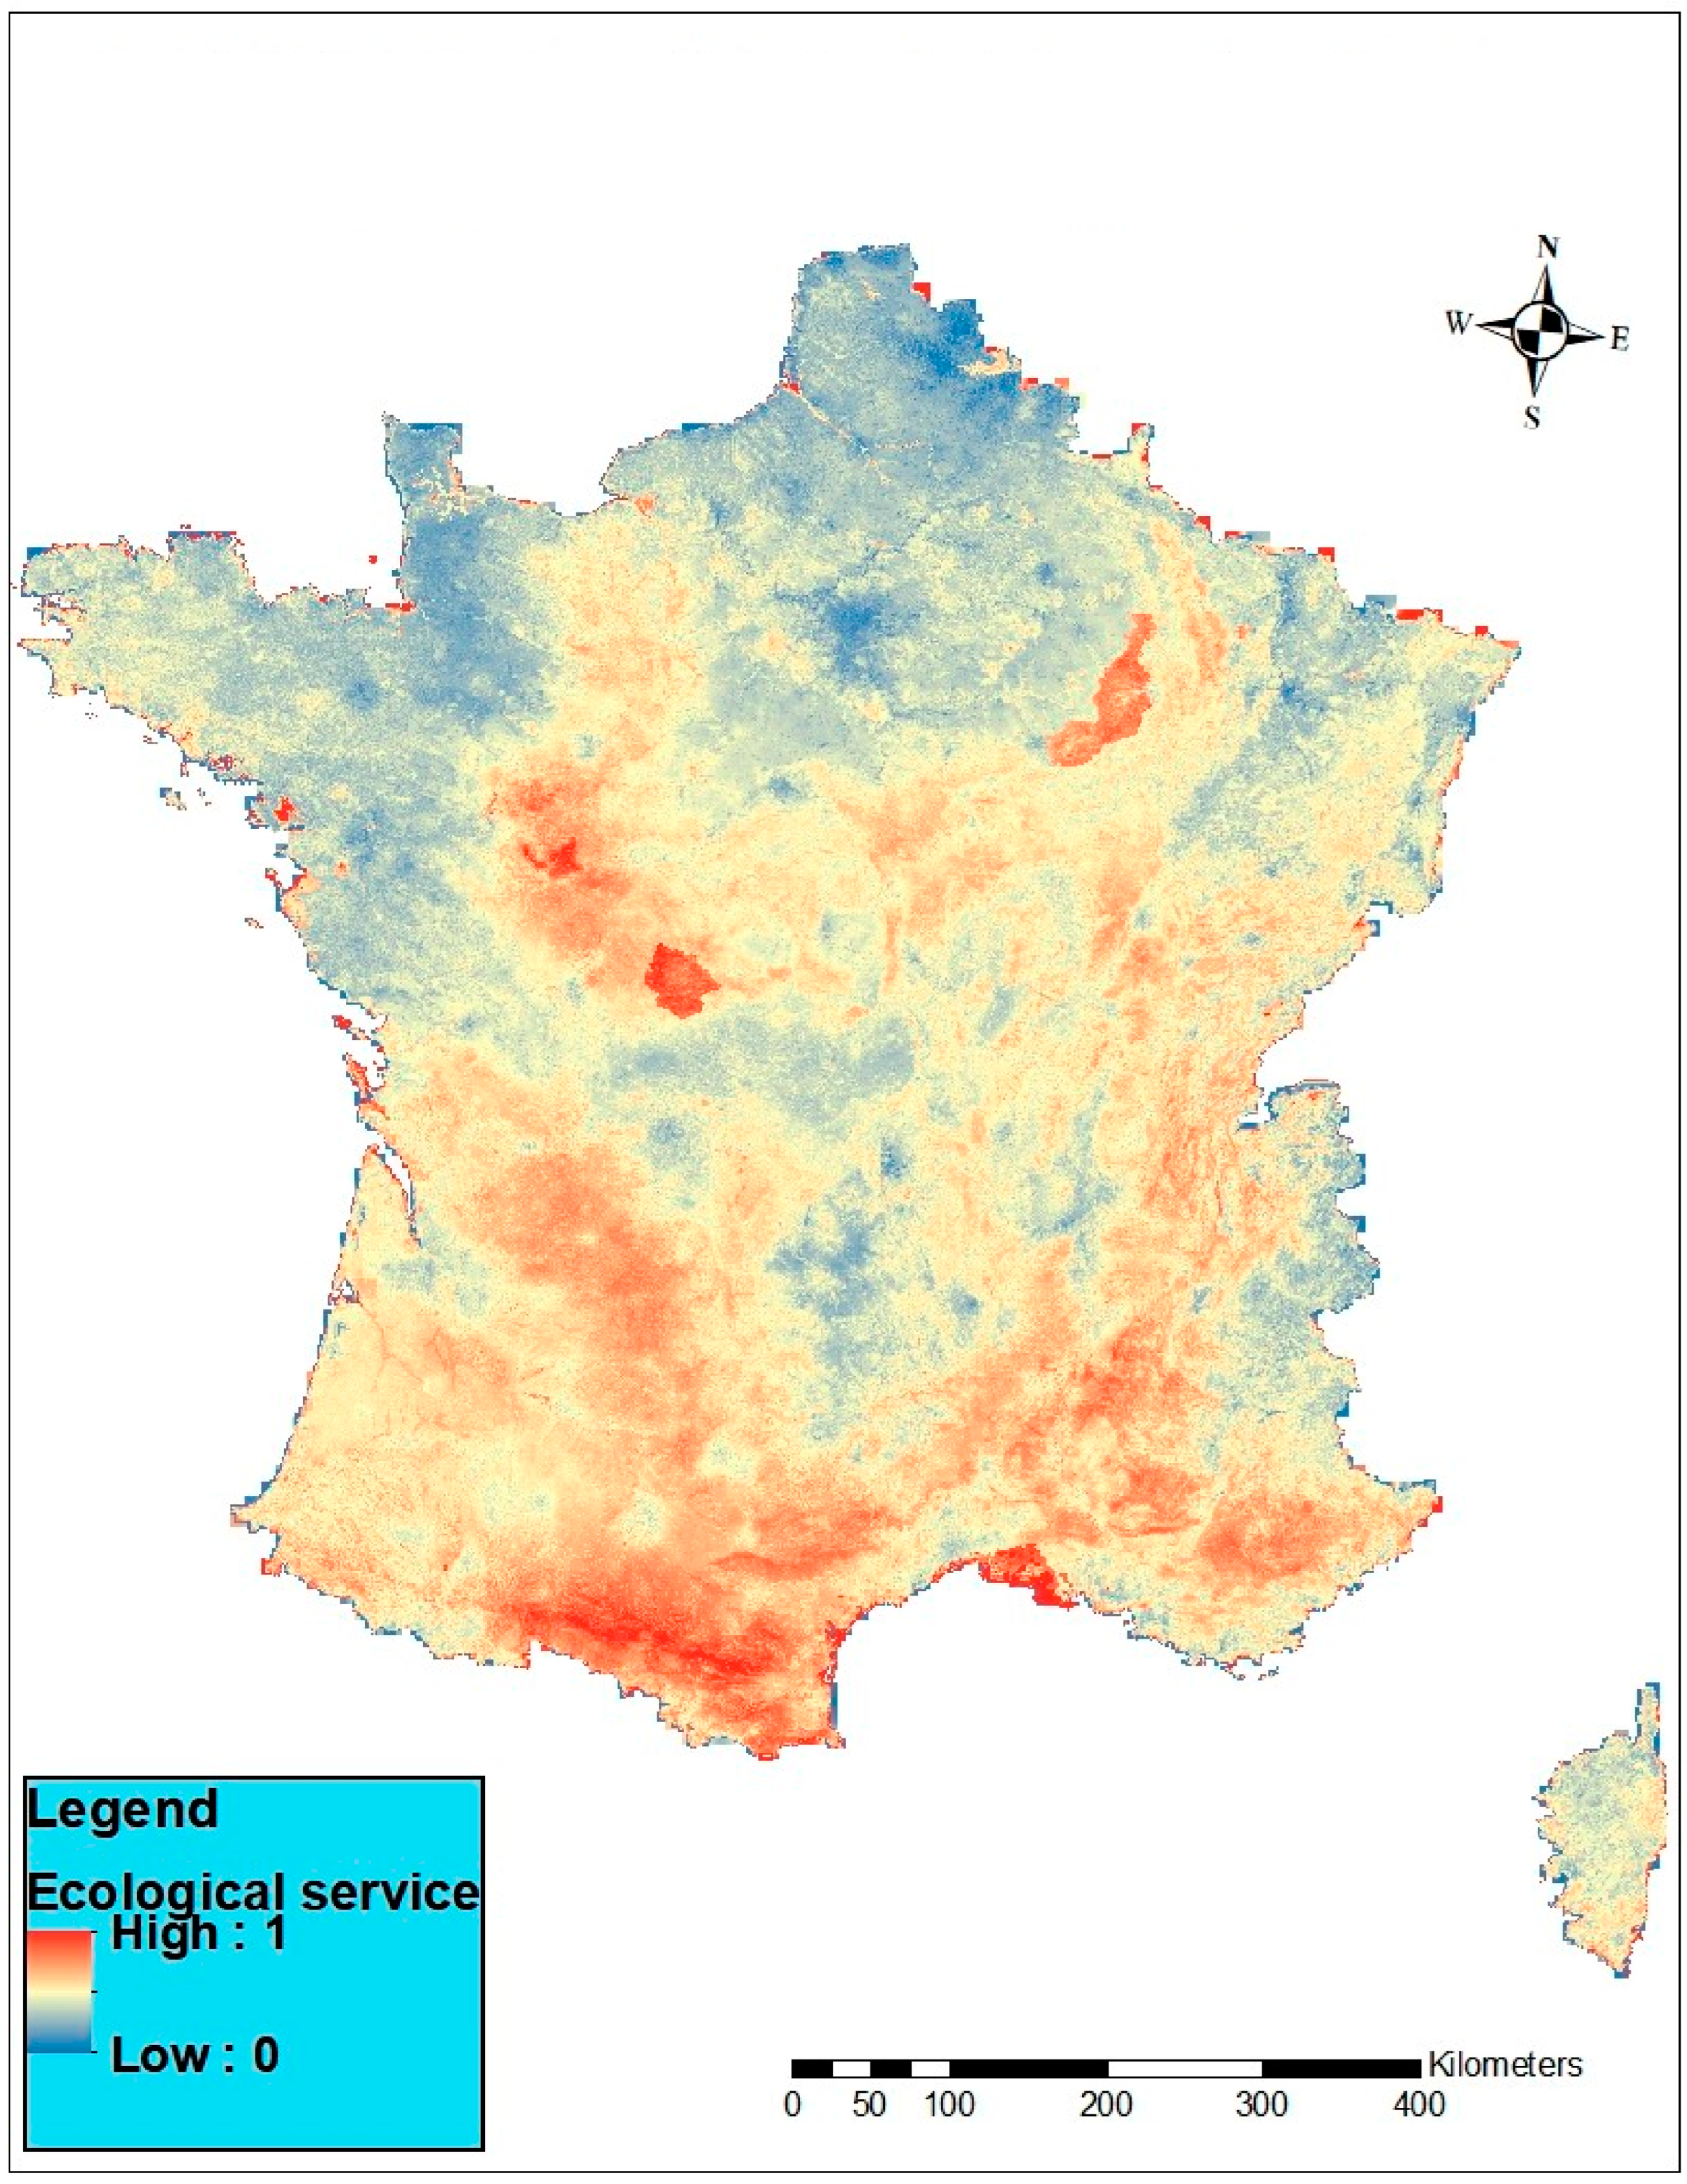
4. ES/NCP Indicators and Maps

In this section, we attempt to develop a set of intuitively understandable impact indicators that easily resonate with local stakeholders and communities. For this behalf, we will make use of the categories defined in the assessment and monitoring systems analyzed. We are of course aware that such indicators do not lend themselves to generalization, but we hold that the principle of deriving local impact indicators from ES/NCP data for communication is generic. Where we could not develop impact indicators, we aligned the visualization with more standard approaches, resulting in a total of 28 indicators.
Indicators are tools for monitoring, management and communication. While the ES/NCP classifications and their corresponding indicators described in Section 2 are good at capturing details in monitoring processes, they pose difficulties for communication, not only to lay stakeholders, but also to decision makers. Decision making requires both a broad but simplified picture and detailed information to see how a decision fits into overarching plans and policies and to implement it properly. An indicator’s ability to convey information is not least determined by its intuitiveness, reliability and acceptance (which requires the source of concepts and data to be trustworthy).
We tried to fill this gap by producing maps as visual tools, by mapping at high resolution and performing geospatial analyses of ESs/NCPs, as far as data were available at different spatial and temporal resolutions. The analysis was performed with ArcGIS and QGIS. Data used included satellite images and other statistical information, such as data on food production. Combining the different maps results in visual illustrations of the diversity of ESs/NCPs existing in each location, their respective regional strength and how they overlap. This should resonate with residents but also provide the framework decision makers need to prepare and communicate their decision.
To illustrate our approach with concrete data and maps, France was used as a case study. This responds to a call for integrating ecosystem services in policy planning and governance in the face of operational challenges witnessed among practitioners [50].

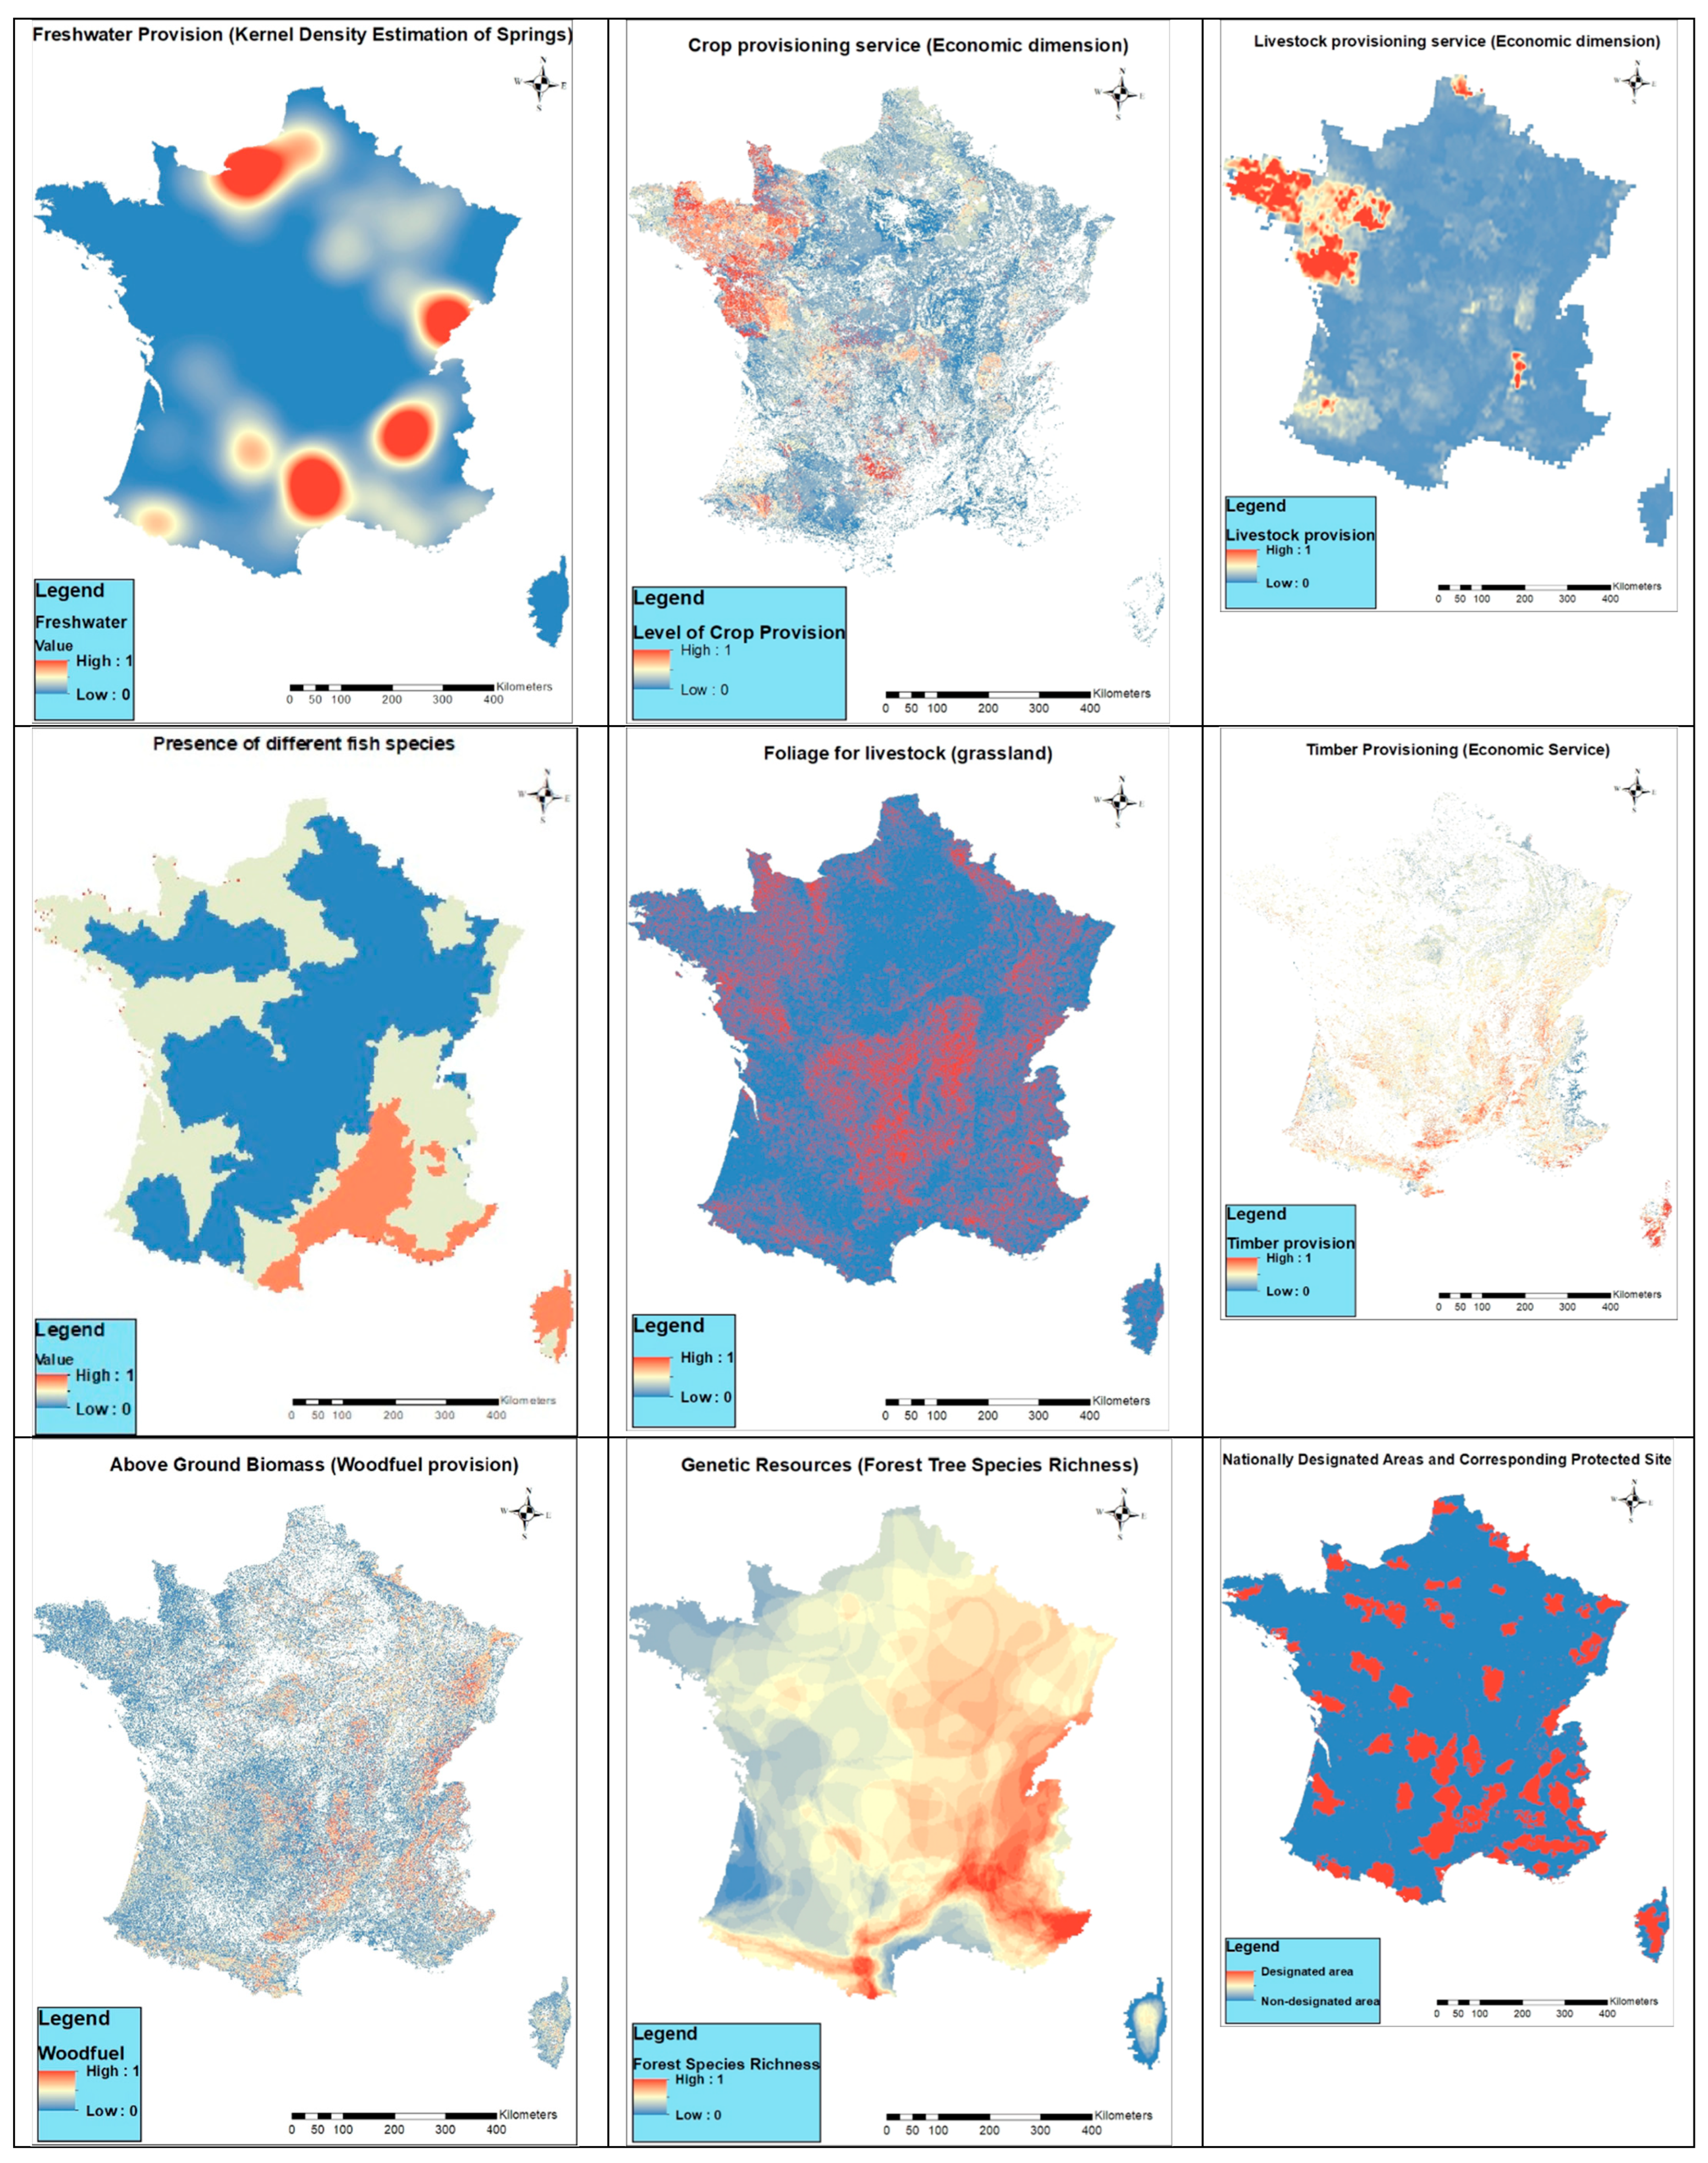
4.1. Indicators for Assessing Provisioning ESs/NCPs

Wood provisioning: Being a well-established ES/NCP, timber production has been analyzed using dry matter productivity (DMP) data from remotely sensed forest extent measurement and meteorological data [70,71,72]. DMP is adequate in communicating the amount of timber provisioning to stakeholders involved, such as foresters, loggers and wood-related businesses. The woodfuel provisioning indicator appeals to all people benefitting from it and depends on the local institutional system encouraging, allowing, disincentivizing (pricing) or banning private fuel wood collection.
Food provisioning includes both crops and livestock, with data on crop harvests and livestock density and distribution easily accessible from official statistics. Crop supply has been assessed using data on average annual crop yields [61,73]. As livestock can only exist with sufficient feed, we select foliage for feeding animals as an additional indicator for the grassland ES/NCP, which has been analyzed using livestock distribution and pasture mapping. As a limitation, mapping of grassland using remote sensing makes offsetting for human-made ranches impossible, hence causing a possible overestimation [72]. A more precise approach is the assessment of forage production instead of potential livestock to be produced from grassland [74]. Freshwater provision has been described by assessing the difference between precipitation and evapotranspiration [75]. They are the basis for water-providing springs; the kernel density estimation of springs gives some information about potentials, but it is probably of too low granularity to resonate with people.
Plants and animals found in the wild serve as food and for medicinal purposes [76]. As no suitable data were found for this kind of provisioning, despite its immediate relevance for the population, in particular in more rural areas, we decided to use the availability of protected areas with different levels of protection (biosphere reserves, national parks, etc.) as a proxy. The spatial distribution of provisioning ecosystem services is illustrated in Figure 3. The map is the mean aggregation of 10 provisioning ecosystem services. The individual indicator maps can be viewed in Appendix A. High concentrations of provisioning ecosystem services are found in parts of the Rhone-Alpes, Provence-Alpes-Côte d’Azur and Languedoc-Roussillon regions. These are regions where the concentration of genetic resources is particularly high, contributing—together with soil and climate factors—to a high level of productivity in agriculture and forestry. As genetic diversity is not a provisioning, but a regulating service (see Table 1), the map also illustrates the impacts one ES/NCP has on another.

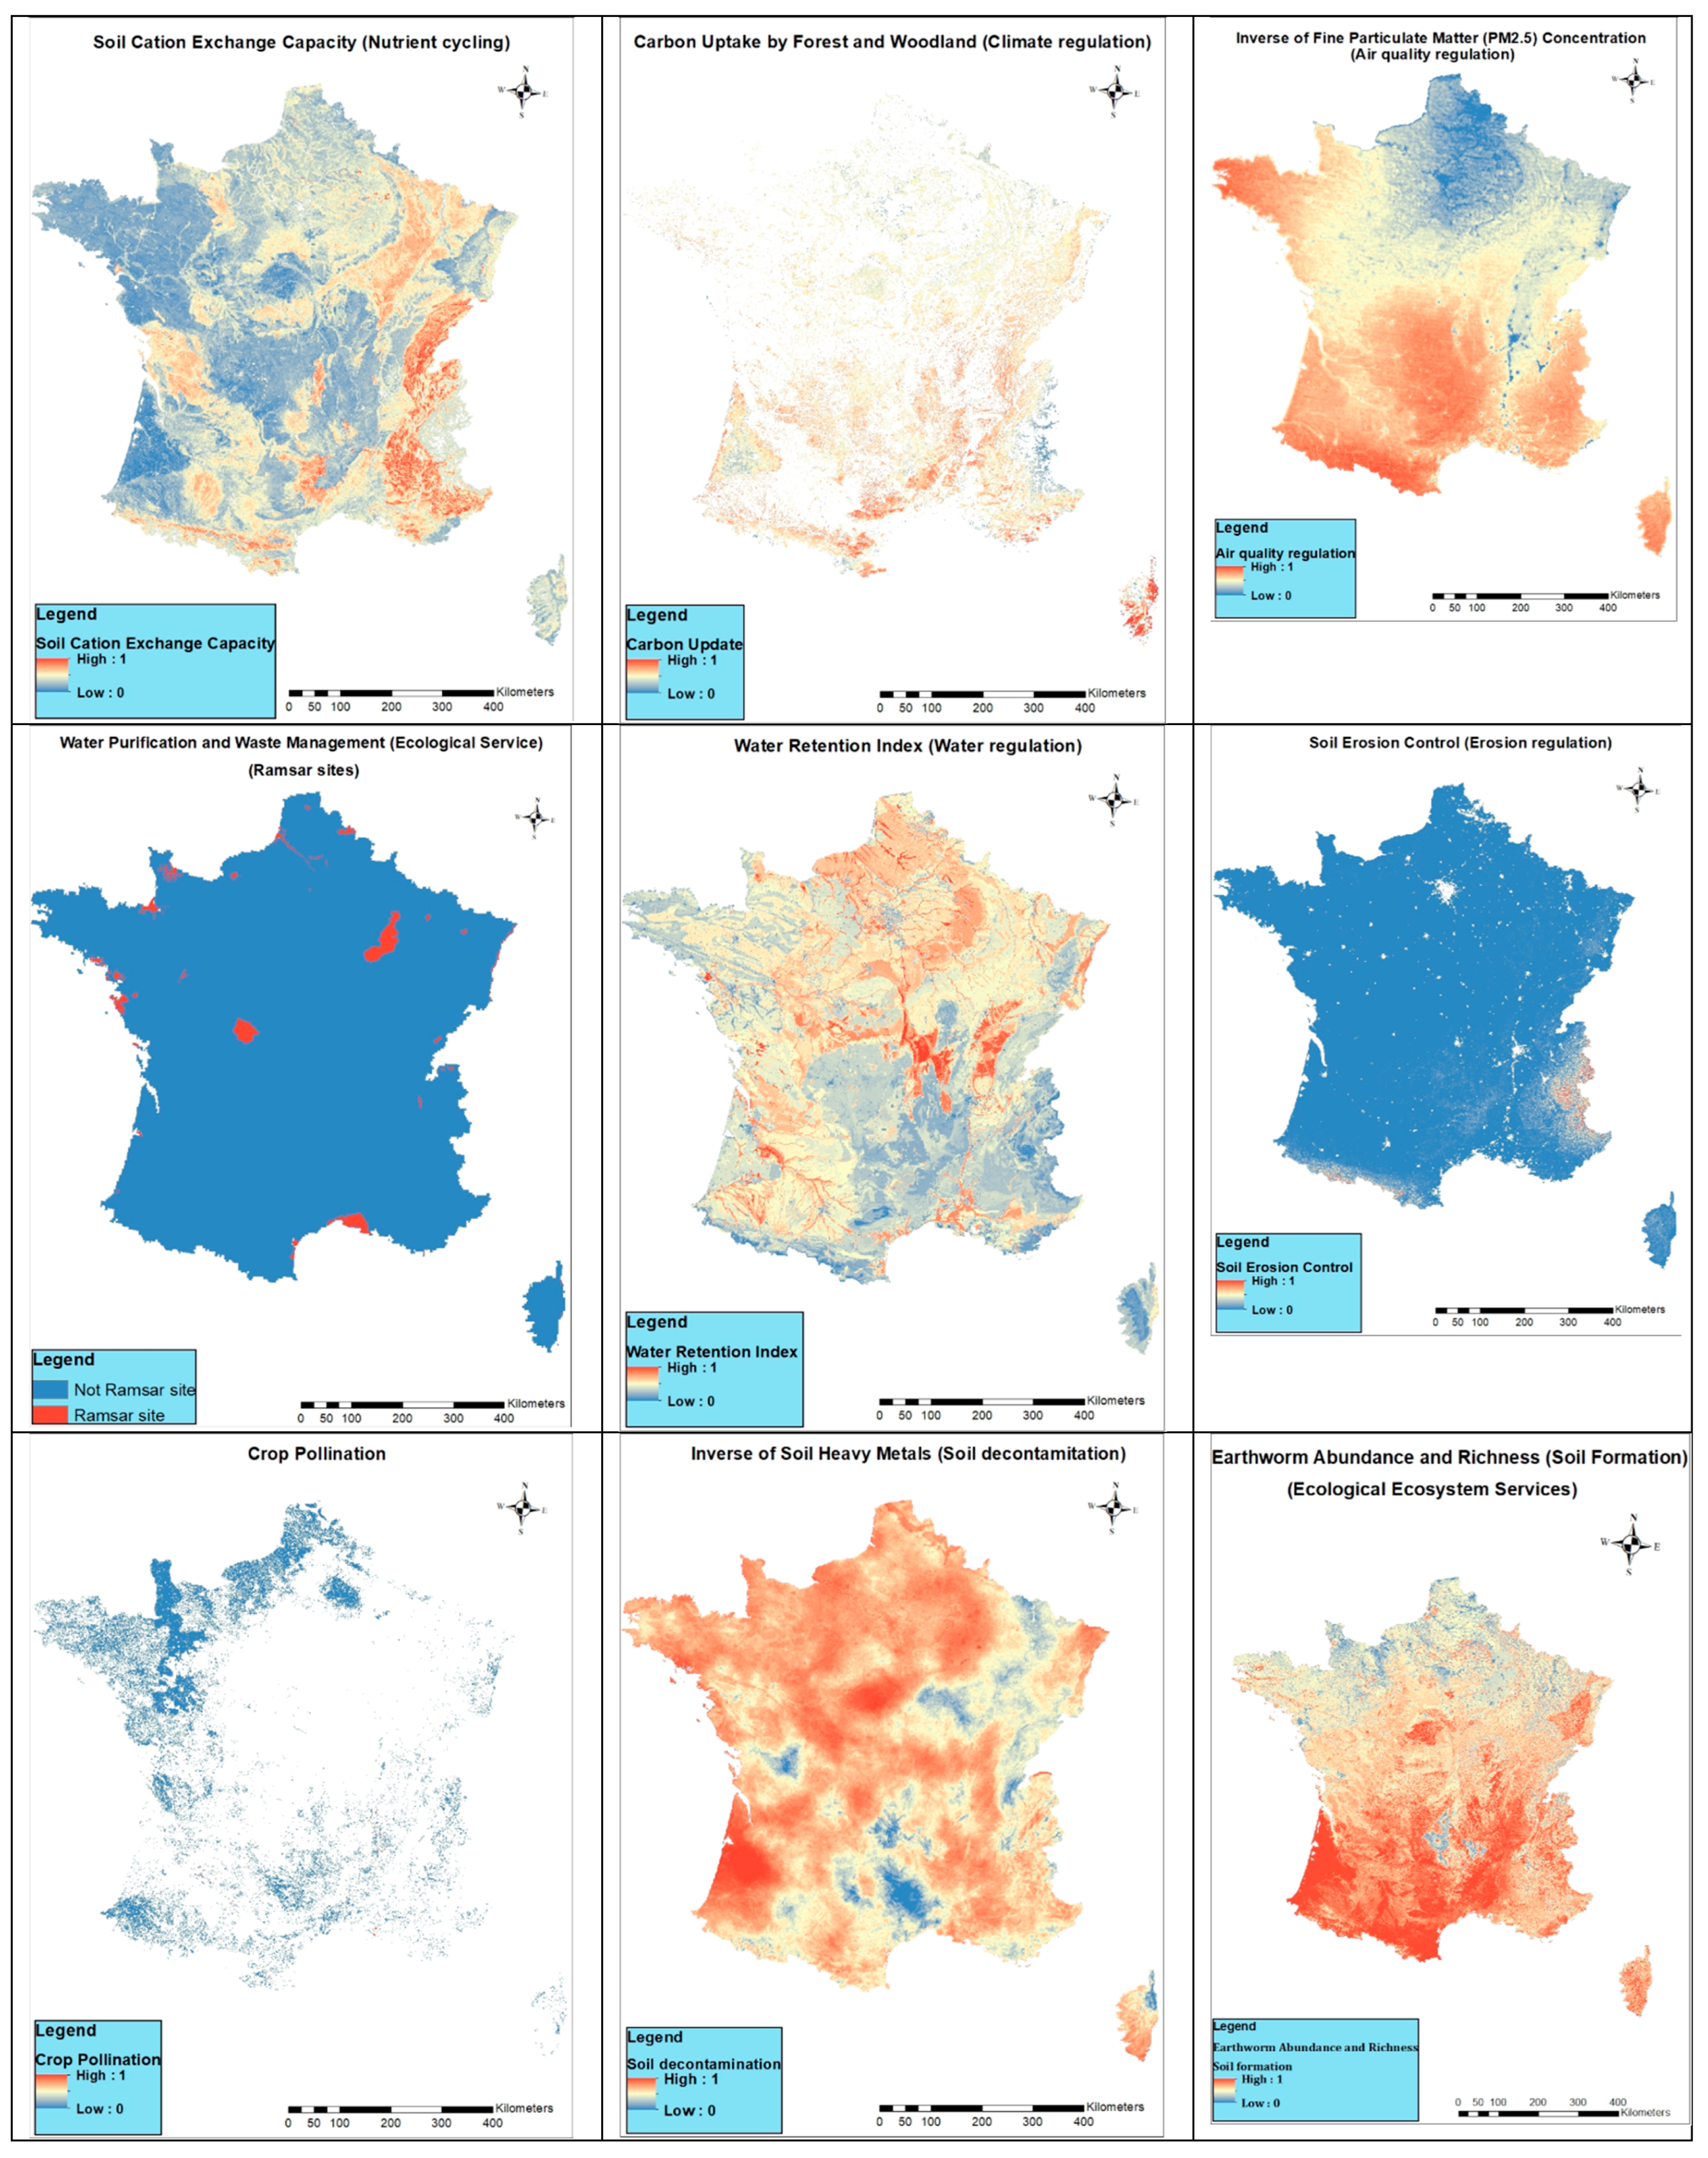
4.2. Indicators for Assessing Regulating ESs/NCPs

The range of regulating services or contributions is wide, with the impact of ecosystems on atmospheric chemistry being a long-established issue that is dealt with differently under different systematics. For instance, from an NCP point of view, the emissions of organic substances from forests, contributing to the formation of ground-level ozone, would be a disservice to be taken into account. However, from an ES perspective, it is left out for being no service, and as we discuss a combined ES/NCP perspective, we do not assess it by indicator calculation and mapping.
Climate regulation through carbon fixation is probably the most discussed service/contribution. To quantify it, net carbon exchange was used as an indicator by Naidoo et al. [72], with data from the Terrestrial Ecosystem Model. While the results provided the necessary spatial data for mapping climate regulation, they come with the inherent limitations of being modeled data based on assumptions, having input variable limitations and providing only a snapshot in time [72]. Several studies used Olson’s estimate of above- and below-ground carbon storage as a data source, despite its limitation of being nearly outdated with land cover data from the year 2000 as an input variable [72]. Thus, the spatial mapping of carbon sequestration in such studies requires high data quality; this paper used 2010 carbon sequestration datasets, which are more recent than those used in other studies but still not satisfactory.
Another challenge to the existing estimates is the new study by Mills et al. [77] who showed that—in contrast to earlier assumptions—tropical forests rapidly recovering from disturbances are not carbon sinks, despite the fast-growing standing biomass. On the contrary, the decay of dead wood and in particular the loss of soil carbon cause carbon emissions twice as high as the sequestration by plant growth, making these forests a carbon source for at least the 10 years following logging. Comparable research in temperate forests would be needed to better understand the full impact of forests and logging on carbon sequestration. As that information is not (yet) available, we decided to stick with the rather conventional indicator of “carbon uptake by forest and woodland”, but have a closer look at soil ecosystems. While carbon uptake is not a tangible impact, we are confident it will resonate with its audience due to the omnipresent discussion about carbon sequestration as a remedy to the climate crisis.
Regarding soil, we chose two indicators for soil health: soil cation exchange capacity and earthworm abundance and richness. The latter is easy to communicate—everybody knows earthworms—and also relevant, as different species of earthworms play an important role in soil formation, counteracting soil carbon loss. Of course, soil formation is influenced by a number of other factors as well, such as plant roots and microorganism communities. However, earthworms have been identified as a key contributor to soil decomposition and pedogenesis and have been described as “ecosystem engineers” [78,79]. Hence, we selected earthworm abundance and richness as an indicator for soil formation, which in turn is relevant for carbon fixation. As opposed to the earthworm indicator, cation exchange capacity (CEC) is rather abstract and probably not as easy to communicate as it is to measure, but we found it to be an appealing equivalent. CEC has been shown to be of critical importance for nutrient cycling; soils with greater CEC are able to hold onto more nutrients [80,81]. Therefore, we consider the indicator a suitable proxy for nutrient cycling, which is important for both subsoil organism communities and plant growth, and hence for carbon fixation.
Another aspect of soil quality is its contamination with hardly biodegradable substances such as persistent chemicals; microplastics; and heavy metals such as lead, copper, nickel and mercury, which can accumulate in the food chain. High concentrations are harmful to living organisms and the food web [82,83,84]. One limited remedy is bioremediation by plants or microbial biosorbents such as Pseudomonas, Bacillus and Micrococcus which support the sequestration of heavy metals, thus improving soil health [82]. For the purposes of this paper, we have used the inverse of heavy metal distribution in soil as a proxy, which is a choice caused by the paucity of alternatives, but it is unsatisfactory for several reasons: To be representing the decontamination of soil, the starting conditions need to be known, i.e., the concentration level before the onset of decontamination, which is not the case. Secondly, these levels would have to be normalized to be a suitable data source for mapping. Thirdly the contribution of ecosystems to bioremediation, which will probably vary between regions, would have to be taken into account. Finally, the indicator does not lend itself to communication. Consequently, its use in this paper should be understood as a stand-in for better indicators to be developed.
Soil erosion control is an urgent task as currently not only the quality of soils is deteriorating, but due to wind and water erosion, the sheer volume of fertile soil is shrinking. Erosion control is associated with vegetative cover, rainfall erosivity and landscape properties [85]. Vegetation structure and soil binding properties of roots present have also been considered as influencing the extent of erosion control services [2,86]. Informed by this, soil erosion was assessed in this paper, based on how much soil is retained by vegetation. While small amounts of large-scale (wind) erosion are often almost invisible, the deep erosion gullies caused by heavy rains are a familiar sight, making erosion an easily visualized risk to soils.
Pollination is one of the regulatory ESs/NCPs underpinning the provisioning ESs/NCPs of food provisioning from crops. Crop supply has been assessed using data on average annual crop yields [61,73], and pollination has been assessed as the share from plants dependent on third-party pollination, i.e., neither self-pollination nor wind pollination.
Water retention index: Another regulating service required for food provisioning is the availability of enough clean water. In the past, water provision has often been estimated by assessing the difference between precipitation and evapotranspiration [75]. Groundwater recharge was used in assessing potential water flow regulation by Reyers et al. [86]. While arguably not a perfect representation of water provision by an ecosystem, it may be regarded as a better indicator in comparison to the use of a hydrological model (WaterGAP) by Naidoo et al. [72] where water flowing within the ecosystem basin is assessed as water flow regulation. We decided to use the water retention index (WRI) as an indicator for water regulation as it captures the capacity of the landscape to regulate and retain water passing through it, despite its weaknesses in communicability. An alternative, which refers to familiar landscape elements, is the size of wetlands and Ramsar Convention-protected sites (which are hotspots for bird watching). They store significant amounts of water, which is partly flowing off and can be used for human purposes in the dry season.
However, wetlands and Ramsar sites not only store water, acting as a sponge where wastewater from point and non-point sources is intercepted. They also process it and are the foremost ecosystem for natural wastewater purification [87], effectively degrading harmful chemicals before the water flows off into other streams. This regulating ES/NCP, namely the action of these areas as “natural purifiers of water” [88], is a different service/contribution, but provided by the same ecosystem elements, and it is only active once water pollution occurs and increases with the pollution level up to a tipping point. Intuitively, the mapping of wastewater purification and treatment ESs/NCPs can be performed by capturing locations of wetlands as places where such ecosystem services are offered; hence, they are used as an indicator in this research.
Flood and run-off control can be mapped using underground water recharge as an indicator with the notion that permeable soils aid aquifer recharge and reduce flooding [85]. In this paper, actual flood control which captures the potential of ecosystems to regulate water flows as well as socio-economic demand for protection against river floods was used as an indicator.
The air quality regulation indicator we used is the inverse of PM2.5 concentration. Its weaknesses have already been described in Section 3.1—like the heavy metal indicator, it should be considered a stand-in until scientifically more robust and better communicable alternatives have been identified.
Biological pest control is a faunal ES/NCP produced through parasitism, mutualism and predation [89,90]. These processes reduce the loss of yield, hence increasing the food and feed provisioning ES/NCP level, and have synergies with the pollination regulatory ES/NCP [91]. They involve a wide range of species, from parasitoids via insects including ants to spiders [92,93], birds and bats [94,95,96].
While healthy ecosystems prevent the easy spread of pests and diseases [94], the encroachment into areas of high biodiversity and microbial diversity, often in search of food or minerals or for farming purposes, has meant that habitats and species are increasingly under pressure from human activities. The resulting biodiversity loss is the main driver of zoonoses, driving the coming “age of pandemics” [8,97].
Bats play an interesting role in this context: while they are one of the key species groups spreading viruses (rodents are another one) in Southeast Asia, they contribute to biocontrol (without zoonosis risks) in other regions. Although they are usually not the dominant agent in pest control networks, we have chosen a bat-based indicator for biocontrol to illustrate the place dependency of what makes a service or a disservice. Unlike in parts of Asia, where health risks dominate the assessment, bats provide a positive contribution to people in France in form of pest reduction. The indicator is the kernel density of bats’ underground sites. In the future, it should be complemented by indicators addressing other elements of the predation web, but for the time being, bats are well visible, easy to distinguish from other groups and well known to local stakeholders, so they communicate well.
Maintaining genetic diversity is an ES/NCP comprising essentially the intra-species diversity of all species present in an ecosystem. As assessing this comprehensively is far beyond what any monitoring can provide, we chose as proxy four macro-level groups for which we found data and which are usually well known to residents and can be observed by them. They are the phylogenetic diversity of terrestrial vertebrate species, the presence of different fish species and the richness of forest tree and forest-related species.
The spatial distribution of regulating ecosystem services is captured in Figure 4. The result is based on the mean aggregate of 14 regulating ecosystem services. All indicator maps that were aggregated to produce this result are available in Appendix A. A high concentration of regulating ecosystem services is captured in Southern Midi-Pyrenes and Languedoc-Roussillon, but it may be overemphasized as the air quality regulation in this region is described as high by an indicator with significant weaknesses. In addition, isolated patches of high concentrations of regulating ecosystem services such as those found in southern Provence-Alpes-Côte d’Azur, regions of Champagne-Ardenne and Centre are wetlands where water purification is supplied in addition to high levels of soil decontamination, another disputable indicator.

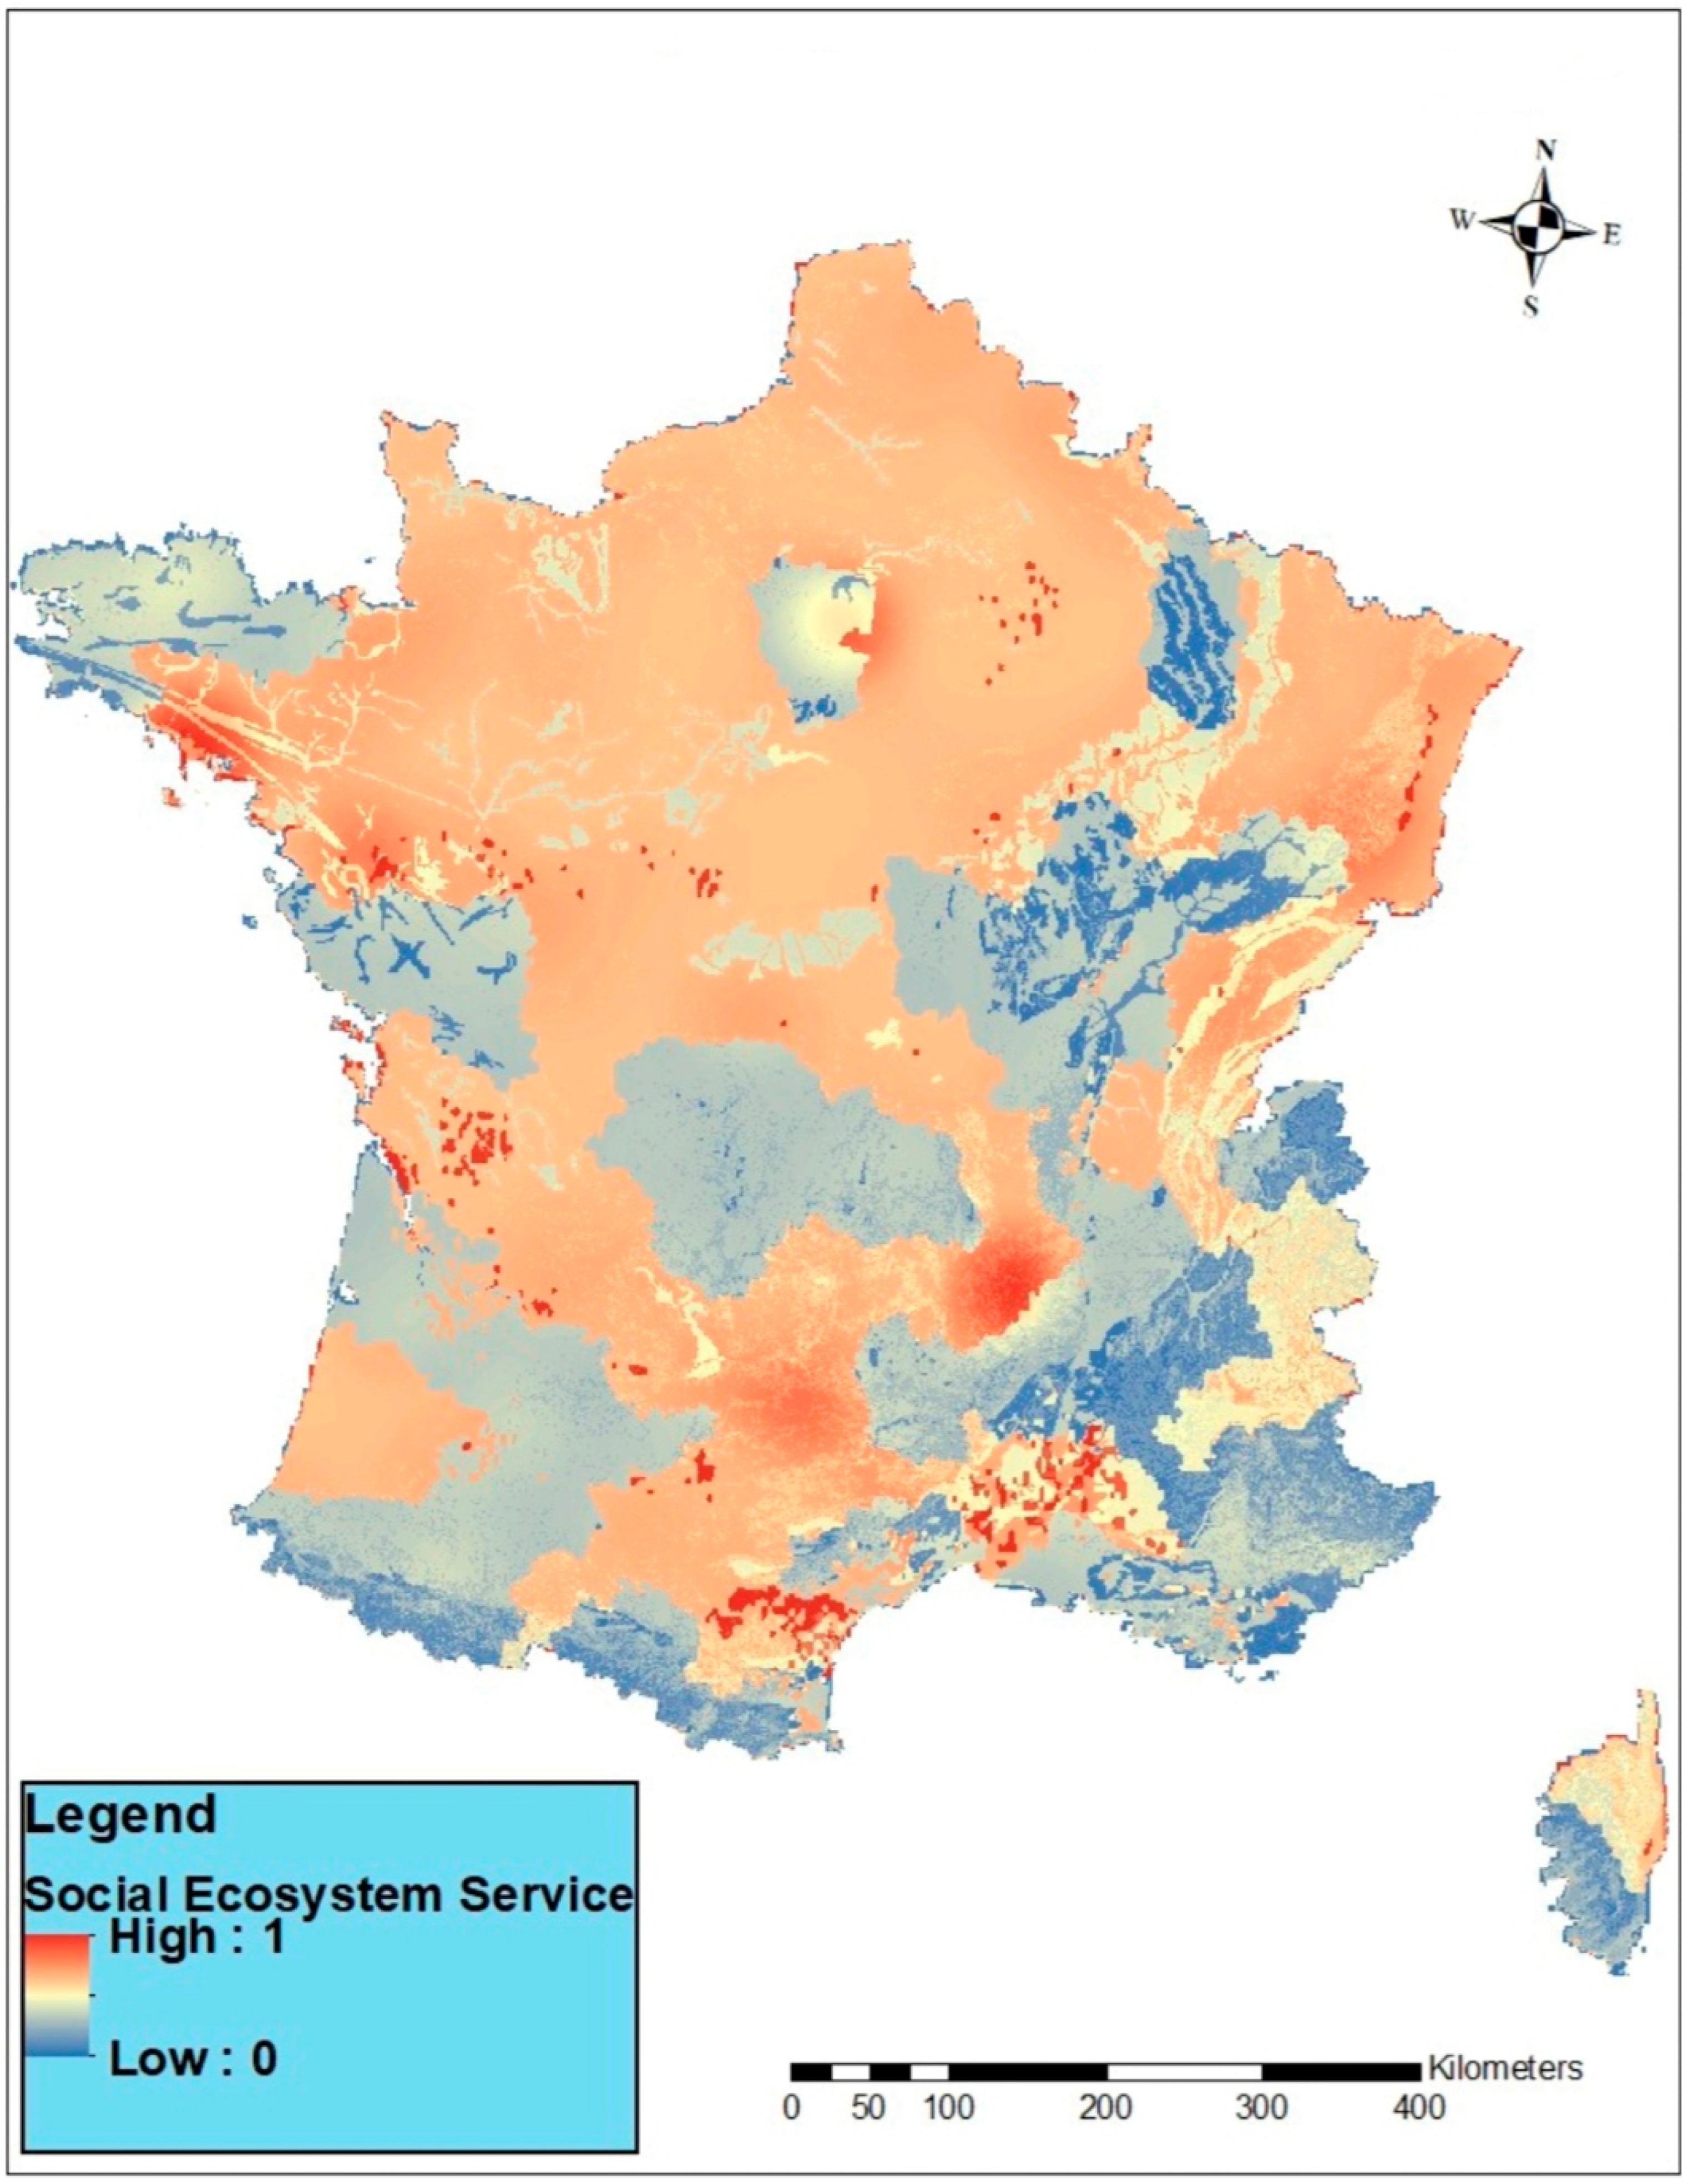
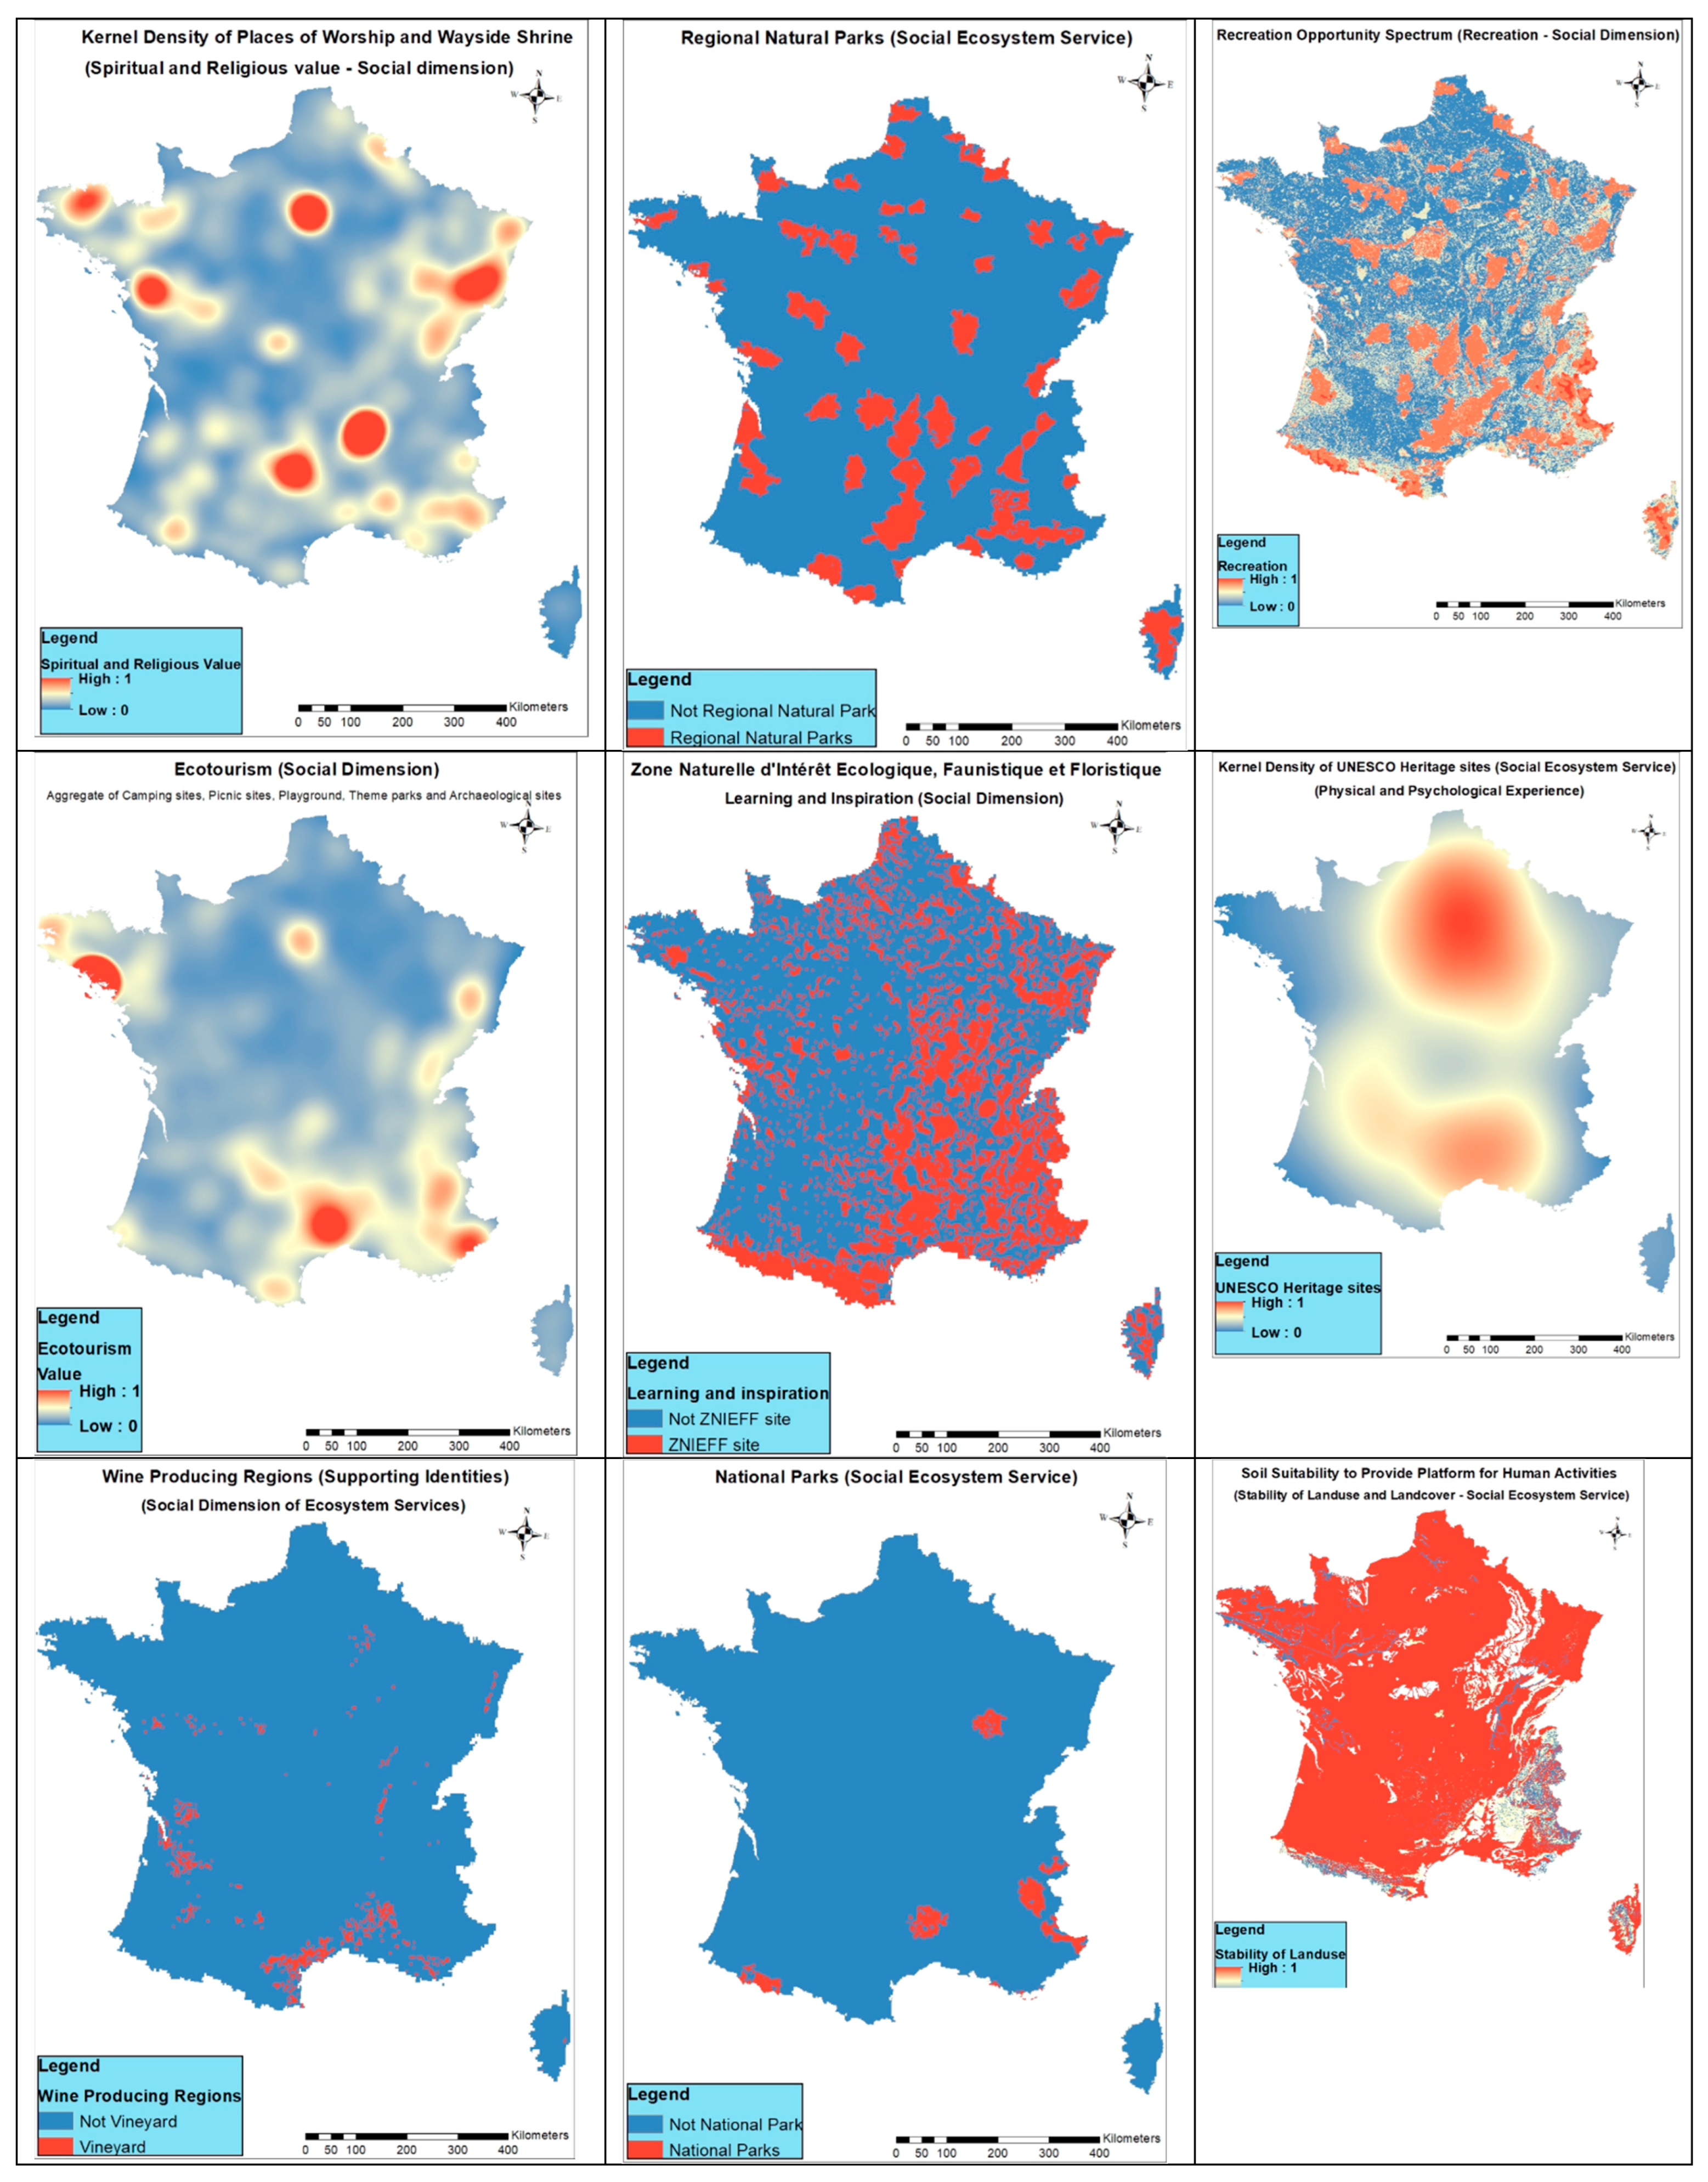
4.3. Indicators for Assessing Cultural ESs/NCPs

Recreation opportunities are one of the most frequently referred to cultural ESs/NCPs, and they figure prominently in several of the classification schemes described, in particular in TEEB. Calculating financial returns from tourism is rather easy, making it a preferred object in attempts to quantify cultural ESs/NCPs. However, the case is not as straightforward as it may appear at first glance: What is usually calculated is the returns from investments in infrastructure, hotels, restaurants, etc., given the framework condition of a nearby recreation location. Estimating the contribution of this nearby location to the overall turnover is necessarily based on a number of (often heroic) assumptions [19].
Moreover, the relationship between biodiversity and tourism is in no way linear, rather on the contrary: While more roads, parking spaces, hotels and entertainment places usually mean more turnover, the very same infrastructure investment tends to come at the expense of biodiversity, through habitat fragmentation, land use intensity change and the damage caused and waste left behind by visitors. On the other hand, undisturbed biodiversity implies that only non-use value can be attributed to such areas, such as existence and bequest values which are irrelevant to the local population and economy. Consequently, some researchers have suggested any indicator developed from biodiversity will not adequately communicate cultural service information and in the worst case be erroneous [70]. In assessing aesthetic values and scenic views, proximity to open space has been featured in a number of studies such as those of Bagstad et al. [98] and McConnell and Walls [99]. Cultural value was created by providing access to recreational amenities, natural soundscape and privacy [98].
Research has shown that large old trees are symbolic of people’s cultural values, emotional attachment and aesthetic values [100]; hence, they present an opportunity to tangibly capture the cultural services of ecosystems. The France NEA [50] also highlights this, classifying such trees as natural heritage. Other indicators representing natural heritage or, better still, cultural services include sacred sites, protected natural sites and rare species [50]. Natura 2000 sites, part of the Europe-wide protected area network, have also witnessed increased interest for their cultural services in addition to other numerous ESs/NCPs they provide [101]. Other indicators that have been used to represent cultural services include archaeological sites, cultural heritage sites and relic monuments, designated national parks, marine and wetland national park designations and camping sites [102,103].
It appears that a crucial role in providing cultural ESs/NCPs is played not only by the quality of the landscape and environment but also by their accessibility. This was the criterion we used to define two indicators, drawing on the literature cited. The first describes the options available (recreation opportunity spectrum indicator), and the second is a kind of ecotourism indicator, aggregating only those infrastructures which can be considered low-impact (camping sites, picnic sites, playgrounds, theme parks and archaeological sites). To give a balanced picture, this characterization of the infrastructure available to users must be combined with indicators for the “naturalness” of the surrounding ecosystems. Biologically, it is almost impossible to map out a distribution of naturalness, but there are a number of legally defined areas where providing the biological infrastructure for nature-based recreation is one of the defining tasks. In France, they include nationally designated areas and corresponding protected sites, national and regional natural parks, national and regional nature reserves, biosphere reserves, biological reserves, Natura 2000 sites and Zones Naturelle de Intérêt Écologique, Faunistique et Floristique (ZNIEFFs). Offering another example of overlapping ESs/NCPs, all of them also have an aesthetic value and provide opportunities for learning and inspiration. Finally, we add a habitat quality index, as the state of habitat maintenance can vary.
Psychological experience constituting identity is not easy to measure, but it is a key element, maybe even the most important one, in cultural ESs/NCPs. A perceived stability of land use and land cover can contribute to a “sense of place” and hence to identity. UNESCO natural and cultural heritage sites can have a similar effect, as can (on the fringe of ecosystems) wayside shrines—important in a majority catholic country such as France—and other places of worship, providing spiritual importance to some places, for certain groups of the population. As for mapping a point-by-point registration of such sites would be unsuitable, we have chosen the kernel densities of UNESCO heritage sites and of places of worship and wayside shrines as indicators.
To these identity-related indicators, we added two more, which are specifically designed for the French cultural context but applicable far beyond. Evaluating identity support and natural heritage as a cultural service, wine production or the presence of vineyards has been identified as an important indicator in the literature [104]. As a vital land use in the regions of Champagne and Napa, California, among others, vineyards represent a relic of heritage, cultural tradition and identity [105,106]. The wine produced in these regions serves as a regional trademark and a taste of place as the tradition of wine making contributes to the terroir associated with it [107,108]. More so, the preservation of wine origin is captured as a protected epithet on labels such as Appellation d’Origine Controlée in France [106] and is also protected by EU and international regulations. This uniqueness of identities has been honored as vineyard landscapes such as Piedmont in Italy and the terroirs of Burgundy in France have been designated as World Heritage Sites by United Nations Educational, Scientific and Cultural Organization [109].
Besides supporting cultural identities, vineyards provide an opportunity for learning and inspiration. This is demonstrated in the use of wine to illustrate the fermentation process and the practice of grafting in reducing vineyard pest phylloxera in France [104,110]. Identified as an object of scientific research and discovery by CICES [34], the discovery of more than 1000 volatile compounds found in wine has benefitted sensory science [104]. The knowledge gained has been used to produce aroma substances for consumer products [111]. Moreover, vineyards’ potential for supporting sustainable agriculture and climate adaptation has not gone unnoticed [112]. Equally important is cheese production as a factor offering identity support. Exported cheese is labeled with its “protected designation of origin” where its association with local culture is maintained [113]. Among others, the sense of place associated with cheese is reflected in appellations such as Spanish Manchego, French Camembert, Dutch Gouda and Mongolian Byaslag [114]. For these regions, their cheese embodies a social profile encompassing memory, tradition, and material and non-material culture [115]. For these reasons, we have chosen maps of wine- and cheese-producing regions to highlight strong cultural, nature-based identities.
The result of mapping the spatial distribution of cultural ESs/NCPs shows the mean aggregate of 9 indicators composed of 15 datasets and is presented in Figure 5. The various indicator maps used are available in Appendix A. Generally, the result shows that areas where cultural ESs/NCPs are found in higher concentrations are mainly cheese-producing regions contributing to the cultural heritage of France. Slightly lower concentrations of cultural ESs/NCPs are found in Southeastern Provence-Alpes-Côte d’Azur where a high concentration of ecotourism prevails. A similarly high concentration of cultural ESs/NCPs is found in an isolated area in Rhone-Alpes, based on a high concentration of spiritual and religious values.

5. Discussion and Conclusions

Discussion on Mapping Spatial Distribution of Ecosystem Services

The pilot exercise presented here combines three elements: (1) the search for resonating, at best impact-based, indicators; (2) mapping of ES/NCP indicators; and (3) an overlay of maps (Figure 3, Figure 4 and Figure 5) to identify hotspots of the provision of ecosystem services/nature’s contributions to people. In this paper, the aggregates were derived based on the prevailing systematics used in the classification systems initially analyzed, but in the future, they could also be combined differently, e.g., by generating maps combining all forest-related or all water-related ESs/NCPs. It remains to be tested if the combination of the indicators chosen and the means of presentation as overlay maps is, as expected, a way to enhance local residents’ and stakeholders’ responsiveness to the information thus conveyed.
By selecting for indicators that are rather country- and culture-specific, normalizing them and including them into aggregates, the approach shows a high degree of flexibility and adaptability to the situation in different future target countries. In particular, the possibility of combining maps according to the higher strata of the CICES system allows for comparability of situations, which differ in many important details. However, the analysis has also shown the limitations of strict ecosystem service hierarchies with clearly separated categories, such as CICES; it rather confirms the IPBES approach which acknowledges the overlaps and interactions of different NCPs. A limitation to the quality of the indicators suggested is that the datasets were not all temporally consistent. Further research is recommended to overcome this gap and to determine whether the patterns found reflect spatial clustering.
The first part of our analysis, which led to the selection of indicators mapped, has shown a rather broad agreement in the more recent indicator systems. This underpins the optimism that datasets could be aligned to provide a high-quality database for mapping exercises such as the one presented here. The second part of our paper demonstrates the possibility to derive a spatially explicit distribution of NCPs/ESs, thus illustrating how different their supply is across countries often covered by average or median value data. Secondly, developing some down-to-earth indicators based on specific cultural traits and regional situations and being able to integrate them flawlessly into the overall mapping exercise is a way to enhance indicator resonance by referring to local conditions. It also opens up an avenue on how local data gathering, opinion polls, preference analyses and citizen science could in the future contribute to more comprehensive regional NCP/ES mapping as a basis for regional planning which takes people’s interests and often emotional attitudes into account. In particular, in economics research, where analyses of “willingness to pay” are a frequently used method, the experiences gained in determining how to identify the regional traits that matter to people could be used while avoiding the disputed monetary quantification. To do so, the preferences identified can be expressed in an ordinal scale and integrated with other data to provide a more comprehensive information base for decision making.
Some additional insight from our exercise is how different natural factors such as precipitation, soil quality and the slope of the landscape interact with human use patterns (e.g., arable or grazing land, settlement or recreation areas). In any case, different sets of NCPs/ESs prevail, and which ones dominate is a matter of land management, balancing human demand and regional provisioning capabilities, which are determined to a high degree by natural factors. Being aware of the prevailing distributional patterns could be a starting point to assess if they represent a sustainable land use pattern, i.e., using different areas in a way best in line with their biophysical traits, or if current patterns—often historically developed—have to be gradually shifted, in particular due to the impacts of climate change. Such shifts of use patterns include attempts to modify historically developed identities, and “people’s indicators” could be a means to recognize if and where a readiness exists and where more information is needed on the necessities to adapt to climate change.
To better capture the multidimensionality of different services, we have used more than one indicator for certain aspects. Most of them have been aggregated without weighting; i.e., all had a weight of 1/n. This leads to a more than proportional weight allocated to some issues, a decision which could be modified at any time if good arguments for different weight attributions are presented, in particular from local sources that we could not access in this study.
Given that the assessment focused on mapping and visualization of NCPs/ESs, the following interpretation of results is a qualitative description based on the visual inspection of the maps, and recognizing patterns in them, while fine-grain differences, meaningful once the methodology has been developed further, might in the future be better detected by using AI support.
Figure 3 shows that high levels of provisioning ESs/NCPs are concentrated in the southeastern part of France, while the rest of the country is found to enjoy relatively lower levels of provisioning ESs/NCPs. A concentration of agriculture and forestry, or bioeconomy more generally, probably explains this finding, together with suitable climate conditions and a limited land use for settlements as compared to other parts of France, such as the Ile de France or the Cote d’Azur. Interestingly, the distribution of regulating ESs/NCPs diverges from that of the provisioning ones, in that they are more evenly distributed within Southern France (see Figure 4). Moreover, a high concentration of regulating ESs/NCPs covered a greater area of France as compared to a high concentration of provisioning ones. This means that some regions contribute to regulating services as a part of the public good, but benefit comparably less from provisioning NCPs/ESs.
The distribution of cultural ESs/NCPs (Figure 5) appears to be significantly different from that of provisioning and regulating ones (Figure 3 and Figure 4), which exhibit lower concentrations of ESs/NCPs mainly in Northern France. However, it is here, in the north, where a higher concentration of cultural ESs/NCPs was found, while the most southern part of France is characterized by a rather low concentration of cultural ESs/NCPs. It would be interesting to investigate if the long-established political dominance of the more northern Paris region has affected the definition of what is considered culturally valuable, to the detriment of the French South. The general north–south divide of high and low concentrations of cultural ESs/NCPs is replicated on the Island of Corsica. Further, areas of high concentration of provisioning ecosystem services correspond with areas of low concentration of cultural ecosystem services, particularly in Southeastern France. This does not imply that the identification with the country and the region is weaker in one part than in others, but it can be a hint that the composition of identity-supporting elements can be regionally different. In some regions, ESs/NCPs may play a dominant role, while in others, human artifacts such as ancient buildings may be decisive.
We conclude that provisioning, regulating and cultural services and contributions are geographically distributed in very different ways and further analysis is required to assess the degree of complementarity, existing feedback loops and tipping points that occur between various subsystems represented by different layers. Our pilot research clearly illustrated the feasibility of conducting a highly disaggregated multidimensional assessment of ESs/NCPs and biodiversity at the national scale to be used for decision making by government, business and conservation organizations. The future practical applications of the present study will include the assessment of impacts of business activities on ES and NCP provision and strategic ways to restore ecosystems and transform business practices.
In light of the increased interest in the issues of biodiversity and nature-based solutions in policy circles and a broader understanding that businesses and governments must do more to protect and restore ecosystems, the European Commission published a new directive [116] on Corporate Sustainability Reporting that entered into force on 5 January 2023. The Global Reporting Initiative is preparing a new international standard for biodiversity reporting in partnership with the Global Sustainability Standards Board. The new Nature-Related Risk and Opportunity Management Framework by the Nature-Related Financial Disclosures is hot off the press as of March 2023. At the same time, according to the World Benchmarking Alliance report, only 5% of 389 companies surveyed conducted a science-based assessment of the extent to which their operations are making an impact on biodiversity and ecosystems, while less than 1% of the companies were reported to understand how their operations are dependent on nature. We have undertaken our study for the exact purpose of filling this gap. A detailed mapping of ecosystem services and nature’s contributions to people on a scale we have attempted has not been carried out before following a systemic and comprehensive framework. Our results represent but a first step on the journey to including ecosystems and biodiversity in decision making at all levels.
Finally, a number of indicators are still used as proxies for indicanda that are being characterized and assessed; therefore, additional work is required to enhance the resolution of such an assessment, especially in relation to the cultural ecosystem services. Where these proxies have a significant influence on the final results shown in Figure 3, Figure 4 and Figure 5, they should be handled with care and not overemphasized.

Supplementary Materials

The following supporting information can be downloaded at: https://www.mdpi.com/article/10.3390/su15097557/s1. Table S1. Datasets used in the analysis (Source: Environment Europe Foundation). References [117,118,119,120,121,122,123,124,125,126,127,128,129,130,131,132,133,134,135,136,137] are cited in the Supplementary Materials.

Author Contributions

Conceptualization, S.E.S.; methodology, S.E.S. and J.H.S.; formal analysis, L.A.; investigation, L.A.; data curation, L.A.; writing—original draft, L.A.; writing—review and editing, S.E.S. and J.H.S.; supervision, S.E.S.; project administration, S.E.S. All authors have read and agreed to the published version of the manuscript.

Funding

This research received no external funding.

Institutional Review Board Statement

Not applicable.

Informed Consent Statement

Not applicable.

Data Availability Statement

All data generated in this study is the property of Environment Europe Limited and Environment Europe Foundation.

Conflicts of Interest

The authors declare no conflict of interest.

Appendix A

Figure A1. Multiple data layers illustrating provisioning, regulating and cultural ESs and NCPs in France.
Sustainability 15 07557 g0a1aSustainability 15 07557 g0a1bSustainability 15 07557 g0a1c

References

  1. Braat, L.C.; de Groot, R. The ecosystem services agenda: Bridging the worlds of natural science and economics, conservation and development, and public and private policy. Ecosyst. Serv. 2012, 1, 4–15. [Google Scholar] [CrossRef]
  2. De Groot, R.S.; Wilson, M.A.; Boumans, R.M. A typology for the classification, description and valuation of ecosystem functions, goods and services. Ecol. Econ. 2002, 41, 393–408. [Google Scholar] [CrossRef]
  3. Palmer, M.A.; Febria, C.M. The heartbeat of ecosystems. Science 2012, 336, 1393–1394. [Google Scholar] [CrossRef] [PubMed]
  4. IPBES Intergovernmental Science-Policy Platform on Biodiversity and Ecosystem Services. Methodological Assessment Report on the Diverse Values and Valuation of Nature of the Intergovernmental Science-Policy Platform on Biodiversity and Ecosystem Services. In Summary for Policymakers; Pascual, U., Balvanera, P., Christie, M., Baptiste, B., González-Jiménez, D., Anderson, C.B., Vatn, A., Eds.; IPBES: Bonn, Germany, 2022; p. 52. [Google Scholar] [CrossRef]
  5. IPBES Intergovernmental Science-Policy Platform on Biodiversity and Ecosystem Services. Preliminary guide regarding diverse conceptualization of multiple values of nature and its benefits, including biodiversity and ecosystem functions and services. In Proceedings of the Intergovernmental Science-Policy Platform on Biodiversity and Ecosystem Services, Fourth Session, Kuala Lumpur, Malaysia, 22–28 February 2016; IPBES: Bonn, Germany, 2015. [Google Scholar]
  6. IPBES Intergovernmental Science-Policy Platform on Biodiversity and Ecosystem Services. Global Assessment Report on Biodiversity and Ecosystem Services of the Intergovernmental Science-Policy Platform on Biodiversity and Ecosystem Services; Brondizio, E.S., Settele, J., Díaz, S., Ngo, H.T., Eds.; IPBES: Bonn, Germany, 2019. [Google Scholar]
  7. WWF. Living Planet Report 2020—Bending the Curve of Biodiversity Loss; Almond, R.E.A., Grooten, M., Petersen, T., Eds.; WWF: Gland, Switzerland, 2020. [Google Scholar]
  8. IPBES Intergovernmental Science-Policy Platform on Biodiversity and Ecosystem Services. Workshop Report on Biodiversity and Pandemics; Daszak, P., Amuasi, J., das Neves, C.G., Hayman, D., Kuiken, T., Roche, B., Zambrana-Torrelio, C., Buss, P., Dundarova, H., Feferholtz, Y., Eds.; IPBES: Bonn, Germany, 2020. [Google Scholar] [CrossRef]
  9. Shmelev, S.E. Ecosystems: Complexity, Diversity and Nature’s Contribution to Humanity (with Text by Joachim, H. Spangenberg); Environment Europe Press: Hague, The Netherlands, 2018; 302p. [Google Scholar]
  10. UNEP; Schandl, H.; Fischer-Kowalski, M.; West, J.; Giljum, S.; Dittrich, M.; Eisenmenger, N.; Geschke, A.; Lieber, M.; Wieland, H.P.; et al. Global Material Flows and Resource Productivity. An Assessment Study of the UNEP International Resource Panel; United Nations Environment Programme: Paris, France, 2016. [Google Scholar]
  11. UNEP IRP, United Nations Environment Programme International Resource Panel; Oberle, B.; Bringezu, S.; Hatfeld-Dodds, S.; Hellweg, S.; Schandl, H.; Clement, J.; Cabernard, L.; Che, N.; Chen, D.; et al. Global Resources Outlook 2019: Natural Resources for the Future We Want; IRP Reports; UNEP United Nations Environment Programme: Nairobi, Kenya, 2019; p. 162. [Google Scholar]
  12. Lenzen, M.; Moran, D.; Kanemoto, K.; Foran, B.; Lobefaro, L.; Geschke, A. International trade drives biodiversity threats in developing nations. Nature 2012, 486, 109–112. [Google Scholar] [CrossRef] [PubMed]
  13. Bowles, N.; Alexander, S.; Hadjikakou, M. The livestock sector and planetary boundaries: A ‘limits to growth’ perspective with dietary implications. Ecol. Econ. 2019, 160, 128–136. [Google Scholar] [CrossRef]
  14. Steffen, W.; Richardson, K.; Rockström, J.; Cornell, S.E.; Fetzer, I.; Bennett, E.M.; Biggs, R.; Carpenter, S.R.; de Vries, W.; de Wit, C.A.; et al. Planetary boundaries: Guiding human development on a changing planet. Science 2015, 347, 1259855. [Google Scholar] [CrossRef]
  15. Sukhdev, P.; Wittmer, H.; Schröter-Schlaack, C.; Nesshöver, C.; Bishop, J.; Brink, P.T.; Simmons, B. The Economics of Ecosystems and Biodiversity: Mainstreaming the Economics of Nature: A Synthesis of the Approach, Conclusions and Recommendations of TEEB (No. 333.95 E19); UNEP: Geneva, Switzerland, 2010. [Google Scholar]
  16. TEEB. The Economics of Ecosystems and Biodiversity Ecological and Economic Foundations; Kumar, P., Ed.; Earthscan: London, UK; Washington, DC, USA, 2010. [Google Scholar]
  17. DesRoches, T.C. What Is Natural about Natural Capital during the Anthropocene? Sustainability 2018, 10, 806. [Google Scholar] [CrossRef]
  18. Missemer, A. Natural Capital as an Economic Concept, History and Contemporary Issues. Ecol. Econ. 2018, 143, 90–96. [Google Scholar] [CrossRef]
  19. Spangenberg, J.H.; Settele, J. Precisely incorrect? Monetising the value of ecosystem services. Ecol. Complex. 2010, 7, 327–337. [Google Scholar] [CrossRef]
  20. Gunton, R.M.; Marsh, C.J.; Moulherat, S.; Malchow, A.-K.; Bocedi, G.; Klenke, R.A.; Kunin, W.E. Multicriterion trade-offs and synergies for spatial conservation planning. J. Appl. Ecol. 2016, 54, 903–913. [Google Scholar] [CrossRef]
  21. Small, N.; Munday, M.; Durance, I. The challenge of valuing ecosystem services that have no material benefits. Glob. Environ. Change 2017, 44, 57–67. [Google Scholar] [CrossRef]
  22. Spangenberg, J.H.; Settele, J. Value pluralism and economic valuation—Defendable if well done. Ecosyst. Serv. 2016, 18, 100–109. [Google Scholar] [CrossRef]
  23. Costanza, R.; Kubiszewski, I.; Stoeckl, N.; Kompas, T. Pluralistic discounting recognizing different capital contributions: An example estimating the net present value of global ecosystem services. Ecol. Econ. 2021, 183, 106961. [Google Scholar] [CrossRef]
  24. United Nations. System of Environmental-Economic Accounting—Ecosystem Accounting (SEEA EA); United Nations: New York, NY, USA, 2021. [Google Scholar]
  25. Ruckelshaus, M.; McKenzie, E.; Tallis, H.; Guerry, A.; Daily, G.; Kareiva, P.; Polasky, S.; Ricketts, T.; Bhagabati, N.; Wood, S.A.; et al. Notes from the field: Lessons learned from using ecosystem service approaches to inform real-world decisions. Ecol. Econ. 2015, 115, 11–21. [Google Scholar] [CrossRef]
  26. Spangenberg, J.H. Indicators for Sustainable Development. In Routledge International Handbook of Sustainable Development; Redclift, M., Springett, D., Eds.; Routledge: Abingdon, UK, 2015; Chapter 20; pp. 308–322. [Google Scholar]
  27. Tammi, I.; Mustajärvi, K.; Rasinmäki, J. Integrating spatial valuation of ecosystem services into regional planning and development. Ecosyst. Serv. 2017, 26, 329–344. [Google Scholar] [CrossRef]
  28. Willcock, S.; Martinez-Lopez, J.; Dandy, N.; Bullock, J.M. High Spatial-Temporal Resolution Data across Large Scales Are Needed to Transform Our Understanding of Ecosystem Services. Land 2021, 10, 759. [Google Scholar] [CrossRef]
  29. Millennium Ecosystem Assessment. Ecosystems and Human Well-being; Island Press: Washington, DC, USA, 2005. [Google Scholar]
  30. Mace, G.M.; Bateman, I.; Albon, S.; Balmford, A.; Brown, C.; Church, A.; Haines-Young, R.; Pretty, J.N.; Turner, K.; Vira, B.; et al. Chapter 2: Conceptual framework and methodology. In United Kingdom National Ecosystem Assessment: Technical Report; UNEP-WCMC: Cambridge, UK, 2011; pp. 12–26. [Google Scholar]
  31. Díaz, S.; Pascual, U.; Stenseke, M.; Martín-López, B.; Watson, R.T.; Molnár, Z.; Hill, R.; Chan, K.M.A.; Baste, I.A.; Brauman, K.A.; et al. Assessing nature’s contributions to people. Science 2018, 359, 270–272. [Google Scholar] [CrossRef]
  32. Dasgupta, P. The Economics of Biodiversity: The Dasgupta Review; HM Treasury: London, UK, 2021. [Google Scholar]
  33. Mandle, L.; Shields-Estrada, A.; Chaplin-Kramer, R.; Mitchell, M.G.E.; Bremer, L.L.; Gourevitch, J.D.; Hawthorne, P.; Johnson, J.A.; Robinson, B.E.; Smith, J.R.; et al. Increasing decision relevance of ecosystem service science. Nat. Sustain. 2020, 4, 161–169. [Google Scholar] [CrossRef]
  34. CICES. Towards a Common International Classification for Ecosystem Service v.4.3. 2013. Available online: http://cices.eu/resources/ (accessed on 15 January 2021).
  35. Shmelev, S.E. Multi-Criteria Assessment of Ecosystems and Biodiversity: New Dimensions and Stakeholders in the South of France; University of Oxford, Department of International Development: Oxford, UK, 2010. [Google Scholar]
  36. Shmelev, S.E. Economic Valuation and Decision Making: MCDA as a Tool for the Future. In Ecological Economics; Springer: Dordrecht, The Netherlands, 2012; pp. 57–74. [Google Scholar]
  37. Benayas, J.M.R.; Newton, A.C.; Diaz, A.; Bullock, J.M. Enhancement of biodiversity and ecosystem services by ecological restoration: A meta-analysis. Science 2009, 325, 1121–1124. [Google Scholar] [CrossRef]
  38. Rolando, J.L.; Turin, C.; Ramírez, D.A.; Mares, V.; Monerris, J.; Quiroz, R. Key ecosystem services and ecological intensification of agriculture in the tropical high-Andean Puna as affected by land-use and climate changes. Agric. Ecosyst. Environ. 2017, 236, 221–233. [Google Scholar] [CrossRef]
  39. Harrison, P.A.; Berry, P.M.; Simpson, G.; Haslett, J.R.; Blicharska, M.; Bucur, M.; Dunford, R.; Egoh, B.; Garcia-Llorente, M.; Geamănă, N.; et al. Linkages between biodiversity attributes and ecosystem services: A systematic review. Ecosyst. Serv. 2014, 9, 191–203. [Google Scholar] [CrossRef]
  40. Darvill, R.; Lindo, Z. The inclusion of stakeholders and cultural ecosystem services in land management trade-off decisions using an ecosystem services approach. Landsc. Ecol. 2016, 31, 533–545. [Google Scholar] [CrossRef]
  41. Fisher, B.; Turner, R.K.; Morling, P. Defining and classifying ecosystem services for decision making. Ecol. Econ. 2009, 68, 643–653. [Google Scholar] [CrossRef]
  42. Olson, K.R.; Morton, L.W. Managing the upper Missouri River for agriculture irrigation, flood control, and energy. J. Soil Water Conserv. 2017, 72, 105A–110A. [Google Scholar] [CrossRef]
  43. Martinez-Alier, J.; Munda, G.; O’Neill, J. Weak comparability of values as a foundation for ecological economics. Ecol. Econ. 1998, 26, 277–286. [Google Scholar] [CrossRef]
  44. Norgaard, R. Ecosystem services: From eye-opening metaphor to complexity blinder. Ecol. Econ. 2010, 69, 1219–1227. [Google Scholar] [CrossRef]
  45. Söderbaum, P. Ecological economics in relation to democracy, ideology and politics. Ecol. Econ. 2013, 95, 221–225. [Google Scholar] [CrossRef]
  46. Gomez-Baggethun, E.; de Groot, R.; Lomas, P.L.; Montes, C. The history of ecosystem services in economic theory and practice: From early notions to markets and payment schemes. Ecol. Econ. 2010, 69, 1209–1218. [Google Scholar] [CrossRef]
  47. Gowdy, J.; Rosser, J.B., Jr.; Roy, L. The evolution of hyperbolic discounting: Implications for truly social valuation of the future. J. Econ. Behav. Organ. 2013, 90, S94–S104. [Google Scholar] [CrossRef]
  48. Nordhaus, W. Critical Assumptions in the Stern Review on Climate Change. Science 2007, 317, 201–202. [Google Scholar] [CrossRef]
  49. Smith, K. Discounting, Risk and Uncertainty in Economic Appraisals of Climate Change Policy: Comparing Nordhaus, Garnaut and Stern; Citeseer: Canberra, NS, Australia, 2011. [Google Scholar]
  50. EFESE. Cadre Conceptuel. 2017. Available online: https://ree.developpement-durable.gouv.fr/themes/defis-environnementaux/erosion-de-la-biodiversite/evaluations-mondiales-et-nationales/article/l-evaluation-francaise-des-ecosystemes-et-des-services-ecosystemiques-efese (accessed on 21 December 2020).
  51. Maes, J.; Teller, A.; Erhard, M.; Liquete, C.; Braat, L.; Berry, P.; Santos-Martín, F. Mapping and Assessment of Ecosystems and Their Services—An Analytical Framework for Ecosystem Assessments under Action 5 of the EU Biodiversity Strategy to 2020; EU Joint Research Centre, JCR Policy Reports: Luxembourg, 2015. [Google Scholar]
  52. Haines-Young, R.; Potschin, M.B. Common international classification of ecosystem services (CICES, Version 4.1). Eur. Environ. Agency 2012, 33, 107. [Google Scholar]
  53. Haines-Young, R.; Potschin, M.B. Common International Classification of Ecosystem Services (CICES) V5.1 and Guidance on the Application of the Revised Structure. 2018. Available online: https://cices.eu/ (accessed on 20 April 2021).
  54. EEA European Environment Agency. CICES—Towards a Common Classification of Ecosystem Services. Hosted on Behalf of the EEA. 2023. Available online: https://cices.eu/cices-structure/ (accessed on 15 January 2021).
  55. Spangenberg, J.H. Sustainability and the Challenge of Complex Systems. In Theories of Sustainable Development; Routledge Studies in Sustainable Development Series, Enders, J.C., Remig, M., Eds.; Routledge: Abingdon, UK, 2015; pp. 89–111. [Google Scholar]
  56. Sustainable Seattle. The Sustainable Seattle 1993 Indicators of A Sustainable Community. 1993. Available online: https://communityindicators.net/resources/sustainable-seattles-indicators-or-sustainable-community/ (accessed on 15 January 2021).
  57. European Commission Joint Research Centre. Available online: https://joint-research-centre.ec.europa.eu/index_en (accessed on 15 January 2021).
  58. European Soil Data Centre. Available online: https://esdac.jrc.ec.europa.eu/ (accessed on 15 January 2021).
  59. Harvard Dataverse. Available online: https://data.harvard.edu/dataverse (accessed on 15 January 2021).
  60. Open Street Maps. Available online: https://www.openstreetmap.org/#map=6/51.330/10.453 (accessed on 15 January 2021).
  61. Castro, A.J.; Martín-López, B.; López, E.; Plieninger, T.; Alcaraz-Segura, D.; Vaughn, C.C.; Cabello, J. Do protected areas networks ensure the supply of ecosystem services? Spatial patterns of two nature reserve systems in semi-arid Spain. Appl. Geogr. 2015, 60, 1–9. [Google Scholar] [CrossRef]
  62. Mokondoko, P.; Manson, R.H.; Ricketts, T.H.; Geissert, D. Spatial analysis of ecosystem service relationships to improve targeting of payments for hydrological services. PLoS ONE 2018, 13, e0192560. [Google Scholar] [CrossRef] [PubMed]
  63. Maes, J.; Paracchini, M.L.; Zulian, G.; Dunbar, M.B.; Alkemade, R. Synergies and trade-offs between ecosystem service supply, biodiversity, and habitat conservation status in Europe. Biol. Conserv. 2012, 155, 1–12. [Google Scholar] [CrossRef]
  64. Lenormand, M.; Papuga, G.; Argagnon, O.; Soubeyrand, M.; De Barros, G.; Alleaume, S.; Luque, S. Biogeographical network analysis of plant species distribution in the Mediterranean region. Ecol. Evol. 2019, 9, 237–250. [Google Scholar] [CrossRef]
  65. Wilson, J.E. Terroir: The Role of Geology, Climate and Culture in the Making of French Wines; University of California Press: Oakland, CA, USA, 1998. [Google Scholar]
  66. Bachrach, B.S.; Blondel, J.F.P.; Popkin, J.D.; Woloch, I.; Weber, E.; Bernard, F.; Bisson, T.N.; Drinkwater, J.F.; Shennan, J.H.; Flower, J.E.; et al. France. Encyclopedia Britannica. 2021. Available online: https://www.britannica.com/place/France (accessed on 7 January 2021).
  67. France.fr. Geography and Climate. 2020. Available online: https://www.france.fr/en/holiday-prep/geography-and-climate (accessed on 20 December 2020).
  68. Sargeant, C.I.; Singer, M.B. Subannual variability in historical water source use by Mediterranean riparian trees. Ecohydrology 2016, 9, 1328–1345. [Google Scholar] [CrossRef]
  69. Hickler, T.; Vohland, K.; Feehan, J.; Miller, P.A.; Smith, B.; Costa, L.; Giesecke, T.; Fronzek, S.; Carter, T.R.; Cramer, W.; et al. Projecting the future distribution of European potential natural vegetation zones with a generalized, tree species-based dynamic vegetation model. Glob. Ecol. Biogeogr. 2012, 21, 50–63. [Google Scholar] [CrossRef]
  70. Balmford, A.; Rodrigues, S.I.; Walpole, M.; Ten Brink, P.; Kettunen, M.; Braat, L.; De Groot, R.S. The Economics of Biodiversity and Ecosystems: Scoping the Science; European Commission: Brussels, Belgium, 2008. [Google Scholar]
  71. Church, A.; Fish, R.; Haines-Young, R.; Mourato, S.; Tratalos, J.; Stapleton, L.; Willis, C. UK National Ecosystem Assessment Follow-on: Cultural Ecosystem Services and Indicators; UNEP-WCMC: Cambridge, UK, 2014. [Google Scholar]
  72. Naidoo, R.; Balmford, A.; Costanza, R.; Fisher, B.; Green, R.E.; Lehner, B.; Malcolm, T.R.; Ricketts, T.H. Global mapping of ecosystem services and conservation priorities. Proc. Natl. Acad. Sci. USA 2008, 105, 9495–9500. [Google Scholar] [CrossRef]
  73. Crouzat, E.; Mouchet, M.; Turkelboom, F.; Byczek, C.; Meersmans, J.; Berger, F.; Lavorel, S. Assessing bundles of ecosystem services from regional to landscape scale: Insights from the French Alps. J. Appl. Ecol. 2015, 52, 1145–1155. [Google Scholar] [CrossRef]
  74. Le Clec’h, S.; Finger, R.; Buchmann, N.; Gosal, A.S.; Hörtnagl, L.; Huguenin-Elie, O.; Jeanneret, P.; Lüscher, A.; Schneider, M.K.; Huber, R. Assessment of spatial variability of multiple ecosystem services in grasslands of different intensities. J. Environ. Manag. 2019, 251, 109372. [Google Scholar] [CrossRef]
  75. Chan, K.M.; Shaw, M.R.; Cameron, D.R.; Underwood, E.C.; Daily, G.C. Conservation planning for ecosystem services. PLoS Biol. 2006, 4, e379. [Google Scholar] [CrossRef] [PubMed]
  76. Mace, G.M.; Baillie, J.E. The 2010 biodiversity indicators: Challenges for science and policy. Conserv. Biol. 2007, 21, 1406–1413. [Google Scholar] [CrossRef] [PubMed]
  77. Mills, M.B.; Malhi, Y.; Ewers, R.M.; Kho, L.K.; Teh, Y.A.; Both, S.; Burslem, D.F.R.P.; Majalap, N.; Nilus, R.; Huasco, W.H.; et al. Tropical forests post-logging are a persistent net carbon source to the atmosphere. Proc. Natl. Acad. Sci. USA 2023, 120, e2214462120. [Google Scholar] [CrossRef]
  78. Bertrand, M.; Barot, S.; Blouin, M.; Whalen, J.; de Oliveira, T.; Roger-Estrade, J. Earthworm services for cropping systems. A review. Agron. Sustain. Dev. 2015, 35, 553–567. [Google Scholar] [CrossRef]
  79. Ojha, R.B.; Devkota, D. Earthworms: Soil and ecosystem engineers—A review. World J. Agric. Res. 2014, 2, 257–260. [Google Scholar] [CrossRef]
  80. Banwart, S.A.; Noellemeyer, E.; Milne, E. (Eds.) Soil Carbon: Science, Management and Policy for Multiple Benefits; CABI: Wallingford, UK, 2014; Volume 71. [Google Scholar]
  81. Schröder, J.J.; Schulte, R.P.O.; Creamer, R.E.; Delgado, A.; van Leeuwen, J.; Lehtinen, T.; Rutgers, M.; Spiegel, H.; Staes, J.; Tóth, G.; et al. The elusive role of soil quality in nutrient cycling: A review. Soil Use Manag. 2016, 32, 476–486. [Google Scholar] [CrossRef]
  82. Ayangbenro, A.S.; Babalola, O.O. A new strategy for heavy metal polluted environments: A review of microbial biosorbents. Int. J. Environ. Res. Public Health 2017, 14, 94. [Google Scholar] [CrossRef]
  83. Sherameti, I.; Varma, A. Heavy Metal Contamination of Soils; Springer: Berlin/Heidelberg, Germany, 2015. [Google Scholar]
  84. Wuana, R.A.; Okieimen, F.E. Heavy Metals in Contaminated Soils: A Review of Sources, Chemistry, Risks and Best Available Strategies for Remediation. ISRN Ecol. 2011, 2011, 402647. [Google Scholar] [CrossRef]
  85. Wood, M.D.; Kumar, P.; Negandhi, D.; Verma, M. Guidance Manual for the Valuation of Regulating Services; UNEP: Liverpool, UK, 2010. [Google Scholar]
  86. Reyers, B.; O’Farrell, P.J.; Cowling, R.M.; Egoh, B.N.; Le Maitre, D.C.; Vlok, J.H. Ecosystem services, land-cover change, and stakeholders: Finding a sustainable foothold for a semiarid biodiversity hotspot. Ecol. Soc. 2009, 14, 38. [Google Scholar] [CrossRef]
  87. Mitsch, W.J.; Bernal, B.; Hernandez, M.E. Ecosystem services of wetlands. Int. J. Biodivers. Sci. Ecosyst. Serv. Manag. 2015, 11, 1–4. [Google Scholar] [CrossRef]
  88. Dordio, A.; Palace, A.J.; Pinto, A.P. Wetlands: Water Living Filters? Nova Science Publishers: Hauppauge, NY, USA, 2008. [Google Scholar]
  89. Moleon, M.; Sanchez-Zapata, J.A.; Margalida, A.; Carrete, M.; Owen-Smith, N.; Donazar, J.A. Humans and scavengers: The evolution of interactions and ecosystem services. BioScience 2014, 64, 394–403. [Google Scholar] [CrossRef]
  90. Perfecto, I.; Vandermeer, J. The effect of an ant-hemipteran mutualism on the coffee berry borer (Hypothenemus hampei) in Southern Mexico. Agric. Ecosyst. Environ. 2006, 117, 218–221. [Google Scholar] [CrossRef]
  91. Sutter, L.; Albrecht, M. Synergistic interactions of ecosystem services: Florivorous pest control boosts crop yield increase through insect pollination. Proc. R. Soc. B Biol. Sci. 2016, 283, 20152529. [Google Scholar] [CrossRef]
  92. Anjos, D.V.; Tena, A.; Viana-Junior, A.B.; Carvalho, R.L.; Torezan-Silingardi, H.; Del-Claro, K.; Perfecto, I. The effects of ants on pest control: A meta-analysis. Proc. R. Soc. B Biol. Sci. 2022, 289, 20221316. [Google Scholar] [CrossRef] [PubMed]
  93. DeLong, J.P.; Uiterwaal, S.F. Predator functional responses and the biocontrol of aphids and mites. BioControl 2022, 67, 161–172. [Google Scholar] [CrossRef]
  94. Karp, D.S.; Daily, G.C. Cascading effects of insectivorous birds and bats in tropical coffee plantations. Ecology 2014, 95, 1065–1074. [Google Scholar] [CrossRef]
  95. Maas, B.; Clough, Y.; Tscharntke, T. Bats and birds increase crop yield in tropical agroforestry landscapes. Ecol. Lett. 2013, 16, 1480–1487. [Google Scholar] [CrossRef]
  96. Williams-Guillén, K.; Perfecto, I. Effects of agricultural intensification on the assemblage of leaf-nosed bats (Phyllostomidae) in a coffee landscape in Chiapas, Mexico. Biotropica 2010, 42, 605–613. [Google Scholar] [CrossRef]
  97. Morand, S.; Lajaunie, C. Outbreaks of Vector-Borne and Zoonotic Diseases Are Associated with Changes in Forest Cover and Oil Palm Expansion at Global Scale. Front. Vet. Sci. 2021, 8, 661063. [Google Scholar] [CrossRef]
  98. Bagstad, K.J.; Villa, F.; Batker, D.; Harrison-Cox, J.; Voigt, B.; Johnson, G.W. From theoretical to actual ecosystem services: Mapping beneficiaries and spatial flows in ecosystem service assessments. Ecol. Soc. 2014, 19, 64. [Google Scholar] [CrossRef]
  99. McConnell, V.; Walls, M.A. The Value of Open Space: Evidence from Studies of Nonmarket Benefits; Resources for the Future: Washington, DC, USA, 2005; pp. 1–78. [Google Scholar]
  100. Blicharska, M.; Mikusiński, G. Incorporating social and cultural significance of large old trees in conservation policy. Conserv. Biol. 2014, 28, 1558–1567. [Google Scholar] [CrossRef] [PubMed]
  101. Kati, V.; Hovardas, T.; Dieterich, M.; Ibisch, P.L.; Mihok, B.; Selva, N. The challenge of implementing the European network of protected areas Natura 2000. Conserv. Biol. 2015, 29, 260–270. [Google Scholar] [CrossRef]
  102. Vlami, V.; Kokkoris, I.P.; Zogaris, S.; Cartalis, C.; Kehayias, G.; Dimopoulos, P. Cultural landscapes and attributes of “culturalness” in protected areas: An exploratory assessment in Greece. Sci. Total Environ. 2017, 595, 229–243. [Google Scholar] [CrossRef] [PubMed]
  103. Vlami, V.; Kokkoris, I.P.; Zogaris, S.; Kehayias, G.; Dimopoulos, P. Cultural Ecosystem Services in the Natura 2000 Network: Introducing Proxy Indicators and Conflict Risk in Greece. Land 2020, 10, 4. [Google Scholar] [CrossRef]
  104. Winkler, K.J.; Viers, J.H.; Nicholas, K.A. Assessing ecosystem services and multifunctionality for vineyard systems. Front. Environ. Sci. 2017, 5, 15. [Google Scholar] [CrossRef]
  105. Beckert, J.; Rössel, J.; Schenk, P. Wine as a cultural product: Symbolic capital and price formation in the wine field. Sociol. Perspect. 2017, 60, 206–222. [Google Scholar] [CrossRef]
  106. Winkler, K.J.; Nicholas, K.A. More than wine: Cultural ecosystem services in vineyard landscapes in England and California. Ecol. Econ. 2016, 124, 86–98. [Google Scholar] [CrossRef]
  107. Orre-Gordon, S.; Jacometti, M.; Tompkins, J.; Wratten, S.D. Viticulture can be modified to provide multiple ecosystem services. In Ecosystem Services in Agricultural and Urban Landscapes; Wiley: Hoboken, NJ, USA, 2013; pp. 43–57. [Google Scholar]
  108. Trubek, A.B. The Taste of Place: A Cultural Journey into Terroir; University of California Press: Oakland, CA, USA, 2008; Volume 20. [Google Scholar]
  109. UNESCO. World Heritage List. 2016. Available online: http://whc.unesco.org/en/list (accessed on 20 July 2016).
  110. Campbell, C.; Granett, J. Books and arts-Phylloxera: How Wine was Saved for the World? Nature 2004, 428, 20. [Google Scholar]
  111. Polasky, S.; Nelson, E.; Camm, J.; Csuti, B.; Fackler, P.; Lonsdorf, E.; Montgomery, C.; White, D.; Arthur, J.; Garber-Yonts, B.; et al. Where to put things? Spatial land management to sustain biodiversity and economic returns. Biol. Conserv. 2008, 141, 1505–1524. [Google Scholar] [CrossRef]
  112. Nicholas, K.A.; Durham, W.H. Farm-scale adaptation and vulnerability to environmental stresses: Insights from winegrowing in Northern California. Glob. Environ. Change 2012, 22, 483–494. [Google Scholar] [CrossRef]
  113. Dias, C.; Mendes, L. Protected designation of origin (PDO), protected geographical indication (PGI) and traditional speciality guaranteed (TSG): A bibiliometric analysis. Food Res. Int. 2018, 103, 492–508. [Google Scholar] [CrossRef] [PubMed]
  114. Fran, B. The Social Life of Cheese. 2019. Available online: https://hraf.yale.edu/the-social-life-of-cheese/ (accessed on 30 December 2020).
  115. Grasseni, C. Re-inventing food: Alpine cheese in the age of global heritage. Anthropol. Food 2011, 8. [Google Scholar] [CrossRef]
  116. European Commission. Directive (EU) 2022/2464 of the European Parliament and of the Council of 14 December 2022 amending Regulation (EU) No 537/2014, Directive 2004/109/EC, Directive 2006/43/EC and Directive 2013/34/EU, as Regards Corporate Sustainability Reporting; European Commission: Brussels, Belgium, 2022. [Google Scholar]
  117. Vallecillo, S. INCA—Crop Provision—ES Flow—2012; European Commission, Joint Research Centre (JRC): Brussels, Belgium, 2018. [Google Scholar]
  118. Gilbert, M.; Nicolas, G.; Cinardi, G.; Van Boeckel, T.P.; Vanwambeke, S.O.; Wint, G.W.; Robinson, T.P. Global distribution data for cattle, buffaloes, horses, sheep, goats, pigs, chickens and ducks in 2010. Sci. Data 2018, 5, 1–11. [Google Scholar] [CrossRef] [PubMed]
  119. Rob, L. Global Wilderness; UNEP-WCMC: Cambridge, UK, 1998. [Google Scholar]
  120. Vallecillo, S. INCA—Timber Provision—ES Flow—2012; European Commission, Joint Research Centre (JRC): Brussels, Belgium, 2019. [Google Scholar]
  121. Santoro, M.; Cartus, O.; Mermoz, S.; Bouvet, A.; Le Toan, T.; Carvalhais, N.; Seifert, F.M. GlobBiomass Global Above-Ground Biomass and Growing Stock Volume Datasets; Technical Report; GlobBiomass: Jena, Germany, 2018; Available online: http://globbiomass.org/products/global-mapping (accessed on 28 April 2020).
  122. Caudullo, G.; Welk, E.; San-Miguel-Ayanz, J. Chorological maps for the main European woody species: Supplementary material. Data Brief 2017, 12, 662–666. [Google Scholar] [CrossRef] [PubMed]
  123. Hoekstra, J.M.; Molnar, J.L.; Jennings, M.; Revenga, C. The Atlas of Global Conservation: Changes, Challenges and Opportunities to Make a Difference; University of California Press: Berkley, CA, USA, 2010. [Google Scholar]
  124. Ballabio, C.; Lugato, E.; Fernández-Ugalde, O.; Orgiazzi, A.; Jones, A.; Borrelli, P.; Montanarella, L.; Panagos, P. Mapping LUCAS topsoil chemical properties at European scale using Gaussian process regression. Geoderma 2019, 355, 113912. [Google Scholar] [CrossRef] [PubMed]
  125. Schroeder, P.A.; Ece, Ö.I.; Demirel, C.; Milewski, A. Reconnaissance oxygen and hydrogen stable isotope geochemistry of waters from the critical zone in the Iznik Lake basin region, Turkey. In Proceedings of the 7th International Geochemistry Symposium, Antalya, Turkey, 16–18 May 2016. [Google Scholar]
  126. van Donkelaar, A.; Martin, R.V.; Brauer, M.; Hsu, N.C.; Kahn, R.A.; Levy, R.C.; Lyapustin, A.; Sayer, A.M.; Winker, D.M. Global Annual PM2.5 Grids from MODIS, MISR and SeaWiFS Aerosol Optical Depth (AOD) with GWR, 1998–2016; NASA Socioeconomic Data and Applications Center (SEDAC): Palisades, NY, USA, 2018. [Google Scholar]
  127. Maes, J. Water Retention Index; European Commission, Joint Research Centre (JRC): Brussels, Belgium, 2010. [Google Scholar]
  128. Maes, J. Soil Erosion Control; European Commission, Joint Research Centre (JRC): Brussels, Belgium, 2010. [Google Scholar]
  129. Maes, J. INCA—Pollination—ES Flow—2012; European Commission, Joint Research Centre (JRC): Brussels, Belgium, 2010. [Google Scholar]
  130. Vallecillo, S. INCA—Global Climate Regulation—ES Flow—2006–2012; European Commission, Joint Research Centre (JRC): Brussels, Belgium, 2019. [Google Scholar]
  131. Maes, J. Habitat Quality; European Commission, Joint Research Centre (JRC): Brussels, Belgium, 2010. [Google Scholar]
  132. Vallecillo, S.; Maes, J.; Polce, C.; Lavalle, C. A habitat quality indicator for common birds in Europe based on species distribution models. Ecol. Indic. 2016, 69, 488–499. [Google Scholar] [CrossRef]
  133. Tóth, G.; Hermann, T.; Szatmári, G.; Pásztor, L. Maps of heavy metals in the soils of the European Union and proposed priority areas for detailed assessment. Sci. Total Environ. 2016, 565, 1054–1062. [Google Scholar] [CrossRef]
  134. Orgiazzi, A.; Panagos, P. Soil biodiversity and soil erosion: It is time to get married: Adding an earthworm factor to soil erosion modelling. Glob. Ecol. Biogeogr. 2018, 27, 1155–1167. [Google Scholar] [CrossRef]
  135. Maes, J. Recreation Opportunity Spectrum; European Commission, Joint Research Centre (JRC): Brussels, Belgium, 2010. [Google Scholar]
  136. Ulrich, R.S. Visual Landscapes and Psychological Well-Being. Landsc. Res. 1979, 4, 17–23. [Google Scholar] [CrossRef]
  137. Tóth, G.; Hermann, T. European Map of Soil Suitability to Provide a Platform for Most Human Activities (EU28). 2015. Available online: https://esdac.jrc.ec.europa.eu/content/european-map-soil-suitability-provide-platform-most-human-activities-eu28 (accessed on 10 July 2020).
Figure 1. Global Trends in the Capacity of Nature to Sustain Contributions to Good Quality of Life (source: [6], SPM).
Sustainability 15 07557 g001
Figure 2. Driver–Pressure–State–Impact–Response Methodology. The DPSIR heuristic: All Responses require recognition and acknowledgment of challenges to be activated (blue arrows). Which kind of action is taken (rod dotted arrows) depends not on the factual situation, but on which challenge has been recognized. For instance, impacts are immediately addressed by adaptation, but can also trigger responses aimed at causal factors to prevent and mitigate a further deteriorating state causing ever more negative impacts, if the indirect drivers have been acknowledged to be the underlying problem. If this is not done, indirect drivers tend to activate direct drivers, possibly over long distances (telecoupling), which in turn change the state. How much change of state the pressure from a certain direct driver causes depends on the sensitivity of the system affected.
Sustainability 15 07557 g002
Figure 3. Overlay map, showing the distribution of the mean aggregate of provisioning ESs/NCPs.
Sustainability 15 07557 g003
Figure 4. Overlay map, showing the distribution of the mean aggregate of regulating ESs/NCPs.
Sustainability 15 07557 g004
Figure 5. Spatial distribution of the mean aggregate of cultural ESs/NCPs.
Sustainability 15 07557 g005
Table 1. Ecosystem Services and Nature’s Contributions to People Across Classification Frameworks. Where the terminology is similar in the sources, it was used unchanged. Where the terminology differs between sources, we tried to identify a phrasing serving as common denominator. Where the schemes defined the substantially same ESs/NCPs as comprising two or more of the ESs/NCPs described in other classification schemes, we took all of them as being addressed.
Type of ESs/NCPsESs/NCPsMA (2005)TEEB (2010)EFESE (2017)CICES (2018)IPBES (2019)
ProvisioningFresh water
Crops, including food and feed
Livestock
Aquaculture and fisheries
Wild terrestrial and aquatic animals and plants used for nutrition
Timber
Fibers, including cotton, hemp, silk etc
Bioenergy, biofuels, firewood
Biochemicals, natural medicines, pharmaceuticals
Type of ESs/NCPsESs/NCPsMA (2005)TEEB (2010)EFESE (2017)CICES (2018)IPBES (2019)
Regulation and maintenanceClimate and microclimate regulation
Air quality regulation, reduction of nuisance and odor
Water purification (fresh and coastal) and waste treatment
Water flow regulation
Formation, protection and decontamination of soils and sediments, erosion moderation/prevention
Biological pest control
Pollination and dispersal of seeds
Natural hazard and disease regulation
Maintenance of genetic diversity
Habitat creation and maintenance
Regulation of ocean acidification
Supporting soil quality and fertility, nutrient cycling
Type of ESs/NCPsESs/NCPsMA (2005)TEEB (2010)EFESE (2017)CICES (2018)IPBES (2019)
Socio-
cultural significance
Spiritual and religious values
Aesthetic values
Biological infrastructure for recreation and ecotourism
Physical and psychological experiences for learning, inspiration, education and knowledge
Goods and products from ecosystems at heritage value
Stability of land use and land cover, supporting identities
Maintenance of options for the future
no, yes.
Disclaimer/Publisher’s Note: The statements, opinions and data contained in all publications are solely those of the individual author(s) and contributor(s) and not of MDPI and/or the editor(s). MDPI and/or the editor(s) disclaim responsibility for any injury to people or property resulting from any ideas, methods, instructions or products referred to in the content.

