Article

Assessing the Effectiveness of Ecological Mitigation Practices in Public Construction with a Quick and Operational Assessment Framework

Department of Civil Engineering, National Taipei University of Technology, 1, Sec. 3, Zhongxiao E. Rd., Taipei 10608, Taiwan
*
Author to whom correspondence should be addressed.
Sustainability 2023, 15(9), 7480; https://doi.org/10.3390/su15097480
Submission received: 16 March 2023 / Revised: 25 April 2023 / Accepted: 30 April 2023 / Published: 2 May 2023
(This article belongs to the Special Issue Ecology, Biodiversity, and Sustainable Nature Conservation Policy)

Abstract

:
Infrastructures (public constructions) are necessary for people’s lives, but large infrastructures can be harmful to local ecosystems and wildlife. The ecological mitigation practices of more than 5000 public construction projects in Taiwan were reviewed. Among these cases, the reduction practices were 38%–58%, and the avoiding, minimizing, and compensation measures were nearly 20%. However, the number of statistical measures did not reflect the actual performance. This study developed a quick and operational assessment framework to assess ecological mitigation measures. The four indicators were ecological concern areas, number of ecological conservation measures, number of ecological conservation objects, and habitat quality. The assessment indicators were applied to 54 construction cases, and their performance was classified into excellent, good, fair, and qualified. The developed assessment indicators were proven capable of serving as a preliminary tool to determine the performance of ecological mitigation practices, and the criteria standard can be adjusted as cases are updated.

1. Introduction

Many countries have adopted biodiversity protection policies to offset natural losses, and mitigation measures have been implemented to reduce the impacts on ecosystems and wildlife habitats since 1970. These protective policies and actions were initiated in environmental impact assessments to analyze and predict the ecological and environmental impacts of development projects [1]. In the 1980s, the United States proposed ecological no net loss (NNL), and the concept of NNL has been accepted in over 80 countries and aims to offset biodiversity loss [2,3,4]. The objective of biodiversity offset policy is to offset the impacts of an ecosystem with alternative options with the goal of NNL. In biodiversity offset policy, the related information and data should be transparent to the public. Access to available open information about the offset policy helps the public better understand the content of measures and the need to protect the target habitat and species [5,6]. In addition to offsetting the ecological impacts, the United States applied mitigation measures to reduce the possible impacts. For example, the Federal Water Pollution Control Act (FWPCA) used mitigation measures to protect wetland and river systems [7]. The original mitigation measures were avoiding, minimizing, rectifying, reducing, and compensating. After the NNL concept, the five mitigation measures transformed into avoiding, minimizing, reducing, and compensation. These four types formed a mitigation measure hierarchy (MH) and had an order from the strongest mitigation level to the weakest mitigation level. The MH is now a basic framework for managing and controlling the risk and impacts of biodiversity and ecological systems [8]. Avoiding is the most substantial mitigation type; an example is changing the location of artificial constructions to avoid any possible impacts on the natural ecosystem [8,9]. Compensation is the least effective mitigation measure and is suggested for use after the other three options. Compensation measures might be complex, expensive, and uncertain. This measure cannot ensure that the offset will be successful for an ecosystem. Therefore, using the MH is helpful to review the mitigation measures and prioritize the first three types of measures [8].
Although there is worldwide consensus regarding the need to protect nature and various mitigation measures have been implemented, quantitative assessment tools to evaluate the effectiveness of the actions are lacking, and an applicable approach is needed. Rapid assessment methods (RAMs) for wetlands and rivers were developed in the 1980s [10]. These RAMs were developed to assess fish status and wildlife habitats. With the need for resource management, more features have been included in RAMs. In recent decades, more technology and data have become available, and RAMs integrated with geographic information systems (GISs) are usually applied. There are many RAMs for wetland systems. The wetland evaluation technique was built very early in the US in response to the FWPCA [11]. Other wetland evaluation methods have used hydrogeography factors to determine the wetland function and have used the performance relative to the original wetland status [10,12]; examples include WESPUS [13], ABWRET-A [14,15], OWES [16], and NovaWET 3.0 [17]. These assessment methods combined with the technique can provide quick assessments of wetland systems and can contribute to evaluating the relationship between human activity and the ecosystem [18]. However, no RAMs are useful for every case. The use of RAMs outside of the intended regions may be difficult because of different ecosystem types and external stressors [19]. The development of RAMs is based on opinions and knowledge from local experts and residents. Moreover, the performance of an ecosystem is always based on the difference between the current status and the original status. This assessment is very specific. For example, the RAMs developed in North America might not be appropriate for use in European and Asian areas because the definition of the ancient or original conditions is different [20].
It is difficult to evaluate the performance of an ecosystem; however, it is more challenging to assess the effectiveness of an ecological mitigation measure. Many mitigation and protective measures have been implemented, but their results still need to be evaluated. The quantitative data of the MH framework are limited, and only a few applications of MH have been presented for local-scale cases [21,22,23], projects [24,25], or habits and species [26,27,28]. Gelot and Bigard (2021) [1] surveyed the biodiversity database in France and discussed 2588 cases and their MH measures. The results showed that the quantitative tools for assessing the effectiveness of ecological mitigation measures and the MH framework needed to be improved. Hunter (2021) [29] investigated 50 reports in UK cases and found that over half of the cases did not have empirical evidence, and only 13 mitigation measures had been shown to be effective. Reeves et al. (2016) [30] measured habitat variables and compared the restored wetlands and reference wetlands in central Iowa, USA, to advance the understanding of amphibian conservation. With increasing mitigation measures, an approach to evaluate the effectiveness of MH is urgent and essential [31].
In Taiwan, the government announced a guideline in 2017 that required public construction projects to evaluate their ecological impacts. All public construction has received 50%, and a higher budget from the central government is required to implement ecological detection and adopt mitigation measures to conserve the ecosystem, which might be influenced by construction. Ecological detection follows the life cycle of a construction project and includes the design, construction, and maintenance stages. The ecosystem is investigated before, during, and after construction. In this guideline, the rapid ecological assessment (REA) [32,33] developed by The Nature Conservancy was used to guide the ecological data survey methods. Ecological conservation measures were outlined in the SC43-23 documents from the Ramsar Convention [34]. Although this guideline aimed to clarify the ecosystem around public construction and enhance conservation measures, the effectiveness of these conservation methods is still not known. For this reason, the objective of this study was to design a quick and operational assessment method to determine the performance of mitigation measurements. The assessment method was then applied to Taiwanese cases to test its feasibility.

2. Case Study

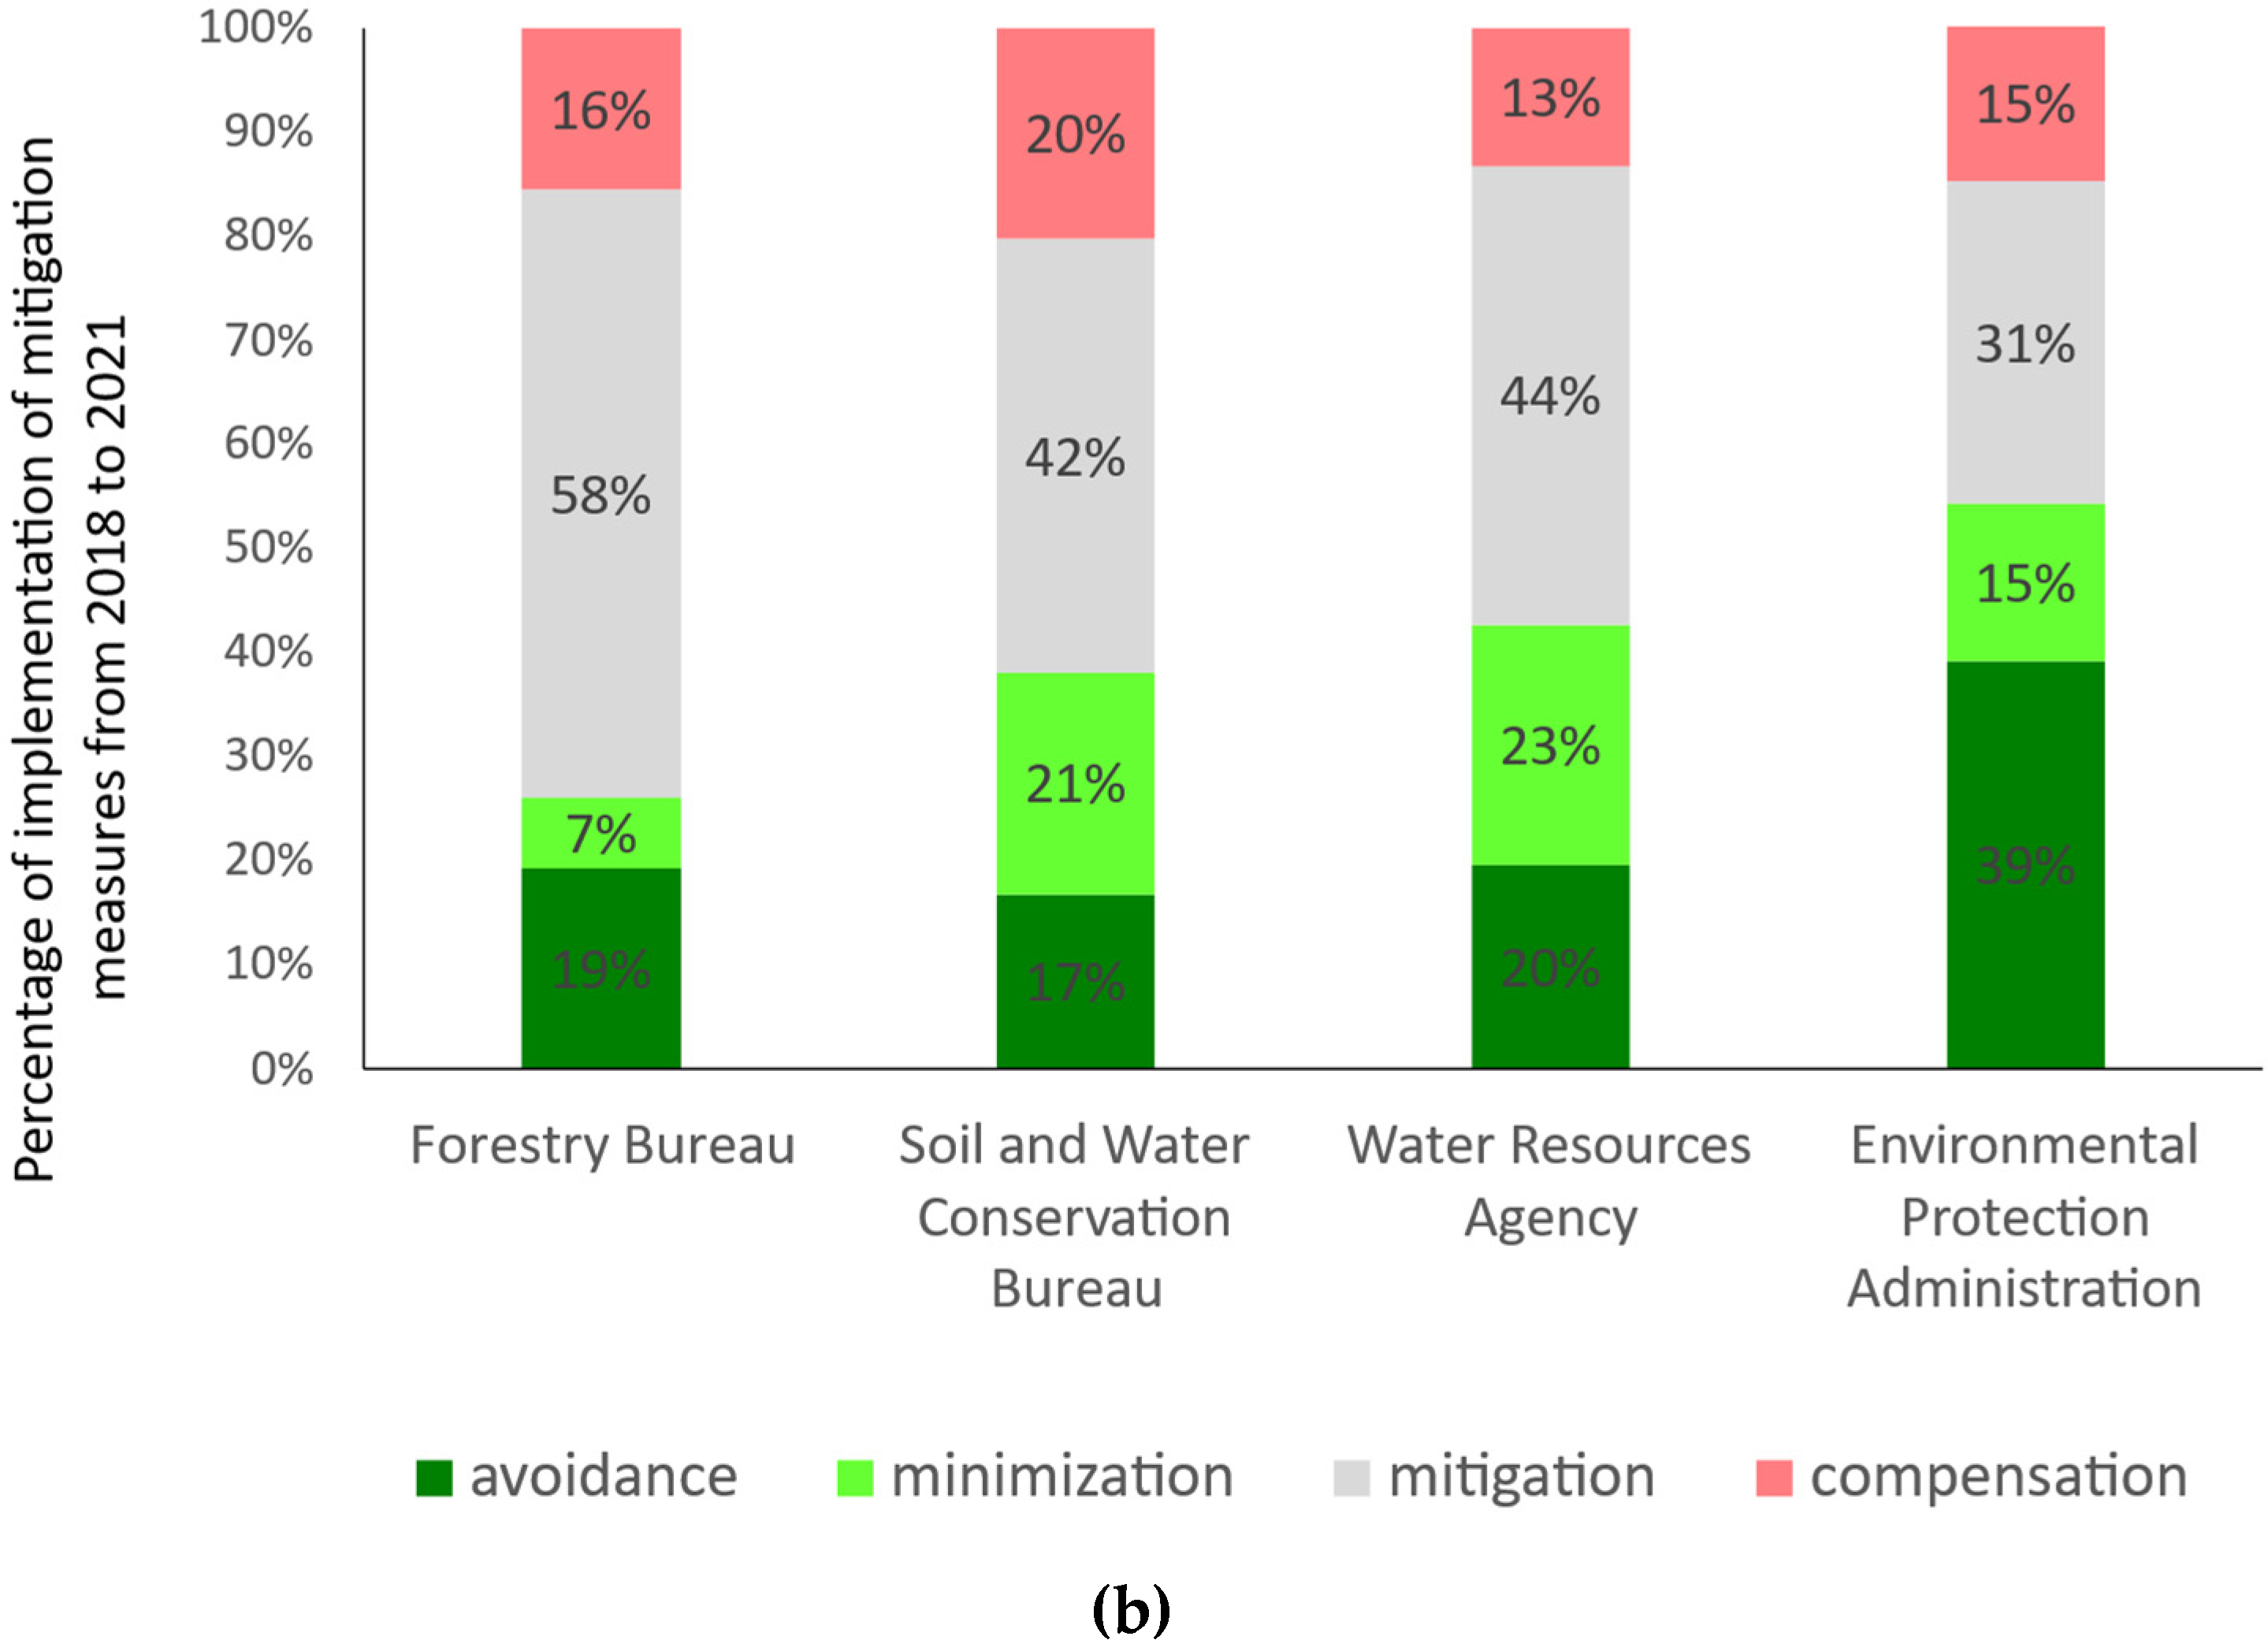
Public construction projects in Taiwan were used as study cases. All construction projects required to perform ecological detection work must upload the relevant data to the public information platform, and every month, the government updates and releases the data [35,36,37]. We collected four years of data from 2018 to 2021. The number of total public construction with ecological detection was 5025, occupying 6.9% of the total public construction cases. These case studies were mostly located upstream in reservoir watersheds and rural areas, which have rich natural ecosystems. Among these cases, 5269 ecological mitigation practices were implemented, and most were reduction practices, accounting for 38–58%. The mitigation types are summarized in Figure 1a. Avoiding ecological impacts is the most protective method, and its proportion was approximately 20%, which was close to that of the other two measures, minimizing and compensation. The administration agency (Figure 1b), the Environmental Protection Administration (EPA), performed the most avoidance actions, and the avoidance and minimization actions accounted for more than half. Moreover, the Forestry Bureau was responsible for less than one-third of avoidance and minimization actions. This might be because the construction projects developed by the Forestry Bureau are specific to certain places and cannot be changed.
There were more than one thousand cases in Taiwan, but not all documents had enough information to perform further assessment. In this study, a total of 54 construction cases that had relatively sufficient data from the Water Resources Agency [38] and Forest Bureau [39] documents were used. The 54 study cases are distributed throughout Taiwan, and they are located in upper-stream watersheds, not in urban areas. That is also why these construction projects need to implement ecological mitigation. They are located in natural areas, not developed areas. The construction types were separated into natural ecosystem conservation, slope area conservation, stream conservation, river and reservoir dredging, and structure improvement [40]. The ecological mitigation practices of the 54 cases were analyzed (Figure 2). The construction projects were classified into five types: river conservation (n = 17), slope land conservation (n = 11), river and reservoir dredging (n = 8), structure improvement (n = 6), and others (n = 12). The results showed that reducing practices were the dominant mitigation strategies used in these construction projects, and the percentage was 33.6–68.5%, with an average of 51.2%. According to the MH, the strongest conservation measure is avoiding. An average of 23.9% of cases used avoiding practices. Minimizing and offsetting measures were observed in 14.2% and 10.8% of projects, respectively. The results indicated that avoiding and reducing conservation were adopted frequently among Taiwanese cases. It is interesting that the percentage of avoiding practices was similar in different kinds of construction. Almost one-fifth of construction tried to avoid ecological impacts and reconsidered the location or boundary of construction. However, the tradeoff of the MH was found in minimizing and reducing practices. River conservation had few minimizing practices, at 7.5%, but had 60.2% reducing practices. A similar distribution was observed in river and reservoir dredging and other construction. This result implied that when it was hard to minimize the area of construction, more reducing practices were implemented.
It was good to see that different MH practices were implemented with public construction projects. However, the next question is that of how these conservation practices perform. Although ecological conservation was implemented with public construction, there is no objective assessment method to evaluate the performance of the practices.

3. The Developed Ecological Performance Assessment Framework

The ecological performance assessment framework proposed in this study contains four quantitative indicators, which can be assessed quickly and reveal the effectiveness of MH practices. The four indicators include ecological concern areas (Ia), number of ecological conservation measures (Im), number of ecological conservation objects (Io), and habitat quality (Ih). Each indicator has 10 points, and the total number of points in the assessment framework is 40. The four indicators are linked to ecosystem service functions. Costanza et al. [41] summarized 17 ecosystem service functions, including provisioning services, regulating services, supporting services, and cultural services. These functions also indicate the features of ecosystems; therefore, the assessment framework built in this study is related to these functions and can be used to assess the impacts on ecosystem functions. The linkages of the four quantitative indicators and the ecosystem functions are listed in Table 1.
Each indicator was addressed as follows:
1. Ecological concern areas (Ia)
Avoiding is the most prioritized choice of the MH method and is suggested by the Ramsar Convention [34] and the Council on Environmental Quality in the US. Avoiding is used to protect ecologically sensitive areas, and the measures are related to the location of construction. It is recommended to avoid ecological impacts and to change the location of construction. Therefore, when ecological detection of a public construction project is performed, the location and boundary of the construction should be confirmed in the beginning and design stages. The design of construction should be reviewed by ecological professionals to check if the boundary overlaps with ecological protection areas. The ecological protection areas are defined based on the national legal areas. In Taiwan, the legal ecological protection areas include six categories: National Park, National Natural Park, Natural Reserve, Wildlife Refuge, Wildlife Habitat, and National Protected Area. The six legal ecological areas each have their own laws. For example, national parks are defined in the National Park Law, and natural protected areas are defined in the Forest Law.
The administration agency publicly provides the locations and boundaries of these special areas. With the assistance of digital maps, we can clearly identify the areas of construction and the ecological protection areas. The indicator of ecological concern area (Ia) is then calculated using the area of construction (Ac) and the area of the overlapped area with ecological protection areas (Ao). If the ratio is large, the points of this indicator are few. We designed an evaluation scale for this indicator. The total score is 10 points, and the scale is 5. The scale of 5 and the associated points were also used for the other indicators (Table 2). The choice of the scale and points were based on intuitive and simple uses. For example, the 3 scale is too rough and the 10 scale might be too complex. The 5 scale is moderate. The points could be 1–5, 1–10, or others. In this study, a score of 10 points indicates full performance, and 0 indicates no actions. The values of 3, 5, and 8 refer to the other three middle scales. One might use 2.5, 5, and 7.5, or different points. Moreover, the scale and points could be decided by questionnaire survey or expert consulting. In this study, a simple and easily used scale and points were designed.
2. Number of ecological conservation measures (Im)
This indicator is used to check the ecological conservation measures along with the public construction project. The measures were checked by ecological professionals, and the number of completed measures was counted. More completed and effective measures have more points in this indicator. The evaluation scale is the same as that of Ia; the total number of points is 10, and the scale is 5. Because ecological detection was launched in 2017, there are no previous reference data. The objective is to implement conservation measures, but there are no requirements regarding the numbers or scales of the measures that should be used. Therefore, if it has at least one conservation measure, the construction could obtain 3 points. In the future, with more cases, the scale and points can be adjusted.
3. Number of ecological conservation objects (Io)
Unlike the previous indicators, which focused on whether conservation measures were taken, this indicator focuses on conservation objects, which might be plants or animals. If construction projects survey and list the objects that need to be protected and implement the specific protection for these objects, the indicator, Io, could gain a high number of points. The indicator implies the need for ecological surveys and the need to pay detailed attention to ecological species. The ecological conservation objects in Taiwan are listed in the Wildlife Conservation Act and the Cultural Heritage Preservation Act. The former lists conserved animals, and the latter lists conserved plants. The evaluation scale is consistent with that of Im, and this can be adjusted once more data are collected in the future.
4. Quality of habitat (Ih)
Due to uncertain factors in the field, such as season, day and night, temperature, weather, water level, and random activity, species investigations require intensive and long-term continuous monitoring to obtain more objective and stable investigation results. Ecological assessments are often limited by the large number of items and the scarcity of investigation resources, and there are few cases of rigorous and long-term species monitoring and investigation plans. In contrast, habitat assessment indicators have the advantages of rapid assessment, objective quantification, and indicator-based evaluation (distinguishing excellent, good, fair, and poor levels), and they can objectively evaluate the physical changes in the habitat before and after construction. Assessing the quality of the habitat and comparing the differences before and after construction could provide a quick and objective evaluation. The change in habitat quality is quicker than the change in wild species. It takes long-term and frequent monitoring efforts to investigate the impacts on wild species.
In Taiwan, the guideline of ecological detection for public construction in reservoir watersheds [40] provides two habitat assessment indicators: river habitat and slope land habitat. The indicator of habitat quality, Ih, in this study was cited from the official guideline, and the scale scores were given by this study to have the overall detection evaluation results (Table 3). The river habitat assessment indicator was built from the Rapid Bioassessment Protocol (Plafkin et al., 1989) [42] and the amended version (Barbour et al., 1999) [43]. To assess the quality of river habitat, the protocol suggested 10 parameters that could be used to quickly determine the characteristics of a river habitat. Although these parameters represent the habitat quality, there are no weighting factors to provide a total evaluation result for Taiwan. Therefore, in this study, we simply compared the change in these parameters before and after construction. If the total parameters performed better than before, 10 points were awarded. If the state of the parameter worsened after construction, points were subtracted. If there was no evaluation parameter, which means no investigation, zero points were awarded. The other habitat indicator was for slope land habitat assessment, in which five parameters were included: the percentage of woody plant coverage (%), the number of plant species (number/100 m2), the native plant coverage (%), the structure layers of the plant community, and the succession stage. The details of the slope land assessment parameters and their definitions are listed in Table A2 [44]. The score of each parameter was 4, and the full score of slope land habitat would be 20. If the score obtained after construction was better than that before construction, the Ih was awarded 10 points. If the score after construction was equal to that before construction, the habitat did not change, and the Ih was 9 points. A value of 5 points was given if the construction did affect the habitat assessment parameters even though the score worsened. If a construction project did not survey the habitat assessment and had no related values, it had a value of 0 because there were no actions. However, if the construction project conducted a survey of these parameters, they could obtain a value of at least 5 points for this indicator.

4. Results and Discussion

4.1. The Results of Assessment Indicators

The results of the 54 cases are shown in Figure 3. The points ranged from 10 to 37. Six projects received fewer than 10 points, and 7 received more than 30 points. The cases with few points missed some investigation of the assessment indicators and received zero points for some features. The assessment framework not only assessed the performance of the MH methods but also served as a checking tool to help construction agencies perform ecological investigations. Among the 54 cases, 10 cases did not provide protection areas and received zero points for Ia. The other 44 cases checked the protection areas and avoided certain practices, implying that the assessment indicator helped the construction agency better understand the ecological impacts and helped to design mitigation measures.
The evaluation results are shown in Table A1 and summarized in Table 4 and Figure 4. River and reservoir dredging had slightly better performance than other construction types, and slope land conservation had fewer points. This result implies that the Water Resource Agency, which is the authority for dredging, performed better in terms of ecological protection than other administrations in Taiwan. This might be because ecological detection is initiated by this agency, and thus, it performed better. However, the performances of different construction types were not significantly different. The results showed that high assessment scores were obtained for Ia and Im, with averages of 7.67 and 9.50 points, respectively. In particular, the Im almost had the highest possible score. This showed that conservation measures were commonly involved in public construction, and those engaging in public construction checked the protection areas before construction and sought to avoid impacts. However, the other indicators, Io and Ih, achieved low performance, with an average of approximately 2 points. This result means that more attention should be given to wild species, and the habitat quality should be increased.
The Ia results showed that river conservation had a lower point value (5.88), and the other four construction types had point values greater than 7. This result is because two river conservation cases did not investigate the ecological protection area map and received zero points. Four cases were located in highly ecologically sensitive areas, and the associated ecological impacts could not be avoided; thus, these areas also received zero points. Therefore, the average value was lower than that of other construction types. Aside from these 6 cases, the other 11 river conservation cases had more points for this indicator.
The high Im scores for each case and all river conservation and slope land conservation cases obtained the full point value of 10. The indicator was evaluated by the number of conservation practices, and the implementation of more than four practices resulted in a value of 10 points. Most construction projects implemented several ecological conservation practices and received the full mark for this indicator. The performance of these conservation practices is expected to affect other indicators, such as habitat quality.
The Io received low scores, 1.18–3.83, for two reasons. One is that the investigation of wild species requires budgets, and most cases use reference data to list the conservation species. Thus, the value might be less than the actual value. Few conservation species resulted in this indicator having a low point value. The other reason is that the cases did not list fish or aquatic species. Plants and protected forests are listed in all construction types, and they are easier to identify than other species. The conservation objects in the 54 cases are summarized in Table 5. The conserved objects in river conservation cases included one bird (Pitta nympha), four mammals (Muntiacus reevesi micrurus, Sus scrofa taivanus, Herpestes urva formosanus, and Melogale moschata), four plants (Camphora officinarum, Cordia dichotoma, Calocedrus macrolepis, and Begonia bouffordii C.I Peng), and two protected forests. The conserved objects in slope land conservation cases and river and reservoir dredging cases only had protected forests and no specific wild species. In structure improvement cases, Pitta nympha, Machilus zuihoensis, Mallotus paniculatus, Bredia hirsute, and Begonia ravenii C.I Peng and Y.K. Chen were listed. In other cases, four mammals (Paguma larvata, Muntiacus reevesi micrurus, Macaca cyclopis Swinhoe) and five plant species (Trema orientalis, Phoebe formosana, Turpinia formosana, Magnolia compressa, and Lagerstroemia subcostata) were listed.
The Ih indicator had several subparameters, and the point value was dependent on the changes in these subparameters. If the value of the subparameters did not perform as well as that before construction or if the status of these parameters was not checked, the Ih would have a low point value. Among the 54 cases, the Ih had the lowest scores, 0–4.69. Only 18 cases completed all the subparameters and received points. In the 17 slope land habitat evaluation cases, the 170 subparameters performed worse after construction. However, in the 16 river habitat evaluation cases, 68 of 160 subparameters performed better after construction than before. This result implied that considering ecological protection in construction design would make it possible to conserve and even repair river habitats. The other 92 subparameters performed worse after construction, including riparian vegetative zone width, embeddedness, and epifaunal substrate. The results reflected that the current construction might damage the sediment characteristics and reduce vegetation zones. The protection of the sediment layer and riparian zone should be improved.

4.2. Development of the Evaluation Standard for Ecological Performance

The developed assessment indicator framework aimed to quantitatively assess the effectiveness of MH practices in public construction. However, the level of performance is unknown. With sufficient cases, the ranking information would be provided. We found that the scores of the 54 cases were near a normal distribution. Then, the values were separated into excellent, good, fair, and qualified levels according to the distribution. There may be different scales, but in the beginning of the framework, a simple rank scale is preferred. Because four levels were defined, a direct way is using one-third as the category. Therefore, if the score was larger than 90%, which was the scenario for 32 points, the case was classified as having excellent performance. If the case had at least 10 points, it was regarded as qualified. The percentages of 30% and 60% were used to determine good and fair performance levels, and the scores were 18 and 23, respectively. With the standard, the cases could be classified into different levels and were easily compared.
Such an evaluation standard has an adaptative feature. If more cases are obtained in the future, the criteria score can be adjusted. Thus, if more cases are collected and the cases improve, the distribution might be shifted as shown by the gray dotted line in Figure 5. Once the distribution shifts to the right, the scale score will become stricter at the same performance level. For example, a case of 25 is regarded as good performance in the first distribution, but it might become fair if the distribution shifts to the right. With a new distribution, cases should improve to reach comparable performance. The shifted score distribution is also a signal of ecological improvement.

4.3. Comparison of the Proposed Framework to Existing Assessment Methods

The developed assessment framework used four indicators to assess the performance of ecological mitigation measures of public construction. The four indicators considered the area, the species, and the habitat changes. The existing assessment methods, such as WET, NovaWET3.0, WESPUS, OWES, and ABWRET-A, focus on the quality of the ecosystem rather than on the performance of ecological mitigation. WET first provided a procedure to assess wetland function, and NovaWET 3.0 is the revised version and has been applied in Nova Scotia, Canada. WESPUS is the Wetland Ecosystem Services Protocol for the United States and is a standardized method to rapidly assess the ecological services of all types of wetlands in North America. OWES is the Ontario Wetland Evaluation System. Finally, ABWRET-A (the Alberta Wetland Rapid Evaluation Tool—Actual) includes ecological services and human values to evaluate the category of wetlands. The process of ABWRET-A was the basis of this study. The existing methods comprised detailed features of an ecosystem, such as a wetland. They considered the various aspects of ecological functions to determine the soundness of an ecosystem. However, the proposed framework in this study focused on the impact on the ecosystem due to construction and the performance of the applied ecological mitigation measures. Therefore, the major difference is this method uses features related to the construction characteristics. Although the major target is different, the features in the previous methods were considered, and the important features were selected as the assessment indicators in this study. The features of the existing assessment methods are summarized in Table 6.

5. Conclusions

Ecological protection actions are more accepted than before, and now they are required to be included in public construction in Taiwan. Although there are ecological protection actions, there is a lack of assessment of the performance of these mitigation measures. The four detection indicators suggested in this study could provide a quick and objective assessment of these MH actions. The 54 real cases have proven that the assessment indicators are capable of revealing the effectiveness of the MH measures. In addition, an evaluation standard of this method was built, and the performance was ranked. The 54 studied cases were classified based on the results, and the cases were classified as having excellent, good, fair, and qualified performance. Once the number of pooled data increases, the evaluation standard can be adjusted and result in new scores for classification. The method can be used in any country or region to develop its own standard.
The ecological detection indicators in this study are particularly useful for assessing mitigation measures along with construction. The goal is not to assess the natural ecological status; rather, the objective is to assess the impacts of construction imposed or mitigated on the ecosystem. Therefore, the indicators chosen in this study should be able to clearly evaluate the difference before and after construction. The four indicators can quickly assess performance but are not used by ecological professional staff. However, data confidentiality needs to be confirmed with experts. The four indicators represent the protected areas, the measures, the species, and the habitats. The results of each indicator help to identify the vulnerable parts of the construction projects. We also found that the high score in the habitat indicator resulted in the good performance of the other three indicators. The results indicated that good habitat quality might be fundamental to ecosystem protection. Thus, measures of rehabilitation or habitat enhancement are suggested to be included in construction.
In Taiwan, an ecological assessment process has been required for public construction since 2017, and ecological mitigation measures must be included in construction projects. This is significant progress. Detection helps construction agencies evaluate the possible impacts on ecosystems from the design stage to the construction stage and pushes agencies to implement adequate measures. With the open data of these cases, the assessment indicators of this study were tested. The proposed framework was approved as an objective and applicable tool, but it is not finalized. Future research is needed to improve the soundness of indicators, scales, and points. In addition, the method relies on field investigation, and a simple and effective survey methodology is thus required.

Author Contributions

Y.-W.T., J.-Y.L. and C.-F.C. conceived and refined the initial project. Y.-W.T. wrote the first draft of this paper. C.-F.C. was a major contributor to the revisions. All authors have read and agreed to the published version of the manuscript.

Funding

This research received no external funding.

Institutional Review Board Statement

Not applicable.

Informed Consent Statement

Not applicable.

Data Availability Statement

No new data were used.

Conflicts of Interest

The authors declare no conflict of interest.

Appendix A

Table A1. Performance Evaluation of Mitigation Measures in 54 Case Studies.
NumberConstruction TypesIaImIoIhTotal Points
1River conservation10100020
2River conservation10100020
3River conservation8100018
4River conservation8100018
5River conservation10103023
6River conservation101010030
7River conservation0100010
8River conservation0100010
9River conservation101005.7525.75
10River conservation81005.2523.25
11River conservation01035.2518.25
12River conservation10103023
13River conservation01008.2518.25
14River conservation810105.7533.75
15River conservation81005.523.5
16River conservation01036.519.5
17River conservation01038.2521.25
18Slope land conservation10105025
19Slope land conservation8100018
20Slope land conservation10100020
21Slope land conservation10103023
22Slope land conservation10100020
23Slope land conservation10100020
24Slope land conservation10100020
25Slope land conservation8100018
26Slope land conservation8105023
27Slope land conservation0100010
28Slope land conservation0100010
29River and reservoir dredging850013
30River and reservoir dredging1085023
31River and reservoir dredging880016
32River and reservoir dredging101009.529.5
33River and reservoir dredging8108632
34River and reservoir dredging10100929
35River and reservoir dredging101056.531.5
36River and reservoir dredging101086.534.5
37Structure improvement10105025
38Structure improvement10105025
39Structure improvement10105025
40Structure improvement10105025
41Structure improvement10100020
42Structure improvement1083021
43Others1080018
44Others1050015
45Others10108028
46Others10105934
47Others10103932
48Others0100010
49Others0100010
50Others1030013
51Others1080018
52Others101008.7528.75
53Others81010937
54Others8100624
Table A2. Rapid assessment table for sloping land [40,44].
Assessment IndicatorsDescription
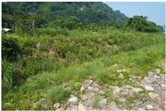
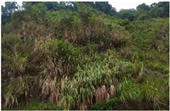
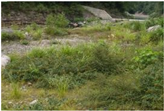
Percentage of woody plant coverage (%) The percentage of the sample area covered by trees and shrubs in the assessment area. Woody plants are generally considered to take longer to grow than herbs, and areas with dense woody plant growth are often considered to be at a later stage of succession and in good vegetative condition.
Optimal (4 points)Sub-optimal (3 points)Fair (2 points)Unsatisfactory (1 point)
55 or more15~550~150
Sustainability 15 07480 i001Sustainability 15 07480 i002Sustainability 15 07480 i003Sustainability 15 07480 i004
Number of plant species (number/100 m2)The more diverse the vegetation species are, the higher the plant diversity of the area is.
Optimal (4 points)Sub-optimal (3 points)Fair (2 points)Unsatisfactory (1 point)
30 or more20~3015~2015 or less
Sustainability 15 07480 i005Sustainability 15 07480 i006Sustainability 15 07480 i007Sustainability 15 07480 i008
Native plant coverage (%)The percentage of the sample area covered by all native species in the sample area represents the percentage of the sample area covered by all native species in the sample area.
Optimal (4 points)Sub-optimal (3 points)Fair (2 points)Unsatisfactory (1 point)
65 or more30~6510~3010 or less
Sustainability 15 07480 i009Sustainability 15 07480 i010Sustainability 15 07480 i011Sustainability 15 07480 i012
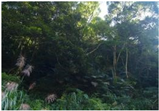
Structure layers of plant communityMore layers cause a more complex phytosocial composition, and it is more likely to be a natural forest environment.
Optimal (4 points)Sub-optimal (3 points)Fair (2 points)Unsatisfactory (1 point)
With more than four-layer structureWith three-layer structureWith two-layer structureWith one-layer structure or exposed
Sustainability 15 07480 i013Sustainability 15 07480 i014Sustainability 15 07480 i015Sustainability 15 07480 i016
Succession stageThe stage representing the change of flora with environmental and temporal changes is the process from early to late succession.
Optimal (4 points)Sub-optimal (3 points)Fair (2 points)Unsatisfactory (1 point)
Mid- to late-stage species advantagePioneer species advantageAdvantages of initial herb speciesExposed or exotic seed advantage
Sustainability 15 07480 i017Sustainability 15 07480 i018Sustainability 15 07480 i019Sustainability 15 07480 i020

References

  1. Gelot, S.; Bigard, C. Challenges to developing mitigation hierarchy policy: Findings from a nationwide database analysis in France. Biol. Conserv. 2021, 263, 109343. [Google Scholar] [CrossRef]
  2. Robertson, M.M. No net loss: Wetland restoration and the incomplete capitalization of nature. Antipode 2000, 32, 463–493. [Google Scholar] [CrossRef]
  3. Ruhl, J.B.; Salzman, J. Gaming the past: The theory and practice of historic baselines in the administrative state. Vand. L. Rev. 2011, 64, 1. [Google Scholar] [CrossRef]
  4. Maron, M.; Ives, C.D.; Kujala, H.; Bull, J.W.; Maseyk, F.J.; Bekessy, S.; Evans, M.C. Taming a wicked problem: Resolving controversies in biodiversity offsetting. BioScience 2016, 66, 489–498. [Google Scholar] [CrossRef]
  5. BBOP. Guidance Notes to the Standard on Biodiversity Offsets; BBOP: Washington, DC, USA, 2012. [Google Scholar]
  6. Bull, J.W.; Brauneder, K.; Darbi, M.; Van Teeffelen, A.J.; Quétier, F.; Brooks, S.E.; Strange, N. Data transparency regarding the implementation of European ‘no net loss’ biodiversity policies. Biol. Conserv. 2018, 218, 64–72. [Google Scholar] [CrossRef]
  7. Hough, P.; Robertson, M. Mitigation under Section 404 of the Clean Water Act: Where it comes from, what it means. Wetl. Ecol. Manag. 2009, 17, 15–33. [Google Scholar] [CrossRef]
  8. Ekstrom, J.; Bennun, L.; Mitchell, R. A Cross-Sector Guide for Implementing the Mitigation Hierarchy; Cross Sector Biodiversity Initiative; The Biodiversity Consultancy Ltd.: Cambridge, UK, 2015. [Google Scholar]
  9. Phalan, B.; Hayes, G.; Brooks, S.; Marsh, D.; Howard, P.; Costelloe, B.; Whitaker, S. Avoiding impacts on biodiversity through strengthening the first stage of the mitigation hierarchy. Oryx 2018, 52, 316–324. [Google Scholar] [CrossRef]
  10. Dorney, J.; Savage, R.; Tiner, R.W.; Adamus, P. (Eds.) Wetland and Stream Rapid Assessments: Development, Validation, and Application; Academic Press: Cambridge, MA, USA, 2018. [Google Scholar]
  11. Adamus, P.R. A Method for Wetland Functional Assessment: Volume II FHWA Assessment Method; United States Department of Transportation: Washington, DC, USA, 1983.
  12. Smith, R.D.; Ammann, A.; Bartoldus, C.; Brinson, M.M. An Approach for Assessing Wetland Functions Using Hydrogeomorphic Classification, Reference Wetlands, and Functional Indices; Technical Report WRP-DE-9; U.S. Army Engineer Waterways Experiment Station: Vicksburg, MS, USA, 1995. [Google Scholar]
  13. Adamus, P. Manual for the Wetland Ecosystem Services Protocol for the United States (WESPUS) Version 1.0; Adamus Resource Assessment Inc.: Corvallis, OR, USA, 2011; p. 62. Available online: https://www.novascotia.ca/nse/wetland/docs/manual_wespus.pdf (accessed on 1 February 2023).
  14. Government of Alberta. Alberta Wetland Rapid Evaluation Tool-Actual (ABWRET-A) Manual. Water Policy Branch; Alberta Environment and Parks: Edmonton, AB, Canada, 2015; p. 150. Available online: https://open.alberta.ca/dataset/0fd47f30-d3ee-4b2f-83ac-e96a6499d7ce/resource/ea9e44bd-0ed4–4cdd-94cc-8f5b27f21c8a/download/2015-alberta-wetland-rapid-evaluation-tool-actual-abwret-a-guide-june-2015.pdf (accessed on 1 February 2023).
  15. Rooney, R.C.; Royall, O.; Robinson, D.T.; Cobbaert, D.; Trites-Russell, M.; Wilson, M. Evaluating the development and use of a rapid wetland assessment tool (ABWRET-A) in policy implementation in Alberta, Canada. Environ. Sci. Policy 2022, 136, 575–587. [Google Scholar] [CrossRef]
  16. Government of Ontario. Ontario Wetland Evaluation System Southern Manual, 3rd ed.; Queen’s Printer for Ontario: Toronto, ON, Canada, 2014; p. 296, Version 3.3; Available online: https://files.ontario.ca/environment-and-energy/parks-and-protected-areas/ontario-wetland-evaluation-system-southen-manual-2014.pdf (accessed on 3 February 2023).
  17. Anon, Nova Scotia Environment. Nova Scotia Wetland Evaluation Technique; Version 3.0; Nova Scotia Environment, Government of Nova Scotia: Halifax, NS, Canada, 2011; Available online: https://novascotia.ca/nse/wetland/assessing.wetland.function.asp (accessed on 14 February 2023).
  18. Gerakis, A.; Kalburtji, K. Agricultural activities affecting the functions and values of Ramsar wetland sites of Greece. Agric. Ecosyst. Environ. 1998, 70, 119–128. [Google Scholar] [CrossRef]
  19. Gallaway, S.; Davis, C.; Dvorett, D.; Tramell, B. Validation of the Oklahoma Rapid Assessment Method (OKRAM) in depressional wetlands using EPA’s three-tiered framework. Wetlands 2020, 40, 925–937. [Google Scholar] [CrossRef]
  20. Gaucherand, S.; Schwoertzig, E.; Clement, J.C.; Johnson, B.; Quétier, F. The cultural dimensions of freshwater wetland assessments: Lessons learned from the application of US rapid assessment methods in France. Environ. Manag. 2015, 56, 245–259. [Google Scholar] [CrossRef]
  21. Bezombes, L.; Kerbiriou, C.; Spiegelberger, T. Do biodiversity offsets achieve No Net Loss? An evaluation of offsets in a French department. Biol. Conserv. 2019, 231, 24–29. [Google Scholar] [CrossRef]
  22. Bigard, C.; Pioch, S.; Thompson, J.D. The inclusion of biodiversity in environmental impact assessment: Policy-related progress limited by gaps and semantic confusion. J. Environ. Manag. 2017, 200, 35–45. [Google Scholar] [CrossRef] [PubMed]
  23. Weissgerber, M.; Roturier, S.; Julliard, R.; Guillet, F. Biodiversity offsetting: Certainty of the net loss but uncertainty of the net gain. Biol. Conserv. 2019, 237, 200–208. [Google Scholar] [CrossRef]
  24. Larsen, S.V.; Kørnøv, L.; Christensen, P. The mitigation hierarchy upside down–a study of nature protection measures in Danish infrastructure projects. Impact Assess. Proj. Apprais. 2018, 36, 287–293. [Google Scholar] [CrossRef]
  25. Persson, J.; Larsson, A.; Villarroya, A. Compensation in Swedish infrastructure projects and suggestions on policy improvements. Nat. Conserv. 2015, 11, 113–127. [Google Scholar] [CrossRef]
  26. Lindenmayer, D.B.; Crane, M.; Evans, M.C.; Maron, M.; Gibbons, P.; Bekessy, S.; Blanchard, W. The anatomy of a failed offset. Biol. Conserv. 2017, 210, 286–292. [Google Scholar] [CrossRef]
  27. Quigley, J.T.; Harper, D.J. Effectiveness of fish habitat compensation in Canada in achieving no net loss. Environ. Manag. 2006, 37, 351–366. [Google Scholar] [CrossRef]
  28. Dillabaugh, K.A.; King, D.J. Riparian marshland composition and biomass mapping using Ikonos imagery. Can. J. Remote Sens. 2008, 34, 143–158. [Google Scholar] [CrossRef]
  29. Hunter, S.B.; zu Ermgassen, S.O.E.; Downey, H.; Griffiths, R.A.; Howe, C. Evidence shortfalls in the recommendations and guidance underpinning ecological mitigation for infrastructure developments. Ecol. Solut. Evid. 2021, 2, e12089. [Google Scholar] [CrossRef]
  30. Reeves, R.A.; Pierce, C.L.; Smalling, K.L.; Klaver, R.W.; Vandever, M.W.; Battaglin, W.A.; Muths, E. Restored agricultural wetlands in central Iowa: Habitat quality and amphibian response. Wetlands 2016, 36, 101–110. [Google Scholar] [CrossRef]
  31. Maron, M.; Brownlie, S.; Bull, J.W.; Evans, M.C.; von Hase, A.; Qu’etier, F.; Watson, J.E.M.; Gordon, A. The many meanings of no net loss in environmental policy. Nat. Sustain. 2018, 1, 19–27. [Google Scholar] [CrossRef]
  32. Maragos, J.E.; Cook, C.W., Jr. The 1991–1992 rapid ecological assessments of Palau’s coral reefs. Coral Reefs 1995, 14, 237–252. [Google Scholar] [CrossRef]
  33. Sayre, R.; Roca, E.; Sedaghatkish, G.; Young, B.; Keel, S.; Roca, R.; Sheppard, S. Nature in focus: Rapid Ecological Assessment; Island Press: Washington, DC, USA, 2000. [Google Scholar]
  34. Ramsar Convention, SC43-23: An Integrated Framework for Avoiding, Mitigating and Compensating for Wetland Losses. 2011. Available online: www.ramsar.org/sites/default/files/documents/pdf/sc/43/sc43-doc23-avoid.pdf (accessed on 15 March 2023).
  35. Public Works Committee. Executive Yuan, Friendly Information Disclosure Platform. Available online: www.pcc.gov.tw/Content_List.aspx?n=1FC734786BD98077 (accessed on 15 March 2023).
  36. Public Works Committee. Executive Yuan, Public Works Ecological Inspection Area. Available online: www.pcc.gov.tw/Content_List.aspx?n=8BDF8E919EB3E6A9 (accessed on 15 March 2023).
  37. Public Works Committee. Executive Yuan, Handling of Ecological Inspection. Available online: www.pcc.gov.tw/Content_List.aspx?n=8F1B7698DDB3EA97 (accessed on 15 March 2023).
  38. Water Conservancy Administration, Ministry of Economic Affairs, Forward-Looking Basic Construction Design-Water Environment Construction Administrative Transparency Exclusive Website-ecological Inspection. Available online: Flwe.wra.gov.tw/cp.aspx?n=26073 (accessed on 15 March 2023).
  39. Forestry Bureau, Council of Agriculture, Executive Yuan, State-owned Forest Land Management Engineering Information Network–Management Engineering Query. Available online: Ecofrieng.forest.gov.tw (accessed on 15 March 2023).
  40. Ministry of Economic Affairs, Water Resources Agency, Implementation Reference Manual for Ecological Inspection of Reservoir Watershed Projects, Taipei, Republic of China (Taiwan), 2020. p. 58, (In Chinese). Available online: https://www-ws.wra.gov.tw/Download.ashx?u=LzAwMS9VcGxvYWQvNDMwL3JlbGZpbGUvOTkxMy8xMDc2Mi9jZDBlOWYyNC1lNDhhLTRlM2QtODVhMy0xZWIxNTE5NjE1MDAucGRm&n=57aT5r%2Bf6YOo5rC05Yip572y5rC05bqr6ZuG5rC05Y2A5bel56iL55Sf5oWL5qqi5qC45Z%2B36KGM5Y%2BD6ICD5omL5YaKLTEwOTA0LnBkZg%3D%3D (accessed on 10 March 2023).
  41. Costanza, R.; d’Arge, R.; De Groot, R.; Farber, S.; Grasso, M.; Hannon, B.; Van Den Belt, M. The value of the world’s ecosystem services and natural capital. Nature 1997, 387, 253–260. [Google Scholar] [CrossRef]
  42. Plafkin, J.L.; Barbour, M.T.; Porter, K.D.; Gross, S.K.; Hughes, R.M. Rapid Bioassessment Protocols for Use in Streams and Rivers: Benthic Macroinvertebrates and Fish; EPA 444/4-89-001; US EPA, Off. Water: Washington, DC, USA, 1989.
  43. Barbour, M.T.; Gerritsen, J.; Snyder, B.D.; Stribling, J.B. Rapid Bioassessment Protocols for Use in Streams and Wadeable Rivers: Periphyton, Benthic Macroinvertebrates and Fish, 2nd ed.; EPA/841-B-99-002; US EPA, Off. Water: Washington, DC, USA, 1999.
  44. Chen, Z.H.; Zheng, X.H.; Peng, X.Y.; Lin, X.H. Analysis and Research on Applicable Evaluation Factors for Vegetation Restoration in Collapsed Land. J. Chin. Soil Water Conserv. 2010, 41, 296–307. (In Chinese) [Google Scholar]
Figure 1. (a) The distribution of ecological mitigation practices in Taiwanese public construction in 2018–2021. The total number is 5269. (b) The mitigation actions classified by authority agencies.
Sustainability 15 07480 g001aSustainability 15 07480 g001b
Figure 2. The ecological mitigation practices of the 54 studied cases.
Sustainability 15 07480 g002
Figure 3. The results of ecological performance of the 54 cases.
Sustainability 15 07480 g003
Figure 4. The distribution of the four assessment indicators of the 54 cases.
Sustainability 15 07480 g004
Figure 5. The suggested score scale of the ecological detection indicator.
Sustainability 15 07480 g005
Table 1. The linkages of ecological detection indicators and ecosystem services.
IndicatorsEcosystem Services
Ecological concern areas (Ia)Gas regulation
Climate regulation
Water regulation
Disturbance regulation
Water supply
Erosion control and sediment retention
Refugia
Pollination
Genetic resources
Recreation
Number of ecological conservation measures (Im)Refugia
Genetic resources
Soil formation
Nutrient cycling
Waste treatment
Cultural
Number of ecological conservation objects (Io)Biological control
Refugia
Genetic resources
Cultural
Quality of habitat (Ih)Gas regulation
Climate regulation
Water regulation
Soil formation
Nutrient cycling
Disturbance regulation
Water supply
Erosion control and sediment retention
Refugia
Genetic resources
Table 2. The evaluation scale of the ecological detection assessment indicators, Ia, Im, and Io.
IndicatorPoints108530
Ecological concern areas I a = A o A c (%)00–2526–5051–7576–100
Number of ecological conservation measuresIm≥43210
Number of ecological conservation objectsIo≥43210
Table 3. The evaluation scale of ecological detection assessment indicator, Ih, and its subparameters.
Indicator of Habitat Quality (Ih)SubparametersDefinitionPoints
River habitat1. Epifaunal Substrate/Available Cover
2. Embeddedness
3. Velocity/Depth Regime
4. Sediment Deposition
5. Channel Flow Status
6. Channel Alteration
7. Frequency of Riffles (or bends)
8. Bank Stability (score each bank)
9. Vegetation Protection (score each bank)
10. Riparian Vegetative Zone Width (score each bank riparian zone)
All parameter values after construction ≥ parameter value before construction10
N parameter values after construction < parameter value before construction10–0.5 N *
All parameter values after construction < parameter value before construction5
Slope land habitat1. Percentage of woody plant coverage (%)
2. Number of plant species (number/100 m2)
3. Native plant coverage (%)
4. Structure layers of plant community
%. Succession stage data
The total score after construction > the total score before construction10
The total score after construction = the total score before construction9
The total score after construction < the total score before construction5
* N is the number of subparameters performing better than those before construction. It means that the ecological mitigation measures help to improve the habitat.
Table 4. Detailed results of the assessment indicators. The average and standard deviation.
IndicatorsnIaImIoIhTotal Points
Construction
Types
River conservation175.88 ± 4.5510.00 ± 0.002.06 ± 3.292.97 ± 3.3520.91 ± 5.54
Slope land conservation117.64 ± 3.8810.00 ± 0.001.18 ± 2.090.00 ± 0.0018.82 ± 4.85
River and reservoir dredging89.25 ± 1.048.88 ± 1.813.25 ± 3.654.69 ± 4.0726.06 ± 7.91
Structure improvement610.00 ± 0.009.67 ± 0.823.83 ± 2.040.00 ± 0.0023.50 ± 2.35
Others128.00 ± 3.818.67 ± 2.352.17 ± 3.593.48 ± 4.3722.31 ± 9.55
Total547.67 ± 3.789.50 ± 1.412.28 ± 3.102.40 ± 3.5421.85 ± 6.93
Table 5. The number of conserved objects in the study cases.
SpeciesFishBirdsMammalsPlantsProtected
Forests
Construction
Types
River conservation01442
Slope land conservation00002
River and reservoir dredging00003
Structure improvement01041
Others00353
Table 6. The comparison of different assessment methods.
MethodFeaturesReference
WET
  • Ground water recharge
  • Ground water discharge
  • Flood flow alteration
  • Sediment stabilization
  • Sediment/toxicant retention
  • Nutrient removal/transformation
  • Production export
  • Aquatic diversity/abundance
  • Wildlife diversity/abundance for breeding
  • Wildlife diversity/abundance for migration and wintering
  • Recreation and uniqueness/heritage
[11,18]
NovaWET 3.0
  • Watershed characteristics
  • Site description and wetland character
  • Condition and integrity of adjacent land
  • Identification of exceptional features
  • Hydrologic condition and integrity
  • Water quality
  • Groundwater interactions
  • Shoreline stabilization/integrity
  • Plant community
  • Fish and wildlife habitat/integrity
  • Community use/value
[17]
WESPUS
  • Hydrologic and water quality maintenance functions:
    • Water storage and delay
    • Water cooling
    • Sediment retention and stabilization
    • Phosphorus retention
    • Nitrate removal and retention
    • Carbon sequestration
    • Organic nutrient export
  • Habitat functions:
    • Fish habitat
    • Aquatic invertebrate habitat
    • Amphibian and reptile habitat
    • Waterbird habitat
    • Songbird, raptor, and mammal habitat
    • Wildfire barrier
    • Pollinator habitat
    • Native plant habitat
[13]
ABWRET-A
  • Biodiversity
    • Fish habitat
    • Invertebrate habitat
    • Amphibian habitat
    • Waterbird habitat
    • Songbird, raptor, and mammal habitat
    • Native plant and pollinator habitat
  • Water quality improvement
    • Water cooling
    • Sediment retention and stabilization
    • Phosphorus retention
    • Nitrate removal and retention
    • Organic nutrient export
  • Flood reduction
    • Water storage and delay
    • Stream flow support
  • Human value
    • Human value
[14,15]
OWES
  • Biological component
    • Productivity
    • Biodiversity
    • Size (biological component)
  • Social component
    • Economically valuable products
    • Recreational activities
    • Landscape aesthetics
    • Education and public awareness
    • Proximity to areas of human settlement
    • Ownership
    • Size (social component)
    • Aboriginal values and cultural heritage
  • Hydrological component
    • Flood attenuation
    • Water quality improvement
    • Carbon sink
    • Shoreline erosion control
    • Groundwater recharge
  • Special features component
    • Rarity
    • Significant features and habitats
    • Ecosystem age
    • Great lakes coastal wetland
[16,28]
This study
  • Ecological concern areas (Ia)
  • Number of ecological conservation measures (Im)
  • Number of ecological conservation objects (Io)
  • Quality of habitat (Ih)
Disclaimer/Publisher’s Note: The statements, opinions and data contained in all publications are solely those of the individual author(s) and contributor(s) and not of MDPI and/or the editor(s). MDPI and/or the editor(s) disclaim responsibility for any injury to people or property resulting from any ideas, methods, instructions or products referred to in the content.