1. Introduction
The United Nations progress report on the 17 Sustainable Development Goals (SDGs), concluded that, as far as affordable and clean energy is concerned, the current progress made is lacking. While total renewable energy consumption rose by a quarter between 2010 and 2019, renewable energy consumption represented only 17.7% of the total energy consumed in 2019 [
1]. COP27 held in November 2022 acknowledged that climate change is a common concern for humanity [
2]. More importantly, it underlines an imperative need to tackle the intertwined global crises of climate change and biodiversity loss in the broader context of achieving the SDGs, including the critical importance of protecting, conserving, restoring, and sustainably using nature and ecosystems for effective and sustainable climate action. Global economic leaders recognized that the impacts of climate change aggravate the global energy and food crises, and vice versa, especially in developing nations. On top of setting a loss and damage fund to tackle devastating economic and non-economic losses such as forced displacement and impacts on cultural heritage, human mobility, and the lives and livelihoods of local communities, COP27 emphasized on an urgent call for rapid and sustained reductions in global greenhouse emissions. Particularly, it stressed on the value of encouraging a clean energy mix, including renewable and low-emission energies, as part of the gradual transition process toward cleaner and sustainable energy.
Global energy investment was expected to rise by nearly 8.5% to USD 2.391 trillion in 2022, a level which is well above pre COVID-19 levels [
3]. The main contributor remains the power supply sector, in advanced economies, Emerging Market and Developing Economies (EMDE), and China, with all three contributors witnessing increasing power generation investments overall post COVID-19. Despite an increase in investments in clean energy from USD 1.1 trillion to USD 1.4 trillion over 2019–2022, investments in fossil-fuel supply, represented by oil, gas, and coal, account for nearly 97% of investments in total fuel supplies globally, a percentage which hardly changed since 2019 [
3]. Investment in coal, oil, gas, and low-carbon fuel supply is the sole area which remained below levels seen before to the 2019 coronavirus pandemic. Alternatively stated, the most noticeable transition towards cleaner energies is in the power sector with continued upsurge in renewable power, where renewables, grids, and storage currently represent more than 80 per cent of the total power investment.
However, global clean energy investments are still short of meeting the increased demand for energy services sustainably [
3]. Clean energy spending in EMDEs excluding China in 2022 is still at 2015 levels, with various government owned entities being indebted with higher costs of borrowing due to worsened economic conditions, resulting in dampened the ability to fund energy ventures. This resulted in most increases in renewables, grids and storage occurring in areas other than developing economies. It led to reduced sales of clean energy products such as Electric Vehicles (EVs), with more than 90% of public spending on EVs systems taking place in the U.S., China, and Europe [
3]. More importantly, poor nations with a lack of accommodating community policies are faced with the possibility of energy poverty, where roughly 90 million people in Africa and Asia cannot afford to pay for their basic energy needs.
The situation is further exacerbated by the attempts of Europe to reduce its dependence on the Russian oil, gas, and coal supplies following the Russian-Ukraine crisis, global inflationary pressures, and volatile energy prices. All these external factors add to the existing pressure for investors to consider green energy investments, especially in less attractive EMDEs [
3]. While higher energy prices in 2022 provide a rise in oil and gas producers’ net profits, nearly 50 per cent of the additional USD 200 billion in capital investments in 2022, would be absorbed by higher costs, instead of increasing energy supply capacities or future investments. These increasing costs are caused by various factors, including a limited market of specialized labor, supply chain pressures (e.g., the shortage of semi-conductors and uncertainty of automakers to meet the demand of electric vehicles), the impact of higher energy prices on cost of production of raw materials such as cement and steel, all of which eventually translate into a total consumer energy bill exceeding USD 10 trillion in 2022 [
3].
Given the uncertainty on the long-term outlook for oil demand, higher investments in oil are not sustainably guaranteed, backed by the refining sector which had its first reduction in global refining capacity in 2021. Similarly, high prices question the long-term outlook for gas demand, especially in price sensitive developing nations, where new gas-fired capacity was the lowest in fifteen years. With climate friendly corporations delivering higher a return on investments, complemented with a lower cost of financing, financial markets have also evolved in the last decade, by (i) introducing investment opportunities through the rise of new environmentally friendly assets classes or financial products; (ii) and creating a paradigm shift among investors to consider climate change factors in investment decisions [
4]. While there were various actions from the investment community on the paradigm shift, e.g., the Portfolio Decarbonatization Coalition, the Montreal Carbon Pledge, and the Task Force on Climate Related Financial Disclosure, much less has been captured on the performance of sustainability indices which promote cleaner energies [
4].
The primary objective of this study is to assess the performance of sustainability-based indices which are linked with cleaner energy sources. Specifically, the study analyzes the performance of sustainable investment indices whose constituents meet Environmental, Social and Governance (ESG) needs of investors. All the constituents satisfy the Green Revenue Classification System (GRCS). The paper focusses on alternative energy-based equity indices, and more particularly, environmental markets equity index series. To assess the performance of these indices, technical analysis trading strategies is used to capture market trends by using moving average (MA); market momentum by employing the Relative Strength Index (RSI); and volatility through the use of the Average True Range (ATR).
The present study contributes to the existing literature, by being the first, to our knowledge, to (i) capture trend, momentum, and volatility information in sustainable investment indices such as environmental market equity indices; (ii) use technical analysis tools to assess the performance of trading strategies which are based on trend, momentum, and volatility; (iii) analyze how industry- and regional-based indices differ in terms of performance; (iv) compare the performance of environmentally sustainable equity indices with both traditional global equity and oil-based indices; and (v) assess a trading system which provides the simultaneous use of momentum, trend, or volatility-based information to generate positive excess return per unit of risk in sustainable equity index investments.
The key players in the smooth functioning of financial markets are investors, investment institutions and government regulation. Key findings of this study have some important economic significance for investors, investment institutions, and regulatory bodies. For instance, an assessment of the performance of sustainable equity investments allows the investor to make more informed decisions when deciding whether to invest in traditional financial products such as exchange traded funds (ETFs) which are based on traditional equity markets and oil-linked, or rather in those indices whose constituents are aligned with climate change consciousness, and a gradual move away from traditional fossil fuel-based markets. As sustainable equity investments carry additional risk factors such as climate change and policy actions, the move from traditional equity investments on energy commodities such as fossil fuel-based ETFs and portfolios requires a sustained outperformance of sustainable investments over fossil fuel-based equity investments. This study tackles this issue by comparing the performance of environmental market sustainable investments with traditional oil-based equity indices. Further, since various investors consider stock market indices as a long-term investment, where for example, the U.S. stock market index have mostly witnessed exponential increases since 2014, this study also compares sustainable equity investments with global stock market indices. Our findings also shed further light as to whether environmental technologies and environmental opportunities indices offer a more attractive option to the investor in terms of his/her portfolio’s excess return per unit of risk. A comparison among regional or industry specific indices provides further guidance as to which industry or region, is more attractive to include in a portfolio which can comprise multiple ETFs as part of portfolio diversification benefits. Driven by investors’ demand for sustainable finance, a shift from non-renewable to sustainable-based equity investments can drive the surge of specific environmental markets sectors. However, a rise in investors’ interest in sustainable finance can be possible with a continuous and sustainable outperformance of green equity investments over fossil fuel-based investments. Alternatively stated, the added risks taken by investors in sustainable investments need to be compensated with higher returns than fossil-fuel equity investments.
For investment institutions, due to the increased attention and investments in greener energies, particularly in the U.S., EMDE, and China, our findings provide some light into which direction sustainable investments are heading. Although the study focusses primarily on indices from the environmental markets’ family class, the performance of environmental technology index series and environmental opportunities index series allows investment product providers to consider constructing financial products such as ETFs, derivatives, and retail/institutional funds where those abovementioned indices are used as benchmarks. This eventually allows resources, e.g., specialized finance skills, to be directed towards constructing and managing green sustainable portfolios, based on market demand for sustainability-based financial products. This results in the need to focus more on regions, sectors, rather than broad-based exposures, which brings economic value in terms of constructing specific greener-based portfolios which can perform sustainably.
Last but not least, to governments and regulatory bodies, the tectonic shift of capital towards sustainable investing means that industry, sectors, and individual companies are affected. Simply put, the changes in investors’ preferences, through a shift away from companies pursuing fewer or no green objectives towards those pursuing greener objectives means the specific industries’ and sectors’ contributions to the economy could change. As these shifts are happening, higher returns are expected, particularly for those which are more closely related to risks such as climate change. Alternatively stated, if sustainability is valued by investors, asset prices should reflect those, relative to the risk sustainable investments add to existing risks. This means more rigor in regulations in terms of definitions, guidelines, and frameworks. This can translate in a more complex environment, where both local and regional-wide regulations are seeking adoptions. For instance, the Sustainable Finance Action Plan (SFAP) is a collection of European Union (EU) policy actions to encourage sustainable investments, where reforms seek the reorientation of capital flows towards sustainable investments, mainstreaming sustainability into risk management practices, and foster transparent and long-termism in financial activities. The SFAP, as a policy to promote green finance, led to the Sustainable Finance Disclosure Regulation (SFDR), a European-wide legal framework to improve transparency in the market for sustainable investment products, to prevent greenwashing and increase transparency around sustainability claims made by financial market participants.
The remainder of the paper provides an overview of the trends in fossil fuel-based investments, a review of the types of risk introduced by sustainable investments, policy actions in the area of sustainable investments, and a review on the use of technical analysis in financial markets. The methodology section provides a breakdown of the different technical analysis models, followed by the data section which provides the data specifications of the financial products under analysis. The research findings are laid out, starting with some descriptive statistics. Some conclusive remarks are gathered at the end of the study.
3. Methodology
Due to the scope of the study and availability of various technical analysis indicators, a focus on RSI to capture momentum, moving average to capture underlying trends, and ATR to provide volatility information was made.
Relative Strength Index (RSI)—The RSI, introduced by Wilder in 1978, is one of the most popular technical indicators used to determine momentum in price movements, i.e., the rate of the rise or fall of a security’s price [
43]. Compared to constructing a momentum line which uses price differences, the RSI avoids the issue of having erratic shifts in the momentum caused by sharp price advances or declines, by smoothing the price changes. Further, as a momentum oscillator which fluctuates between 0 and 100, it provides a vertical range for comparison purposes. The RSI captures the cumulative gain in price relative to cumulative loss in price, and is calculated as follows:
where
For the purpose of this study, a lookback frequency of 14-month period was adopted, where 14 was the default setting on most trading platforms showcasing the RSI indicator. RSI values above (below) the 70 (30) levels are considered overbought (oversold) [
50]. For the purpose of our study, price was analogous to the index value. Although, it can be argued that an index value is not price, all the environmental equity indices used in the study can be used to create financial products such as ETFs as mentioned earlier.
Moving Averages (MA)—Primarily used in smoothing noisy data, MA partitions data into overlapping sets of a given sample size, by shifting along one step at a time. While there exists plentiful literature about the success of trend-following systems (e.g., [
34]), the 200-day MA is the most cited long run trend indicator. For example, the long run MA on the Dow Jones Industrial Average (DJIA) over the 1886–2006 period and found the market timing strategy to outperform a buy-and-hold strategy [
51]. Similarly, a 10-month MA for the S&P 500 market index over the 1901–2012 period was tested and found the market timing strategy to outperform a buy-and-hold of the index in terms of returns, volatility, and Sharpe performance measurements [
52]. Given a series of numbers,
, the n-moving average (
) of the series numbers can be defined as the arithmetic average of subsequences of n terms as follows:
The direction of the MA conveys information about prices, where a rising (falling) MA indicates that prices, on average, are rising (falling). Similarly, a rising (falling) long-term MA echoes a long-term uptrend (downtrend). Although an MA (200) is preferred to capture long term trend, due to the use of a monthly data frequency, an MA (100) based on monthly lookbacks captures long-term trend information. An MA (200) is not feasible since most environmental equity indices were introduced to financial markets only less than 15 years back. In line with [
53], who finds that a double crossover MA strategy outperformed a naïve buy-and-hold strategy for the SDPR S&P 500 ETF, we constructed an MA series with 50 and 100 lookback periods to capture medium-term to long-term trends and test the performance of a double crossover strategy based on 50 and 100 lookback periods. A long-term investment horizon in line with the sustainable investment products was assumed.
To reduce the effect of lags, an Exponential Moving Average (EMA) instead of a simple moving average was used. A simple MA (SMA) is the arithmetic average of previous prices over a specific time period as defined by Equation (1). k represents the weighting multiplier, with an EMA (50) having a 3.92% weighting to the most recent price, and an EMA (100) having a weighting of 1.98%. For the first EMA value, an SMA value is used.
where
.
Average True Range (ATR)—The more uncertainty there is in a financial product’s price, the greater the possibility of gapping, which results when there is a discontinuity in the security’s price. Due to the added risks that environmental issues such as climate change and related policy actions bring to financial products e.g., environmental equity indices, a volatility measure such as ATR is preferred to other measures which capture only high and low range. In support, volatility indices are closely related, and MA rules are particularly profitable in volatile conditions [
54]. Using a default 14-period setting to calculate the moving average of true range as proposed, ATR values are estimated as follows:
where
Current High (Low) represents the current high and current low environmental equity index values. Previous Close is the previous closing value of the index. For the first TR value, Current High-Current Low is used, resulting in the first ATR being
The maximum of Current High-Current Low, absolute value of Current High-Previous Close, and Current Low-Previous Close is used as TR value. Subsequent ATRs are smoothed by including the previous ATR. While ATR values provide volatility information, ATR bands, as part of a strategy which includes volatility as an input, are also used. The ATR band adjusts the price by using a multiple of the ATR value. For the purpose of our study, with the prior assumption of sustainable and long-term investing, the multiple (
) was set to 5. The ATR band is constructed as follows:
4. Data
FTSE Environmental Market Indices, which are further categorized into Environmental Opportunities (EO) and Environmental Technologies (ET) indices, are selected. With equity as asset class, the FTSE Environmental Markets indices are part of FTSE Russell Climate Indices, where a primary objective is to accelerate to a green economy by constructing investment strategies with exposure to green opportunities caused by climate change issues. The FTSE Russell Green Revenues data classification model is used to help investors understand the global industrial transition to a green and low carbon economy with consistent, transparent data and indices. Companies are analyzed and categorized using a unique industrial taxonomy for green goods and services that covers 10 sectors, 64 subsectors, and 133 micro-sectors. Revenue classification is based on the Green Revenues Classification System (GRCS), which was created following feedback from the market via the FTSE Russell Green Industries Advisory Committee and the international High Level Expert Group on Sustainable Finance (HLEG). While EO equity indices are constructed for investors interested to invest in a range of companies which provide products and services that deliver solutions to environmental challenges, ET equity indices are more suited for investors who seek to invest in pure-play companies whose core business is the development and deployment of environmental technologies. A company is eligible for inclusion in the EO index series if its green revenues percentage is at least 20%. Similarly, a company can be added in the ET index series if its green revenues percentage is at least 50% from Tier 1 activities, where Tier 1 refers to micro-sectors with clear and significant contribution to greenness [
47]. Both EO and ET index specifications are laid out in
Table 1. To avoid overemphasis on FTSE Russell-based indices and allow for comparison, the MSCI Global Alternative Energy Index is also included, where constituents derive at least 50% of their revenues from products and services in alternative energy, sustainable water, pollution prevention, green building, and energy efficiency. Although the FTSE Environmental Opportunities AIM (Alternative Investment Market) U.K. index is excluded due to the unavailability of data post June 2022, it shared a strong positive correlation of 0.76 with its counterpart FTSE Environmental Opportunities U.K. index. The study is conducted over the period 31 August 2009 to 30 December 2022, using monthly data from FactSet, FTSE Russell, MSCI, and SPGlobal.
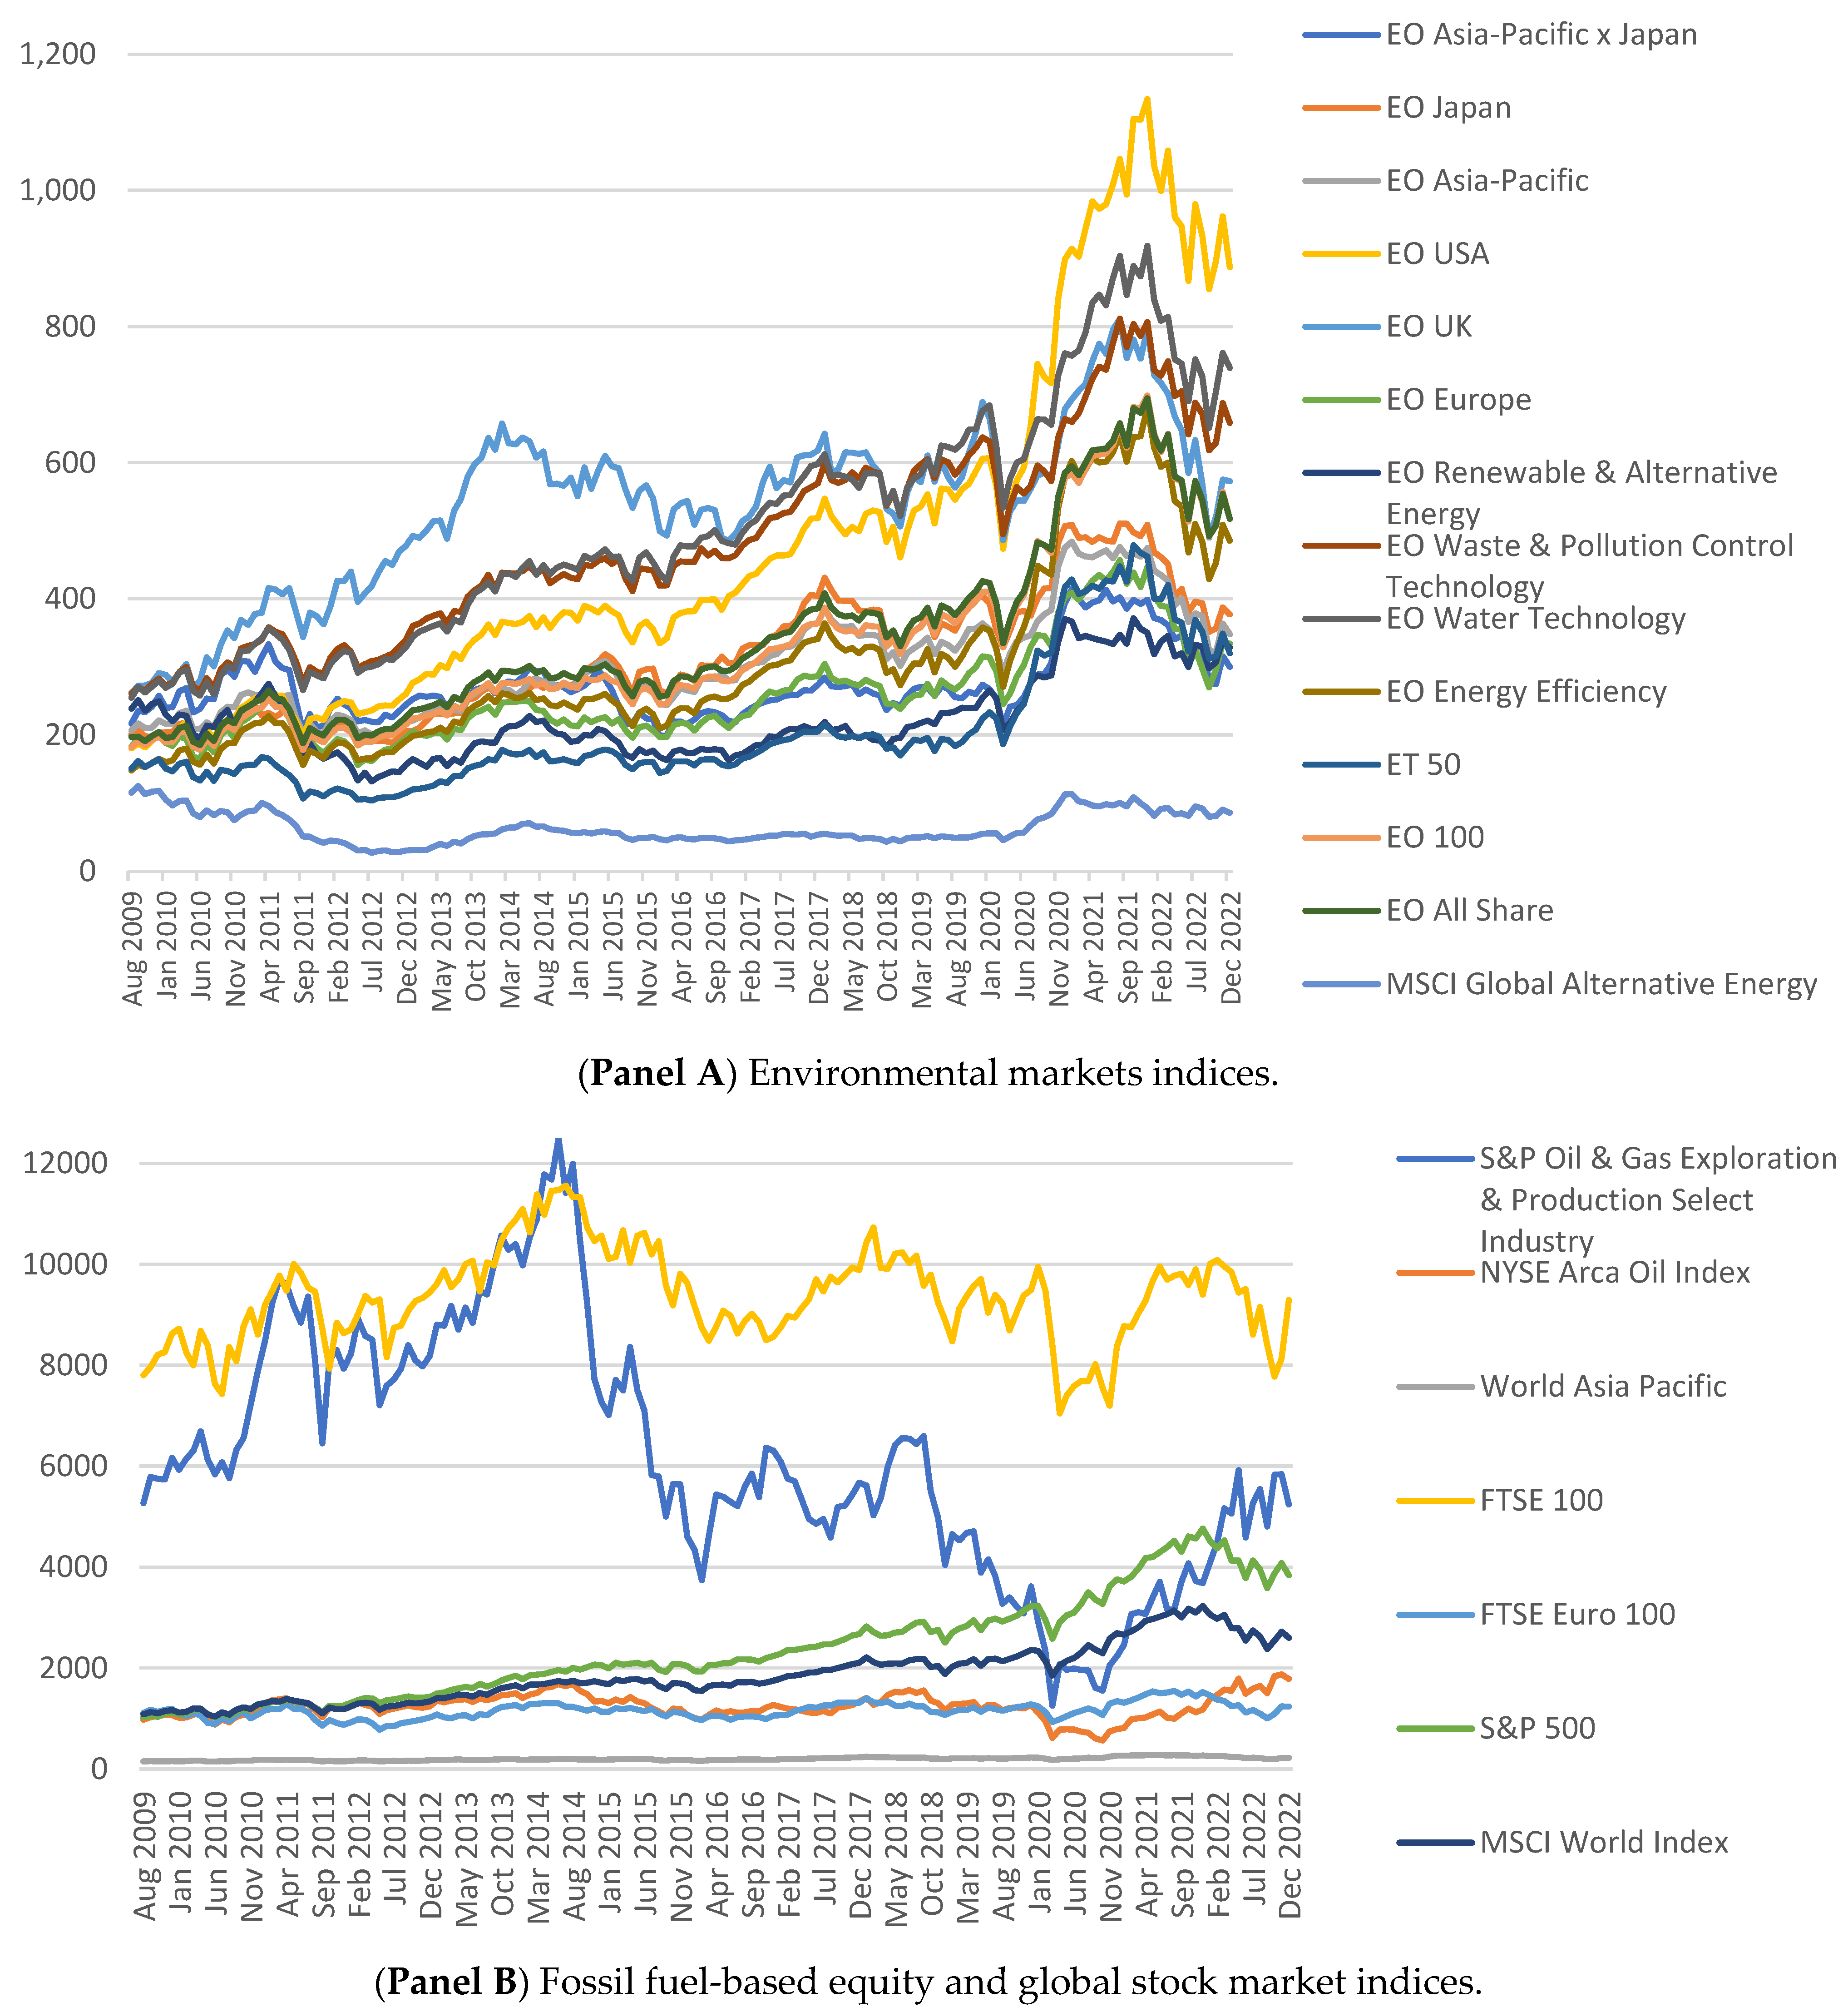
Table 1 provides a breakdown of the environmental market indices (EO and ET). EO (ET) represent all environmental opportunities (technology) equity indices. The EO indices are provided both at regional (Europe, U.K., U.S., Asia-Pacific, Asia-Pacific, excluding Japan, Japan) and sector (energy efficiency, water technology, water and pollution control technology, renewable and alternative energy) levels. The FTSE EO All Share index represents all companies engaged in significant environmental business activities and have a minimum of 20% of their revenues derived from environmental products and services. The FTSE EO 100 index reports the performance of the top 100 companies by market capitalization in the FTSE EO All Share index. FTSE ET 50 represents global companies whose core business is in the development and deployment of environmental technologies and have a minimum of 50% of their revenues derived from environmental goods and services with clear and significant impact. The MSCI Global Alternative Energy index constitutes of emerging and developed market companies which source at least 50% revenues from products and services in alternative energy.
The NYSE Arca Oil Index is a price-weighted index measuring the performance of global companies involved in the exploration, production, and development of petroleum. The S&P Oil and Gas Exploration and Production index captures the performance of the largest publicly listed in U.S. companies involved in the exploration and production of oil and gas globally. MSCI World index tracks mid-cap and large constituents in 23 developed economies, capturing roughly 85% of the free float-adjusted market capitalization in each nation. The FTSE Euro 100 index reports the performance of the 100 largest blue-chip companies in Europe which are part of the European Monetary Union (EMU). FTSE World Asia-Pacific tracks the performance of 8 developed markets in the Asia-Pacific region, with Japan with a weight of more than 45% in the index. Lastly, S&P 500 (FTSE 100) represents the top 500 (100) publicly listed companies in the U.S. (U.K.), based on market capitalization.
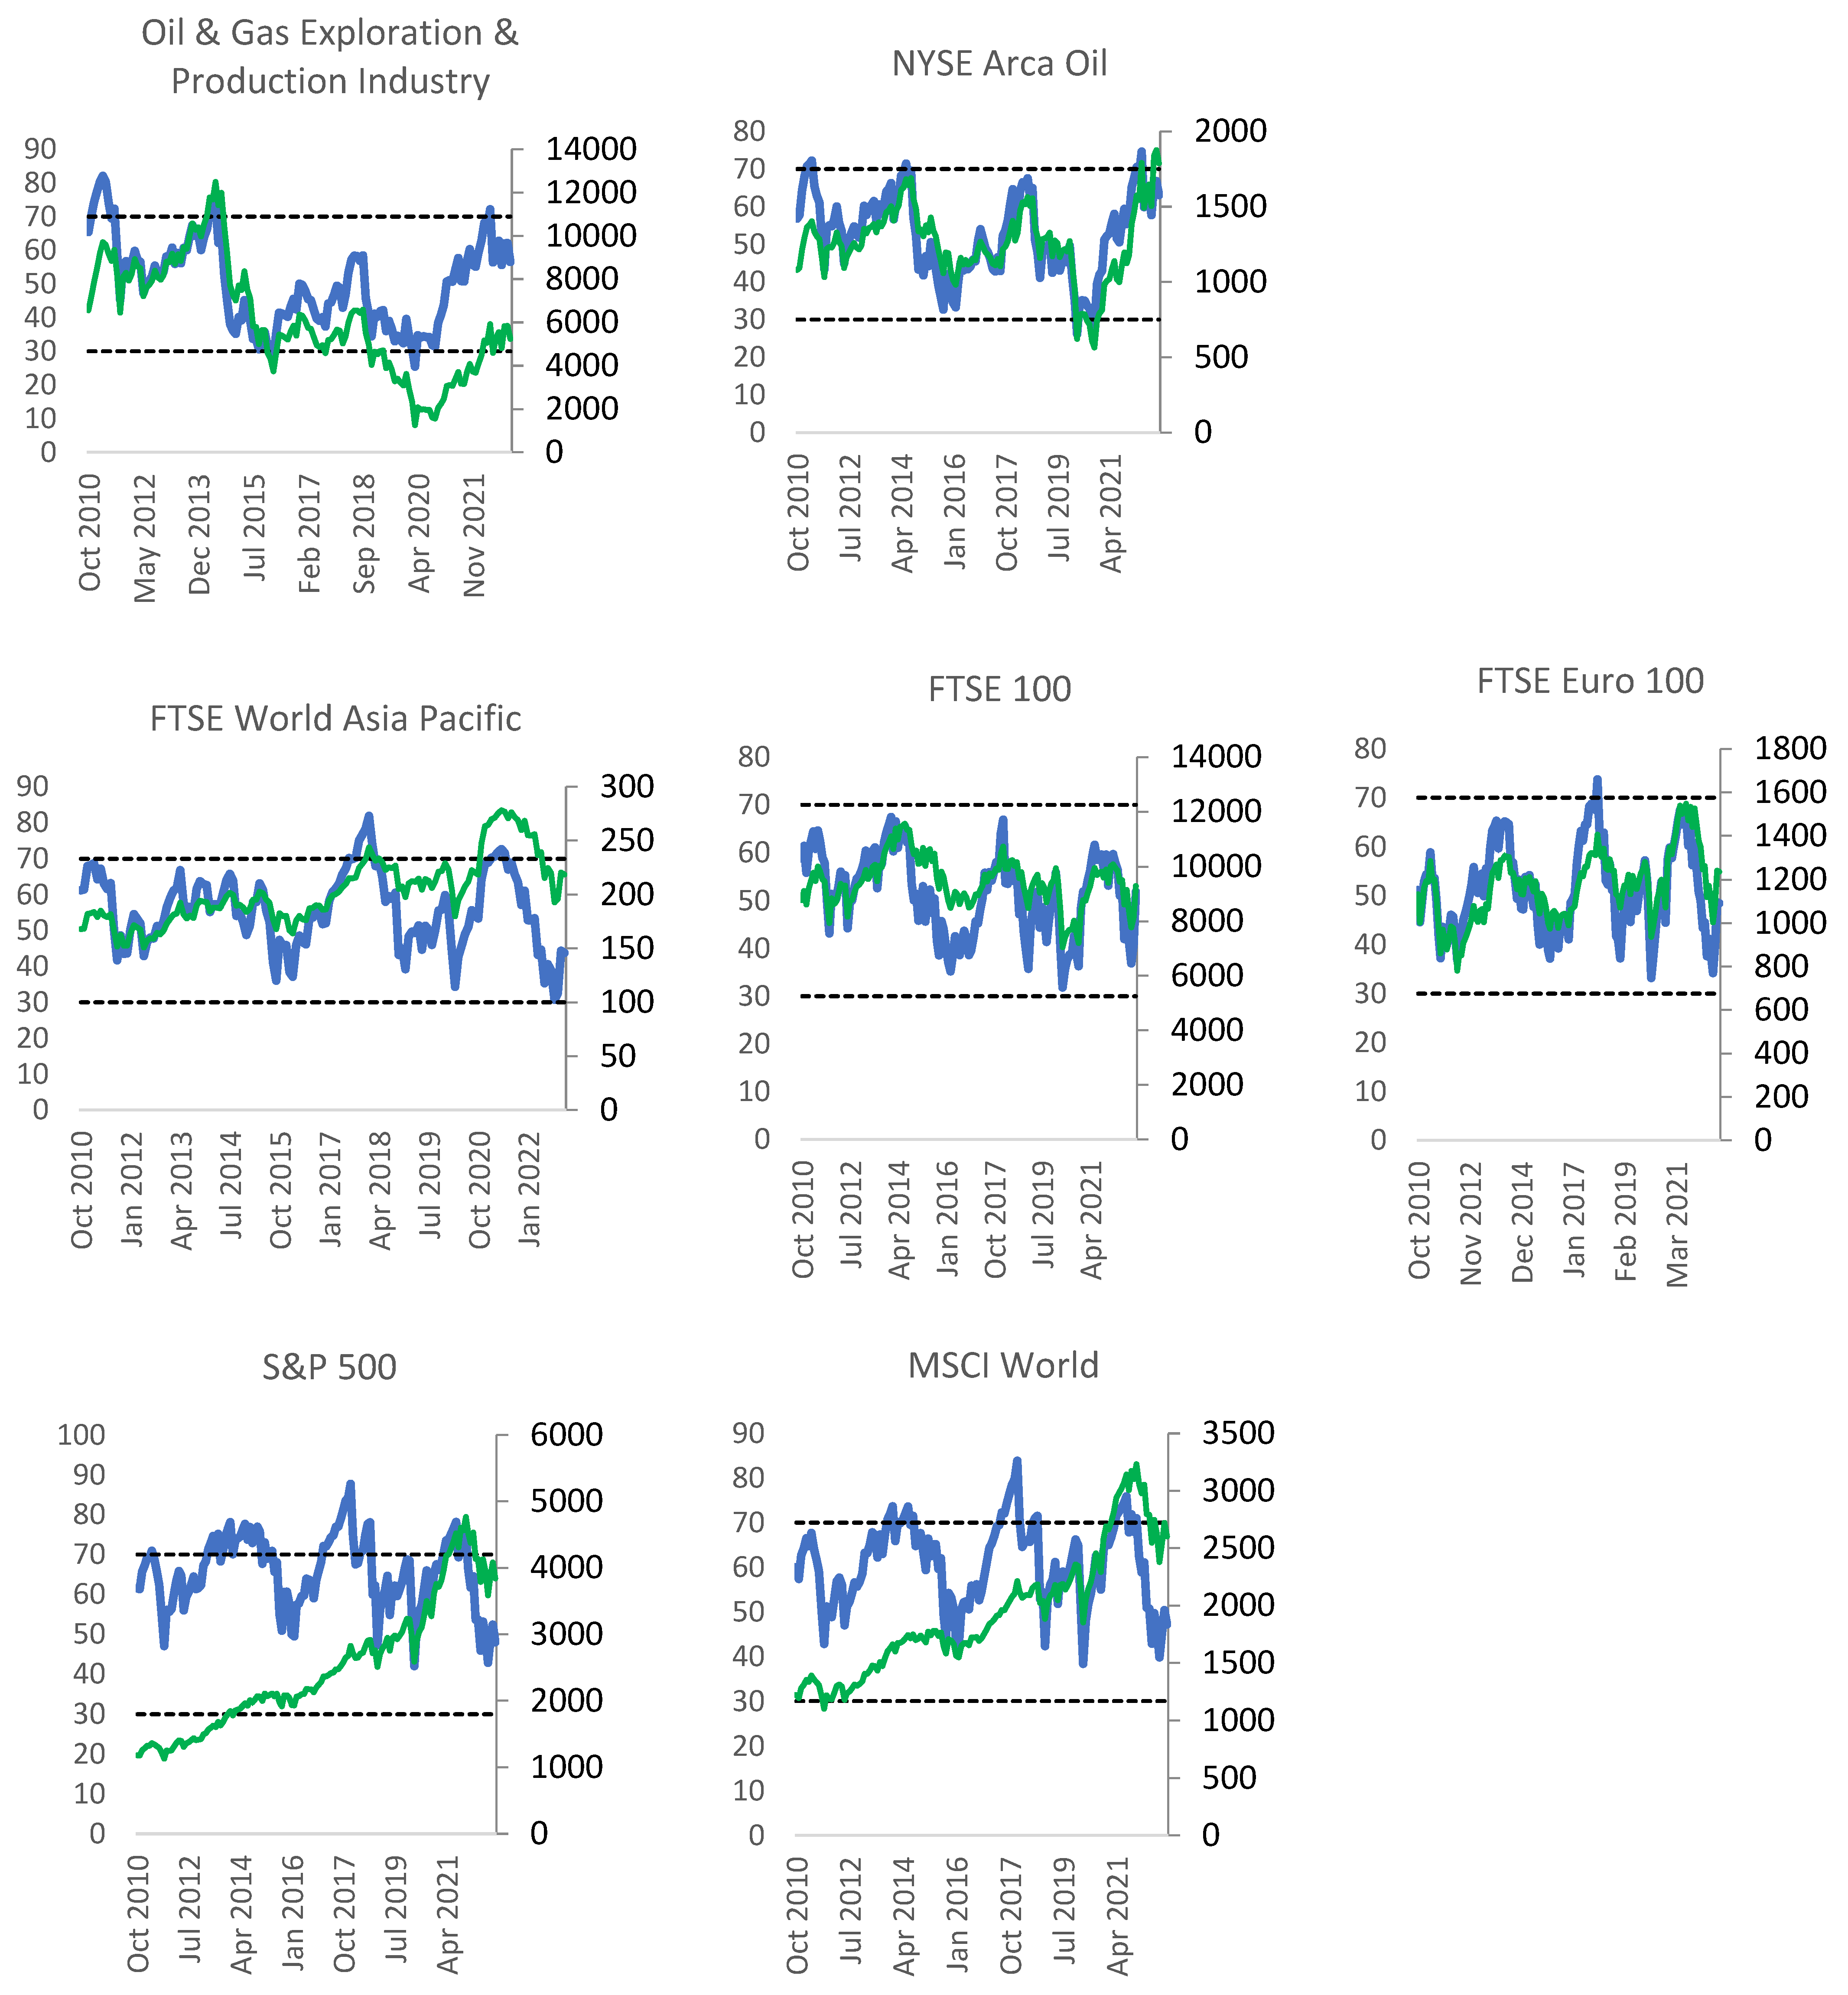
Figure 1 (Panel A) displays the monthly index values for the select environmental markets and Panel B displays index values for the fossil fuel-based and global stock markets. As observed in Panel A, all sustainability-based indices witnessed a rise in value since 2009, with 2022 values being higher than 2009s. A noticeable uptick was observed since 2020 where the green economy advanced faster compared to earlier years. This was followed by a general correction in global markets. Although not shown here, month-to-month returns fluctuated between −24% (MSCI Global Alternative Energy index) and 22% (EO Energy Efficiency index). A buy-and-hold strategy from 2009 yielded the highest (lowest) return of 512% (−76%) for the EO USA (MSCI Global Alternative Energy) index. All environmental markets indices were negatively impacted by the early COVID-19 (Jan-March 2020) with the lowest return of −20% for the EO U.K. index on a month-month basis. Similarly, from Panel B, all fossil fuel-based, and global market indices were negatively affected by early COVID-19 impact, with the S&P Oil and Gas Exploration and Production Industry index posted a negative return of −76% on a buy-and-hold strategy from 2009. All major stock markets witnessed a similar recovery with a broad market correction in early 2020. On a month-to-month basis, both the S&P Oil and Gas Exploration and Production Industry and Arca Oil indices reported the highest losses of 46% and 35% in March 2020, followed by the highest gains of 66% and 26% for the same two fossil fuel-based markets. The highest (lowest) return on a buy-and-hold strategy since 2009 was reported for S&P 500 with a return of 367% in December 2021.
5. Research Findings
5.1. Descriptive Statistics
3381 monthly observations of the environmental markets equity indices, including fossil fuel-based and global market equity indices are collected. Correlation values vary from −0.01 to 0.995 among the environmental market equity indices. Weak positive correlations were found between MSCI Global Alternative Energy and Environmental Opportunities (EO) equity indices such as EO Japan, EO Asia-Pacific, EO USA, EO Waste and Pollution Control Technology, and EO Water Technology. A weak negative correlation was observed between the MSCI Global Alternative Energy and EO U.K. indices. The rest of the environmental market equity indices demonstrated a strong positive correlation. Moderate correlation values were identified between MSCI Global Alternative Energy and the following indices: EO Europe, EO Energy Efficiency, ET 50, EO All Share, EO 100, as well as EO Renewable and Alternative Energy and EO U.K. A moderate correlation of 0.62 was also detected between S&P Oil and Gas Exploration and Production Select Industry and NYSE Arca Oil Index. Correlations of global market equity indices fluctuated between from 0.025 and 0.995. Weak positive correlations were observed between FTSE 100 and World Asia Pacific, S&P 500 and FTSE 100, and MSCI World Index and FTSE 100. Remaining global market equity indices demonstrated a positive strong correlation. With values expanding from 27.16 for MSCI Global Alternative Energy to 11,557.43 for FTSE 100, the average values ranged from 63.97 for MSCI Global Alternative Energy to 9338.00 for FTSE 100. In total, 50% of MSCI Global Alternative Energy observed values are below 54.96. The value of the first and third quartile are 48.32 and 83.28, respectively. In total, 50% of FTSE 100 values are below 9385.93. The first and third quartile are 8740.97 and 9923.63, respectively. While the S&P Oil and Gas Exploration and Production Select Industry Index had the highest value of a standard deviation (SD) of 2452.12, the lowest value of a standard deviation (SD) of 23.39 was found for MSCI Global Alternative Energy. All inspected indices were positively skewed ranging from 0.01 to 1.51. However, the EO U.K. and NYSE Arca Oil Index were negatively skewed. Except for EO Asia-Pacific, excluding Japan, ET 50, EO All Share, EO 100, NYSE Arca Oil Index, and FTSE Euro 100, all equity indices had negative kurtosis values (
Table 2).
5.2. Momentum in Equity Indices
To capture the momentum in equity indices, the RSI as a momentum oscillator is used. The use of monthly data enables an analysis of the momentum in the change in index values, where investments horizons are long-term, which is aligned with sustainable long-term investments.
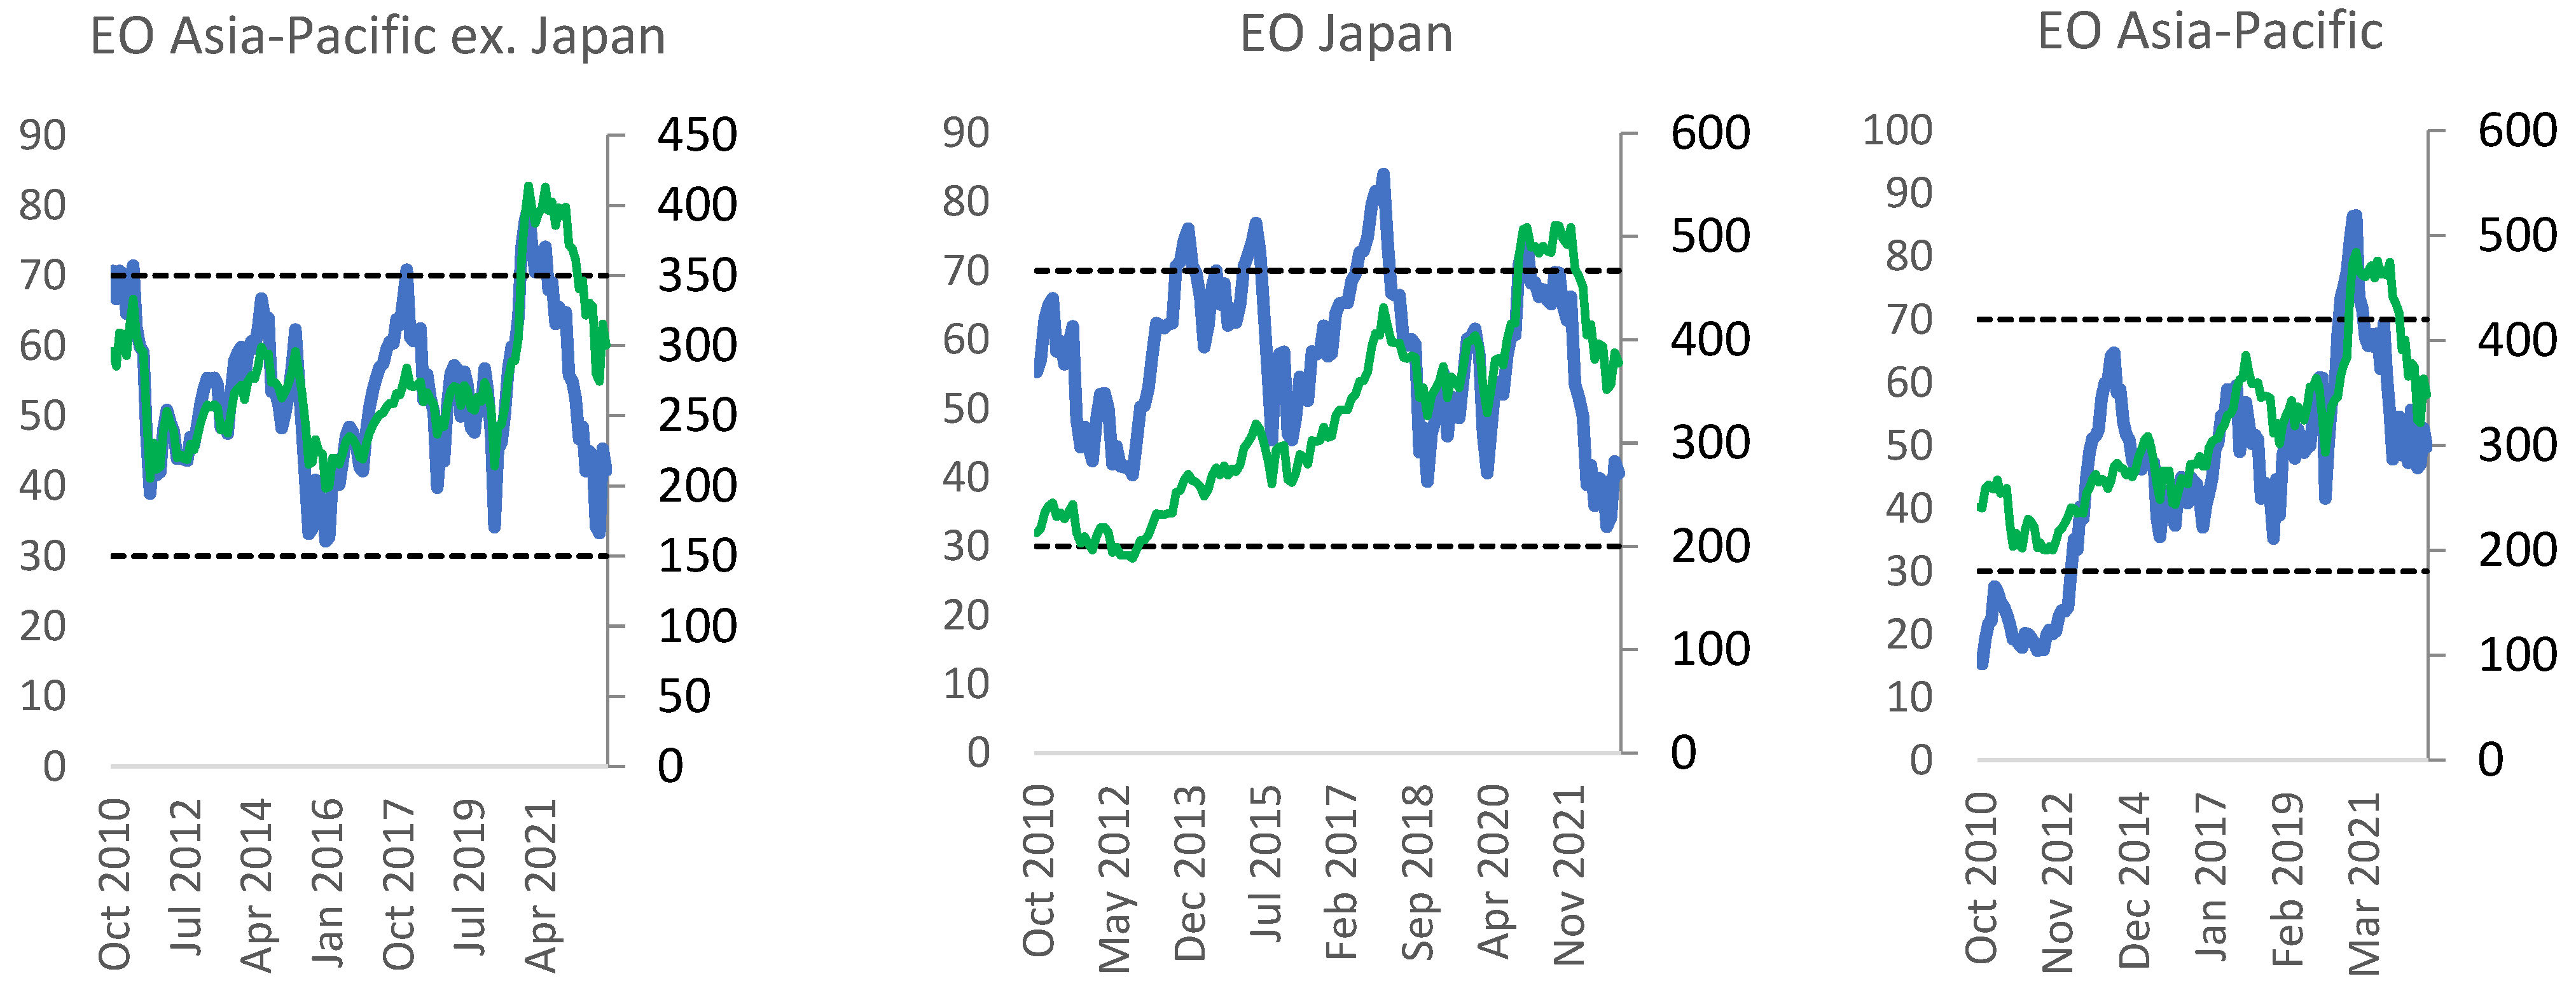
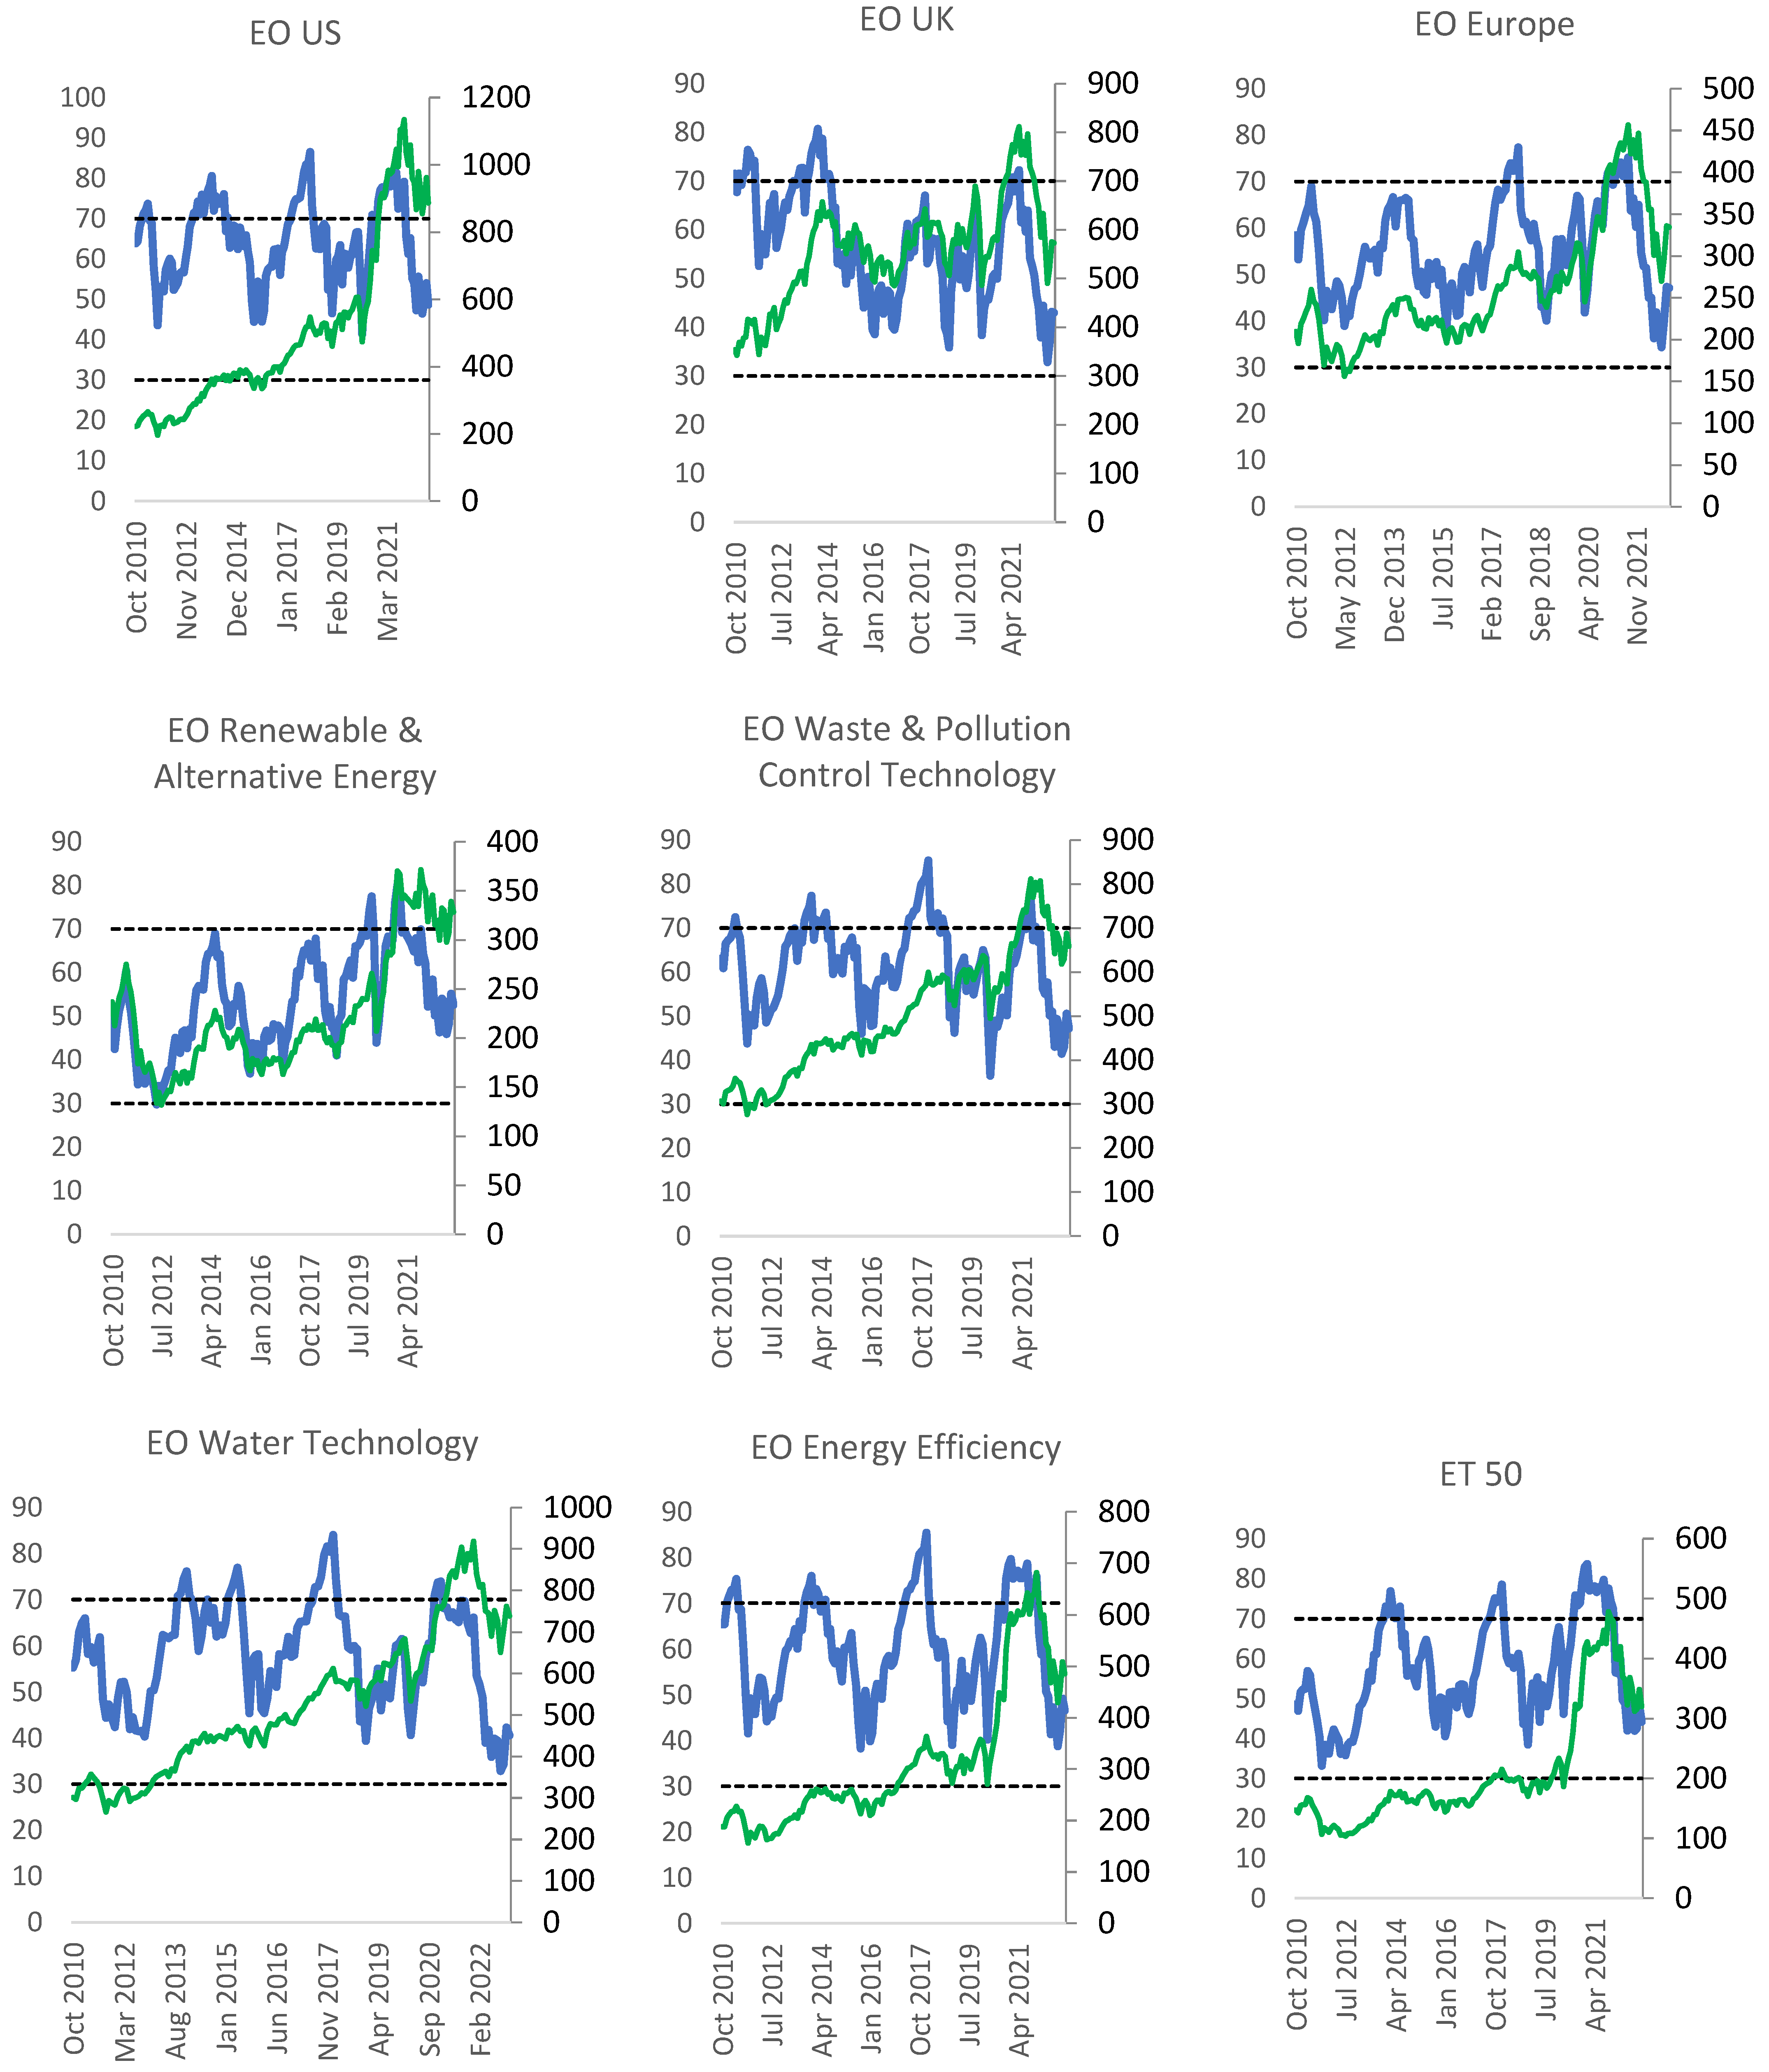
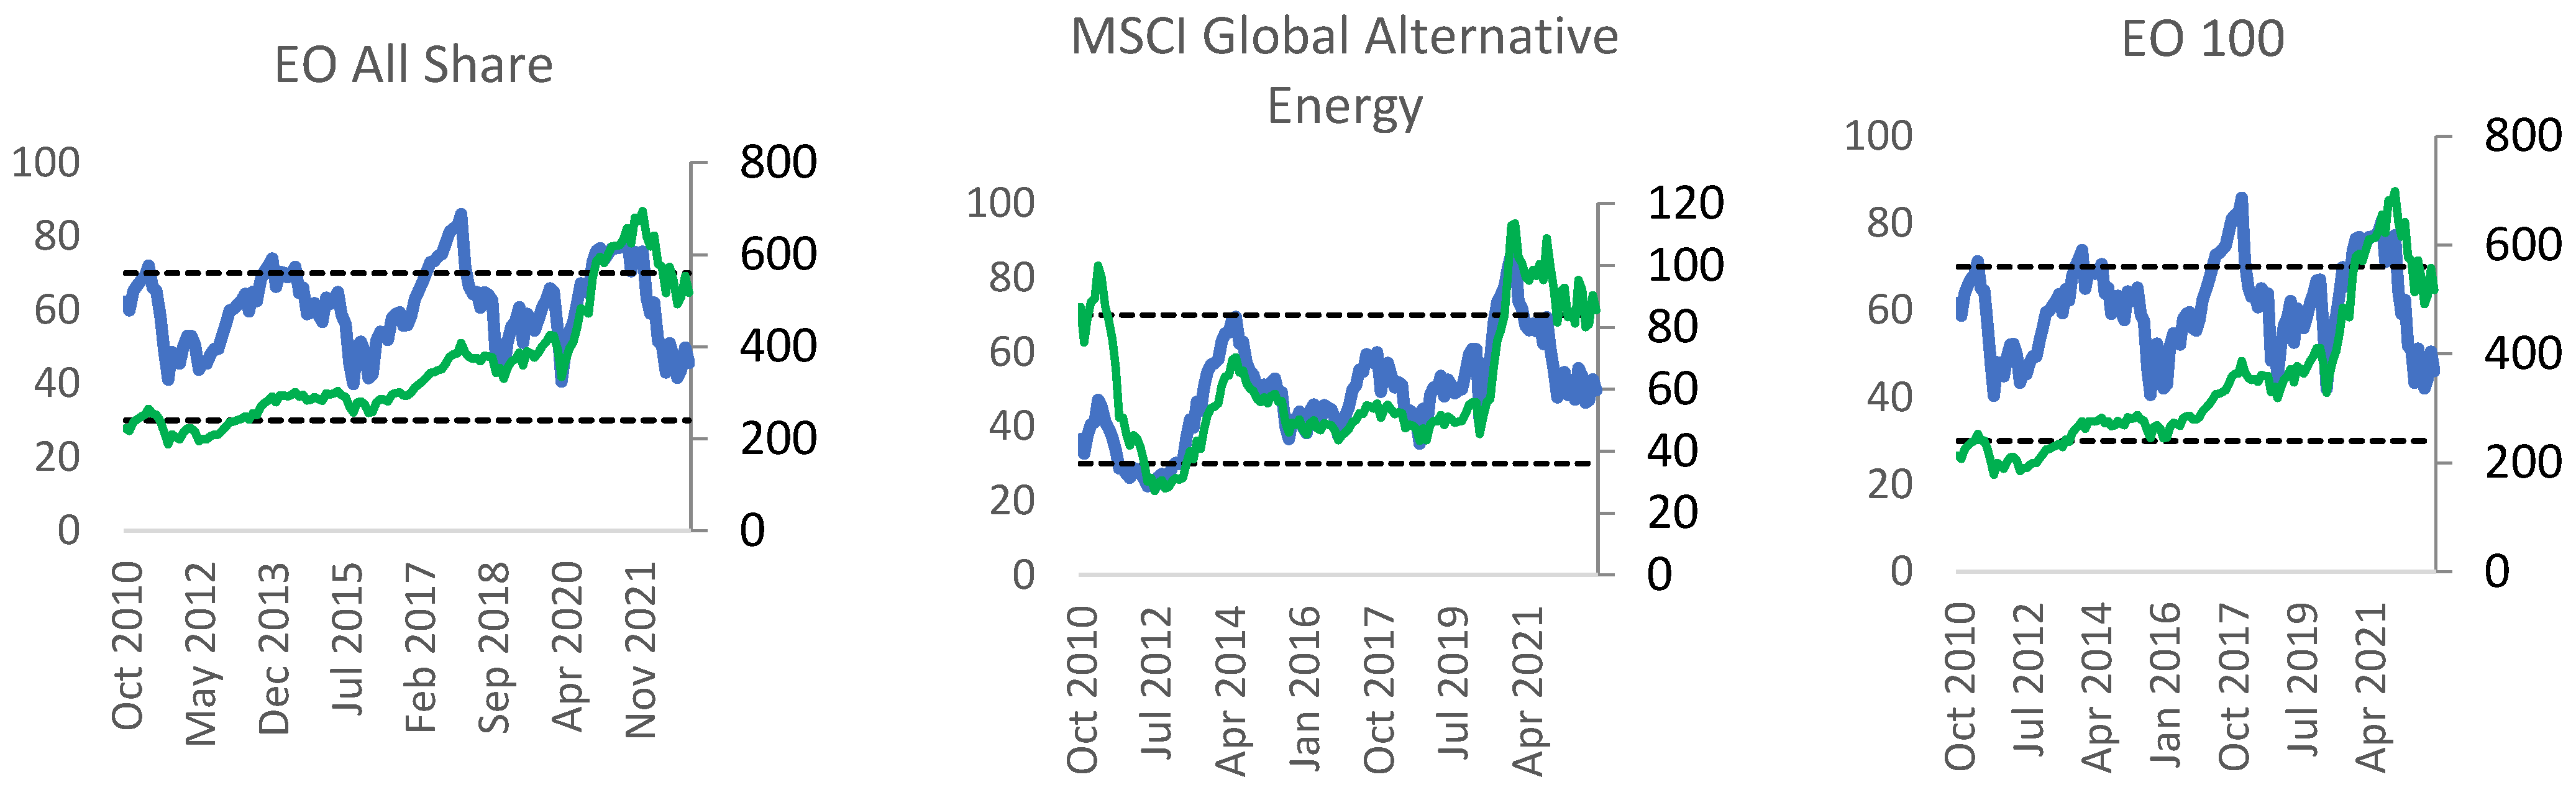
Figure 2 displays the environmental markets equity indices and
Figure 3 displays the traditional global market equity indices. Environmental market indices include both Environmental Opportunities (EO) and Environmental Technology (ET) equity indices. Specifically, the EO and ET markets displayed are EO Asia-Pacific excluding Japan, EO Japan, EO Asia-Pacific, EO U.S., EO U.K., EO Europe, EO Renewable and Alternative Energy, EO Waste and Pollution Control Technology, EO Water Technology, EO Energy Efficiency, ET 50, EO All Share, Global Alternative Energy, and EO 100. EO and ET markets are compared with traditional equity indices, namely, the S&P Oil and Gas Exploration and Production Industry, NYSE Arca Oil, FTSE World Asia Pacific, FTSE 100, FTSE Euro 100, S&P 500, and MSCI World. EO markets indices provide both regional (e.g., U.S., U.K., Europe) and specific sustainable sector performance (e.g., waste and pollution control technology, water technology). Similarly, the selected traditional equity indices are either industry focused (e.g., S&P Oil and Gas Exploration and Production) or regionally based (e.g., FTSE 100 for the U.K., FTSE Euro for Euro).
Figure 2 shows that most of the RSI values for all environmental market indices, including the MSCI global alternative energy index, fluctuated between the overbought and oversold levels. The movement of RSI values were largely aligned with index value movements. However, there were instances where the RSI values crossed above (below) the 70 (30). Noticeably, there were a few overbought with no oversold signals, suggesting environmental indices witnessed more value increases than drops. This can be supported by the emergence of financial products such as EO and ET which aim to encourage investments in cleaner and sustainable energy sources. Importantly too, all FTSE environmental indices, including the MSCI global alternative energy equity index, experienced a drop in index values around late 2021. This was mostly aligned with RSI values rising above the 70 level, suggesting an overbought period.
In comparison, as seen in
Figure 3, the RSI values for more fossil fuel-based indices such as Oil and Gas Exploration and Production Industry and the NYSE Arca Oil, fluctuated often around the 70 and 30 levels, suggesting more overbought and oversold signals. This is aligned with the heightened fluctuations observed in the index values of these indices. It can be explained by the significant drop in crude oil prices which occurred between 2014 until 2020, where prices dropped around USD 20 per barrel, before resuming an uptrend to reach around USD 114 per barrel in May 2022. Compared to the two abovementioned fossil fuel-based indices, RSI values for global equity market indices fluctuated in a different fashion. For instance, while both S&P 500 and MSCI World equity indices had a rather exponential increase since 2010, they both experienced overbought levels around January 2018 and September 2021. To capture a more accurate picture of the performance of environmental markets, fossil fuel-based indices and global equity market indices, based on the RSI as a momentum indicator, a momentum-based strategy is carried out, with the total return, average return, risk, Sharpe, and Sharpe per trade reported.
All open positions are closed by the end of December 2022 to be able to measure the risk and return over the period under study. Several buy and sell orders are allowed, such that a buy order is not necessarily followed by a sell order and vice versa. Short selling is allowed. Three of the six regional-based EOs witnessed negative returns over the period 2009–2022, upon relying on the RSI trading strategy. The only exceptions were the Asia-Pacific excluding Japan EO index, the Europe EO index, and the Asia-Pacific EO equity index, with a total return of 29.17%, 28.05%, and 1.03%. This resulted in a Sharpe of 0.601, 0.399, and 0.004, respectively. After adjusting for number of trades, the Sharpe per trade values were 0.075, 0.067, and 0.002. The relatively higher positive returns observed in EO Asia-Pacific ex Japan and EO Europe can mostly be attributed to overbought (oversold) levels aligned with price falls (increases). All sector-based EOs performed poorly, with the exception of EO Renewable and Alternative Energy which reported a 93.25% return. This, however, came with an average risk value of 62.47%, resulting in a Sharpe of 0.737 and a Sharpe per trade of 0.184. The RSI model produces two (1) sell (buy) orders for the EO Renewable and Alternative Energy index, which were aligned with the momentum in the price movements of the index. Compared with the sector-based EOs, renewables and alternative energy had also the highest risk value, reflecting the increased uncertainty in investing in the index whose constituents are from energy generation and energy equipment sectors.
Global broad ET and EOs mostly underperformed with negative total returns, ranging from −86% to −209%, except for MSCI Global Alternative Energy which reported a total return of 226.78%. This resulted in an excess per unit of risk of 1.241 and a Sharpe per trade of 0.310. The relatively better performance of the MSCI alternative energy equity index is due to the ability of the RSI to capture to oversold signals in September 2011 and February 2013, two periods where the index was at its lowest level in the last decade, and also an overbought signal in late 2020, where the index started to drop, with negative annual returns in 2021 and 2022. It is important to note also that this index performance was accompanied with the highest average risk among all regional, sector, and broad environmental market-based indices of 90.86%.
Comparatively, the two fossil fuel-based indices both reported positive total returns of 10.32% and 285%, respectively, with however high average risk values of 260% and 92%. This resulted in Sharpe values of 0.793 and 0.773 for the S&P Oil and Gas Exploration and Production Industry, and NYSE Arca Oil. After adjusting for number of trades as a proxy for transaction costs, this led to Sharpe per trades of 0.079 and 0.097. The superior performance of these two fossil-based indices can be explained by the drop in crude oil prices since 2014 and its subsequent recovery in 2020, both of which were captured by the momentum indicator.
For global market equity indices, while both FTSE World Asia Pacific and FTSE Euro 100 reported positive total returns of 20% and 14%, they underperformed the fossil fuel-based indices. This can be explained by the lack of momentum in these global market indices, which were not tracked by the RSI indicator. The lack of momentum was further observed in the S&P 500 and MSCI World which reported negative average return of −35% and −14% if a 70/30 RSI strategy is adopted. In fact, both of these indices experienced a rather exponential increase from 2010 to 2020, before correcting in late 2021. In both cases, RSI only captured the overbought level correctly in 2021, with however false signals earlier. It is worth mentioning that FTSE 100 did not generate returns, since the model design restricts the overbought/oversold levels to be consistently 70/30 for all indices.
5.3. Trends in Equity Indices
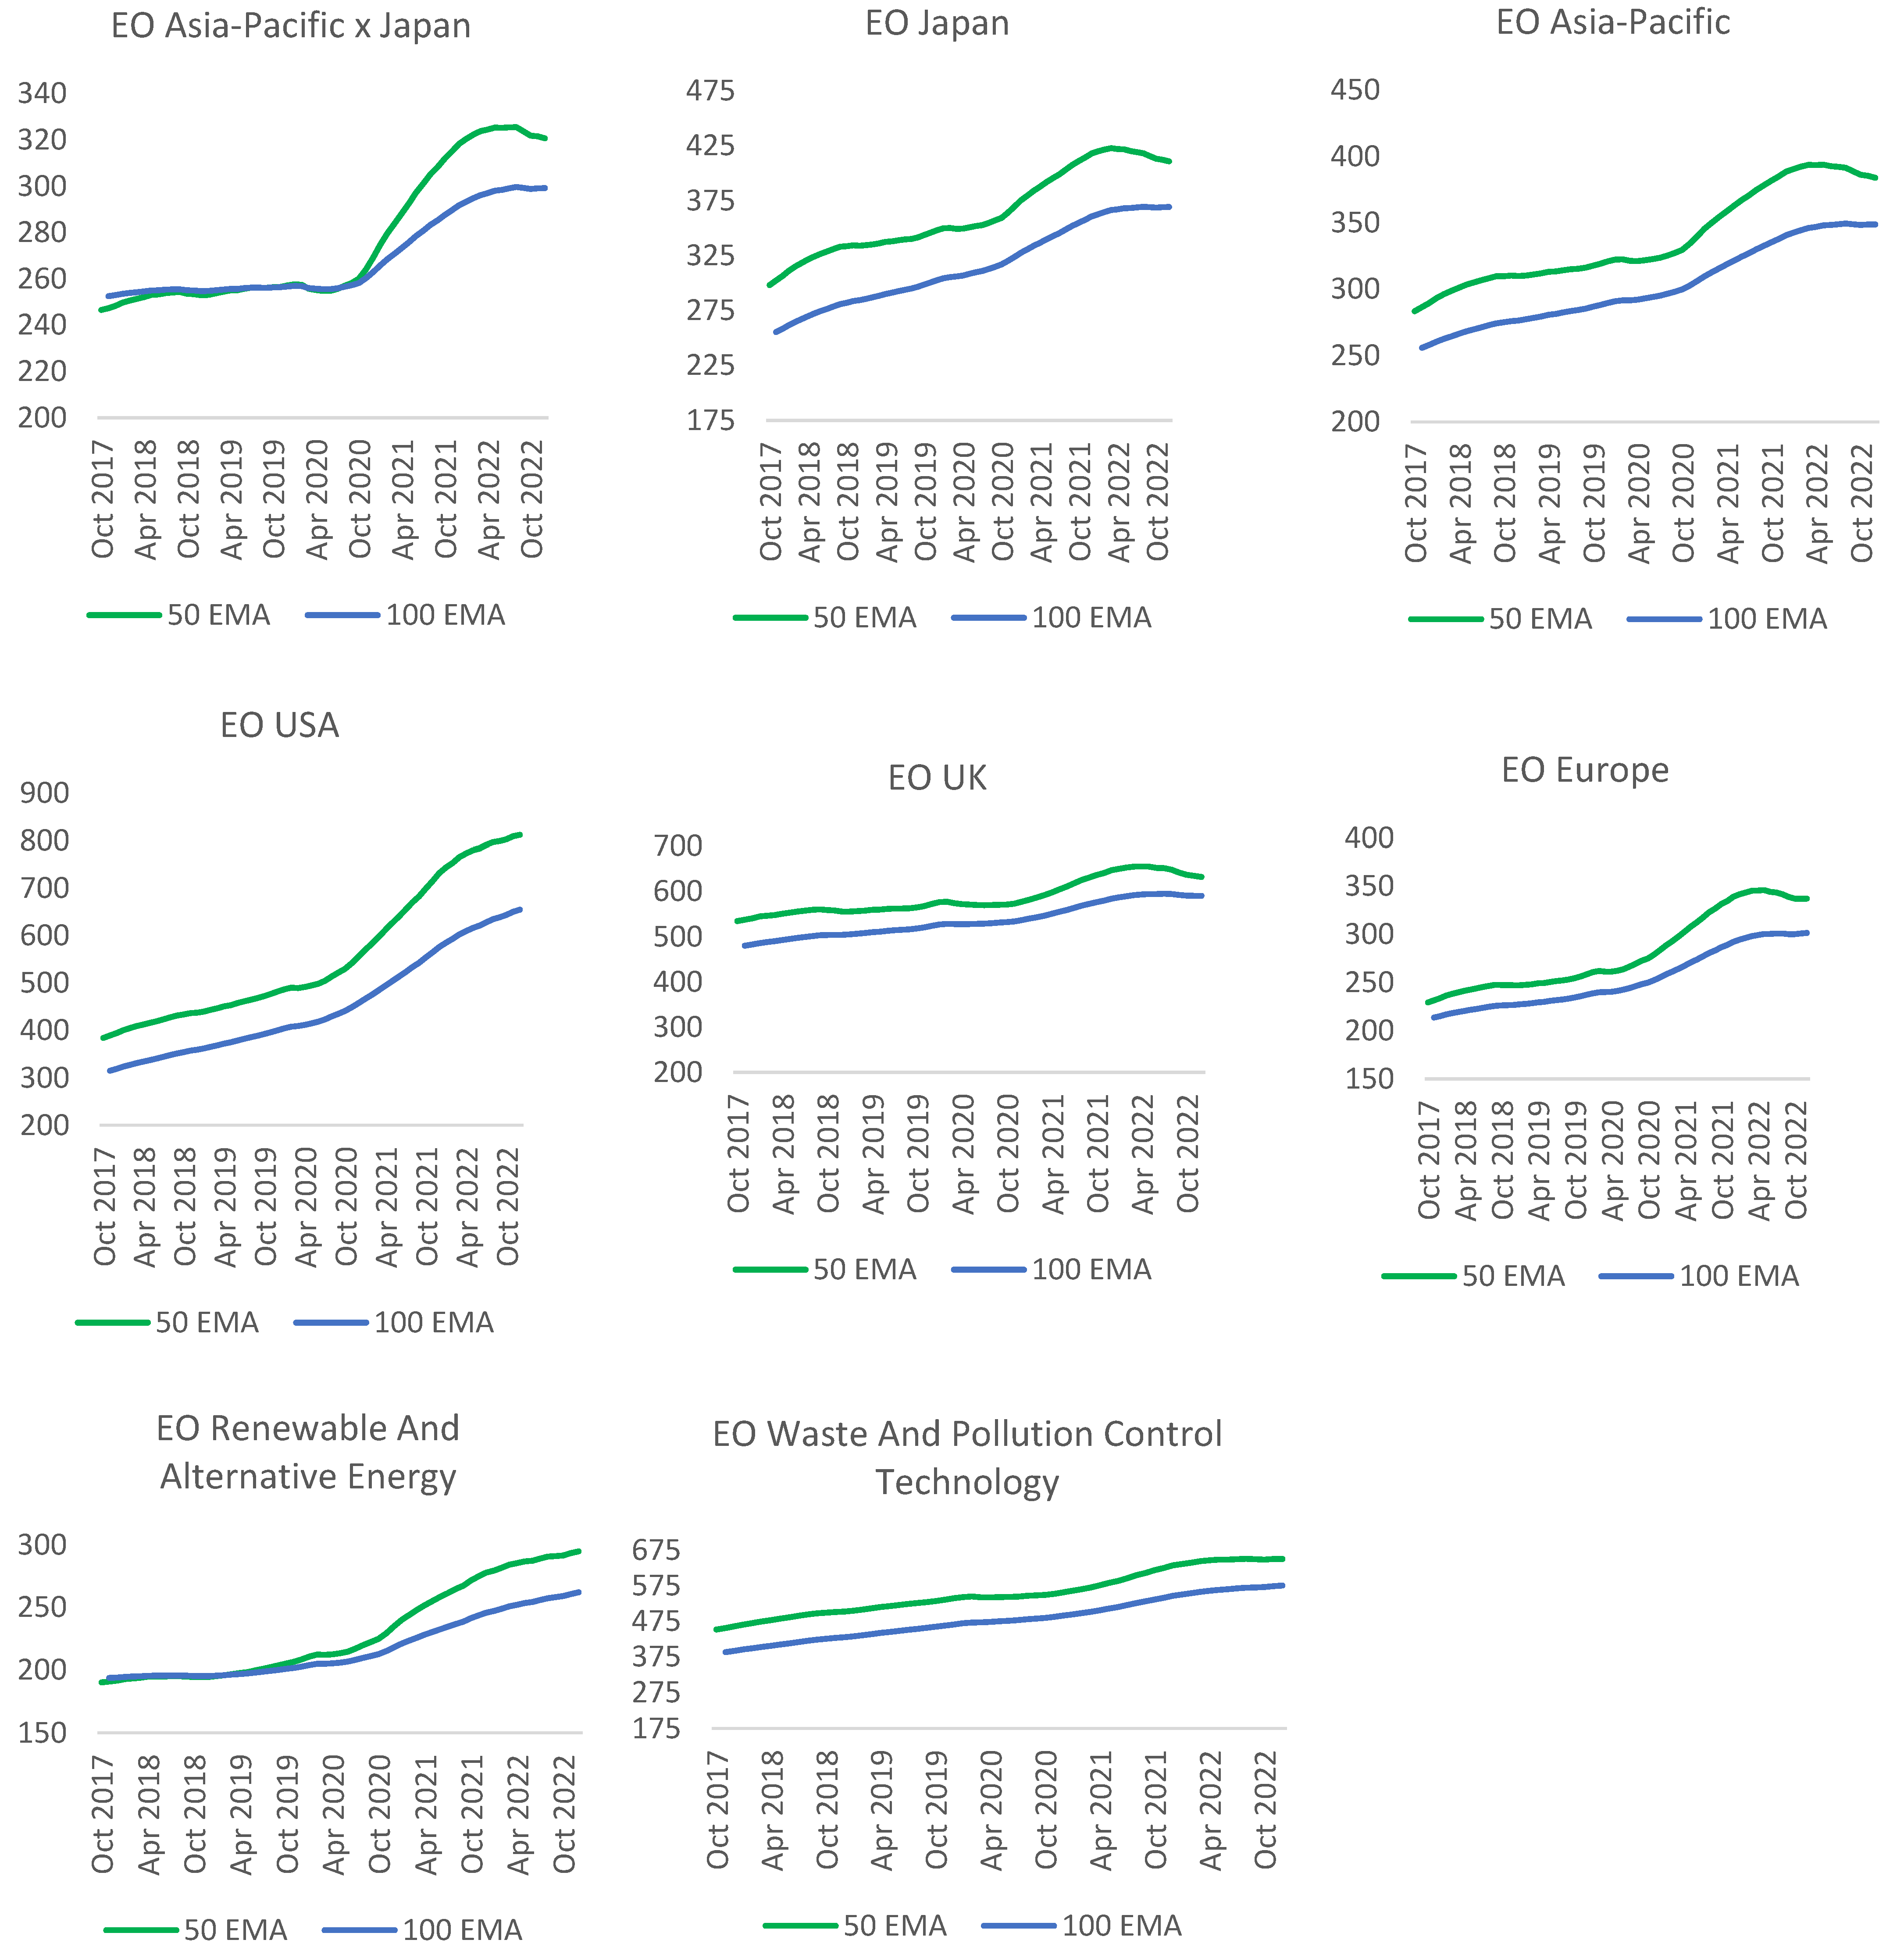
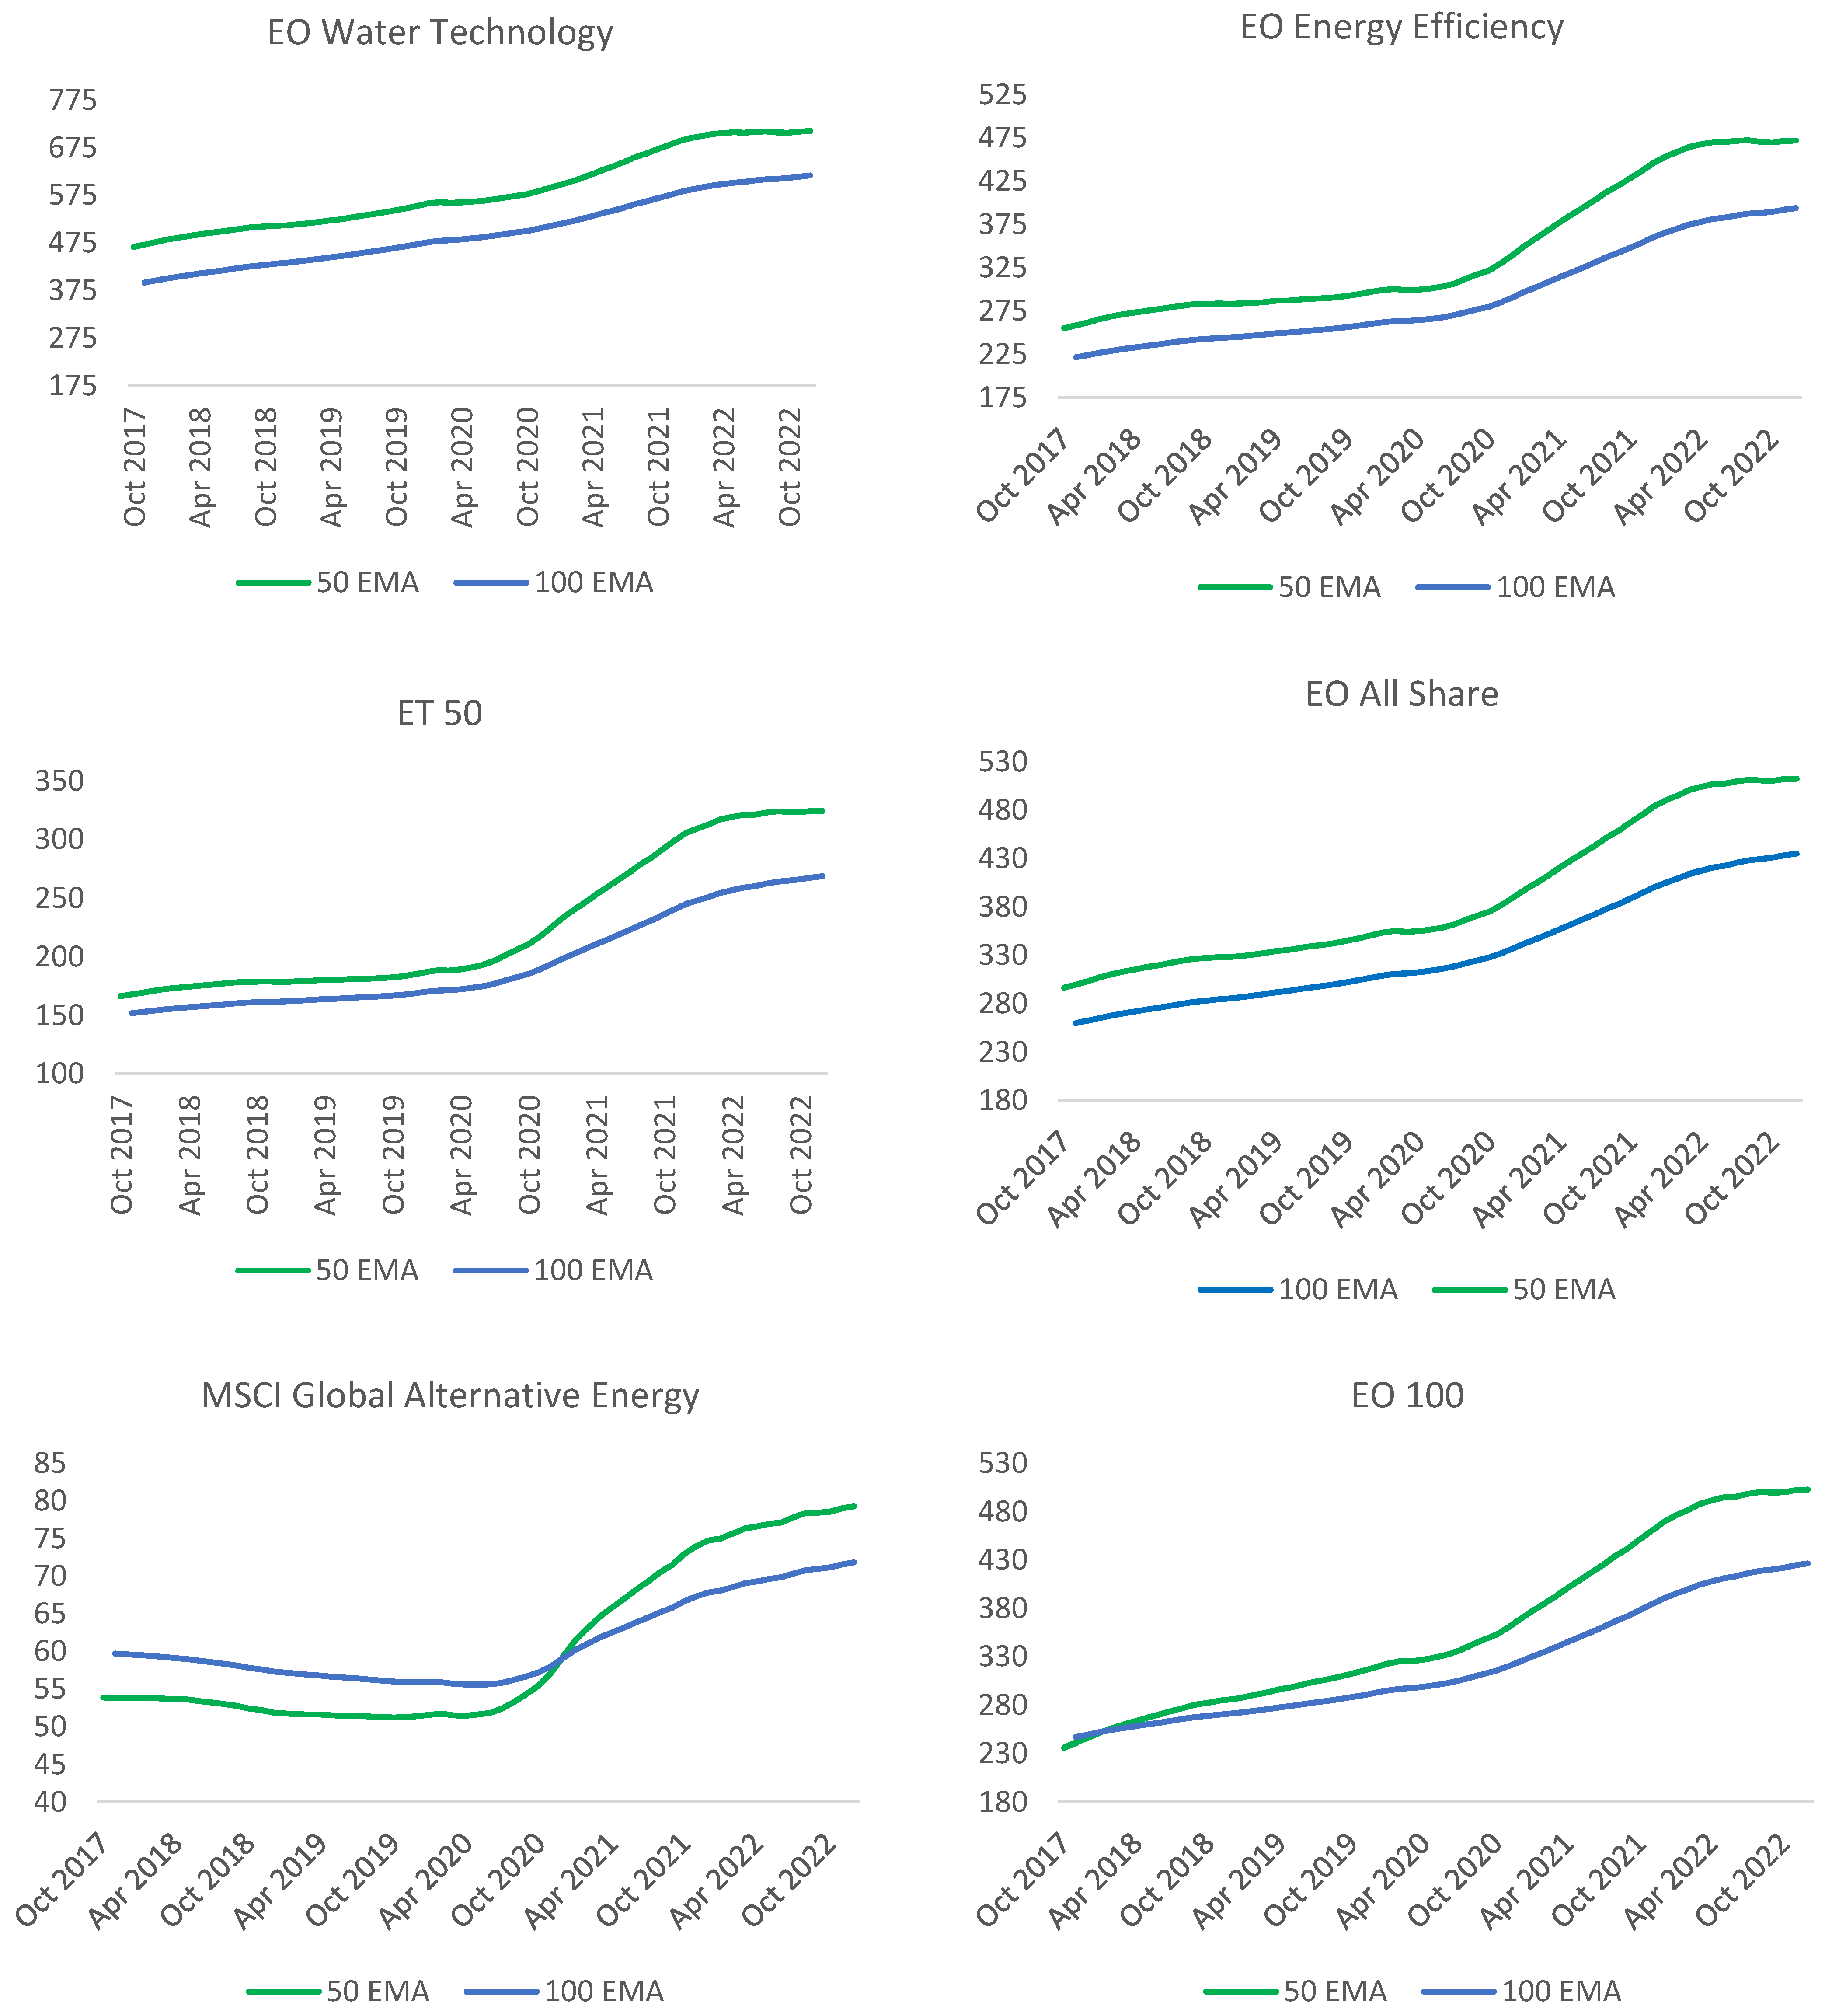
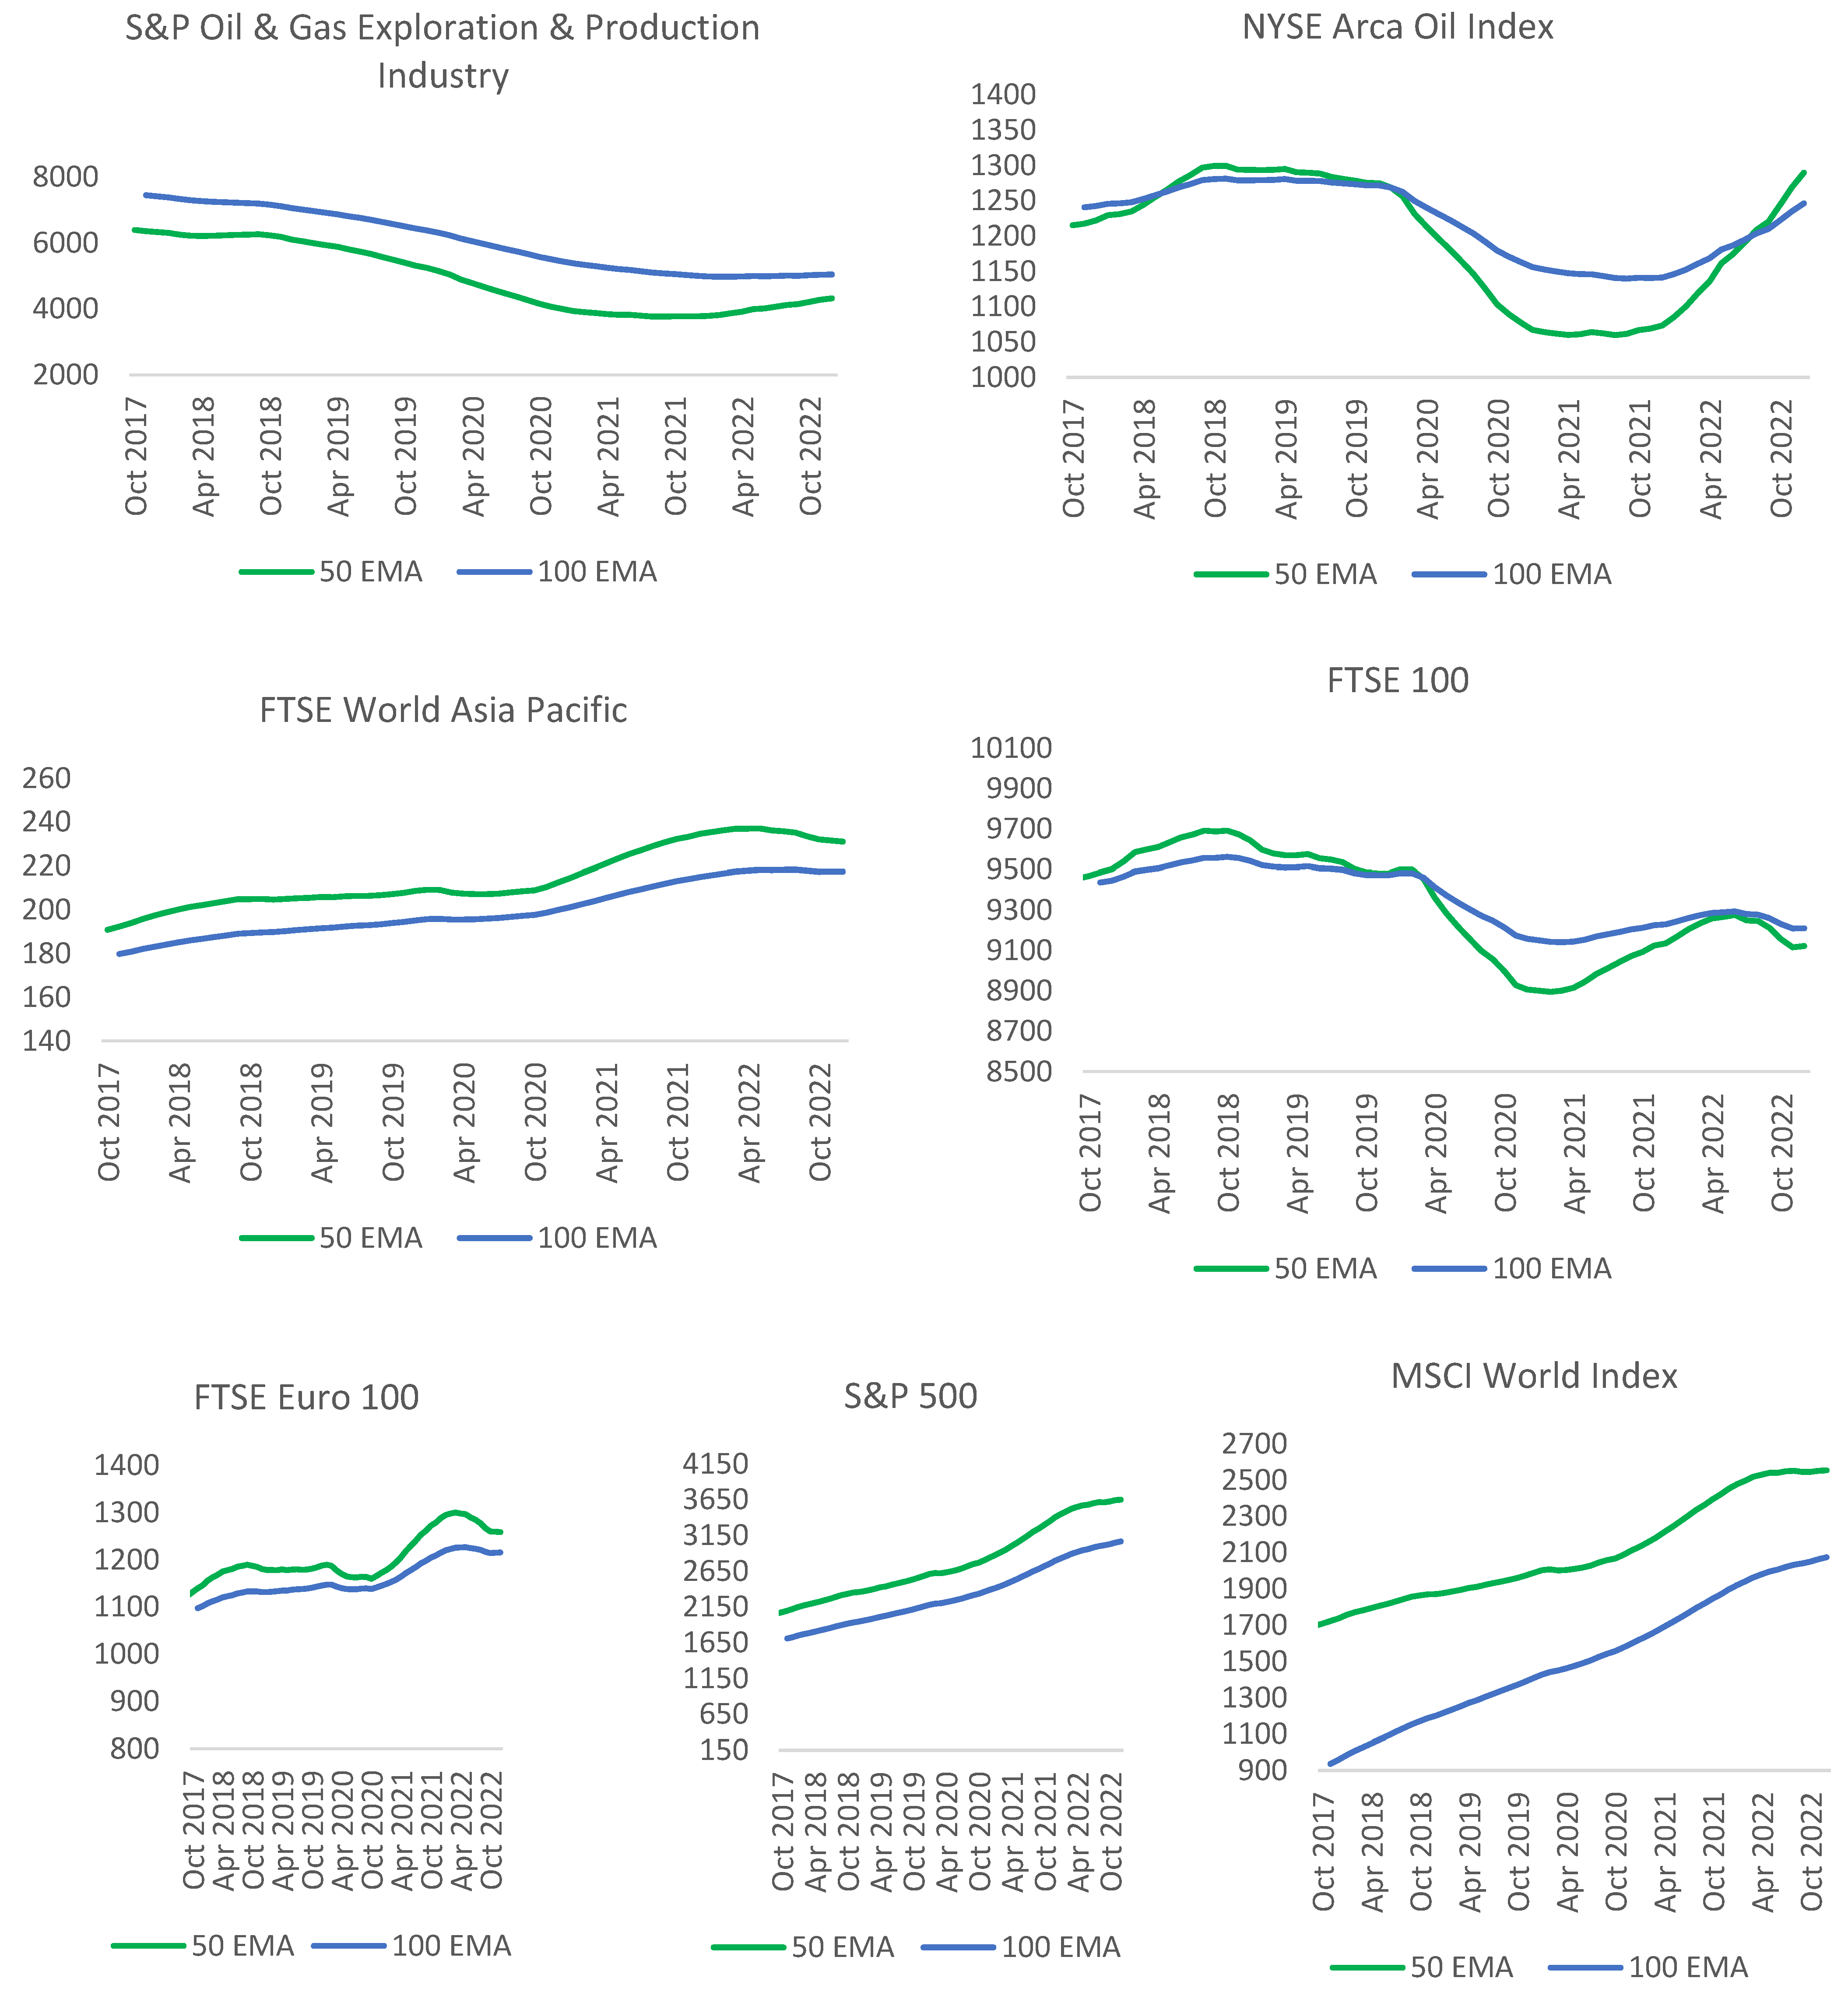
To capture trend-based information in the selected equity markets, a double crossover strategy is implemented where the 50 EMA represents the faster EMA, and 100 EMA represents the slower EMA. All open positions are closed by the end of December 2022 to be able to measure the risk and return over the period under study. Several buy and sell orders are allowed, such that a buy order is not necessarily followed by a sell order and vice versa. Short selling is allowed. Results for environmental market indices are reported in
Figure 4, with
Figure 5 reporting the same for oil and gas industry and equity market indices.
In most of the 14 Eos markets, 100 EMA acted as a long-term support to the 50 EMA, suggesting that index values have mostly trended higher than their long-term averages. For regional-based Eos, only Asia-Pacific (excluding Japan) reported a positive average return of 10.9%, with a Sharpe of 0.103 and a Sharpe per trade of 0.051. The other five regional-based environmental markets indices did not observe any buying or selling signal under the double crossover moving average strategy, which is explained by the fact that the faster EMA tend to be higher than long run moving average of 100 months. For sector-based Eos, out of the four equity indices, only renewable and alternative energy reported a significant positive average return of 58%, with a Sharpe of 0.574 and a Sharpe per trade of 0.287. Similar to regional Eos, all other sector-based Eos did not witness any buy/sell signal under the double crossover strategy.
The 100 EMA acting as a long-term support observed above, is however less observed in fossil fuel-based and global market equity indices. 100 EMA acting as a long-term support was observed in the FTSE World Asia Pacific, FTSE Euro 100, S&P 500, and MSCI World equity indices. The 50 EMA was lower than its 100 EMA counterpart for the S&P Oil and Gas Exploration Industry and Production Industry index. This can be explained by the continuous drop in crude oil prices since 2014, which heavily impacted the constituents of the index, where the latter represent the largest publicly traded companies involved in the exploration and production of oil and gas around the world. Among global broad-based environmental market indices, both the MSCI Global Alternative Energy and EO 100 indices reported significant positive average returns of 65.8% and 79.1%, with an excess return per risk of 0.652 and 0.785, respectively. Compared to environmental markets indices, only NYSE Arca Oil reported a positive return among fossil fuel-based indices. The average monthly return was only 0.2%, average risk of 0.26%, resulting in a low Sharpe (Sharpe per trade) value of 0.013 (0.003). Similarly, among major global market equity indices, only the FTSE 100 experienced buying and selling signal under the double crossover moving average strategy, with an average loss of 4.3%. All other equity market indices reported no trade, due to the slower EMA not crossing over/under the faster EMA.
5.4. Volatility in Equity Indices
Table 3 summarizes the total return, average return, risk, Sharpe, and Sharpe per trade of using the Average True Range (ATR) as a volatility-based technical indicator. While Panel A reports the results for the selected regional- and sector-based EOs and ETs, Panel B reports findings for the fossil fuel-based indices and major global stock market indices. All regional-based EOs observed negative returns, with the exception of EO Europe which reported an average return of 58%, with an average risk value of 40%, resulting in a Sharpe of 1.44 and a Sharpe per trade of 0.18. The relatively poor performance of the volatility-based indicator can be explained by the index value not coming close enough to the lower and upper bands of the ATR to warrant a buy or sell signal. For sector-based EOs, two out of the four environmentally based indices reported positive gains. While the Renewable and Alternative Energy index has a positive average gain of 37% with a Sharpe value of 0.37, the Water Technology index witnessed an average return of 10% with a Sharpe of 0.56 and a Sharpe per trade of 0.09.
All globally based ET and EOs reported losses, with the exception of MSCI global alternative energy with an average return of 28%, risk of 36%, resulting in an excess per unit of risk of 0.77, and a Sharpe per trade of 0.19. Out of all EO indices, EO 100 had the biggest average loss of 33% with an average risk of 4%. Among the fossil fuel-based indices, the Oil and Gas exploration and production industry index reported a total return of 129%, with an excess return per unit of risk of 1.281. NYSE Arca Oil had a loss of 5% with a Sharpe of −0.061. Among global market equity indices, only FTSE 100 reported a positive gain, with an average gain of 2%, a standard deviation of 2.4%, resulting in a Sharpe value of 0.685 and a Sharpe per trade of 0.171. Similarly, among all global market equity indices, S&P 500 had the highest average loss of 34% with an average risk of 1%.
Although not reported here, graphical representations of the index values with the lower and upper ATR band values tend to show that index values are very close to the lower (upper) bands. However, a closer look reveals that the index values are in fact closer to the lower and upper ATR band value of the previous period. This suggests that the lower and upper ATR band values of the previous month can be a better candidate than using the current lower and upper ATR band values to generate buy/sell signals, as a volatility-based indicator. Thus, the volatility-based trading strategy is modified by adjusting for the horizontal difference between the previous lower/upper band values and the current index values, compared to the use of the vertical difference between the current lower/upper band values and the current index values.
Excluding the later index, fossil fuel-based indices outperformed all other indices. Specifically, the S&P Oil and Gas Exploration and Production industry index reported an average return of 224% and risk of 386%, resulting in an excess return per unit of risk of 0.58 and a Sharpe per trade of 0.06. The NYSE Arca Oil index also posted an average gain of 40%, with a Sharpe of 0.43 and a Sharpe per trade of 0.03. The performance of both of these fossil fuel-based indices improved with the use of ATR indicator, where buy/sell signals are based on the previous period’s lower/upper ATR band information, as opposed to current ATR bands. Moreover, similar to results reported in
Table 3 for global market equity indices, only FTSE 100 reported positive gains of 10.21% with a standard deviation of 5.52%. This resulted in a significant Sharpe of 1.74 and a Sharpe per trade of 0.43. Although all of global stock market indices reported higher losses than in
Table 3, the average losses were less in all instances, ranging from −7.37% to −31.13%.
5.5. Trading System
Compared to the earlier findings which are based on a trader relying on only one kind of information at a time, i.e., relying on the RSI to provide momentum, moving average crossovers to provide trend information, and the ATR to provide volatility-based information, a trading system is set up to allow for a trade to occur while considering any information based on momentum, trend, or volatility. Subsequently, the revised volatility indicator is implemented in a system which includes trend and momentum information. Specifically, it is assumed that the trader is able to use information coming from trend, momentum, or volatility information to make informed buy/sell decisions. Results are reported in
Table 4. All regional-based EOs reported negative returns with EO USA bearing the highest loss of −285%, except for EO Asia-Pacific excluding Japan which reported an average gain of 2.34%, with an average risk of 18.81%. This resulted in a Sharpe of 0.59 and a Sharpe per trade of 0.06. The relatively poor performance of the U.S. Environmental Opportunities index can be attributed to the earlier findings backing the poor performance of the RSI and ATR technical indicators in capturing profitable buy and sell signals. All sector-based EOs reported negative losses ranging from −10% for the Renewable and Alternative Energy index to −163% for the Energy Efficiency index. Average returns for global-based ETs and EOs mostly worsened, with the exception of MSCI Global Alternative Energy which had an average gain of 39.57%, risk of 50.53%. This resulted in a positive Sharpe value of 0.77, with however a Sharpe per trade 0.08.
6. Discussion of Results and Policy Implications
The MSCI Global Alternative Energy index, which includes developed and emerging market large, mid, and small cap companies that derive 50% or more of their revenues from products and services in Alternative energy, witnessed superior adjusted risk-based return performance in momentum, trends, and volatility-based models. At first glance, this suggests that sustainable investments perform better than global stock market and oil-based equity investments. These findings are in line with existing literature where the MSCI’s 2021 Global Institutional Investor Survey reported an inflow of funds for ESG-based funds as opposed to non-ESG equity funds. The superior performance accompanied with the heightened risk in the MSCI global alternative energy index relative to traditional equity market indices is also in line with earlier studies which support that ESG risks can be rewarded with higher returns [
45]. The performance of EO Europe is consistent with existing literature where an analysis of 1452 firms from 16 different European countries reported that companies with better ESG performance show better returns [
48].
However, with the exception of EO Europe as a regional EO under volatility-based information, and EO Renewable and Alternative Energy as a sector EO, other EOs performed poorly. The overall results of this study, supporting the underperformance of other environmental markets indices relative to fossil fuel-based and equity market indices, have some important implications to the investor, investment institutions and government bodies. To the investor, this signals that fossil fuel-based equity investments in indices such as Oil and Gas Exploration and Production industry can still outperform most environmental market indices. This suggest to the investor that the added risks of sustainable equity investments compared to traditional equity investments have not consistently been rewarded. This contradicts previous literature which suggests various investments firms missed out by investment on corporations with negative impact on climate [
5]. This suggests that the lack of investors’ interest is not susceptible to immediately disrupt the business model of industries which rely heavily on fossil-fuels. This is line with previous studies who find that industries linked with energy are positively sensitive to oil price changes [
7,
8,
9]. The superior performance of fossil fuel-based equiy indices in the trading system, where the investor can act on momentum, volatility, and trend information simultaneously, suggests that companies with high carbon footprints can be made responsible for damaging the environment and be subject to financial penalties, but still return a superior risk adjusted return performance to shareholders. It signals to the investment industry that sector- and regional-based EOs and ETs still have to perform consistently overtime to gain further interests from investors.
Further, the performance of fossil fuel-based indices also inform government and regulatory bodies of the need to continue to monitor the impact of crude oil on asset prices. Sector- and regional-based EOs still have to consistently demonstrate better performance over time to attract more governmental green-based investment initiatives globally. Further, the lack of interest in sustainable equity investments, suggest the need for more policy actions from government bodies to gradually shift investments from non-renewable to renewables. Alternatively stated, this means there is a need for states to provide more support and implementation of rigorous actions in favor of greener sustainable investments. For instance, policy actions can be in the form of national-based initiatives which are geared to enhance transparency in the market for sustainable investment products, to prevent greenwashing, and to increase transparency around sustainability claims made by different corporations.
7. Conclusive Remarks
There has been a noticeable increase in global clean energy investments as part of the decarbonization process. Yet, the latest global forum on climate change, the Conference of the Parties to the United Nations Framework Convention on Climate Change (COP27) confirmed that globally, nations are still short of meeting the increased demand for energy services sustainably. Attempts from Europe to reduce its dependence on Russia’s oil, gas, and coal supplies following the Russian-Ukraine crisis, global inflationary pressures, and volatile energy prices, all add to the existing pressures on investors to consider green energy investments, especially in less attractive emerging markets. The present study helps close the gap in the literature, by shedding some light into environmental market indices which have gained increased interest in the last decade. Specifically, this study analyzes the performance of sustainable energy equity investments, with a focus on environmental markets, by assessing the performance of trading strategies which are based on the trend, direction, and volatility of environmental market equity indices; and by comparing how the performance of sustainable equity investments differ from both oil-based and traditional global equity index-based investments.
To assess performance, technical analysis trading strategies capturing market momentum, trends, and volatility information are implemented. This paper assesses each strategy individually and include a scenario, where the trader can make informed decisions based on momentum, trend, or volatility information. Overall findings support that a momentum-based strategy performed best for the MSCI Global Alternative Energy index, with the highest excess return per unit of risk, followed by fossil fuel-based indices. In the same vein, a trend-based strategy worked best for the MSCI Global Alternative Energy and EO 100 indices. Using a volatility-based strategy, the highest Sharpe was observed with EO Europe, followed by the Oil and Gas Exploration and Production industry, and MSCI Global Alternative Energy indices, with most other markets reporting lower or negative Sharpe values. Last but not least, a trader relying simultaneously on momentum, trend or volatility information would benefit from such a strategy with positive returns in the MSCI Global Alternative Energy, S&P Oil and Exploration and Production industry, NYSE Arca Oil, and FTSE 100 indices only, where the later reported the highest Sharpe value, compared to all other strategies. Although the FTSE 100 reported the highest excess return per unit of risk, the MSCI Global Alternative Energy positioned itself among the best three indices when pursuing either momentum, trend, or volatility-based investment strategies. It is also worth mentioning the performance of the S&P Oil and Gas Exploration and Production Industry index, as a fossil fuel-based index, especially when relying on momentum and volatility data in decision making. Except for EO Europe as a regional EO under volatility-based information, and EO Renewable and Alternative Energy as a sector EO, other EOs performed poorly.
In this study, we have assessed the performance of trading strategies based on technical analysis tools such as the Relative Strength Index (RSI), Moving Averages, and Average True Range (ATR), whereas other indicators could have been used such as ADX or MACD. The results obtained by our research can potentially inspire further studies. Our analysis may be extended to investigate the performance of sustainable energy equity investments, with focus on environmental markets during major economic and financial shocks, especially during turbulent time-periods, for example, during global financial crises, COVID-19 pandemic and Russian invasion of Ukraine. Another future area of research could be to analyze the performance of combined portfolio of environmental market equity indices with hedging instruments to protect them against the risks transmitted between sustainable energy equity investments.


 ,
, 


