Article

Experimental Study of Simultaneous Charging and Discharging Process in Thermocline Phase Change Heat Storage System Based on Solar Energy

Key Laboratory of Power Station Energy Transfer Conversion and System, North China Electric Power University, Ministry of Education, Beijing 102206, China
*
Author to whom correspondence should be addressed.
Sustainability 2023, 15(9), 7322; https://doi.org/10.3390/su15097322
Submission received: 6 February 2023 / Revised: 15 March 2023 / Accepted: 21 March 2023 / Published: 28 April 2023

Abstract

:
As a renewable energy power generation method, concentrating solar power generation has a broad application prospect. Weather and fluctuation significantly affect the output power of concentrating solar power generation. A heat storage system can stabilize this fluctuation and generate continuous and stable power. Therefore, the research on heat storage systems is of great significance to the development of concentrating solar power generation. This paper mainly studies the operating characteristics of the heat storage system based on solar energy in simultaneous charging, the influence in the change in solar radiation intensity on the charging power and the discharging outlet temperature, and the feasibility of the heat storage tank as an inertial link to stabilize the fluctuation in solar energy and the discharging outlet temperature. In this study, an experimental system for heat storage was established, in which solar energy was used as the heat source, water was used as the heat transfer fluid, and paraffin was used as the phase change heat storage material. When the initial temperature is 50 °C and the charging flow rate is maintained at 0.7 m3/h, at the same time the discharging flow rate is 0.1 m3/h, 0.3 m3/h, and 0.5 m3/h, respectively. The results show that when the solar radiation intensity is lower than 548 W/m2, the curve of heat storage power is almost parallel to the curve of solar radiation intensity; when the solar radiation intensity is lower than 535 W/m2, the moving direction of the thermocline will change; the average discharging outlet temperature in each case is higher than the phase change temperature of the phase change material and this system can continuously supply hot water at more than 69 °C for more than 3 h 32 min; and increasing the discharging flow rate will increase the whole charging and discharging time, thicken the thermocline, and disturb the temperature field in the tank. The experimental analysis will be conducive to profoundly understanding the operation characteristics of the thermocline heat storage tank under the solar heat source and has reference value for the subsequent design of a more efficient heat storage system.

1. Introduction

Thermal energy storage (TES) has a lower cost compared with other storage methods, and the storage method can be used in the power generation process to avoid a reduction in energy grade brought about by converting electricity into other forms of energy storage; so, it is widely used in concentrating solar power (CSP) plants to achieve stable and continuous power generation [1]. Sensible heat storage technology is simple and mature. However, the heat storage density is low, the system volume is large, the heat loss is high, and the temperature changes continuously during the heat exchange process of a sensible heat system, which is not conducive to controlling system temperature and the effective utilization of heat energy. Phase change thermal storage has an almost constant temperature and higher heat storage density when the phase change occurs, which is conducive to controlling system temperature and load mutual coordination and has broad application prospects in solar thermal power generation and other industrial applications.
Compared with dual-tank thermal storage, single-tank thermal storage systems use natural stratification triggered by the temperature difference, which is called the thermocline, to store both hot and cold media in the same thermal storage tank, significantly reducing the amount of heat transfer mass, floor space, and equipment cost, which has obvious advantages [2] and has received wide attention in recent years [3,4,5,6,7]. According to the different requirements of heat storage temperature, the heat transfer medium mainly includes molten salt, heat transfer oil, and water.
Considering the broad research and development prospect of combining thermocline tanks with phase change thermal storage, many researchers have conducted in-depth experimental studies and numerical simulations [8,9,10]. In order to improve the overall heat transfer performance and prevent leakage, there are two primary schemes for arranging phase change materials in single-tank thermal storage: using phase change heat storage components and phase change capsules in a packed bed. The research on heat storage using phase change heat storage components is mainly carried out by Cabeza et al. [11] from the University of Lleida in Spain. They use sodium acetate trihydrate–graphite with a phase change temperature of 58 °C as a composite phase change material (PCM), encapsulate it in some aluminum bottle containers, and arrange it on top of the heat storage tank. The experimental results show that the phase change heat storage component can significantly improve the system’s heat storage density and the temperature characteristics of charging and discharging. However, it does not help to improve the tank’s temperature stratification effect. Another commonly used encapsulation method is the spherical capsule technique, in which metallic materials with high thermal conductivity, such as stainless steel and aluminum, wrap around the exterior of the PCM [12,13]. Oró et al. [14] prepared the organic phase change material PK6 into a phase change capsule with a diameter of 3.6 mm and arranged it in a packed bed with a diameter of 100 mm and a height of 500 mm. Through experiments, it is found that using phase change materials in a packed bed can enhance the temperature stratification effect during heat release, but it has no effect on the heat storage process. Kuma et al. [15] obtained different conclusions. The phase change material they used was OM48, which was prepared into a phase change spherical capsule with a diameter of 75 mm; it also accumulated in a hot water tank with a diameter of 400 mm and a height of 1000 mm in the form of a packed bed. They believe that when the inlet temperature of the heat storage is low, the phase change material causes no improvement in the temperature stratification effect in the tank, regardless of the charging or discharging process. With an increase in the heat storage temperature, the temperature difference between it and the phase change temperature increases, and the effect of the phase change material on improving the temperature stratification effect is enhanced.
Solar energy is a widely distributed, easy access and renewable energy source, which can be used in heating and has a great advantage in the economy. Therefore, the heat storage method with solar energy as the heat source has a good application prospect. However, in the process of practical application, due to solar energy’s volatility, it has an impact on the stability of the operation. When the solar radiation is low, the change in the charging inlet temperature may lead to the thickening of the thermocline, thus reducing the heat storage efficiency of the heat storage tank. For the heat storage system with solar energy as the heat source, most of the studies simulated the fluctuation in solar energy by changing the inlet temperature, flow rate, or heat flow boundary through CFD or the one-dimensional discrete model of Matlab [16,17,18,19]. Galione [20] et al. compare the dependence of the storage capacity on the PCM’s temperatures and the total energy and exergy stored/released, as well as the efficiencies of the storing process in the different thermocline, single PCM, cascaded PCM, and the proposed multi-layered solid-PCM configurations. Zhao et al. [21] researched the influences of different charge and discharge switching temperatures on the performance of TES systems with different configurations of the packed bed and the effects of different levels of serious charges on the daily operation of a low-temperature molten salt pump and a 100 MW conventional CSP tower plant. Liao et al. [22] investigated the packed bed systems of rocks only and rock/PCM capsule combination, simulated both the fully charging/discharging processes and the cyclic process, and concluded that the fully charging/discharging operations could not be adopted in most practical applications, and the cut-off temperatures have a significant influence on the charging efficiency and the capacity ratio. Elfeky [23,24] investigated six different multi-layer TES tank configurations, including the influence of different charge/discharge switching temperatures on the dynamic performance of the thermocline tank, and compared the charge/discharge time, temperature distribution of the molten salt, the recovered energy, the total efficiency, the capacity rate, and the utilization rate of all six of the configurations for three different stages. ELSihy et al. proposed a transient two-dimensional model and analyzed the influences of the diameter of the spherical PCM capsules and the HTF inlet flow rate on the discharging performance and the thermocline thickness of different molten salt packed bed TES systems [25], investigated the influences of volume fraction of PCM on dynamic performance for multi-layer TES tanks, and then found the highest performance configuration [26].
However, their methods in these studies cannot correspond to the change in actual solar radiation; so, we created a heat storage experimental system using solar energy as the heat source to study what the change in the solar radiation effect on the temperature field in this system does, what the change in the discharging flow rate effect is, and how to improve the design of the system. The purpose of this study is to explore the solar radiation intensity when the moving direction of the thermocline in the tank changes, how to adjust the charging/discharging flow rate to improve the charging and discharging efficiency, and the feasibility of providing stable temperature hot water when the heat storage system participates in the heating supply. Therefore, this paper will study the changes in temperature distribution, the temperature of the discharging outlet, charging, and discharging power of the packed bed TES tank under the condition of the simultaneous charging and discharging process (which uses solar energy as the heat source, paraffin wax as the phase change heat storage material, and water as the HTF), and the influence of the discharging flow rate and solar radiation intensity on dynamic characteristics.

2. Experimentation

2.1. Experimental System

The experimental system was modified from the one used in Reference [27]. As shown in Figure 1, the experimental system mainly comprised a charging and discharging loop. The solar collectors were used as the heat source to heat the recharge water or the cold water coming from the bottom of the tank, and the chilling water (running water) was used as the cold source of the discharging loop. The tank’s inner diameter was 0.9 m, the height was 1.1 m, and the total capacity, including the conical bottom, was about 0.75 m3. The hot water and cold water inlet and outlet were above and below the TES tank. To support the paraffin wax capsules, an orifice plate made of stainless steel was fixed at the bottom of the tank, and the PCM capsules were heaped up stochastically until the upper part of the tank formed an encapsulated PCM packed bed.
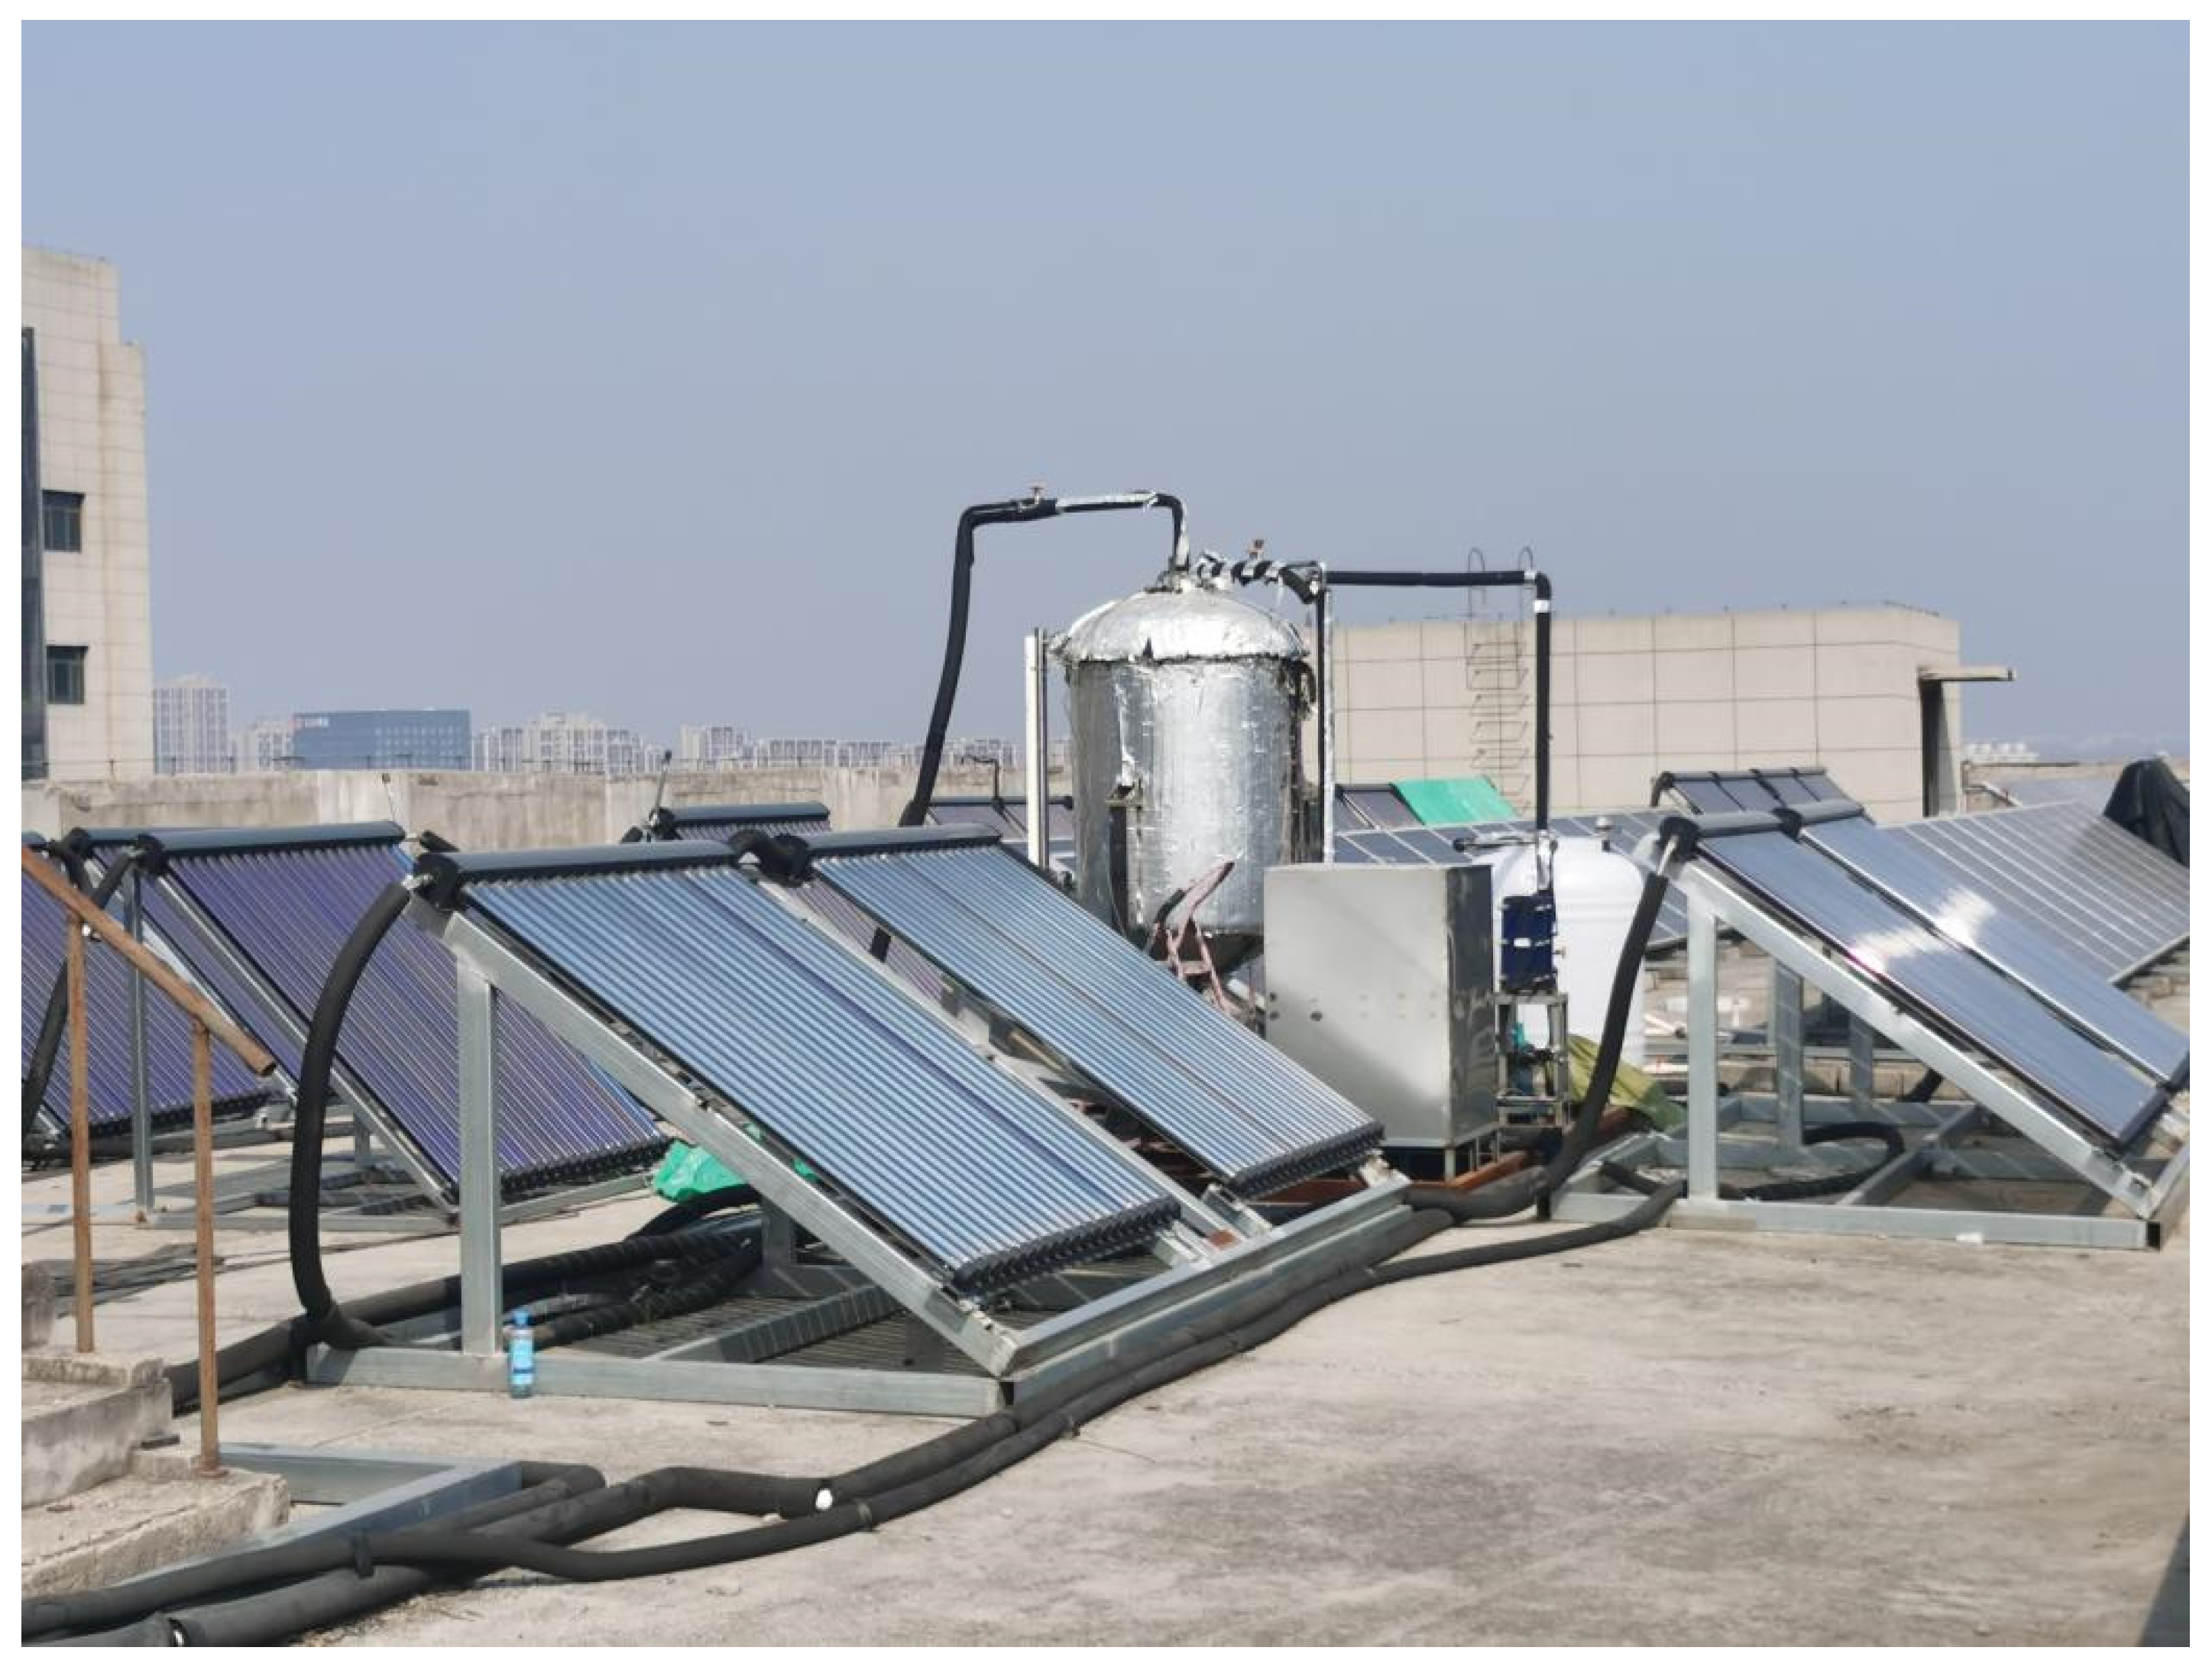
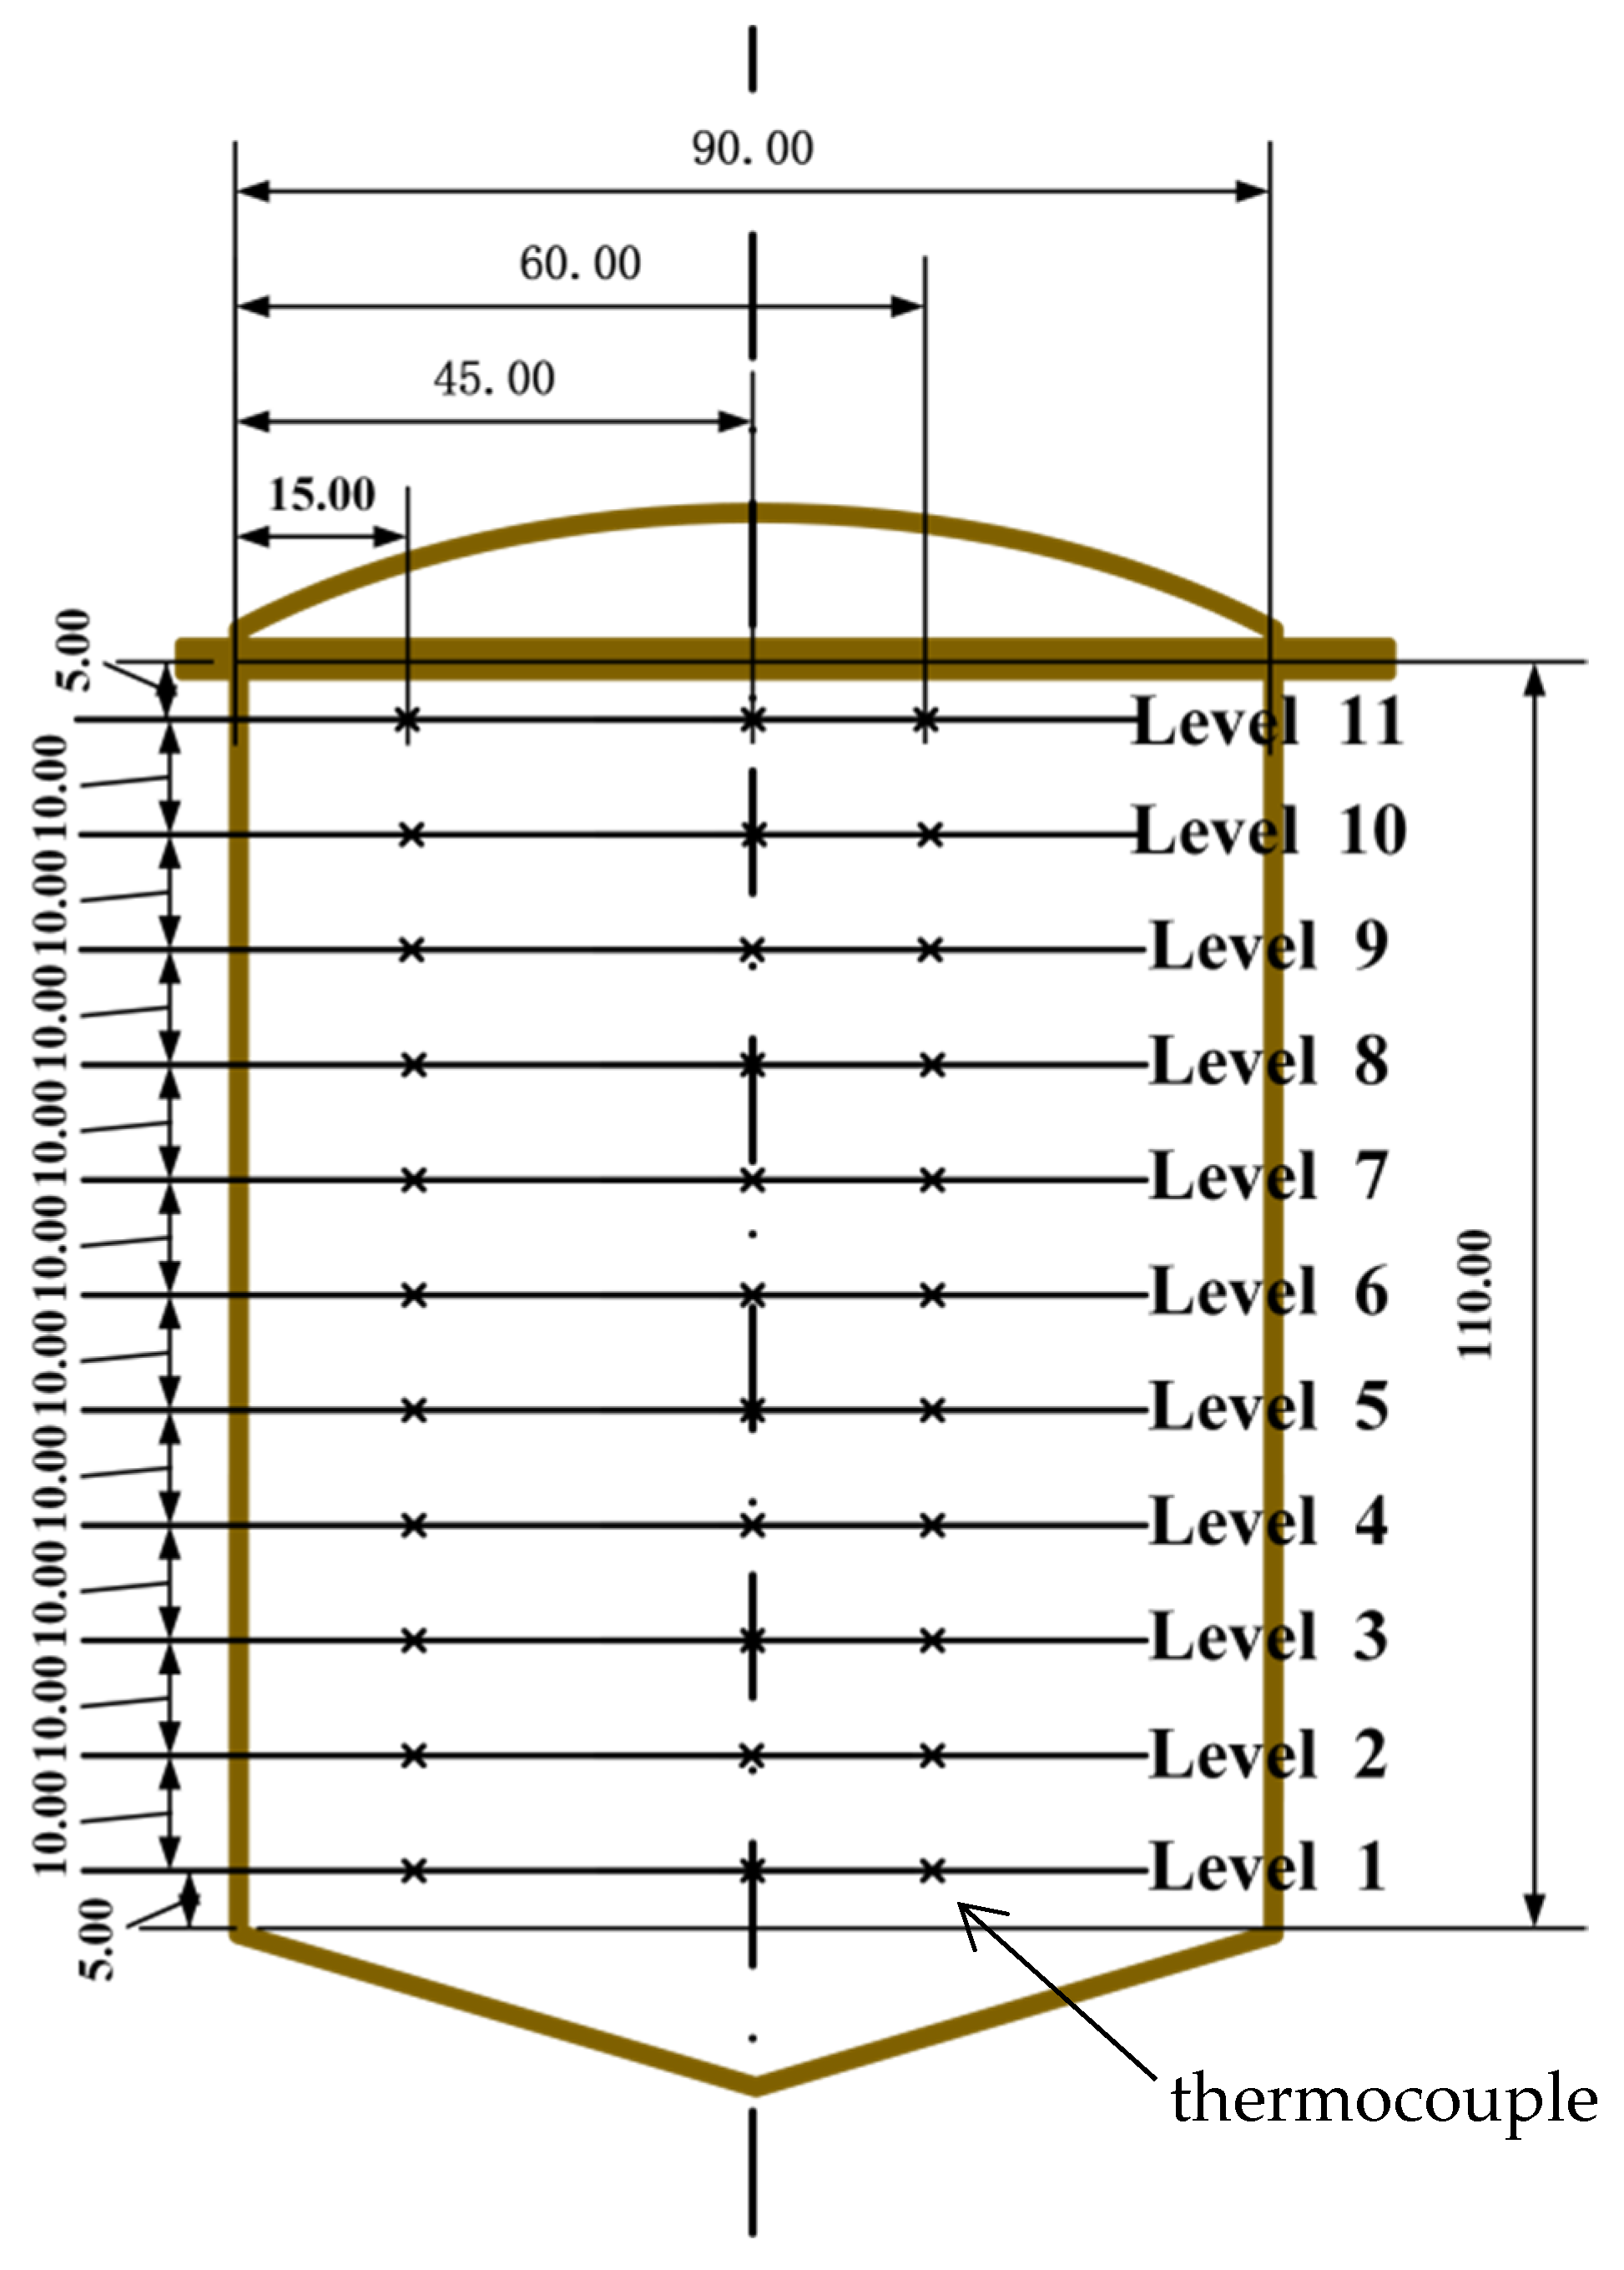
The actual view of the experimental system is shown in Figure 2. The vacuum tubular collector was used as the solar collector with a sunlight area of 75 m2. The solar radiation intensity was measured by the solar total radiation sensor and recorded every 10 min, with an error of ±50 W/m2. The error of the flow meter was ±0.01 m3/h. The temperature field inside the tank and the six key positions outside the tank were measured by the T-type thermocouples with errors of ±0.5 °C. As shown in Figure 3, the thermocouples in the TES tank were set up at different heights, which were divided into 11 levels with three measuring points in each level. In addition, there were six thermocouples to measure the inlet and outlet temperatures of the charging and discharging loop and the cooling water. The data acquisition instrument (Keysight 34970A, Keysight Technologies, Inc., Santa Rosa, CA, USA) automatically recorded all temperature data every 10 s [27]. In order to reduce dissipation loss, the whole TES system, including the tank and pipelines, was covered with foam rubber as insulation whose thickness was 35 mm and thermal conductivity was 0.034 W/(m·K). The insulation effect met the experimental requirements through the experimental verification in Reference [27].
Compared with the previous experimental system, the heat exchanger and steam generator of the charging loop were replaced by the solar collector so that the cold water was heated by the solar collector and directly entered the heat storage tank. Due to the long pipeline in the solar collector area and the considerable resistance, a pump was added at the entrance of the TES tank to prevent the pump pressure from being insufficient. There was no change in the discharging loop.
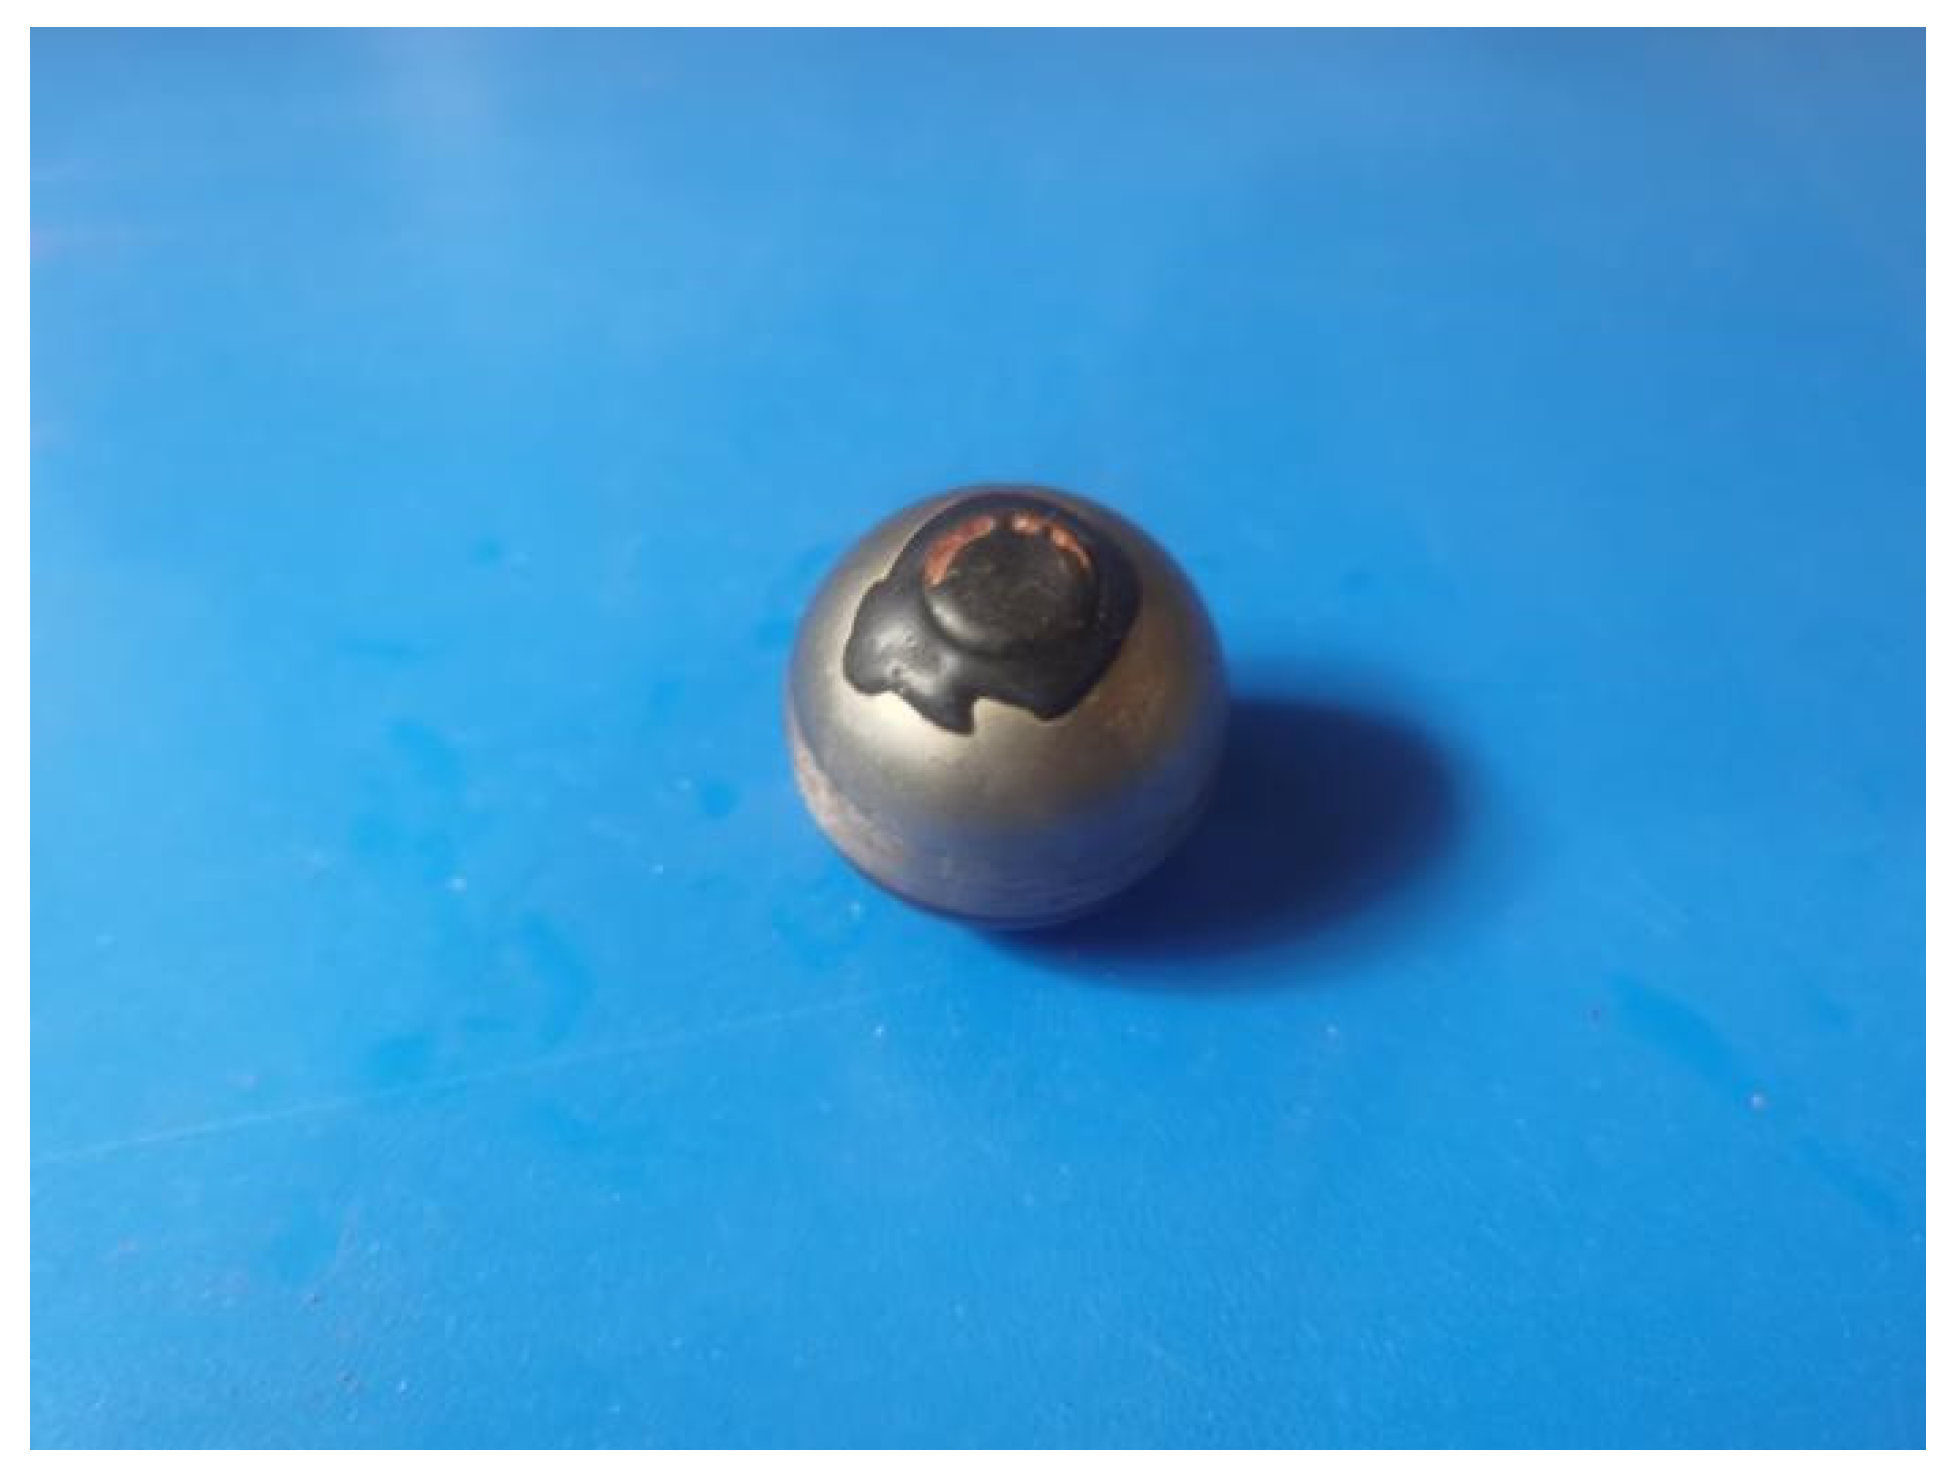
In this study, water was used as the HTF and secondary heat storage medium, while the primary heat storage medium was encapsulated paraffin capsules. The shapes of the PCM capsules were spherical, and the shells of the PCM capsules were formed by stamping and welding stainless steel. The photo of the encapsulated PCM capsule is shown in Figure 4. The physical properties of PCM and the design parameters of PCM capsules are shown in Table 1. The PCM packed bed tank contains 9170 PCM capsules in all.

2.2. Experimental Operating Conditions and Research Parameters

In this study, three simultaneous charging and discharging experiments were carried out. At the beginning of each experiment, the TES tank was in the fully discharged state, and the temperature in the tank was uniformly maintained at Tini. The changes in solar radiation intensity and charging power were compared, and the variation rule of solar radiation intensity and TC,in was revealed. The dynamic characteristics of the TES tank under different discharging flow rates (QV,D) were analyzed. At the beginning of the experiments, the Tini in the TES tank was 50 °C. The charging flow rate (QV,C) was 0.7 m3/h, the chilling water flow rate (QV,CW) was 0.25 m3/h, and the QV,D was 0.1 m3/h, 0.3 m3/h, and 0.5 m3/h, respectively. The parameter values and details related to the experimental conditions are shown in Table 2.
The charging power can be calculated by
P C = ρ w c w ( T C , i n T C , o u t ) Q V , C 3600
where ρw is 980.45 kg/m3 and cw is 4.183 kJ/(kg·K).
The utilization rate (UR) was introduced to analyze the performance of the TES tank under different experimental conditions, and it can be calculated according to Equations (2)–(5):
U R = i = 1 i = n 1 | T i n , i T o u t , i | c p , w Q v ρ w Δ τ E w + E p + E s s
E w = M w c w ( T max , i n T i n i )
E p = M p [ c p , s ( 67 ° C T i n i ) + Δ h + c p , l ( T max , i n 69 ° C ) ]
E s s = M s s c s s ( T max , i n T i n i )
Actually, the UR is the ratio of actual heat storage to theoretical total heat storage, which is based on the first law of thermodynamics, reflecting the heat storage efficiency of the TES tank.
The parameter errors involved in this paper are shown in Table 3. The uncertainty of indirectly measured parameters such as charging power and utilization rate can be calculated according to the error propagation formula of Formula (6).
σ ( F ) = j = 1 m ( F x j σ x j ) 2
where σ is the absolute error, xj is the directly measured physical quantity, and F is an indirectly measured physical quantity calculated by m directly measured physical quantities, which can be expressed as follows:
F = f ( x 1 , x 2 , , x m )

3. Results with Analysis

In view of this experimental system being reformed from the experimental system in the literature [27] and the stable heat source being replaced by a solar energy heat source, the results and conclusions of this experiment will also differ.

3.1. The Variation Rules of Charging Power and Solar Radiation Intensity

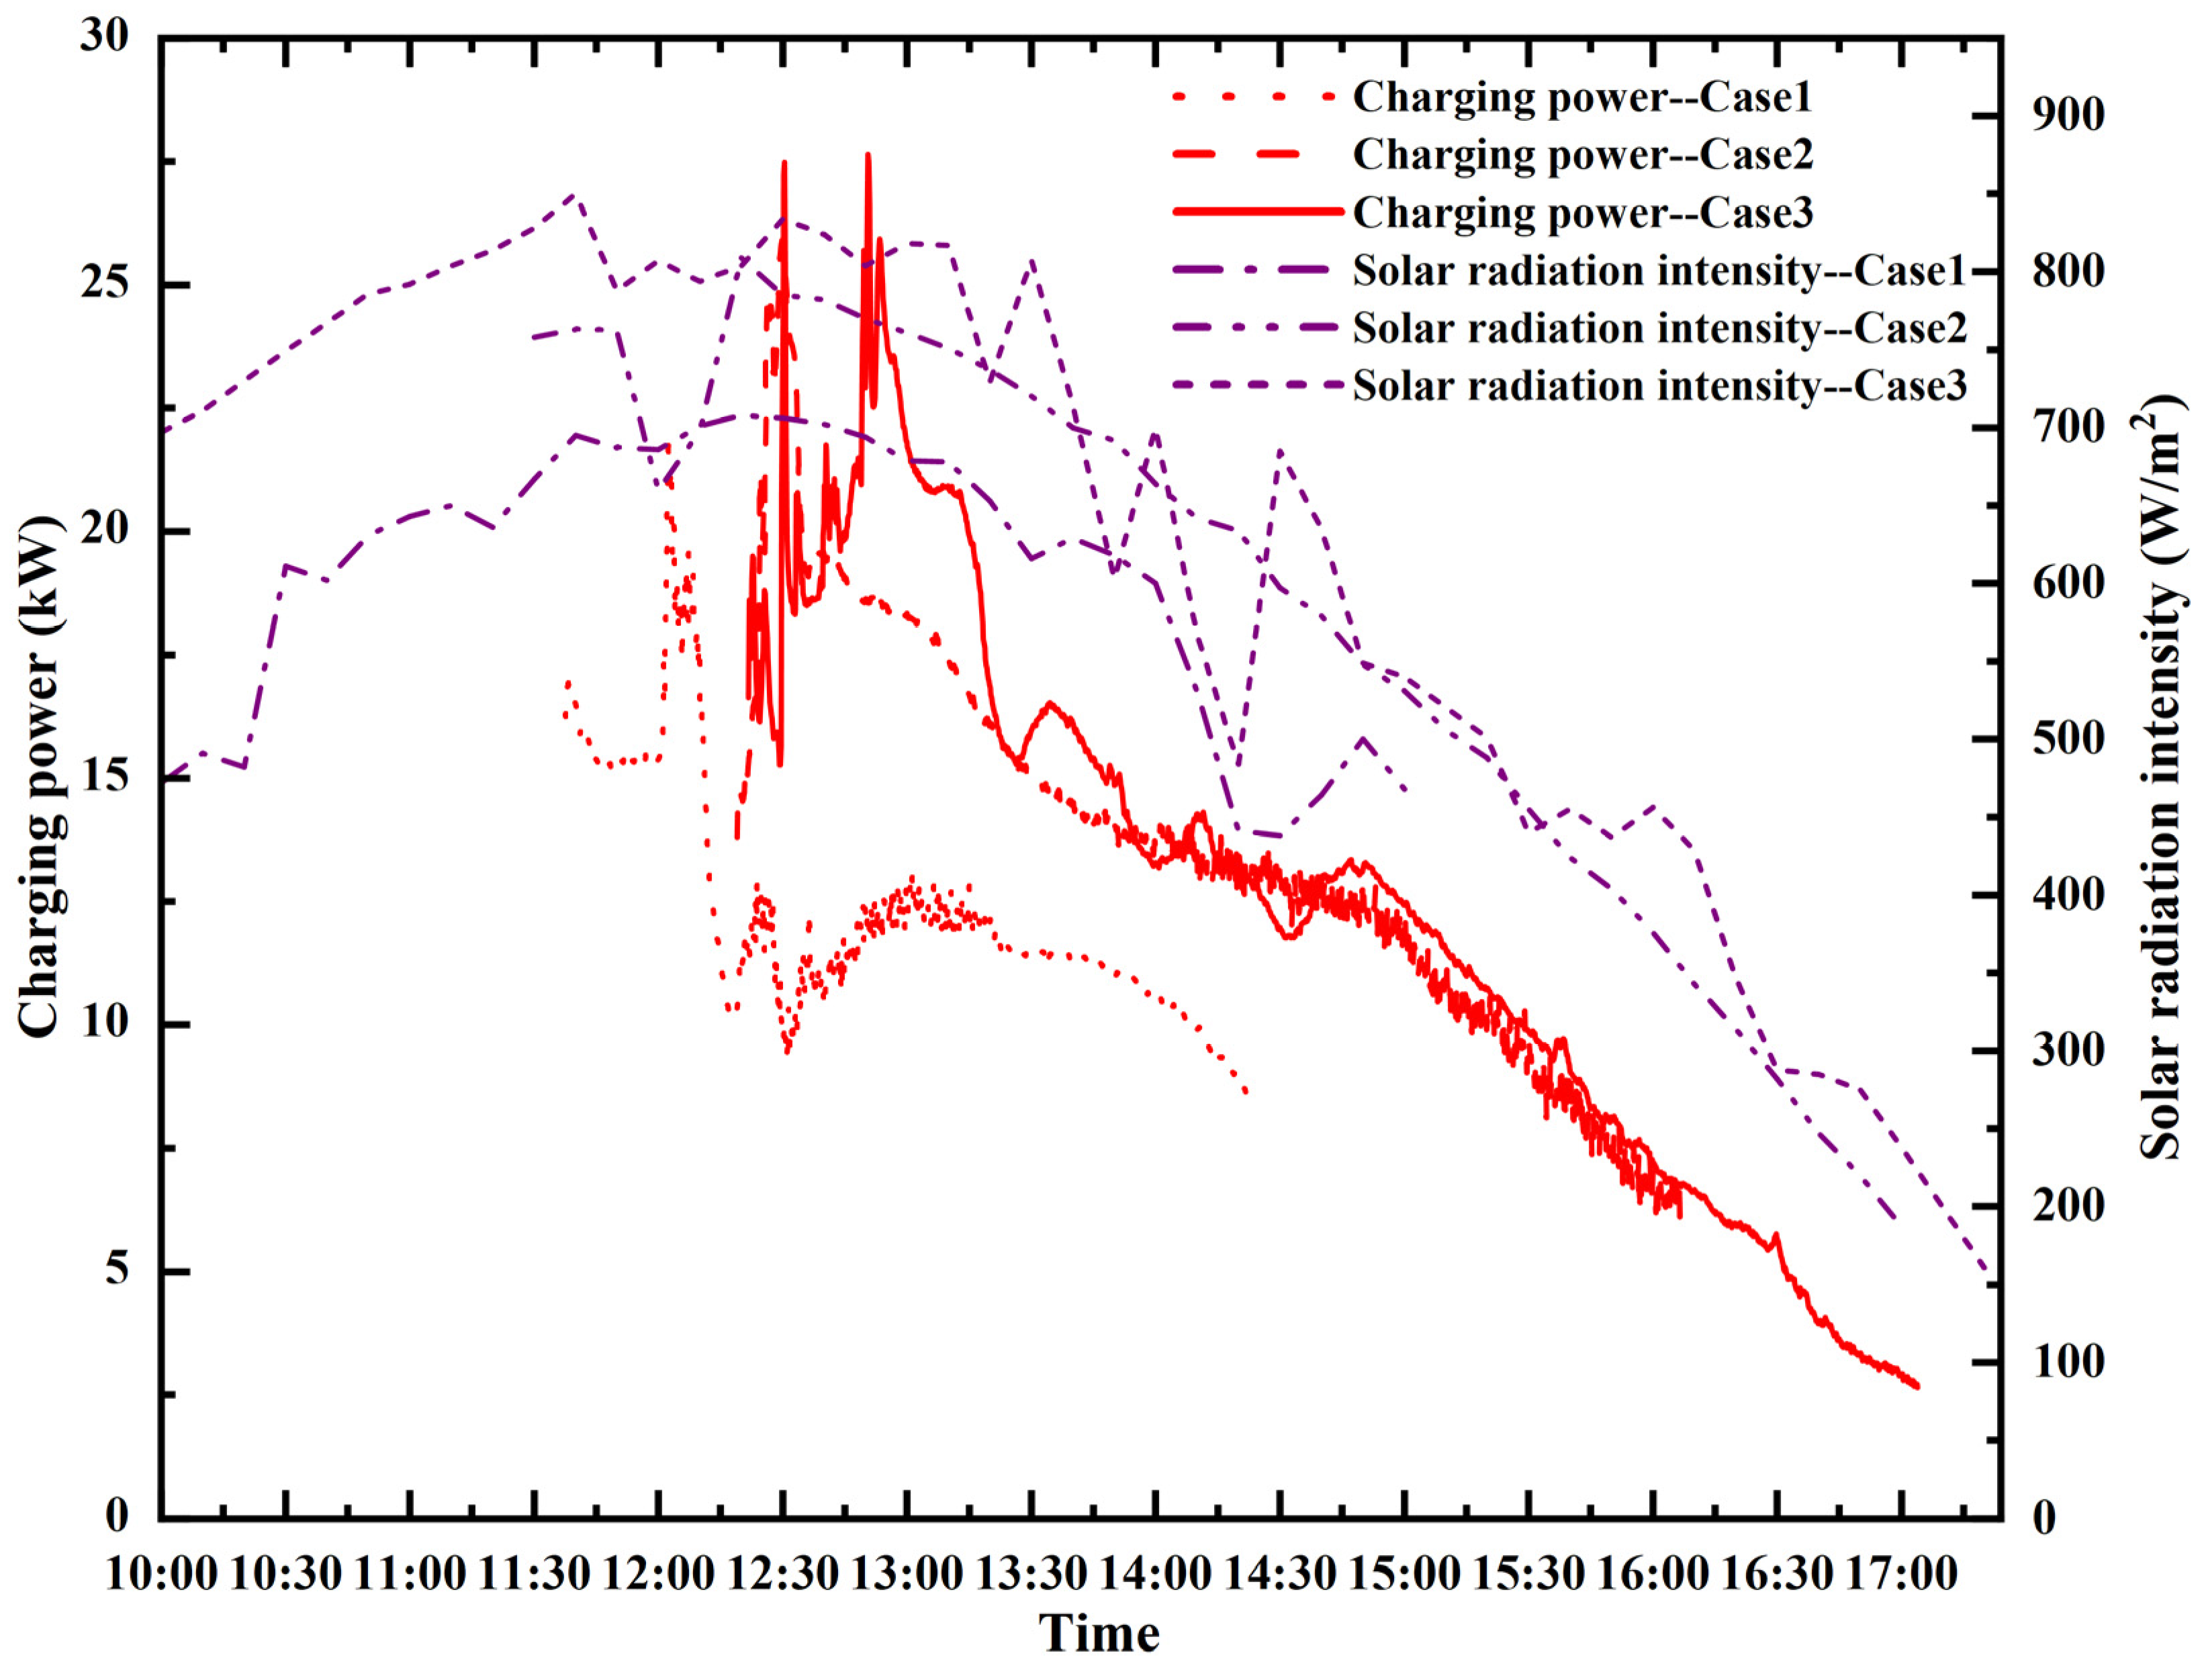
In light of the collected experimental data, a line chart was drawn as shown in Figure 5, in which the time is Beijing time (GMT+8), the solar radiation intensity is recorded every 10 min, and since the thermocouple is recorded every 10 s, the charging power is also changed every 10 s.
From Figure 5, the solar radiation intensities in all experiments peak at 11:40–13:00, and the trend of solar radiation intensity with time is similar every day. The charging power reaches a peak within 1 h after the start of each experiment, and then there is a sharp decrease. This is different from the variation rule of the TES system with a stable heat source in Reference [27]. The charging power and discharging power in these experiments will not become balanced at the end.
The reason for this difference may be the difference in the beginning time of discharging and the variation in TC,in. To ensure stable discharging, the discharging loop is opened when the temperature of Level 11 reaches 67 °C. When the discharging loop starts, the TD,in is lower than the TC,out; then, the cold water from the discharging loop will cool down the water at the bottom of the heat storage tank and make the TC,inTC,out become higher, as well as increase the charging power. Finally, it turns into the peak in Figure 5. When the temperature of Level 1 rises to 67 °C or the temperature difference between the inlet and outlet of the collector is less than 5 °C, the simultaneous charging and discharging process ends.
From Figure 5, we can see that except for case 1, the decreased rates of solar radiation intensity and charging power are similar after the time of 14:50 in case 2 and case 3. Additionally, the solar radiation intensity corresponding to this time in case 2 and case 3 is 548 W/m2 and 549 W/m2, respectively.
After the discharging loop is turned on for a period of time, due to the solar radiation intensity gradually becoming lower, the charging power also becomes smaller, and it will not reach a balance, similarly to the experiment with a stable heat source.
From the above analysis, the variation rules of the charging power in the TES system with solar energy as the heat source differ from that of the TES system with a stable heat source. Because the solar radiation intensity values of each experiment are not precisely the same, it is impossible to study the influence of parameters such as QV,C or QV,D on charging power by controlling variables.

3.2. The Influence of QV,D on the Average Temperature of Different Heights in the TES Tank

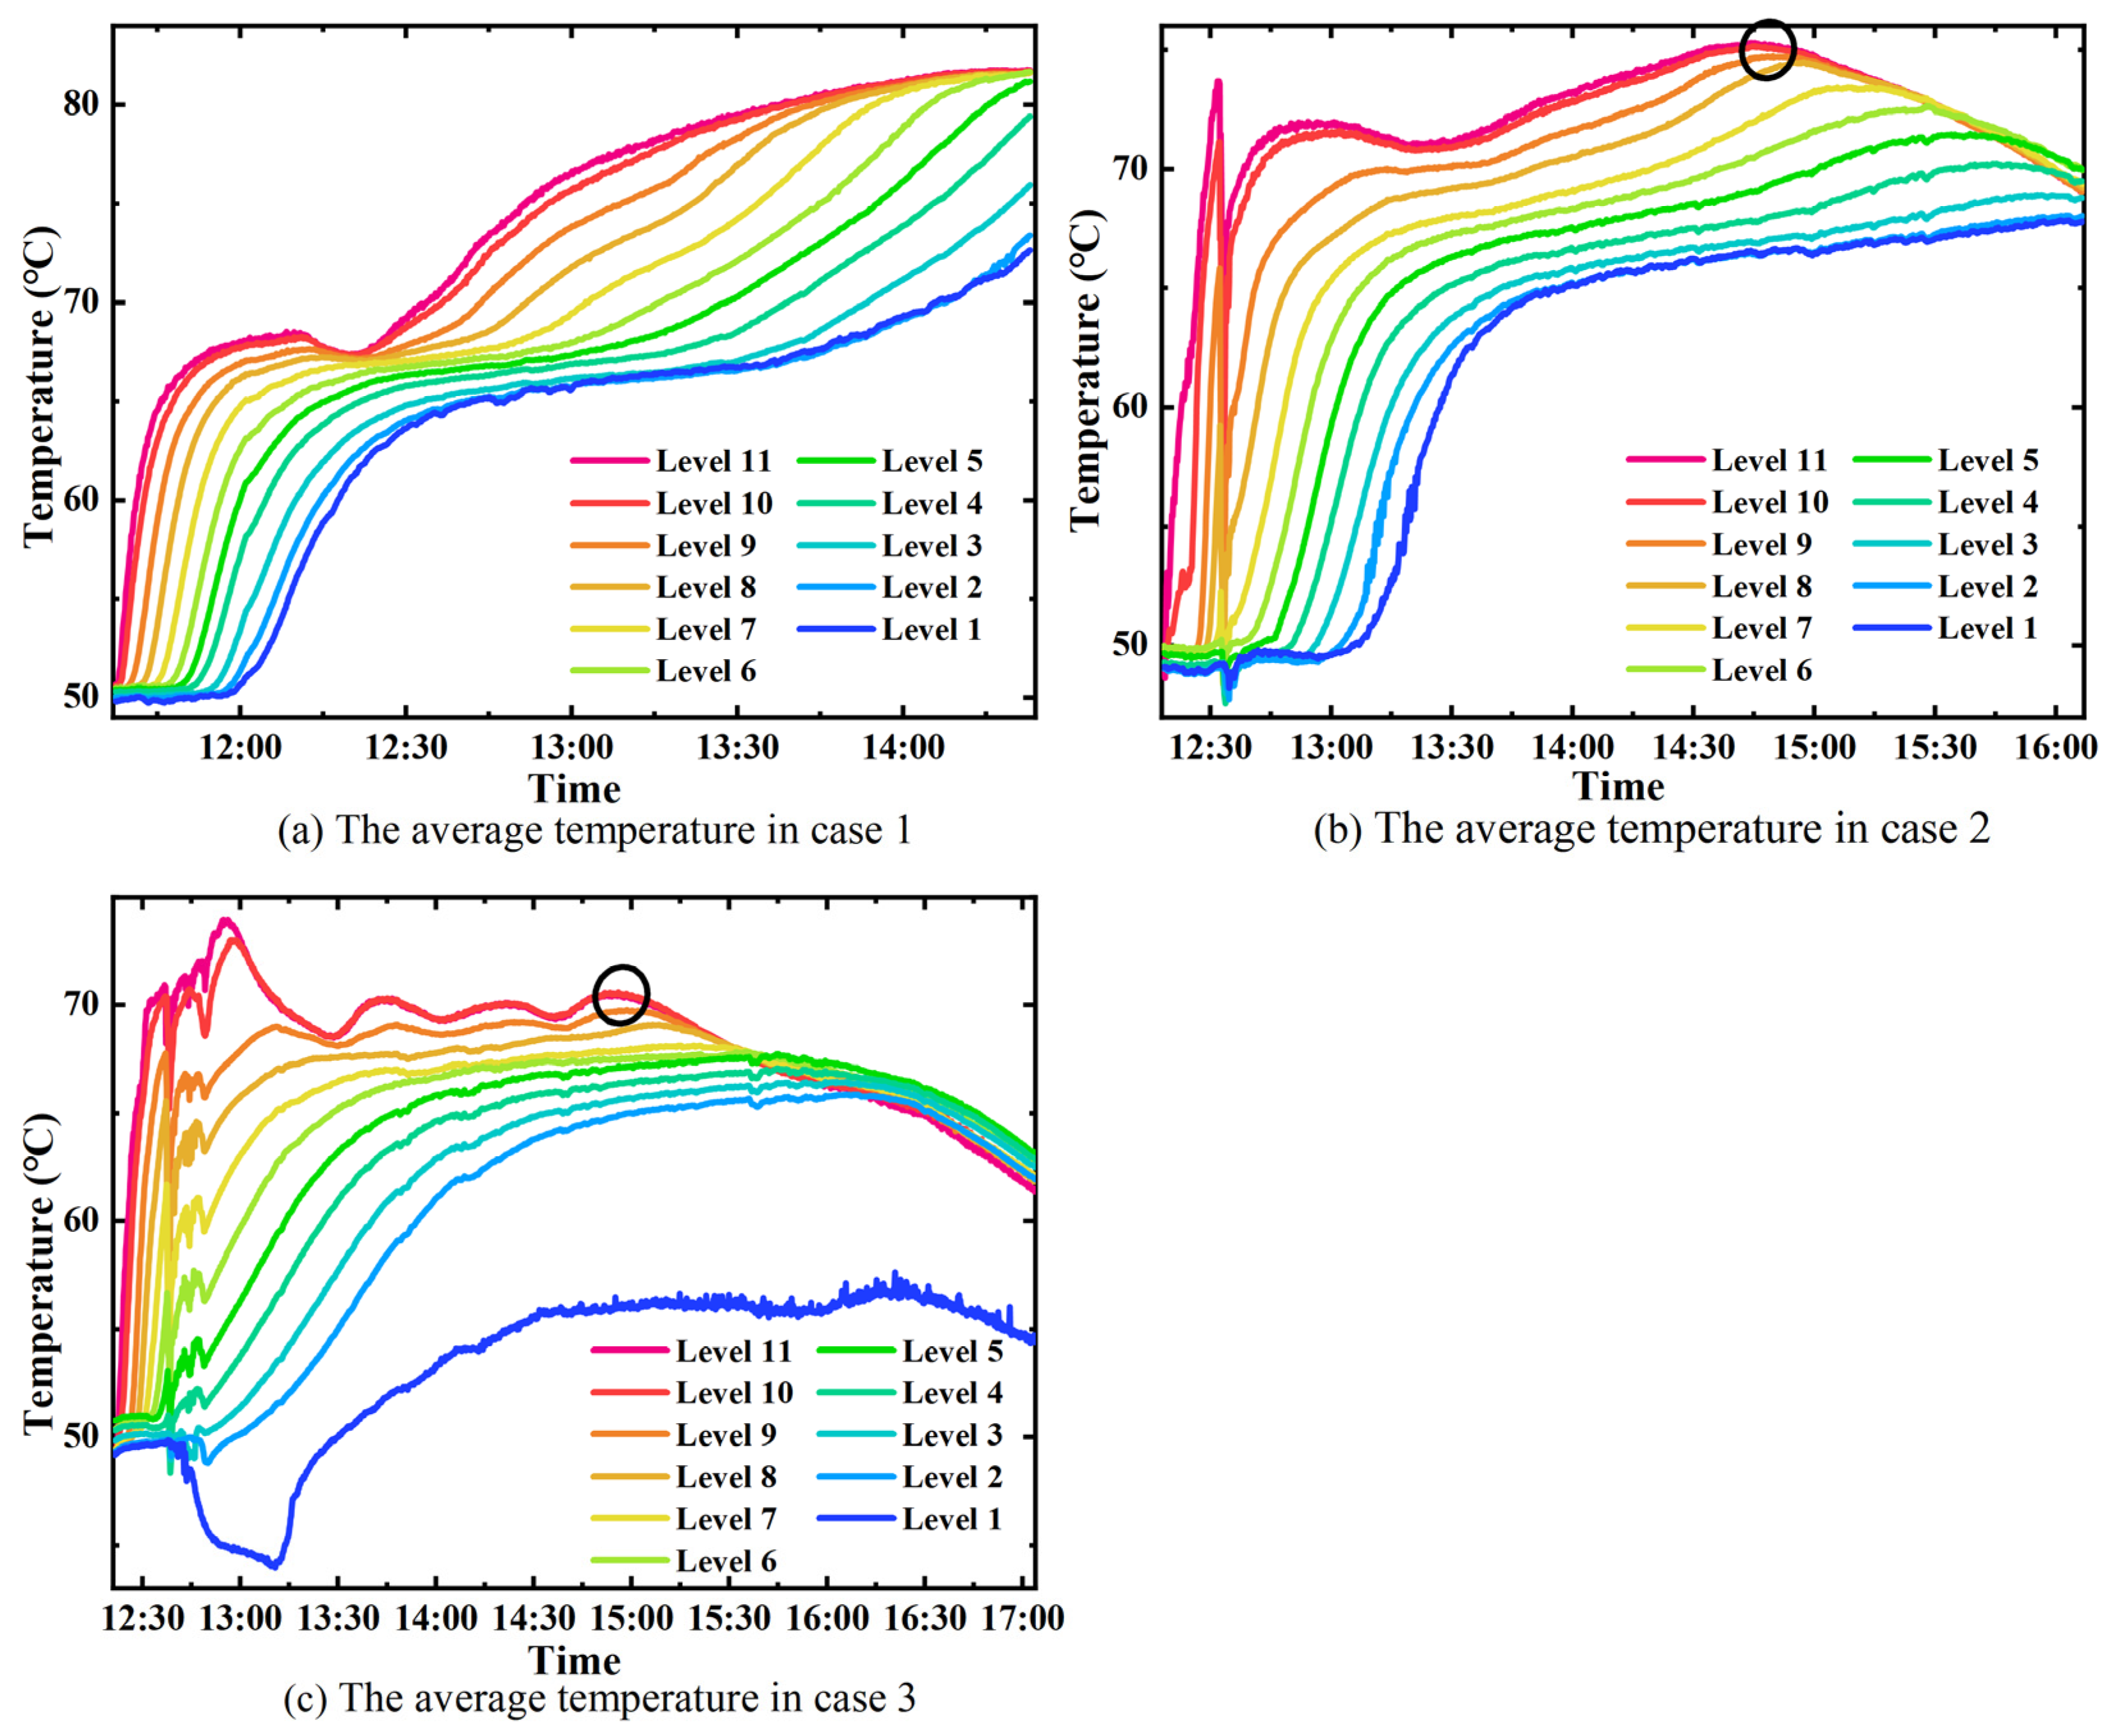
In order to study the difference in the temperature distribution of the TES system under different discharging flow rates and the influence of the discharging flow rate on the evolution of the thermocline, the result data of the experimental case 1, 2, and 3 in Table 2 are sorted out as Figure 6 and Figure 7. From the experimental data, the temperature difference measured by the three thermocouples on each level is tiny, and so the average value can be taken to simplify the image.
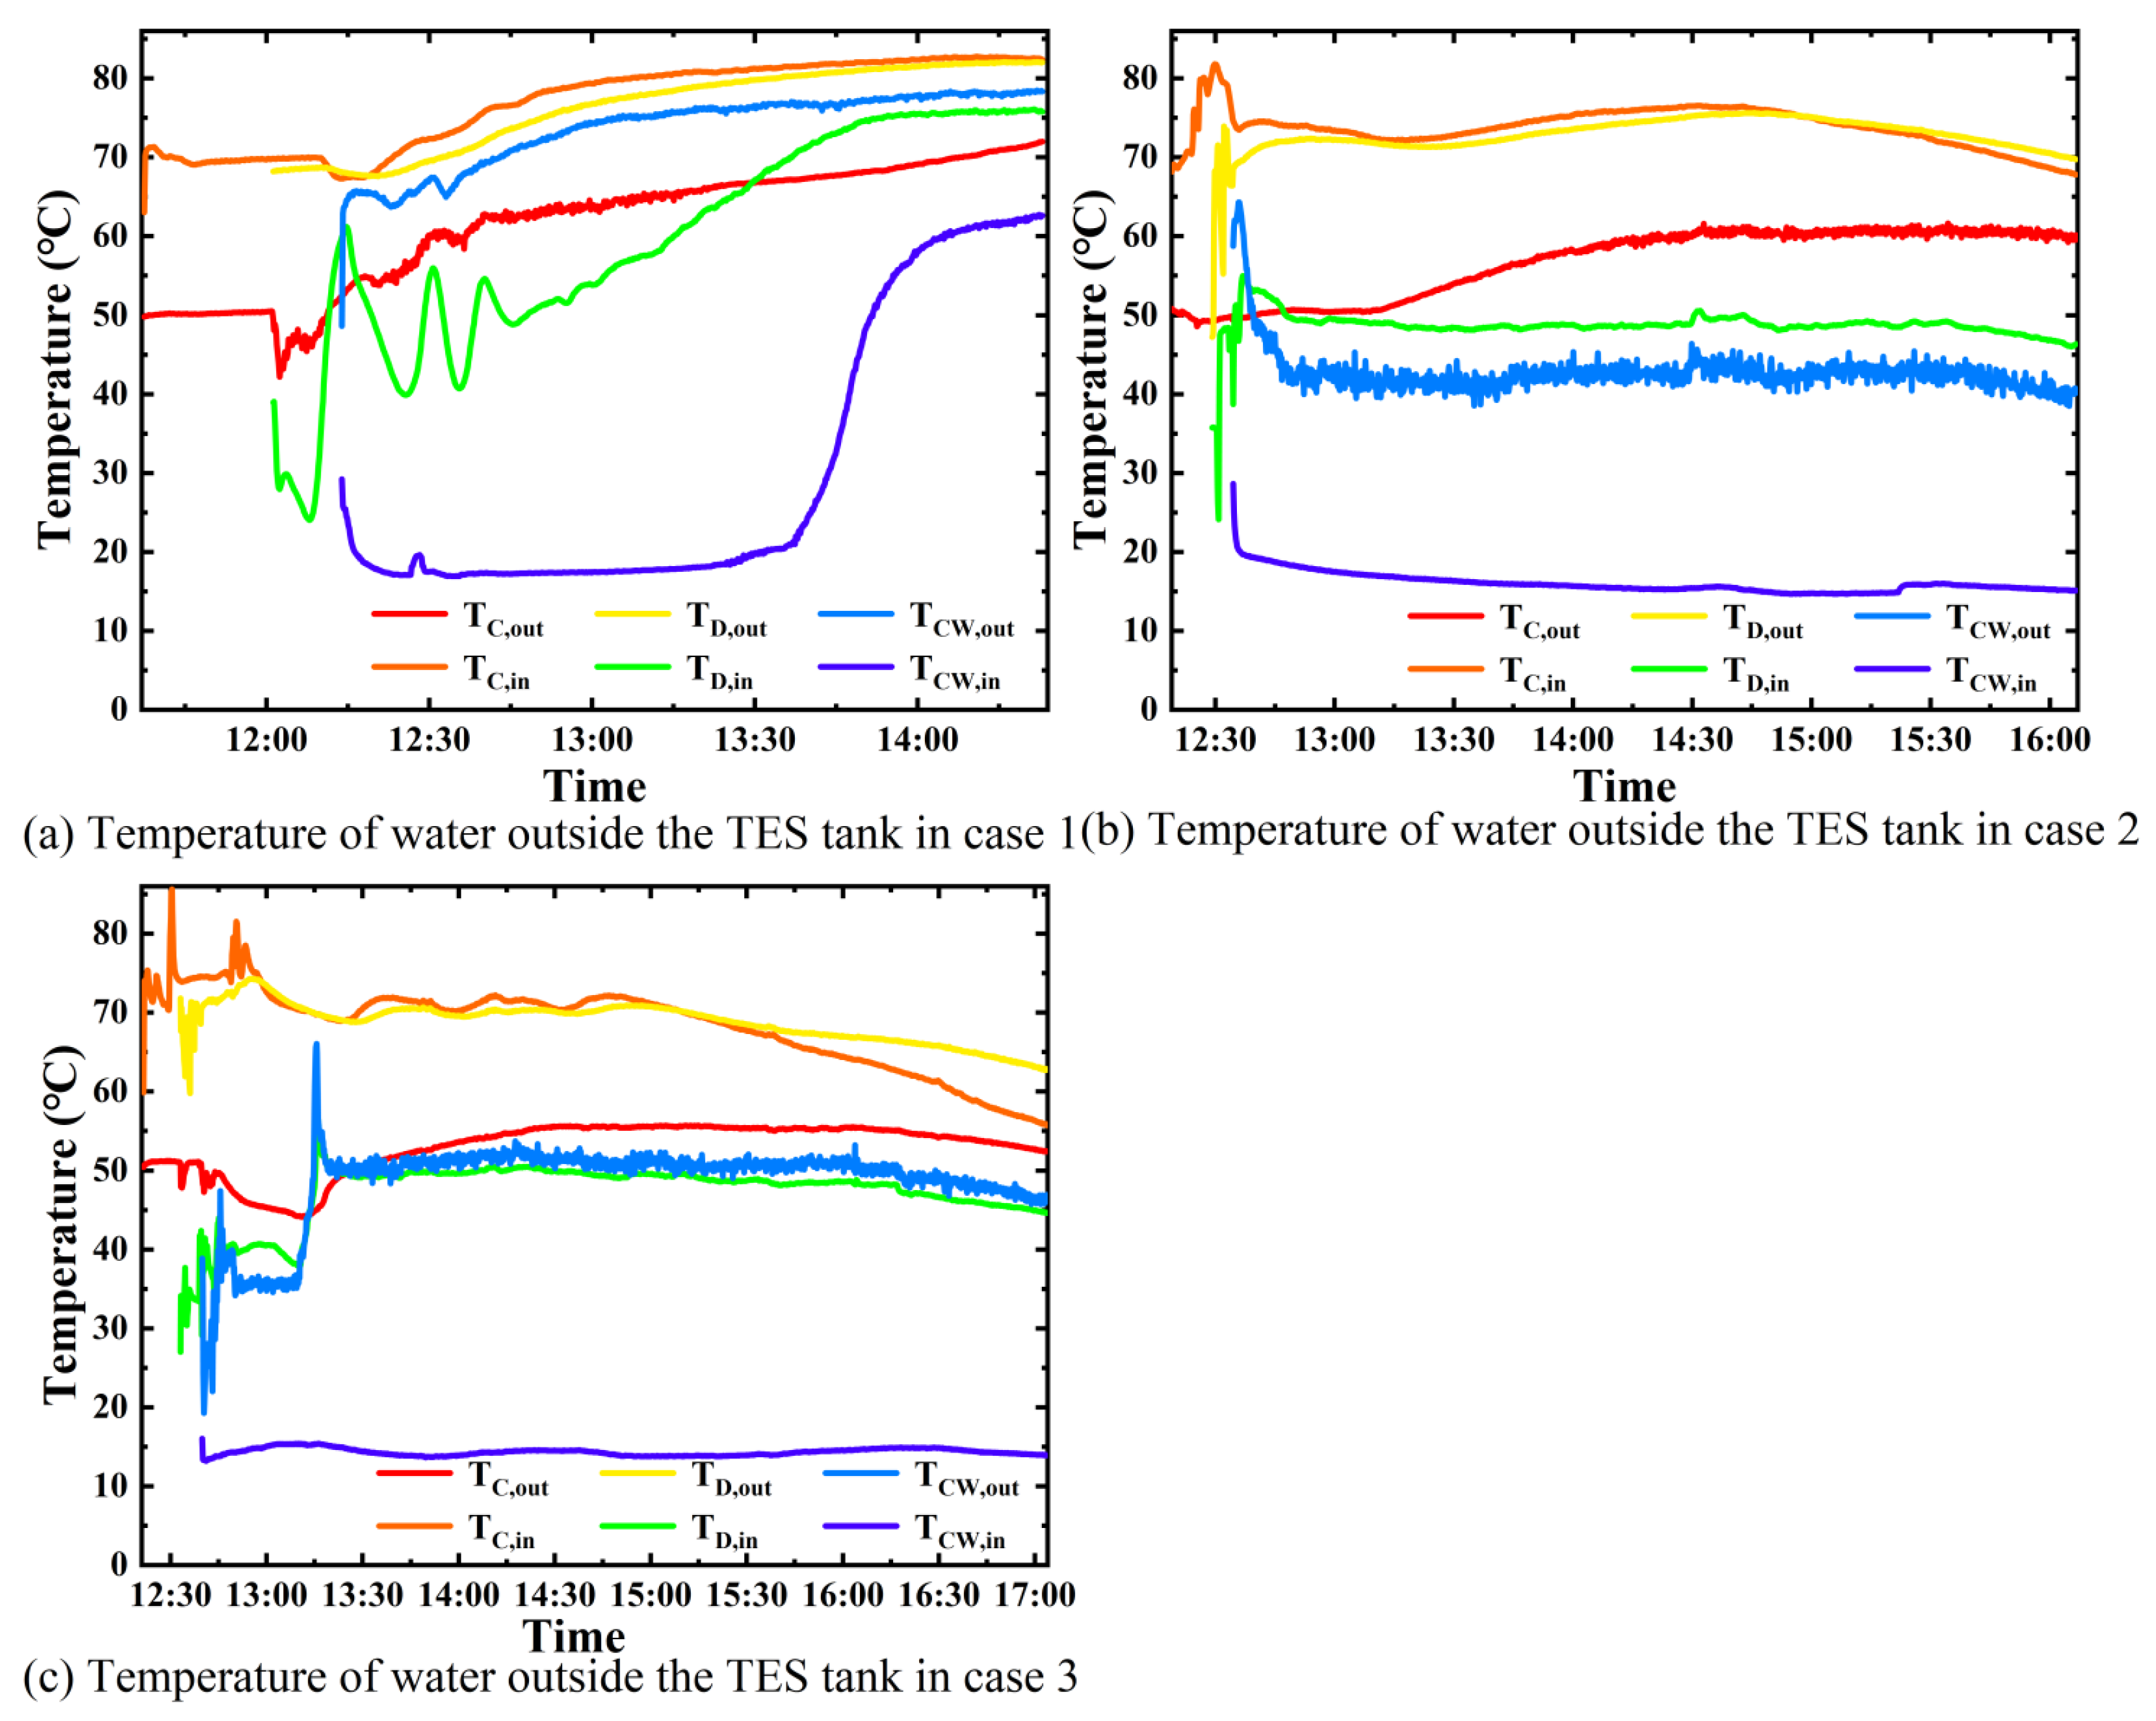
It can be seen from the three line charts in Figure 6 that the discharging flow rate has two main effects on the temperature distribution in the TES tank: one is the temperature distribution range, and the other is the temperature at the bottom and the top of the packed bed. When all of the QV,C = 0.7 m3/h, and QV,D = 0.1 m3/h, 0.3 m3/h, and 0.5 m3/h, the corresponding tank temperature ranges are 50 °C/82 °C, 48 °C/75 °C, and 44 °C/74 °C, respectively. This means that the larger the QV,C, the lower the whole temperature range of the tank. However, the temperature distribution in the tank can also be affected by TC,in; so, Figure 7 shows the changes in TC,in, TC,out, TD,in, TD,out, TCW,in, and TCW,out in each experiment. Compared with the temperature of Level 1 and Level 11 in case 1, the temperature changes near the bottom and the top of the packed bed in case 2 and case 3 are larger, especially when the discharging flow rate passes 0.5 m3/h. The temperature of Level 1 as shown in Figure 6c is quite different from that of the other levels. This is because the increase in discharging flow rate increases the disturbance at the bottom of the heat storage tank, thickens the thermocline, and extends to Level 1 to make its temperature different from other layers. The temperatures of Level 11 in case 2 and case 3 begin to decrease continuously after 14:49 and 14:55, respectively; the ‘turning points’ are circled in Figure 6b,c. The times corresponding to these ‘turning points’ represent the thermocline beginning to change the direction of movement. This differs from the temperature variation regularity of simultaneous charging and discharging in experiment with a stable heat source. The main reason for this is the difference in the heat source. This TES system cannot reach the balance of heat storage and release at the end period of the experiments. Therefore, the temperature of Level 11 is lower than Level 4 or even Level 2 at the end period of experiments.
QV,D has different effects on the water temperature of each loop outside the tank. For TC,in, it is not affected by QV,D, while TC,out is affected by QV,D throughout the experiment, especially when the discharging loop is opened. From the three images in Figure 7, we can see that every 0.2 m3/h increase in QV,D will reduce the stabilized TC,out by about 5 °C. QV,D has little effect on TD,out, which mainly depends on the temperature of the top water in the tank, but QV,D has more effect on TD,in. When QV,D is low, the fluctuation in TD,in is significant. When QV,D is high, TD,in is relatively stable. As Figure 7b,c show, TD,in can be stabilized at about 50 °C after 1 h of the discharging loops being turned on. In Figure 7a, TCW,in continues to increase after 13:45, which is somewhat unreasonable. Perhaps the valve at the connection between the outlet of the discharging loop and the chilling water pipeline is loosened so that part of the discharging loop water enters the chilling water pipeline, so that TCW,in increases to more than 60 °C. In addition, TCW,in is only affected by the ambient temperature, while TCW,out is not only affected by QV,D. When QV,D is high, it has a high degree of coincidence with TD,in.
Under different discharging flow rates, when the TC,in fluctuates, the TD,out fluctuates less and remains relatively stable. When the TC,in begins to decline rapidly in the later stage of charging and discharging, the TD,out can maintain a value for a long time. The lower the QV,D, the more heat is stored in the heat storage tank per unit time, the weaker the disturbance of the discharging backwater to the bottom of the heat storage tank, the higher the TC,in and TC,out, and the more high-temperature areas there are at the top of the heat storage tank; so, the TD,out is also higher and can maintain a higher temperature for a long time. Excluding the violent fluctuation period of the temperature when the discharging loop is just opened in case 2 and case 3, the variation range of the discharging outlet temperature from case 1 to case 3 is 68 °C~82 °C, 66 °C~76 °C, and 60 °C~74 °C. It should be noted that the TC,in and TD,out curves of case 2 and case 3 in Figure 7 intersect at 14:56 and 15:08, respectively. It can be seen from the two black circles of Figure 6b,c that these times are very close to the time when Level 11 began to decline continuously, and they are all affected by the intensity of solar radiation. Therefore, there is a value between 14:50 and 15:10. When the solar radiation intensity is lower than this value, the temperatures at the top of the heat storage tank begin to decline continuously. Taking an intermediate value to make it close to the time when these temperatures begin to decline continuously, the corresponding solar radiation intensity at 15:00 will be closer to the actual value. According to the experimental data, the value of this solar radiation intensity is 535 W/m2. This value can also predict the change in the moving direction of the thermocline.
Due to TD,out, it is within the heat supply temperature range of many combined heat and power generation plants. The heat storage system can also be used in the production and supply of domestic hot water. In these experiments, the average value of TD,out corresponding to case 1, case 2, and case 3 is 76 °C, 73 °C, and 69 °C, respectively. These temperatures are all higher than the phase change temperature of the paraffin. The time that case 1, case 2, and case 3 can supply the hot water above 69 °C is 1 h 56 min, 3 h 32 min, and 2 h 44 min, respectively. According to the above analysis, under the condition of simultaneous charging and discharging, the TD,out can be controlled by controlling the QV,D and QV,C. In the solar heating system combined with the heat storage system, the heat storage system can effectively suppress the fluctuation in the inlet temperature of the heat storage to provide stable domestic hot water.
If 69 °C is used as a critical value to determine whether the outlet hot water can be used, then based on this temperature, a discharging efficiency (ηD) [28] can also be defined:
η D = i = 1 i = m 1 | T i n , i T o u t , i | c p , w Q V ρ w Δ τ i = 1 i = n 1 | T i n , i T o u t , i | c p , w Q V ρ w Δ τ × 100
where the numerator represents the sum of the heat release when the temperature of the discharging hot water continues to be above 69 °C, and the denominator represents the total heat release of the whole process.
According to Formula (8), the discharging efficiency of case 1, case 2, and case 3 is 70.60%, 97.53%, and 62.92%, respectively.

3.3. Evolution of the Thermocline

The thermocline is defined to range from Tmin + 3 °C to Tmax − 3 °C; the Tmin and Tmax are the lowest and highest temperatures in the tank, respectively. Since the start time of each experiment is different and the total duration of each experiment is different, to compare the evolution of the thermocline at various stages, a dimensionless time τ* needs to be introduced. Because the initial state in the tank is 50 °C and each experiment is the integral charging condition, TC,out = 53 °C can be considered as the initial stage of the formation of the thermocline in the tank. Therefore, based on TC,out reaching 53 °C, the dimensionless time τ* is defined as follows:
τ = t t T C , out = 53 ° C
where “ t T C , out = 53 ° C ” means the experimental time of the TC,out = 53 °C, and “t” means the duration from the beginning of the experiment to this moment. For case 1, case 2, and case 3, τ* = 1 corresponds to 37 min 16 s, 66 min 16 s, and 92 min 20 s.
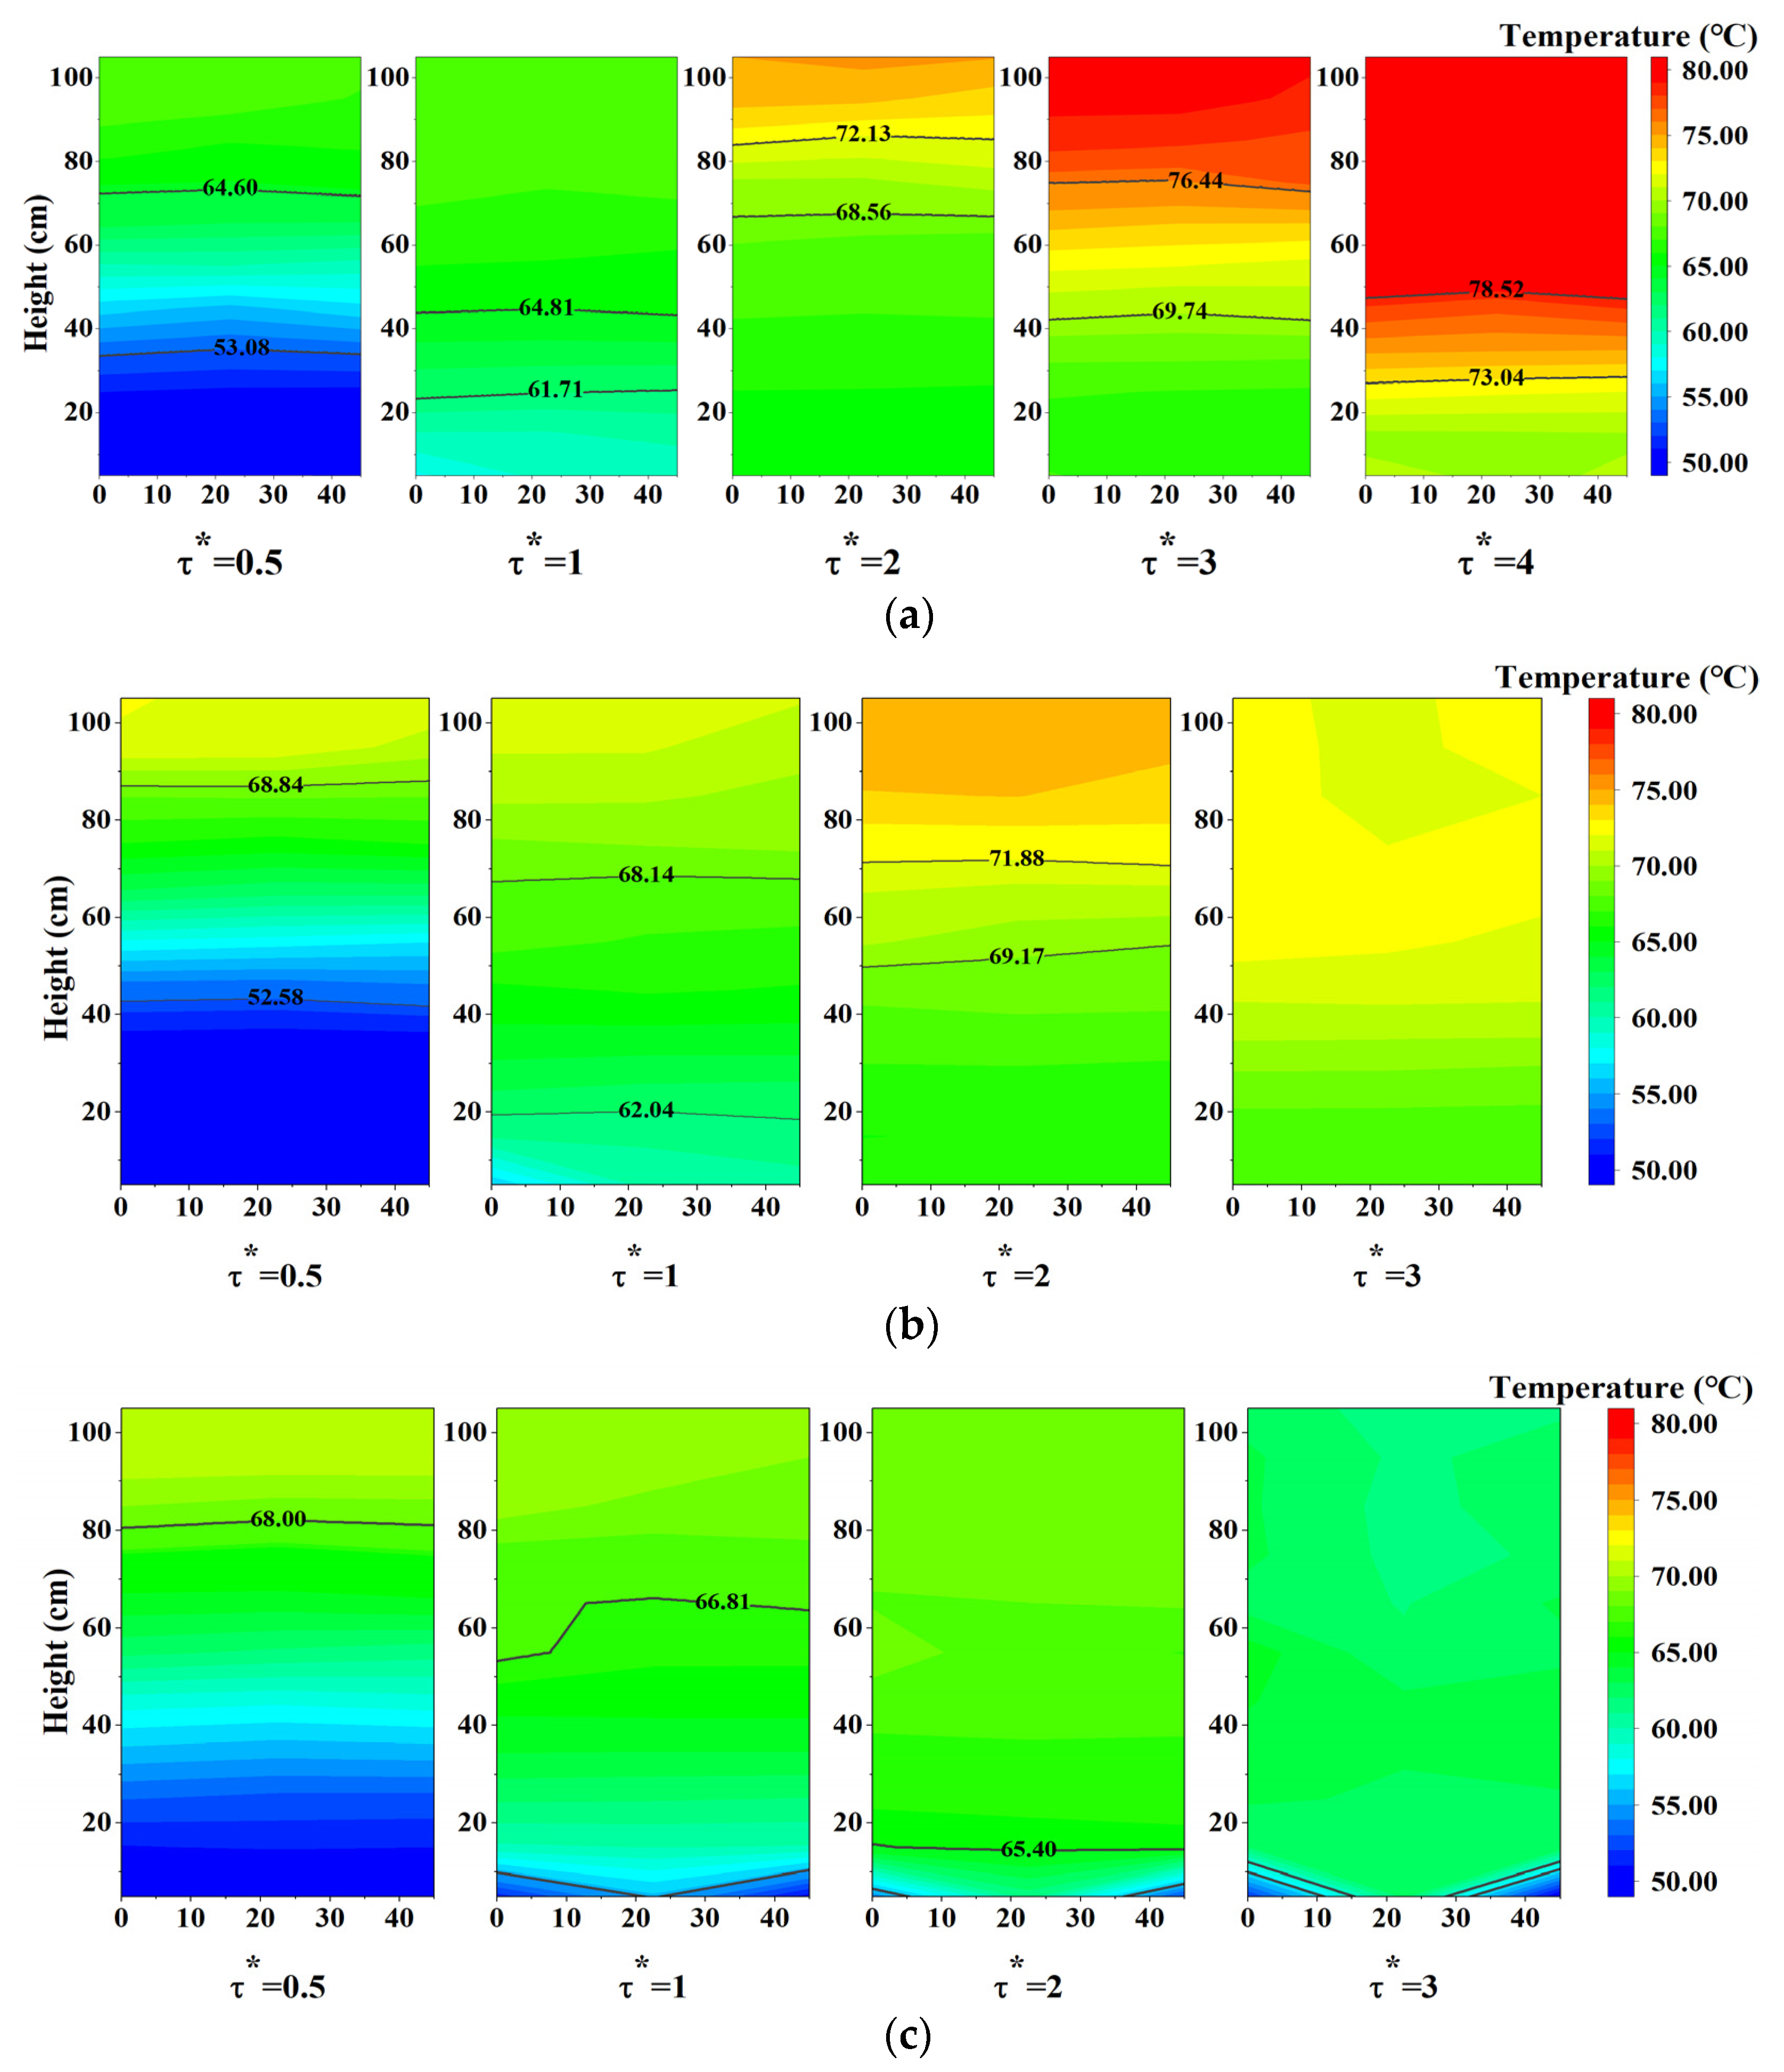
The temperature fields in the TES tank are shown in Figure 8.
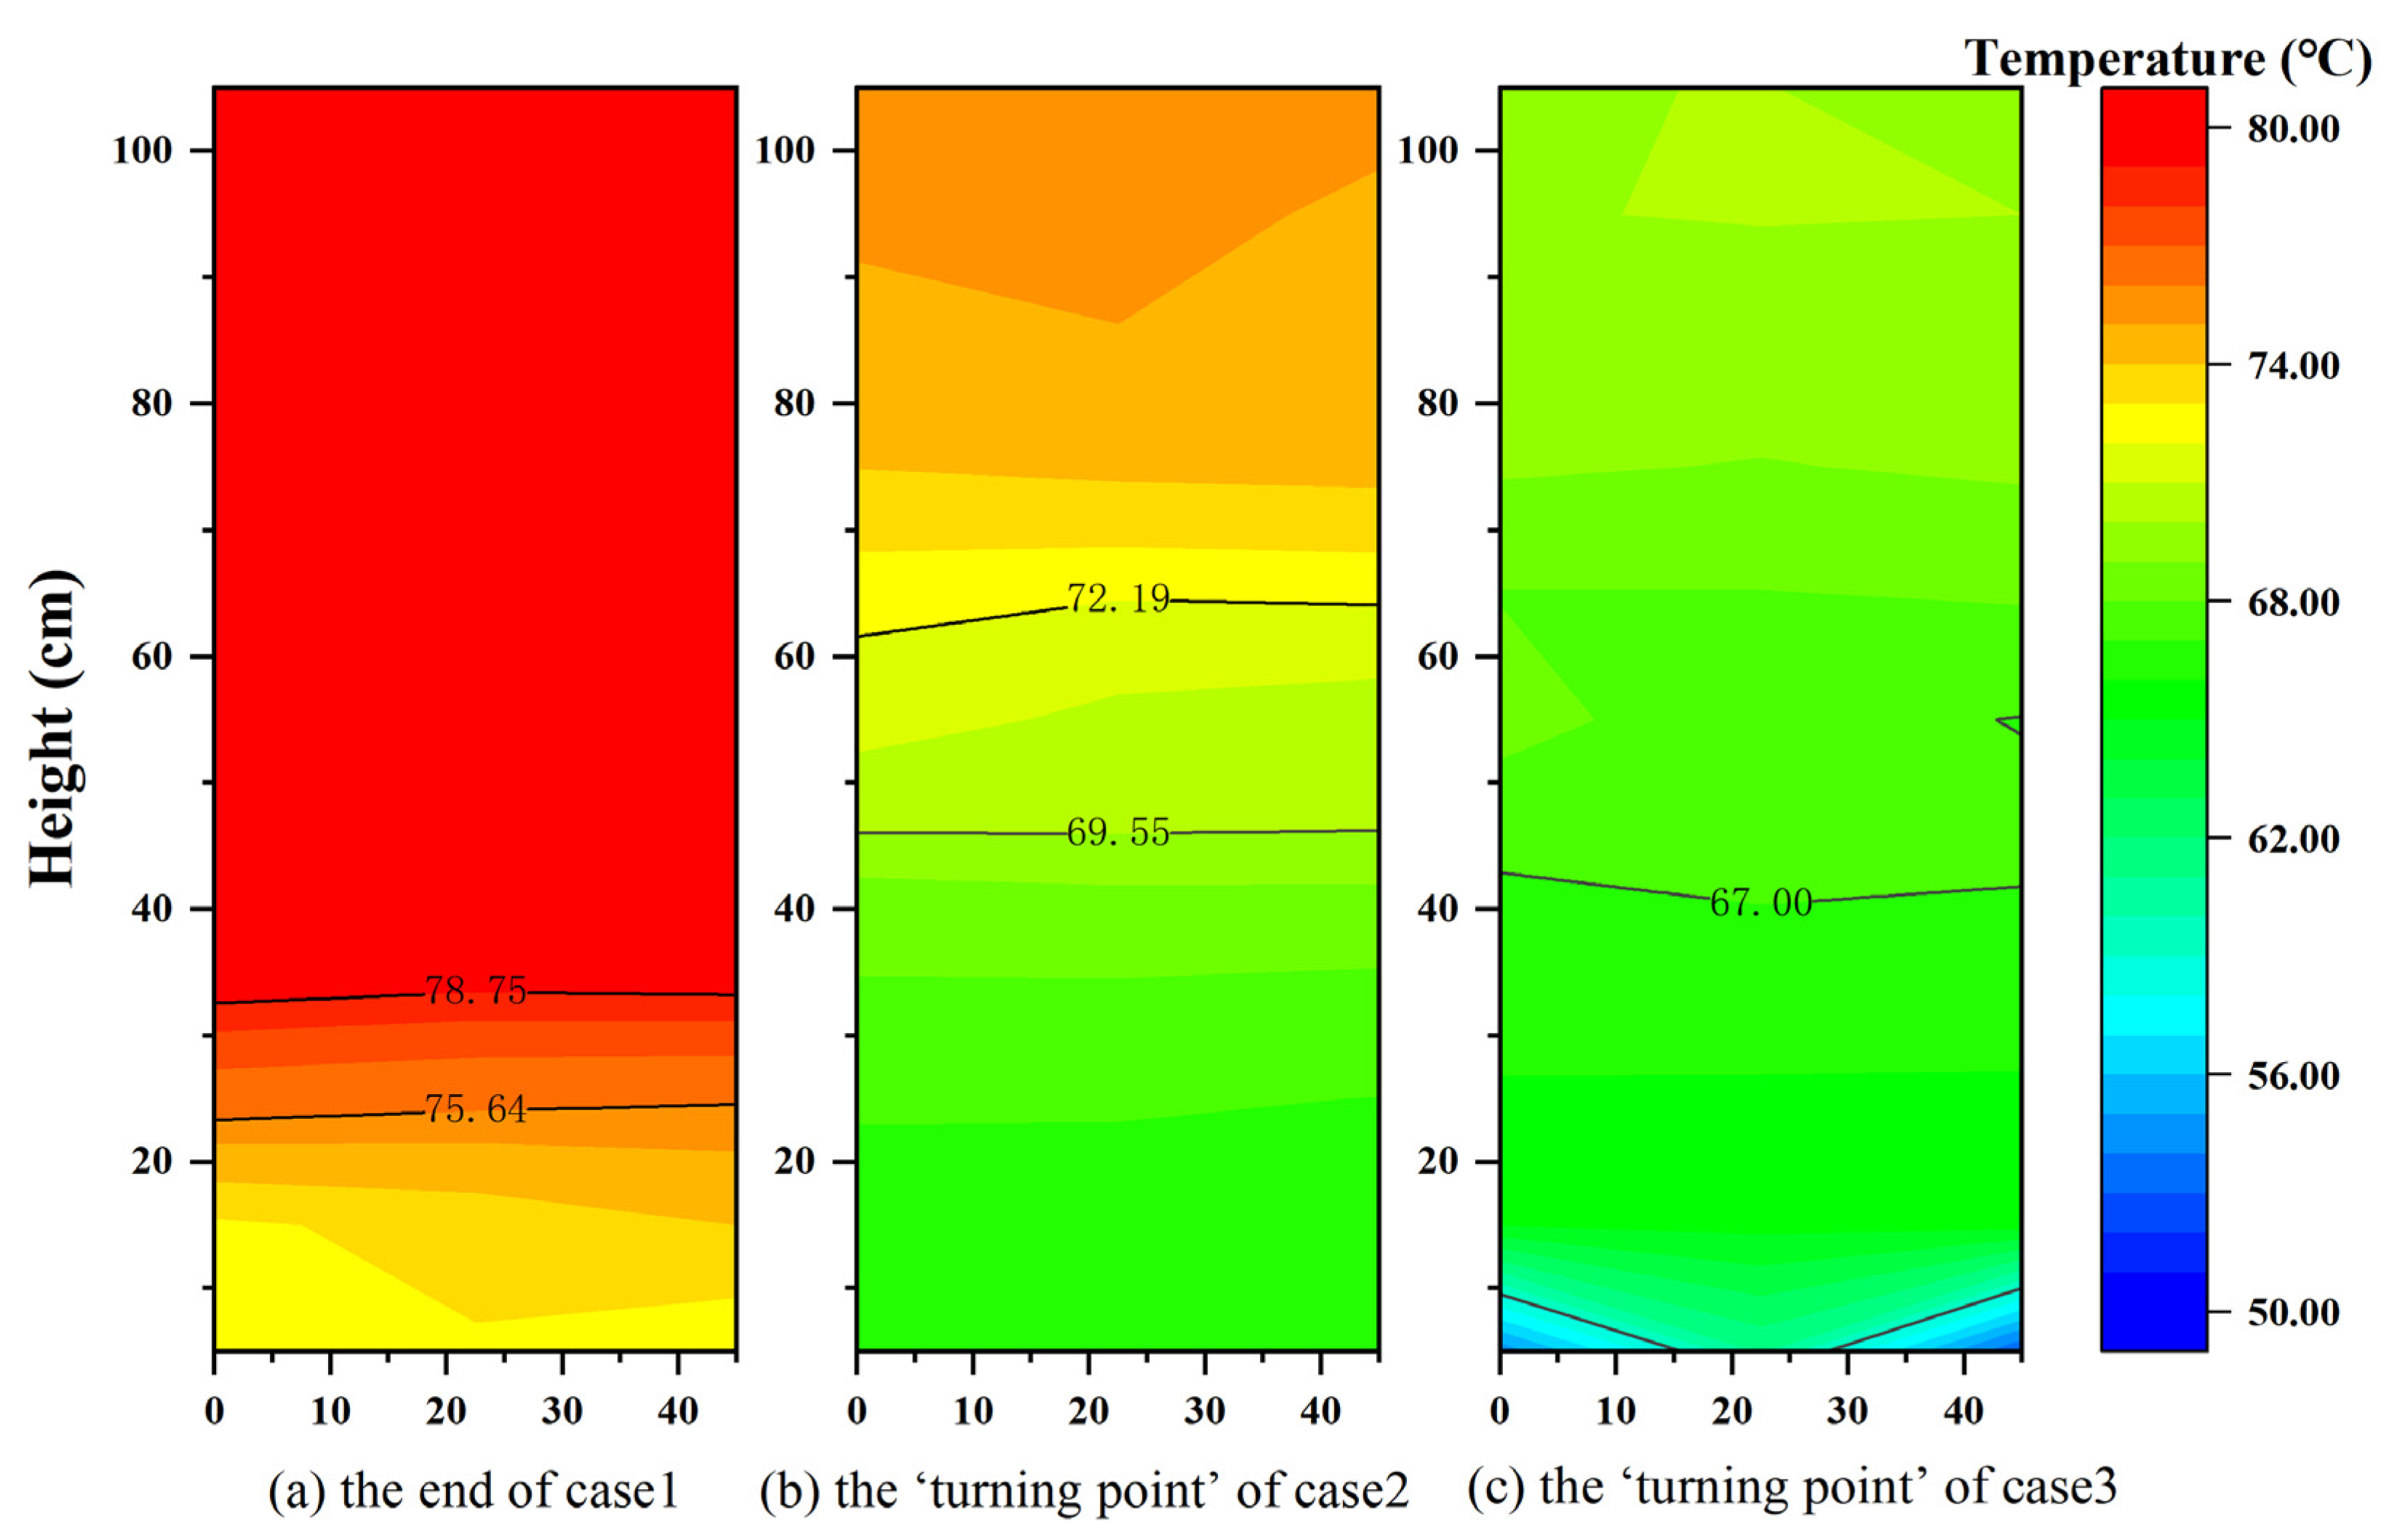
When drawing the image of the temperature field, considering symmetry, the temperature at 60 cm from the tank wall is equivalent to the temperature at 30 cm, and the temperature field in half of the tank is drawn. Obviously, when QV,D is low, the temperature field in the tank is relatively stable, and there is no rather large fluctuation in the thermocline. In the initial stage of the thermocline formation, that is, when τ* < 1, the thermocline’s thickness of case 1 is the smallest in these three experiments. This is mainly because the equivalent charging flow rate of case 1 is the largest, and the difference between the charging power and the discharging power is the largest. That is to say, the heat entering the tank per unit of time is the largest, so the thermocline can be generated faster. Due to the short contact time between hot and cold water, the temperature of case 1 does not spread further, resulting in the thinnest thermocline. As shown in Figure 9a, the thermocline thickness is approximately 10 cm at the end of case 1. Figure 9b,c show that the thickness of case 2 and case 3 is approximately 20 cm and 32 cm at the time of the ‘turning point’, and it is obvious that case 2 has the thinner thermocline and stabler temperature field.
The later stage of case 1 is close to the fully charged state, while in case 2 and case 3, due to the high QV,D, the solar radiation intensity begins to weaken before reaching the fully charged state; then, TC,in decreases, and when τ* increases from 2 to 3, it turns into an integral discharging state gradually.
According to the above analysis, the thermocline TES tank in the CSP plant should properly increase the difference between QV,C and QV,D under the condition of simultaneous charging and discharging, that is, the equivalent charging/discharging flow rate should be higher, which cannot only increase the charging/discharging power but also acquire a more stable thermocline.

3.4. Difference in Utilization Rate

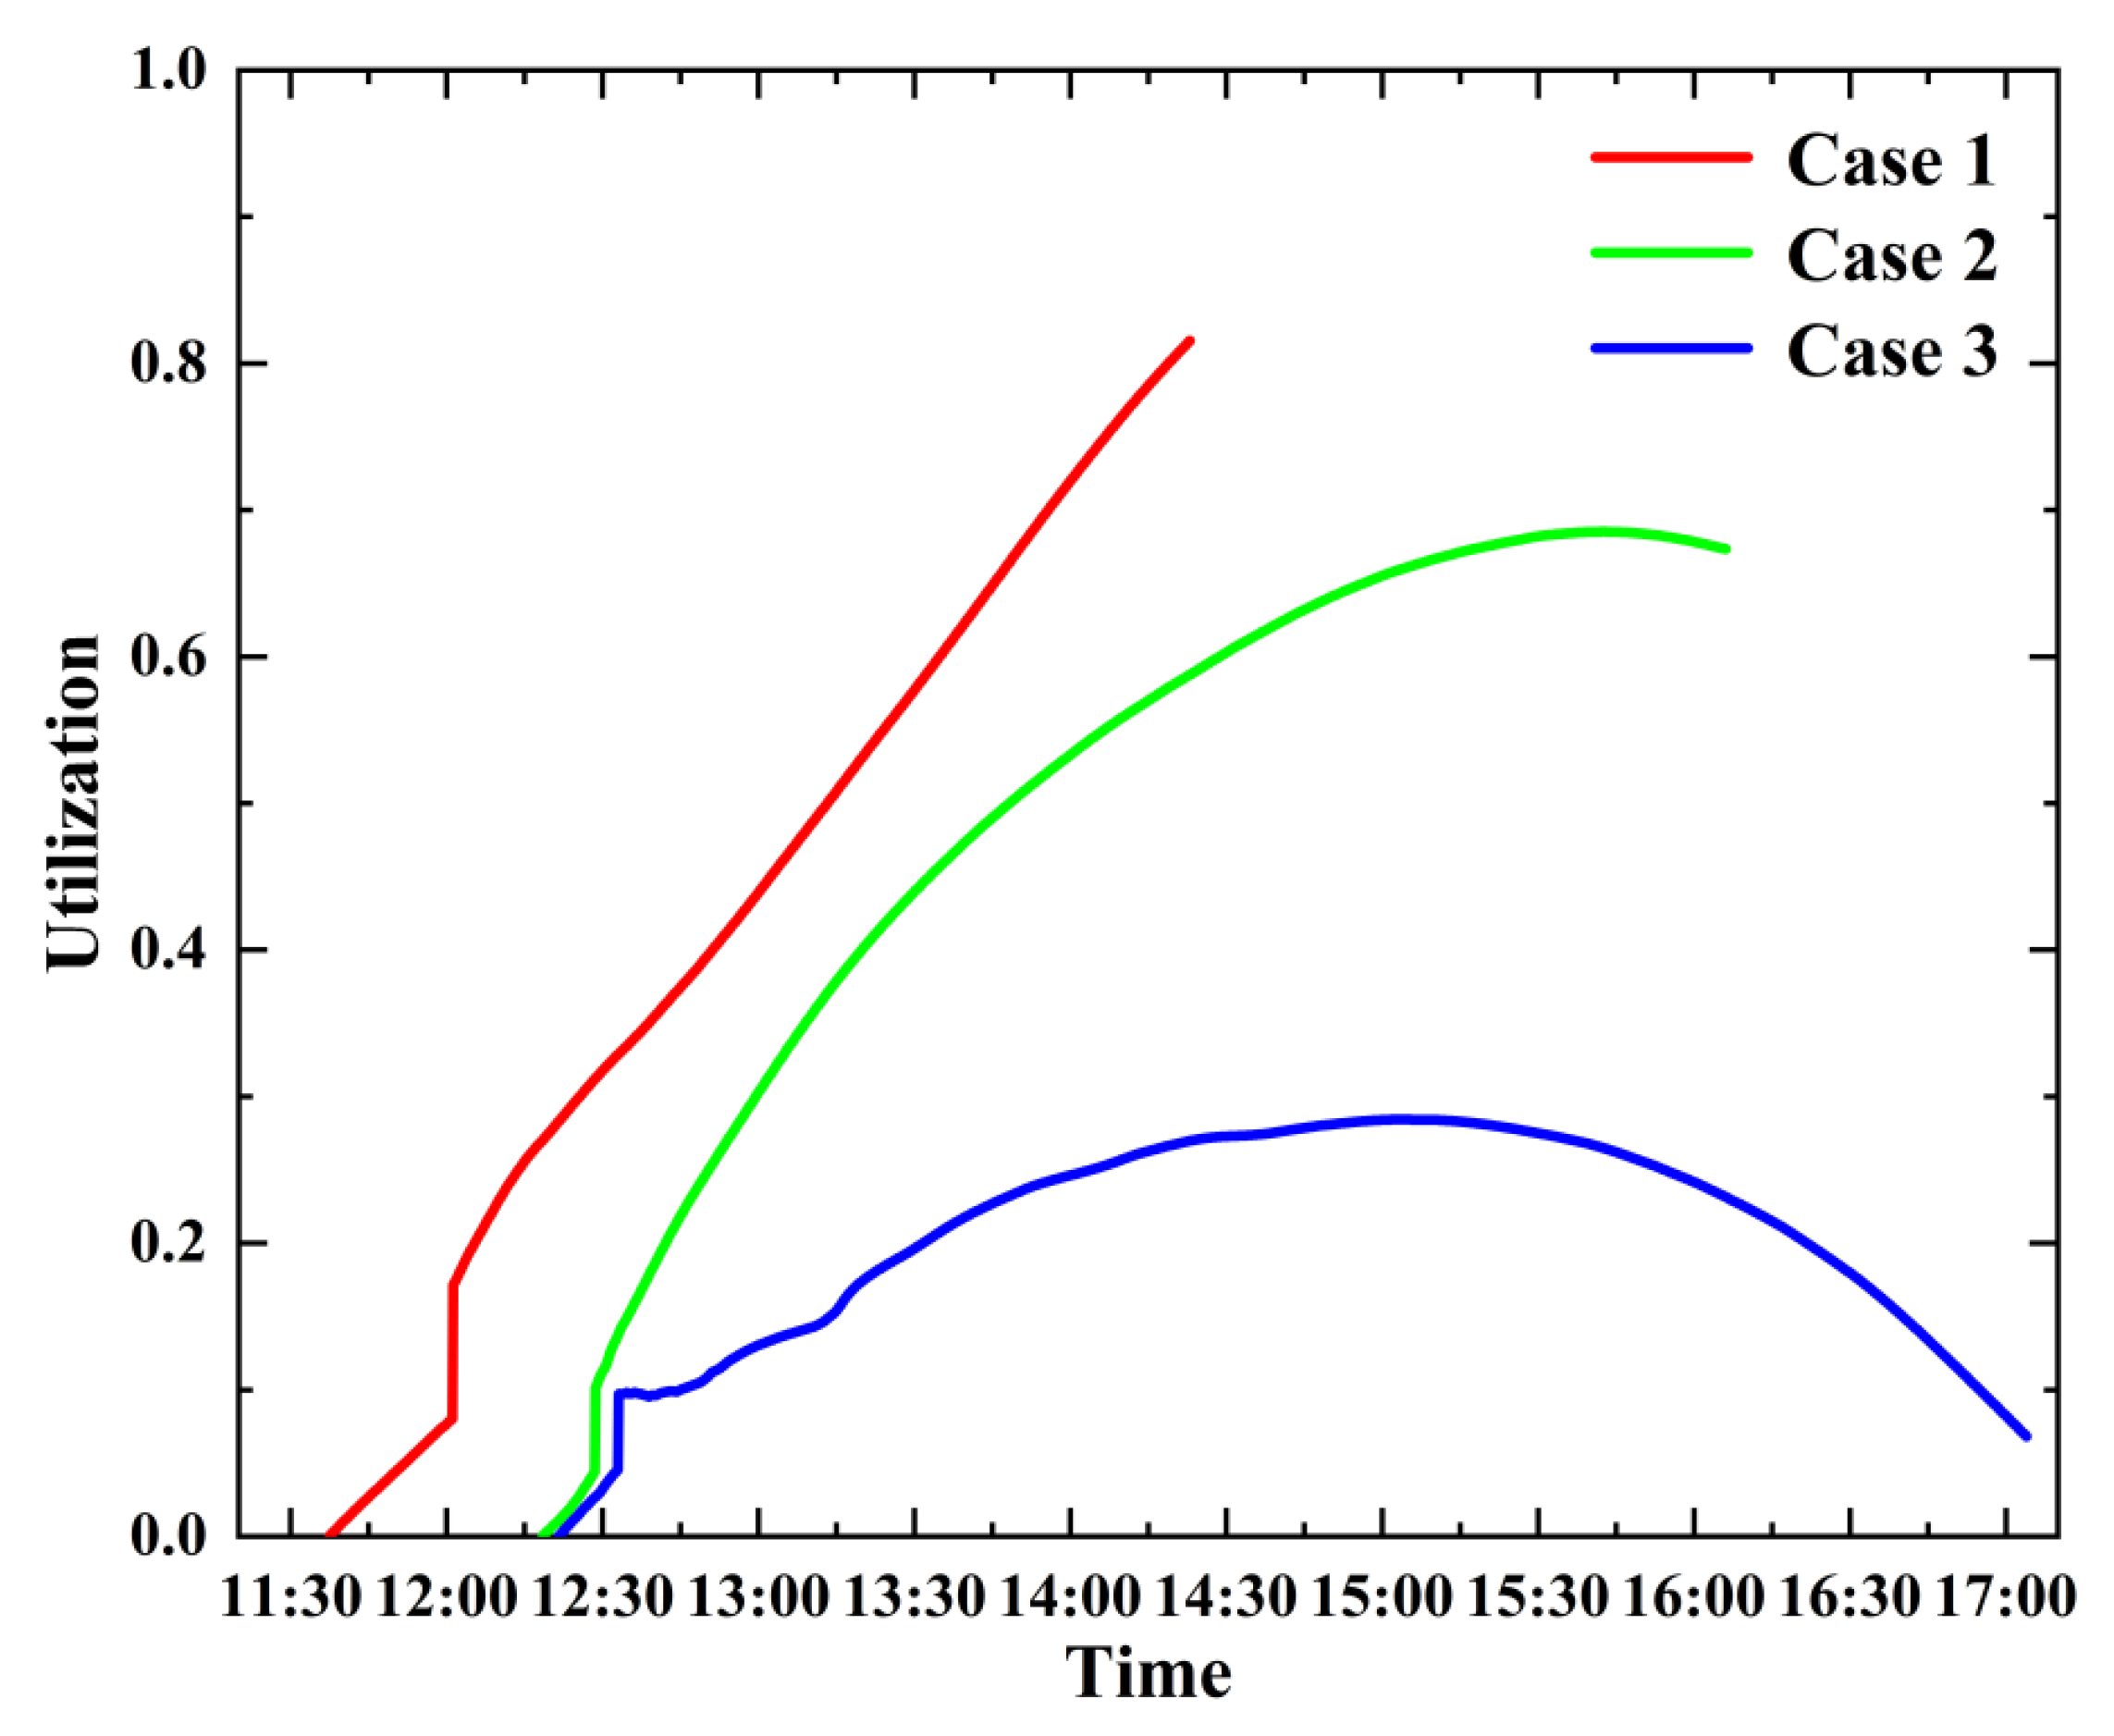
As a whole, the three experiments in this paper are related to integral heat storage. The definition of the utilization rate (UR) is based on the first law of thermodynamics, and it reflects the heat storage efficiency of the storage tank. The performance under different working conditions can be intuitively compared by the variations in the heat storage capacity utilization rate with time. According to the experimental data and the calculation of Equations (2)–(5), the variations in the UR with time are shown in Figure 10.
Except for case 1, case 2 and case 3 did not reach the fully charged state, and the UR in case 2 begins to decline at 15:42:23 and the UR in case 3 begins to decline at 15:04:09, which means that although QV,C > QV,D, the system was still in the integral discharging state during this period. Nevertheless, the solar radiation intensity varies with the changes in weather conditions and seasons. The solar radiation intensity is one of the main factors affecting TC,in in addition to QV,C; so, we should pay more attention to it when the UR changes from rising to falling. The times whereby the UR reaches the inflection point of case 2 and case 3 are 15:42:23 and 15:02:39, respectively; it can be seen from Figure 5 that the time that the UR gets to the inflection point of case 2 is 431 W/m2, and the time that the UR reaches the inflection point of case 3 is 532 W/m2. Because the start time and duration of each experiment are different, the heat storage performance of these three cases can be judged by comparing URmax, obviously case 1 > case 2 > case 3. The maximum value of UR and the time to take the maximum value in each experiment are shown in Table 4.
From analyzing the start and end time of the experiment, the reason why case 1 ended before 14:30 is that it reached the fully charged state, that is, the temperature of Level 1 is higher than the phase transition temperature of PCM, while the start time of case 2 and case 3 is later than case 1 for nearly 30 min so that we cannot compare their heat storage performance by comparing the UR at the same time. In fact, the UR growth rate of case 2 is higher than that of case 1 at some periods of the beginning of the experiment, which means that if they start at the same time, the UR of case 2 is higher than that of case 1 in the first half of the experiment, which provides an idea for the study of variable flow conditions in the future, that is to say, if the follow-up study shows that the UR of case 2 is indeed higher than that of case 1 at the same experimental time. The parameters of case 2 can be used from the beginning of the experiment to a particular moment and then adjusted to the parameters of case 1.
From the charging/discharging flow rate and initial state, these three experiments are all integral heat storage experiments, and when the integral heat storage is the purpose, the parameters of case 1 are more conducive to the overall heat storage. In addition, if the purpose is the heating supply, the flow rate corresponding to case 2 will be a better choice. Its discharging hot water temperature is more stable than case 1 and its discharging efficiency is the highest.

4. Conclusions

Only the simultaneous charging and discharging process whereby QV,C > QV,D are studied in these experiments. However, in the actual operation, there must be a simultaneous charging and discharging condition whereby QV,C < QV,D. In this condition, whether the heat storage tank can stabilize the fluctuation in the TC,in and the extent to which the TD,out can remain stable remain to be further studied.
In addition, the selection and encapsulation of PCM are two of the critical factors affecting the heat storage system’s economy and heat storage performance. In this system, stainless steel with a thickness of 0.5 mm was used to encapsulate paraffin, which has high density, high price, and poor economy. The thermal conductivity of paraffin is low, and the heat transfer effect between paraffin and the heat transfer fluid is poor. In the subsequent experiments, paraffin and other materials can be made into composite materials to improve their thermal performance.
For the packed bed, on the one hand, the cost of PCM capsules used in this system is high, which limits their large-scale application. On the other hand, in practical applications, it is usually tricky to completely use latent heat. Therefore, many PCM capsules must have no phase change at the bottom of the tank, and their latent heat of the phase change is not utilized, resulting in waste. So, by filling materials with a lower phase change temperature (such as Sodium Thiosulfate and Myristic acid) at the bottom of the heat storage tank to form a multi-layer packed bed tank, the construction cost of the heat storage tank could be minimized, and the capacity utilization rate of the heat storage tank could be improved.
The TES system with solar energy as a heat storage heat source was studied experimentally under three different operating conditions in this paper. The main conclusions are as follows:
(1)
Theoretically, there is a quantitative relationship between solar radiation intensity and charging power, but it is difficult to express in a relational expression. Their trend of change is similar; the peak of charging power often appears when the solar radiation intensity is close to the maximum. In addition to case 1, from case 2 and case 3, we can see that after the solar radiation intensity is less than 548 W/m2, the decreased rate of charging power is close to the decreased rate of solar radiation intensity.
(2)
As an inertial link, the heat storage tank itself can effectively stabilize the fluctuation in solar energy and stabilize the outlet water temperature while participating in heat storage. The average temperatures of the discharging outlet corresponding to case 1, case 2, and case 3 are 76 °C, 73 °C, and 69 °C, respectively. These temperatures are all higher than the phase change temperature of the paraffin. In addition, the time that case 1, case 2, and case 3 can supply the hot water above 69 °C is 1 h 56 min, 3 h 32 min, and 2 h 44 min, respectively. A value is found when the solar radiation intensity is lower than this value (535 W/m2); the temperature at the top of the heat storage tank begins to decrease continuously. Subsequent experiments can fine-tune the discharging flow rate according to this value to further stabilize the discharging outlet temperature.
(3)
Considering that the weakening of solar radiation will reduce the temperature of the heat storage inlet and disturb the temperature field in the tank, the simultaneous charging and discharging process should be carried out in the morning. Avoid continuing operating after the utilization rate decreases, which can make the temperature field in the tank more stable and increase the utilization rate.
(4)
Increasing the discharging flow rate will increase the whole charging and discharging time, thicken the thermocline, and disturb the temperature field in the tank, but considering the demand of heat release that should be met, there must exist a ‘perfect flow rate’ that can make the discharging efficiency and utilization rate obtain the maximum values, and make the condition of case 2 closer to the ‘perfect flow rate’.

Author Contributions

Methodology, X.X. and H.W.; Investigation, X.X., Z.Z. and Z.C.; Resources, X.D.; Data curation, Z.C.; Writing—original draft, X.X. and Z.Z.; Writing—review & editing, X.X., Z.Z. and H.W.; Visualization, Z.Z.; Supervision, X.X., Z.Z., H.W. and X.D.; Funding acquisition, X.X. and X.D. All authors have read and agreed to the published version of the manuscript.

Funding

This research was funded by [National Key Research and Development Program of China] grant number [2020YFB0606202].

Institutional Review Board Statement

Not applicable.

Informed Consent Statement

Not applicable.

Data Availability Statement

Not applicable.

Conflicts of Interest

The authors declare no conflict of interest.

Nomenclature

cspecific heat (kJ/(kg·K))
Eenergy (kJ)
Mmass (kg)
Δhfusion heat (kJ/kg)
Ppower (kW)
QVvolume flow rate (m3/h)
Ttemperature (°C)
ttime (min)
λthermal conductivity (W/(m·K))
ρdensity (kg/m3)
σuncertainty
ηefficiency
Greek symbols
Ccharging
CWchilling water
Ddischarging
ininlet
iniinitial
lliquid phase
maxmaximum
minminimum
outoutlet
pparaffin wax
pcphase change
ssolid phase
ssstainless steel shell of PCM capsules
wwater
Subscripts
τ*dimensionless time
Abbreviations
CSPconcentrating solar power
HTFheat transfer fluid
PCMphase change material
TESthermal energy storage
URutilization rate

References

  1. Wu, H. Numerical Simulation and Optimization on Energy Storage Properties of Packed Bed Latent Heat Thermal Energy Storage. Master’s Thesis, North China Electric Power University, Beijing, China, 2019. [Google Scholar]
  2. Wang, X.H.; He, Z.Y.; Xu, C.; Du, X.Z. Dynamic Simulations on Simultaneous Charging/Discharging Process of Water Thermocline Storage Tank. Proc. CSEE 2019, 39, 5989–5998. [Google Scholar]
  3. Dufie, J.A.; Beckman, W.A. Solar Energy Thermal Processes; John Wiley & Sons: Hoboken, NJ, USA, 1974. [Google Scholar]
  4. Lilleleht, L.U.; Beard, J.T.; Lachetta, F.A. Proceedings of the workshop on solar energy storage subsystems for the heating and cooling of buildings. NASASTI/Recon Tech. Rep. N 1975, 76, 30677. [Google Scholar]
  5. Ismail, K.A.R.; Henriquez, J.R. Numerical and experimental study of spherical capsules packed bed latent heat storage system. Appl. Therm. Eng. 2002, 22, 1705–1716. [Google Scholar] [CrossRef]
  6. Pacheco, J.E.; Showalter, S.K.; Kolb, W.J. Development of a molten-salt thermocline thermal storage system for parabolic trough plants. J. Sol. Energy Eng. 2002, 124, 153–159. [Google Scholar] [CrossRef]
  7. Niedermeier, K.; Marocco, L.; Flesch, J.; Mohan, G.; Coventry, J.; Wetzel, T. Performance of molten sodium vs. molten salts in a packed bed thermal energy storage. Appl. Therm. Eng. 2017, 141, 368–377. [Google Scholar] [CrossRef]
  8. Nallusamy, N.; Sampath, S.; Velraj, R. Experimental Investigation on a Combined Sensible and Latent Heat Storage System Integrated with Constant/Varying (Solar) Heat Sources. Renew. Energy 2007, 32, 1206–1227. [Google Scholar] [CrossRef]
  9. Fasquelle, T.; Falcoz, Q.; Neveu, P.; Hoffmann, J.F. A temperature threshold evaluation for thermocline energy storage in concentrated solar power plants. Appl. Energy 2018, 212, 1153–1164. [Google Scholar] [CrossRef]
  10. Bruch, A.; Molina, S.; Esence, T.; Fourmigué, J.F.; Couturier, R. Experimental investigation of cycling behavior of pilot-scale thermal oil packed-bed thermal storage system. Renew. Energy 2017, 103, 277–285. [Google Scholar] [CrossRef]
  11. Cabeza, L.F.; Ibáñez, M.; Solé, C.; Roca, J.; Nogués, M. Experimentation with a water tank including a PCM module. Sol. Energy Mater. Sol. Cells 2006, 90, 1273–1282. [Google Scholar] [CrossRef]
  12. He, Z.Y.; Du, X.Z.; Xu, C. Experiments on the combined cycle operation performance of thermocline heat storage with phase change material packed-bed. J. Eng. Thermophys. 2019, 40, 2658–2663. [Google Scholar]
  13. Zhao, W.; Neti, S.; Oztekin, A. Heat transfer analysis of encapsulated phase change materials. Appl. Therm. Eng. 2013, 50, 143–151. [Google Scholar] [CrossRef]
  14. Oró, E.; Castell, A.; Chiu, J.; Martin, V.; Cabeza, L.F. Stratification analysis in packed bed thermal energy storage systems. Appl. Energy 2013, 109, 476–487. [Google Scholar] [CrossRef]
  15. Kumar, G.S.; Nagarajan, D.; Chidambaram, L.A.; Kumaresan, V.; Ding, Y.; Velraj, R. Role of PCM addition on stratification behaviour in a thermal storage tank—An experimental study. Energy 2016, 115, 1168–1178. [Google Scholar] [CrossRef]
  16. Xu, C.; Wang, Z.F.; He, Y.L.; Li, X.; Bai, F. Sensitivity analysis of the numerical study on the thermal performance of a packed-bed molten salt thermocline thermal storage system. Appl. Energy 2012, 92, 65–75. [Google Scholar] [CrossRef]
  17. Xu, C.; Wang, Z.F.; He, Y.L.; Li, X.; Bai, F. Parametric study and standby behavior of a packed-bed molten salt thermocline thermal storage system. Renew. Energy 2012, 48, 1–9. [Google Scholar] [CrossRef]
  18. Wu, S.M.; Fang, G.Y.; Liu, X. Dynamic discharging characteristics simulation on solar heat storage system with spherical capsules using paraffin as heat storage material. Renew. Energy 2011, 36, 1190–1195. [Google Scholar] [CrossRef]
  19. Zhao, B.C.; Cheng, M.S.; Liu, C.; Dai, Z.M. System-level performance optimization of molten-salt packed-bed thermal energy storage for concentrating solar power. Appl. Energy 2018, 226, 225–239. [Google Scholar] [CrossRef]
  20. Galione, P.A.; Pérez-Segarra, C.D.; Rodríguez, I.; Lehmkuhl, O.; Rigola, J. A new thermocline-PCM thermal storage concept for CSP plants. Numerical analysis and perspectives. Energy Procedia 2014, 49, 790–799. [Google Scholar] [CrossRef]
  21. Zhao, B.C.; Cheng, M.S.; Liu, C.; Dai, Z.M. Thermal performance and cost analysis of a multi-layered solid-PCM thermocline thermal energy storage for CSP tower plants. Appl. Energy 2016, 178, 784–799. [Google Scholar] [CrossRef]
  22. Liao, Z.R.; Zhao, G.K.; Xu, C.; Yang, C.; Jin, Y.; Ju, X.; Du, X. Efficiency analyses of high temperature thermal energy storage systems of rocks only and rock-PCM capsule combination. Sol. Energy 2018, 162, 153–164. [Google Scholar] [CrossRef]
  23. Elfeky, K.E.; Mohammed, A.G.; Ahmed, N.; Lu, L.; Wang, Q.W. Thermal and economic evaluation of phase change material volume fraction for thermocline tank used in concentrating solar power plants. Appl. Energy 2020, 267, 115054. [Google Scholar] [CrossRef]
  24. Elfeky, K.E.; Mohammed, A.G.; Wang, Q.W. Cycle cut-off criterion effect on the performance of cascaded, sensible, combined sensible-latent heat storage tank for concentrating solar power plants. Energy 2021, 230, 120771. [Google Scholar] [CrossRef]
  25. ELSihy, E.S.; Liao, Z.R.; Xu, C.; Du, X.Z. Dynamic characteristics of solid packed-bed thermocline tank using molten-salt as a heat transfer fluid. Int. J. Heat Mass Transf. 2021, 165, 120677. [Google Scholar] [CrossRef]
  26. ELSihy, E.S.; Xu, C.; Du, X.Z. Cyclic performance of cascaded latent heat thermocline energy storage systems for high-temperature applications. Energy 2022, 239, 122229. [Google Scholar] [CrossRef]
  27. He, Z.Y. Experimental Study on the Thermocline Storage Tank with Phase Change Material. Master’s Thesis, North China Electric Power University, Beijing, China, 2019. [Google Scholar]
  28. Mawire, A.; McPherson, M. Experimental characterisation of a thermal energy storage system using temperature and power controlled charging. Renew. Energy 2008, 33, 682–693. [Google Scholar] [CrossRef]
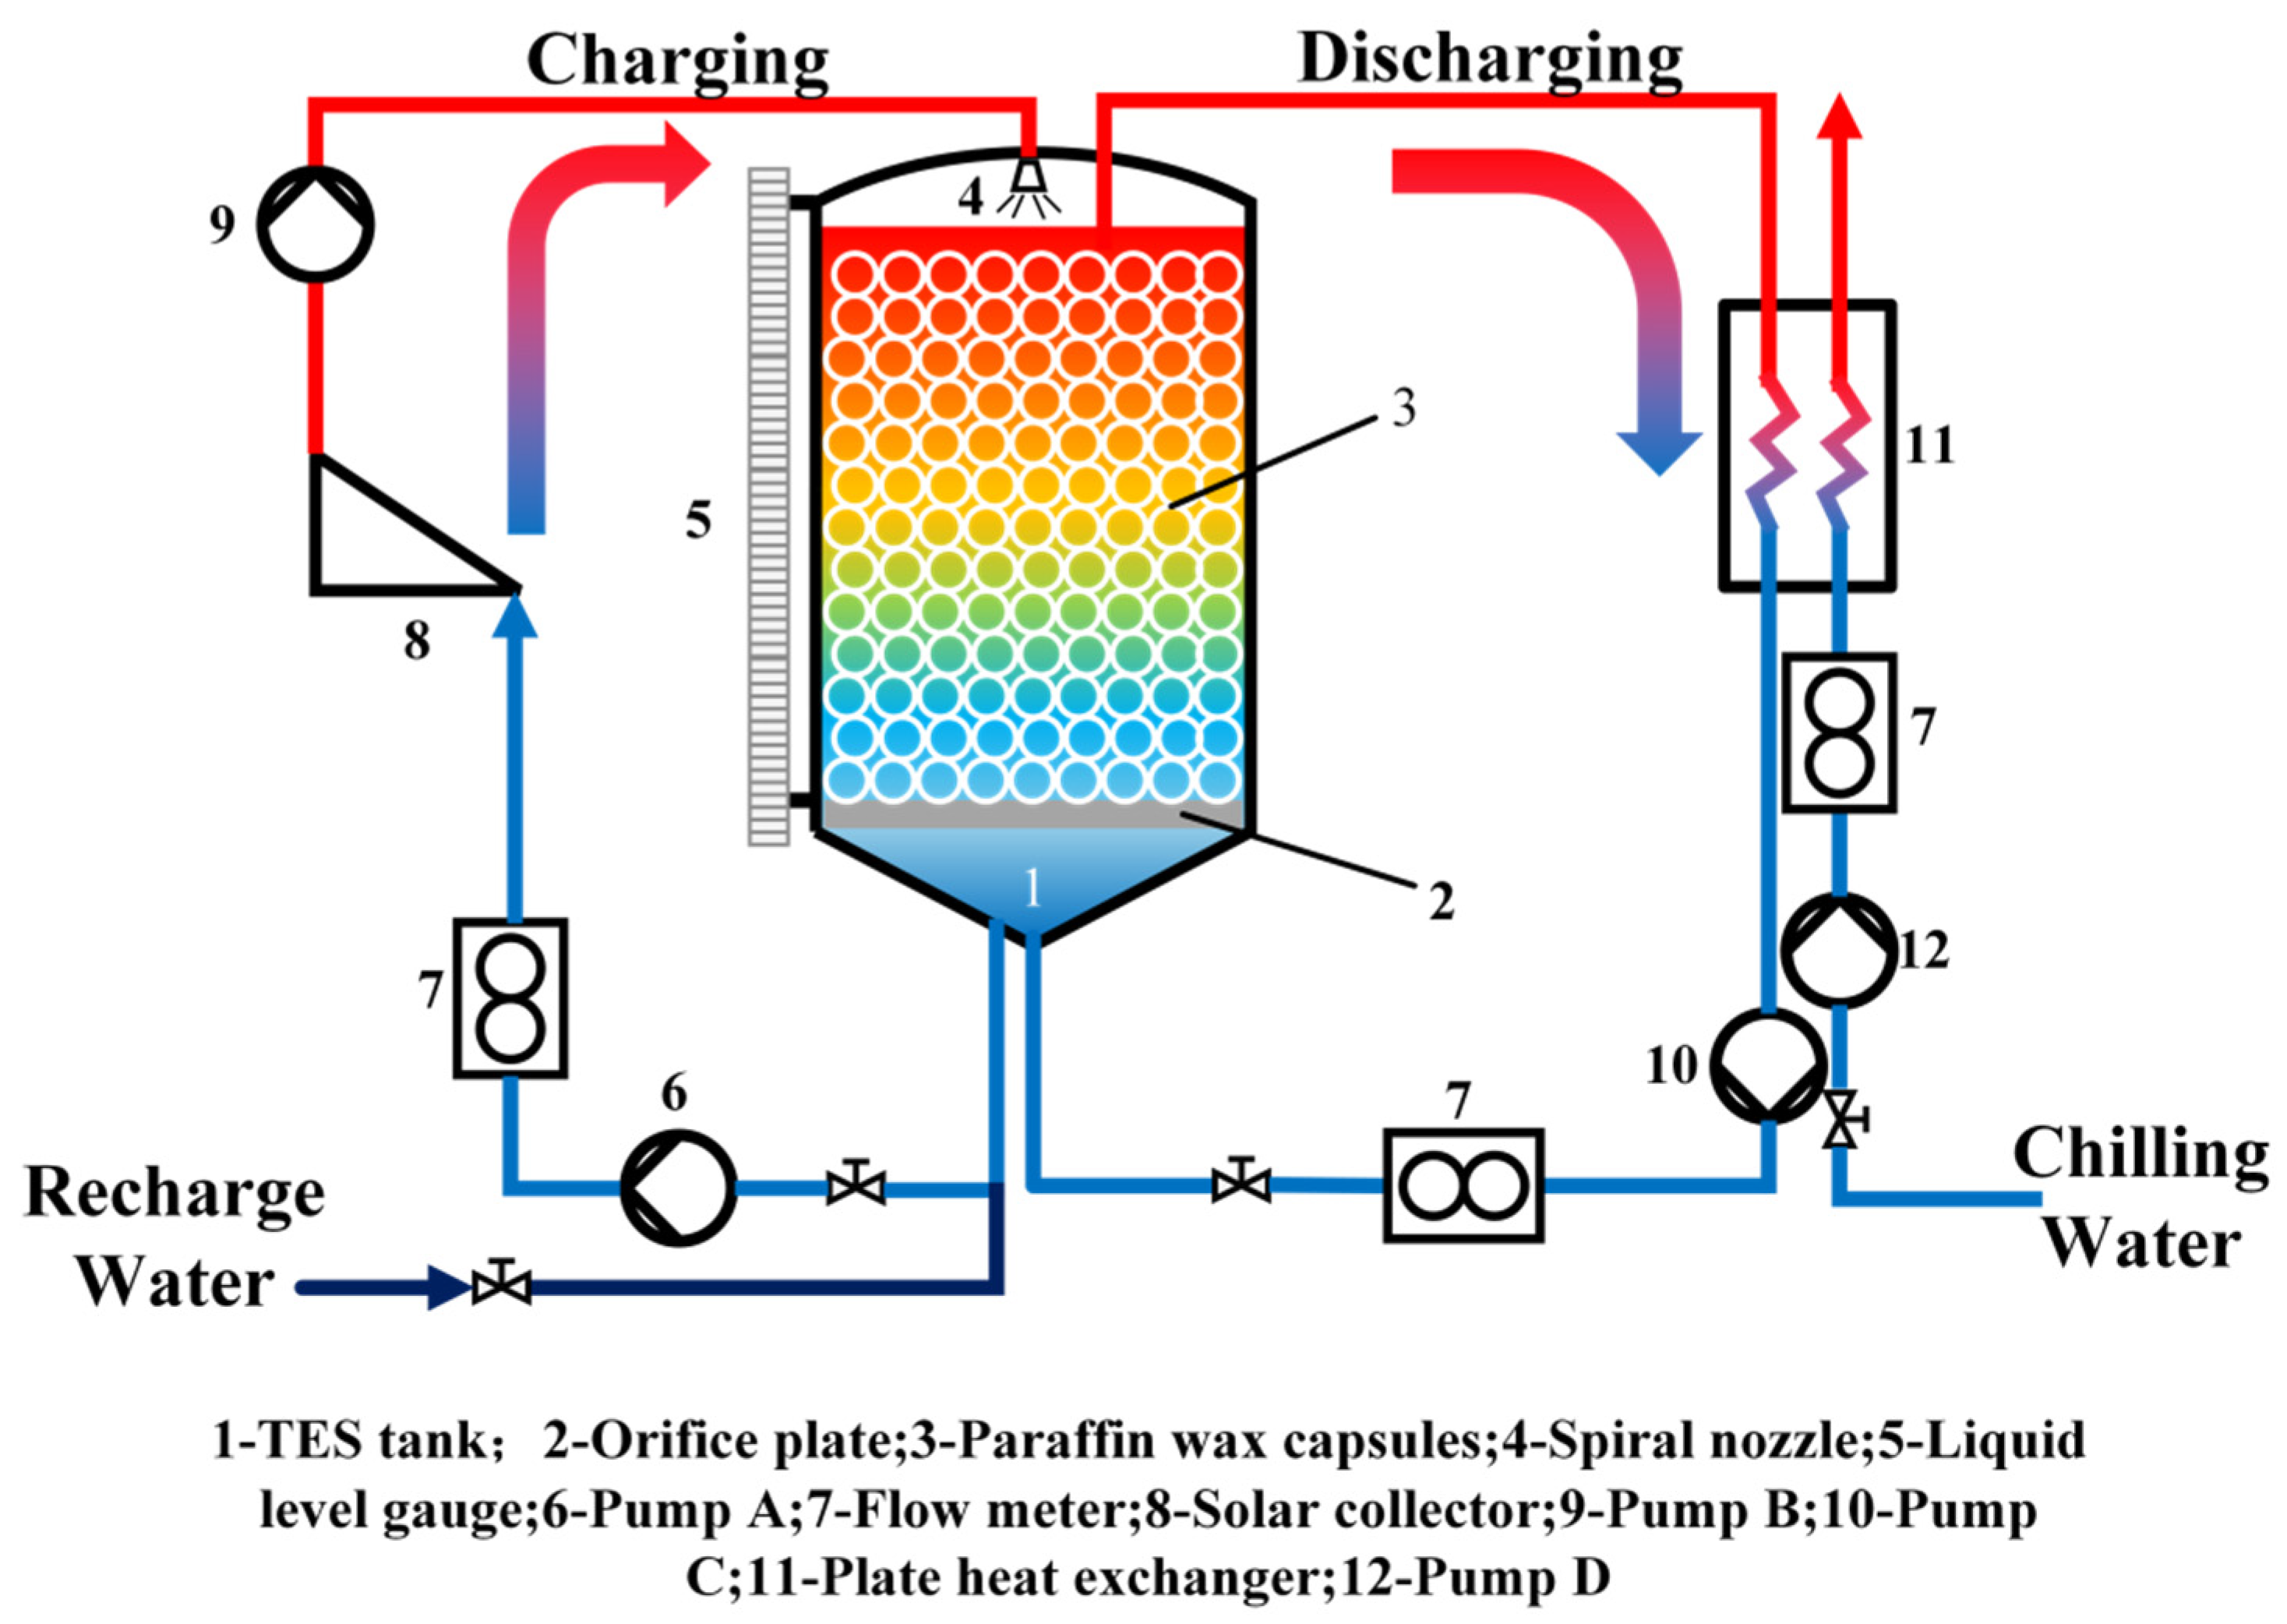
Figure 1. Flowchart of the experiments.
Sustainability 15 07322 g001
Figure 2. The photo of the experimental system.
Sustainability 15 07322 g002
Figure 3. Thermocouples distribution inside the tank, in cm.
Sustainability 15 07322 g003
Figure 4. The photo of the encapsulated PCM capsule.
Sustainability 15 07322 g004
Figure 5. The variation in charging power and solar radiation intensity with time under different experiments.
Sustainability 15 07322 g005
Figure 6. The average temperature of each level in the TES tank.
Sustainability 15 07322 g006
Figure 7. Temperature of water outside the TES tank in each experimental case.
Sustainability 15 07322 g007
Figure 8. Temperature field in the TES tank. (a) Temperature field in the TES tank of experimental case 1, (b) temperature field in the TES tank of experimental case 2, and (c) temperature field in the TES tank of experimental case 3.
Sustainability 15 07322 g008
Figure 9. Temperature field in the TES tank when the experiment is over or the thermocline begins to change the direction of movement.
Sustainability 15 07322 g009
Figure 10. Variations in utilization.
Sustainability 15 07322 g010
Table 1. Thermal properties of PCM and design parameters of PCM capsules.
Paraffin WaxValue
Solid phase density, ρp,s838 kg/m3
Liquid phase density, ρp,l834 kg/m3
Solid phase specific heat, cp,s2.15 kJ/(kg·K)
Liquid phase specific heat, cp,l2.19 kJ/(kg·K)
Solid–liquid phase transition temperature, Tpc67–69 °C
Solid–liquid phase change latent heat, Δh254 kJ/kg
Thermal conductivity (solid phase), λp,s0.21 W/(m·K)
PCM CapsulesValue
Density of the shell (at 20 °C), ρss7930 kg/m3
Specific heat of the shell (at 20 °C), css0.5 kJ/(kg·K)
Inner diameter41 mm
Outer diameter42 mm
Mass of paraffin wax25 g
Table 2. Some parameter values in the experiments.
CaseDateTini, °CQV,C, m3/hQV,D, m3/hQV,CW, m3/hTC,in, °C
110 April 2022500.70.10.25-
28 April 2022500.70.30.25-
37 April 2022500.70.50.25-
Table 3. The uncertainty of parameters.
ParametersUncertainty
Solar radiation intensity±50 W/m2
Volume flow rate, QV±0.01 m3/h
Temperature, T±0.5 °C
Charging power, PC±0.69 kW
Utilization rate, UR±0.003
Table 4. The percent URmax of different cases.
CaseURmaxTime
181.55%14:23:01
268.52%15:42:23
328.43%15:04:09
Disclaimer/Publisher’s Note: The statements, opinions and data contained in all publications are solely those of the individual author(s) and contributor(s) and not of MDPI and/or the editor(s). MDPI and/or the editor(s) disclaim responsibility for any injury to people or property resulting from any ideas, methods, instructions or products referred to in the content.