Article

Sustainable Application of Automatically Generated Multi-Agent System Model in Urban Renewal

Faculty of Engineering and Information Technology, University of Pécs, 7624 Pécs, Hungary
*
Authors to whom correspondence should be addressed.
Sustainability 2023, 15(9), 7308; https://doi.org/10.3390/su15097308
Submission received: 8 March 2023 / Revised: 21 April 2023 / Accepted: 25 April 2023 / Published: 27 April 2023
(This article belongs to the Special Issue Urban Design for Sustainable Built Environment)

Abstract

:
As cities expand, many old towns face the threat of being renovated or demolished. In recent years, the drawbacks of extensive urban renewal have become increasingly apparent, and the focus of urban development is gradually shifting from efficiency to quality. This study aims to combine urban renewal with emerging technologies to address the dilemma between efficiency and quality in urban renewal. The study found that algorithm models based on graph theory, topology, and shortest path principles neglect the influence of internal states and visual features on pedestrian activity, resulting in lower simulation accuracy. Although incorporating internal states and visual features into the core of the algorithm further improved the simulation accuracy, the model operates in a 3D environment with lower efficiency. To address the problems of insufficient simulation accuracy and low efficiency, this study proposes a dynamic pedestrian activity model based on a multi-agent system and incorporating visual features. The model simulates pedestrian daily activity paths using pheromones and virtual sensors as the core, and it was found that using Visibility Graph Analysis could accurately divide pheromones in the environment, thus obtaining more accurate simulation results. Subsequently, based on the optimized pedestrian model’s agent activity rules and dynamic pheromone theory, a model for automatically generating road paving in urban renewal projects was developed, and the generated results were verified for their rationality through design practice. This technology can effectively promote urban renewal and the preservation of historic neighborhoods, providing technical support for achieving sustainable urban development.

1. Introduction

According to the United Nations, the proportion of the global urban population to the world population was 56% in 2021, and it is expected to increase to 60% and 68%, respectively, by 2030 and 2050. Among nations, China’s urbanization trend is particularly evident, and researchers predict that the total urban population in China will increase by 255 million by 2050 [1]. As urbanization continues to develop, the function of urban renewal is becoming increasingly prominent. It is considered an effective method for increasing land value, improving environmental quality, and strengthening social connections [2]. Faced with limited productivity and the rapid growth of urban renewal projects, some cities in China blindly pursued design efficiency and extensively adopted the approach of massive demolition and reconstruction to update the outdated urban areas [3]. In recent years, the drawbacks of extensive renovation methods have become increasingly apparent in urban renewal, such as erasing historical memory [4], polluting the environment [5], damaging social stability [6], and wasting resources [7]. China’s urban development is gradually shifting its focus from quantity to quality [8,9], which has led to an increased emphasis on urban renewal and preservation as important factors for evaluating urban quality [10]. However, traditional design methods limit design efficiency. With increasing work pressure, designers have no extra energy to improve the design quality of projects, leading to a dilemma between protection and reconstruction in urban renewal [11].
The fourth industrial revolution has brought about significant changes to people’s lifestyles and work patterns [12]. This study aims to combine urban renewal with emerging technologies to address the dilemma between efficiency and quality in urban renewal. Huang used a wind environment model based on the relative warmth index to analyze the thermal comfort of the Qi-lou column space in Nanning. He started from aspects such as building materials, structure, and layout, effectively improving the thermal comfort of the research object [13]. Bazazzadeh investigated the impact of spatial visual attributes on human perception and proposed the use of a Visibility Graph Analysis (VGA) to optimize the spatial layout in order to improve user perception and promote sustainable development of industrial heritage sites [14]. Rao used the spatial syntax of the “all line” to analyze the spatial layout and usage characteristics of Huzhai, a traditional building in Eastern Zhejiang, under the influence of the clan system [15]. The combination of computer models and urban renewal has, to some extent, promoted the development of both the renewal and preservation of outdated urban areas [16]. However, most research needs to be completed on existing analysis software platforms. These static models based on graph theory [17] and topology [18] can only output fixed results, lacking creativity [19]. Building a dynamic model with automatic generation capabilities is of great significance for improving the efficiency of designers.
Currently, most dynamic multi-agent models are used to predict macro-level changes in urban development [20,21], yet they overlook the potential application of this technology in micro-level urban construction, such as streets, public spaces, and green landscapes. Evacuation models are most commonly studied at the micro-scale, with the shortest path algorithm as the core representation of activities, ignoring the influence of internal states and vision on activities [22]. Therefore, Karoji developed and improved a pedestrian simulation model for commercial environment simulation and integrated the dynamic internal states of pedestrians into the simulation model [23]. Based on the concepts of prospect and refuge, Hwang [24] proposed a computational algorithm for 3D visual simulation and privacy quantification based on the Grasshopper platform. Incorporating internal states and visual characteristics into pedestrian models further improves the simulation accuracy [23], but building the required 3D environment for simulation and the slow speed of analysis increases the workload of designers. Moreover, the above models still belong to the category of evaluation and analysis and cannot automatically generate corresponding design results.
To address the issues of inadequate accuracy in evacuation model simulations and low efficiency in 3D modeling, this study proposes a dynamic pedestrian activity model based on a multi-agent system that incorporates visual features. The research first conducts a survey of pedestrian activity paths in historical blocks to identify the significant influence of visual factors on pedestrian behavior. The survey results serve as the foundation for model development and also as a critical reference for verifying simulation accuracy. By comparing simulation results under different parameters with actual pedestrian activity paths and using VGA to refine static information in the simulation environment, the study obtains simulation results that closely match reality paths. Subsequently, based on the optimized agent activity rules of the pedestrian model and dynamic pheromone theory, the study develops a model that automatically generates road pavement in urban renewal projects. By constructing a simulation environment conducive to agent interaction through dynamically distributed pheromone, the model achieves its goal through competition, stimulation, and optimization. The study ultimately verifies the rationality of the generated results through design practice and demonstrates that the automatic generation model is more efficient, cost-effective, and widely applicable than traditional design methods. This technology can effectively promote urban renewal and the preservation of historical blocks and provide technical support for achieving sustainable urban development.

2. Algorithm Model

2.1. Definition of Model

Scientific modeling is created to study complex systems and gain insight into reality, and it is frequently an abstraction of real-world phenomena [25]. There are various forms of models for different purposes and usage scenarios, such as a flexible language model, a rigorous mathematical formula [26], a physical equation reflecting real-world movement, a statistical formula expressing social development [27], a digital or physical building model that conveys design concepts and effects, an algorithmic model that analyzes site conditions and evaluates design effects, or a computer intelligence model for automatic design generation. Models come in various styles, but their purpose is to offer a clear and visual representation of a theory or concept [28].

2.2. Multi-Agent System Model

Minsky proposed that complex systems are made up of various, precisely defined, tiny agent units. In the simulation process, multiple agents act autonomously, and all the agents are updated asynchronously, in parallel [29]. Simple agents are capable of creating complex structures, and intelligence can be explained as the result of a combination of non-intelligent agents. This complex structure is referred to as a Multi-Agent System (MAS) [30]. The history of programmable agents dates back to 1951, when John von Neumann introduced the concept of Cellular Automata (CA) to elucidate neural processes in the brain [31]. While his automata models were less complex than biological systems, studying living organisms contributed to the advancement of more sophisticated automata models [32]. Building on von Neumann’s theory, John Conway developed the first implementation of CA in the 1960s, which became known as the famous Game of Life [33]. The Game of Life can generate remarkably intricate and enduring dynamic patterns through the basic and systematic switching of cells. According to Rodrigues and Raper, the concept of CA shares many similarities with the concept of agents, and it can be categorized as a subtype of MAS [34]. Russel and Norvig define an agent as something that can perceive and act [35], while Wooldridge describes an agent as a computer system located in an environment in which it can act independently to achieve its design objectives [36]. MASs exhibit several characteristics, including autonomy, adaptability, intelligence, reactivity, initiative, social competence, and goal orientation [37]. The versatility of MASs in addressing distributed problems in dynamic scenarios has led to their widespread adoption across diverse fields [38]. These applications can be broadly categorized as models for simulating and comprehending natural systems, and models of artificial systems for resolving complex problems and generating solutions [39]. Therefore, cellular automata have also been used for optimization in urban growth models. Feng proposed that incorporating a spatial heterogeneity-weighted neighborhood into cellular automata could effectively simulate dynamic urban growth [20]. Later, he also suggested using cellular automata and particle swarm optimization rules to model dynamic urban growth [40]. Liu used long short-term memory network models and cellular automata to simulate dynamic urban expansion under ecological constraints [21].

2.3. Urban Design with MAS

Raisbeck acknowledges the potential of MAS in urban design, which allows for bottom-up modeling of cities through simulation and optimization of motion, structure, and pattern formation. However, he notes that MAS is still in an exploratory stage and its most successful applications have been in pedestrian movement and evacuation studies [41]. These research methods are mainly used in urban simulation in the macroscopic field and building simulation in the microscopic field. In terms of micro-simulation, current simulation systems are usually related to user behavior, such as pedestrian flow or evacuation simulation [42]. Penn and Turner’s model, based on Space Syntax Theory of VGA, proposed that stopping and congestion would affect the agent motion simulation. This research improves the similarity between model simulations and consumers movement patterns. Turner also introduced a dynamic agent-based model that enabled visual analysis of aggregated spaces in architectural environments [43]. Kitazawa and Batty applied the agent model to the field of micro-behavior simulation. The agent model uses the shortest-path model as one of the evaluation criteria of Genetic Algorithms, and uses the agent model to simulate the behavior of consumers [44]. In addition, some agent models are developed and formed on the basis of fluid dynamics, particle systems, and self-organization theory [45]. Although there are many analytical MAS models related to pedestrian movement, evacuation, and crowding, there is a growing trend to use agents in the generative design process [19]. Resnick, based on the turtles language, invented a simple and powerful application combining mobile agents and CA-StarLogo [46]. StarLogo is the predecessor of NetLogo. As a common MAS construction and operation platform, NetLogo has been widely used in various fields.

3. Research Methods

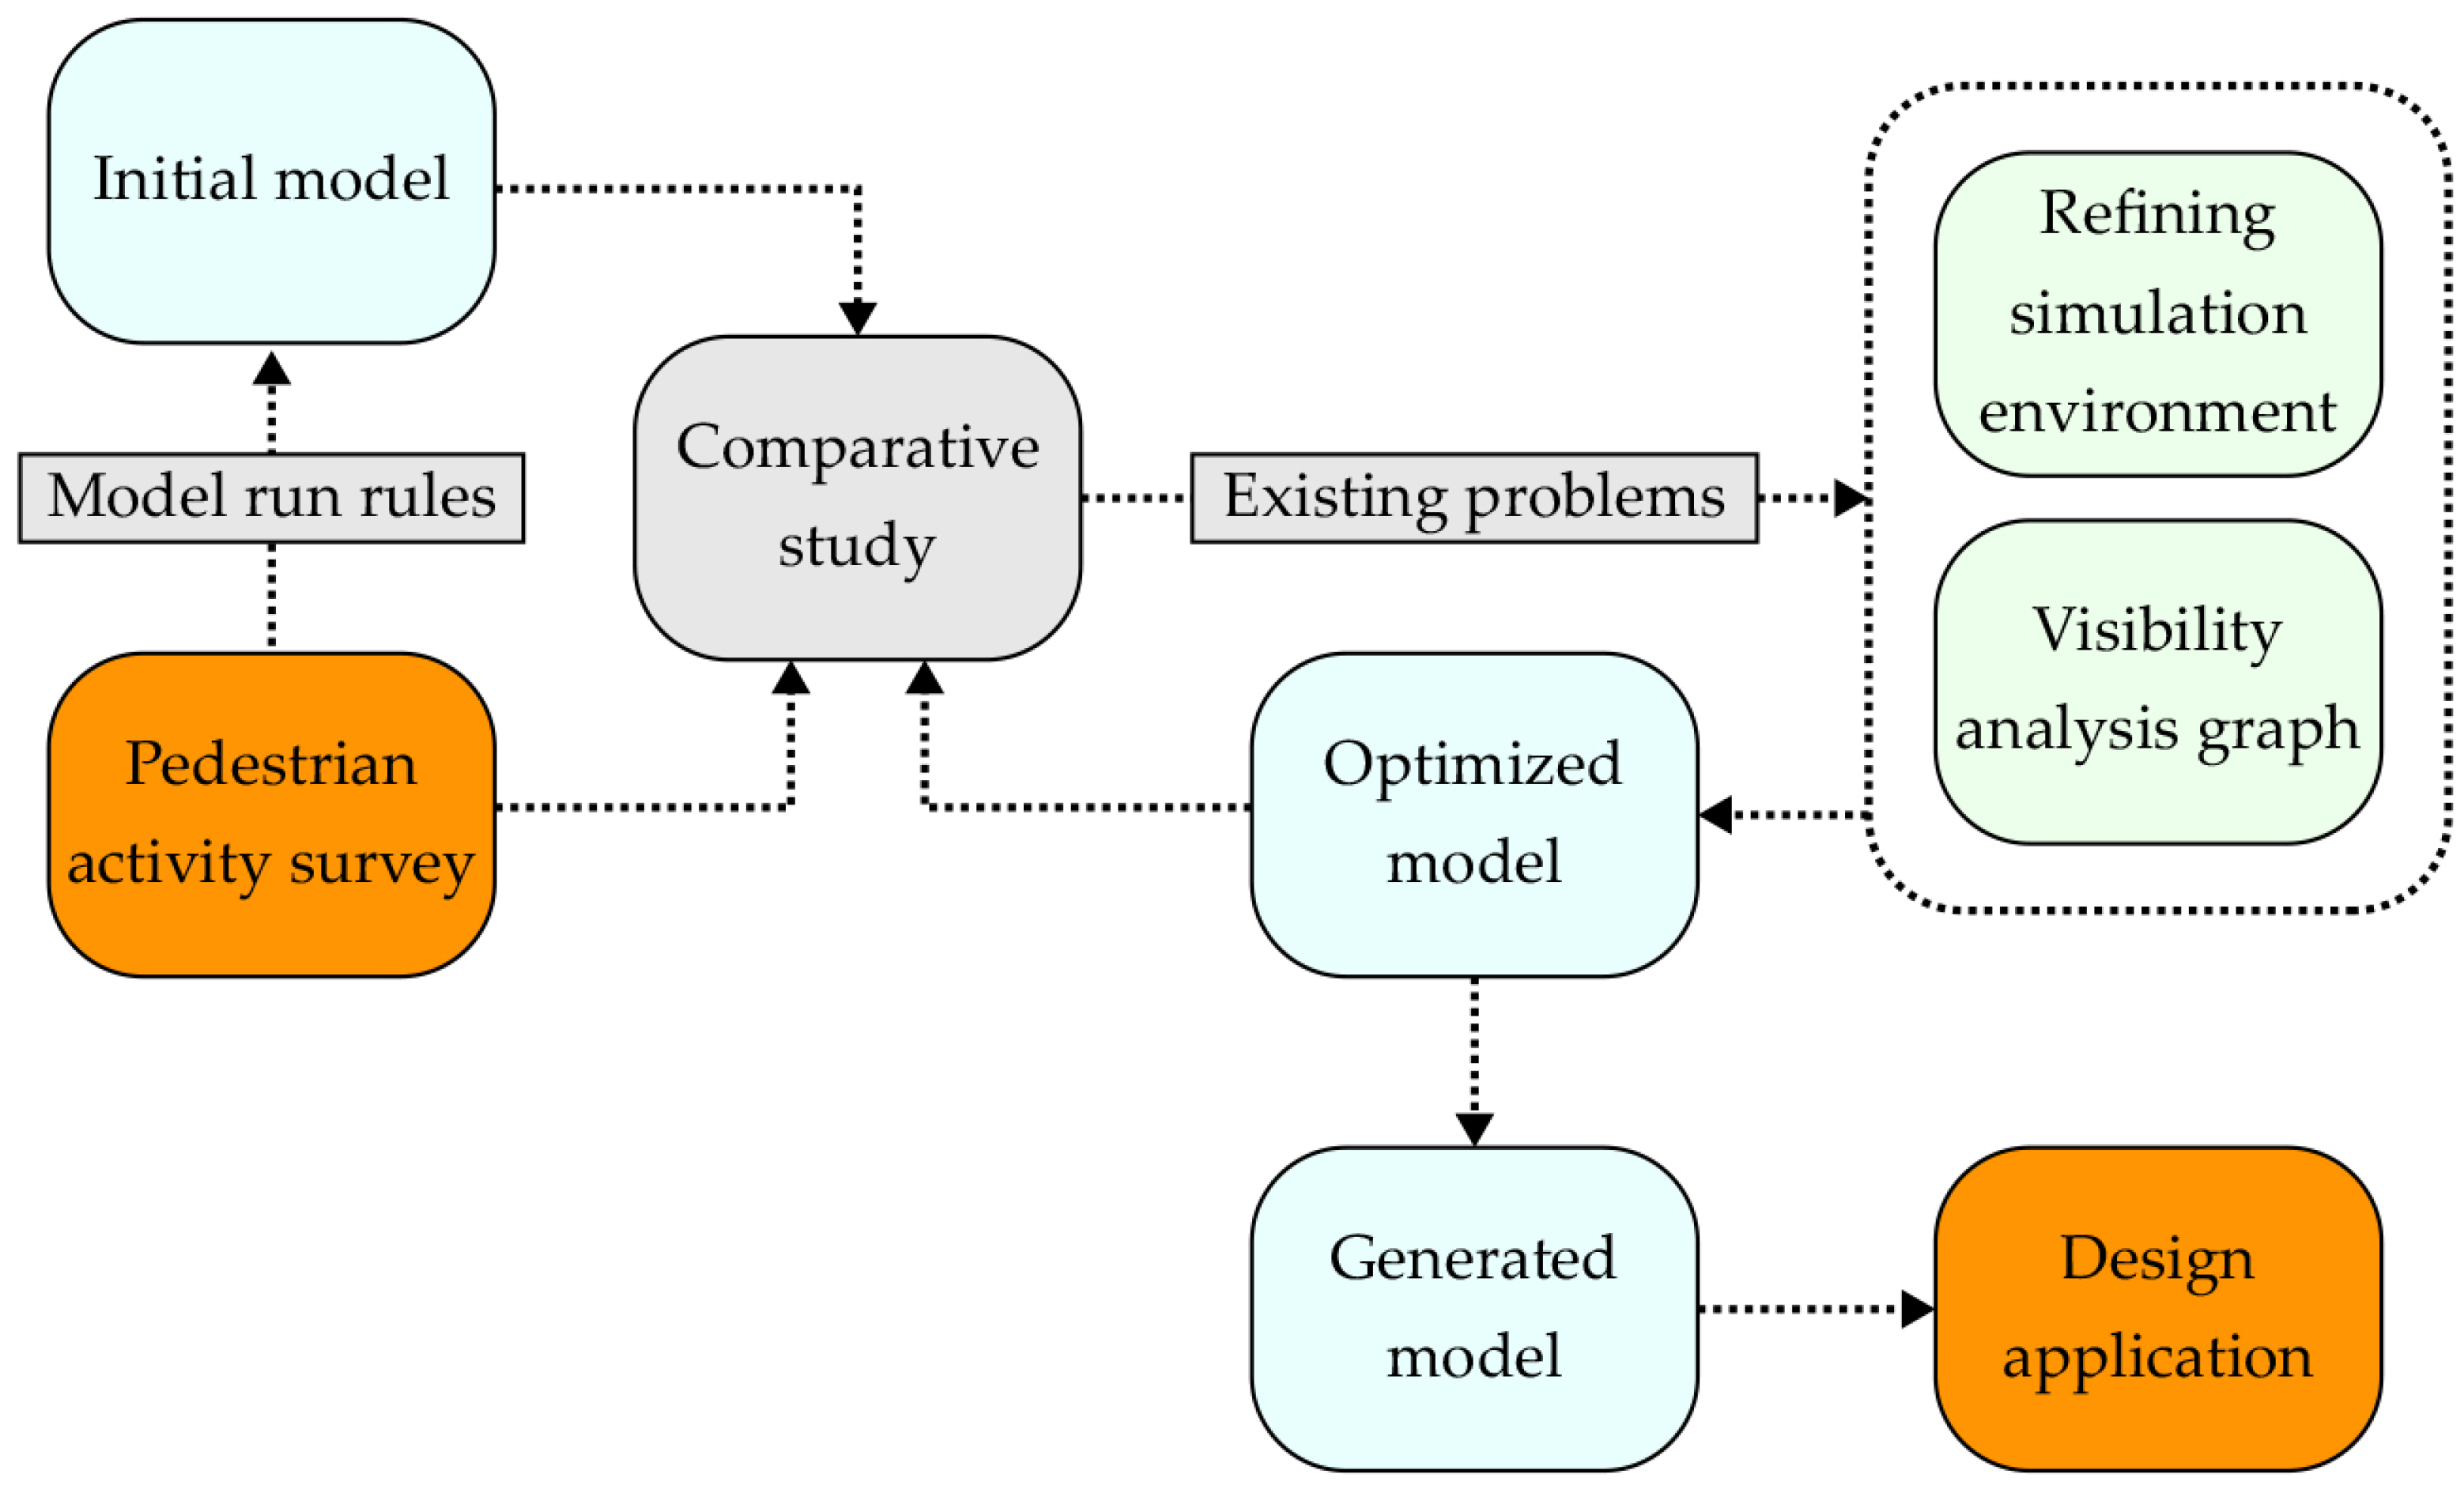
3.1. Research Framework

The aim of this study is to use MAS to assist designers in updating outdated urban areas. To achieve this goal, a series of experimental methods such as field research, comparative studies, and data quantification were adopted to establish a reasonable algorithm model and integrate simulated and on-site results into actual design projects. The study first explores the use of MAS to simulate pedestrian activity. Zhanjiang Minzhu Road was used as a case study example in this current research. Due to the limited width and dominant straight roads of historical streets, even minor changes in the environment can have a significant impact on simulation results. These simulation conditions provide a favorable environment for training MAS models with accurate predictive capabilities. In the initial investigation, the team conducted field research on the historical block. The research focused on investigating the site environment and recording the status of pedestrians in the environment. This information formed the basis for building the basic MAS model. Subsequently, researchers used the data collected on site to compare and study the simulation results, focusing on the correlation between simulated and real paths and the different proportions of destinations in agent simulations. This method was used to evaluate the accuracy of the simulation results. Based on the shortcomings found in comparative experiments, the researchers proposed an optimization method to refine environmental factors for better simulation results. However, the limited space in historical street reconstruction projects makes it difficult to construct an automated model that can reflect the actual functionality of the model itself. Therefore, the square space of the important urban renewal project, the Huizhou Jiangbei Sports Center, was selected as the research object for developing an automatically generated model. Based on the optimized pedestrian model, the authors constructed an MAS model that can automatically generate design results, exploring the potential applications of the model in design practice (Figure 1).

3.2. Site Analysis

The Minzhu Road historical district activation project is situated in Zhanjiang City, China, encompassing four streets covering an area of approximately 1 square kilometer. Three north–south roads, namely Heping Road, Minzu Road, and Minquan Road, run from west to east, while the east–west horizontal road is named Datong Road (Figure 2). The district is situated in the old town area, which suffers from outdated infrastructure and inconvenient transportation [47]. The area was chosen as the research object due to the presence of over 100 unique historical buildings, most of which comprise ground-floor shops and upper-floor residential areas, featuring an arcade-style building, known as “Qi-lou,” where the corridor section extends towards the store facing the street [48]. The Qi-lou buildings date back to the 1820s, during which, the city was occupied by France, and the architecture reflects a fusion of French and local styles. With a subtropical climate, Zhanjiang experiences hot and rainy weather throughout the year, making the corridor an ideal location for people to avoid rain, harsh wind, and sunlight [13]. However, with time, the Qi-lou buildings were no longer able to meet people’s daily needs, leading to their abandonment and poor preservation. These buildings were repurposed as stores, such as electrical stores, furniture stores, breakfast stores, variety stores, and antique stores, which represented a waste of historical buildings. Additionally, shopkeepers partitioned the interconnected corridor areas, occupying the public area of the corridor as a private store area, leading to damage to the structural characteristics of historical buildings. Some buildings collapsed, and their owners replaced them with new buildings, which conflict with the overall landscape of the historical district, resulting in a negative impact on the environment. Thus, the Minzhu Road historical district activation project aims to develop a suitable business combination to attract more people and maintain the vitality of the area, while preserving the characteristics of the historic district and more capably integrating it into people’s daily life.

3.3. Pedestrian Activity Survey

At the outset of the study, the authors utilized video recording and personal tracking methods to collect data on pedestrian activity in the Minzhu Road pedestrian district. A total of 48 pedestrians were selected as subjects from eight block entrances to record their movement paths, including passing pedestrians and tourists (Table 1). Each subject was equipped with a miniature action camera to capture their visual history, and the authors would follow the person and record their movements using a mobile phone video (Figure 3). The study primarily examined the ways in which the environment interferes with pedestrians’ internal states through visual factors, thus affecting their movement. The collected behavioral data served as the basis for building a simulation model, and the trajectory was compared with the simulation results to evaluate the accuracy of the pedestrian simulation [23]. The recording experiments were conducted according to the following rules:
  • The study was conducted in the Minzhu Road pedestrian street area, which prohibits motor vehicles from entering to reduce the interference of other modes of transportation with pedestrian routes.
  • The study was chosen to be conducted on cloudy days or in the afternoon to avoid pedestrians moving to shaded areas and to reduce the impact of weather on pedestrian activities.
  • The area was divided into a square grid with a resolution of 1.2 m per square to record the movement paths.
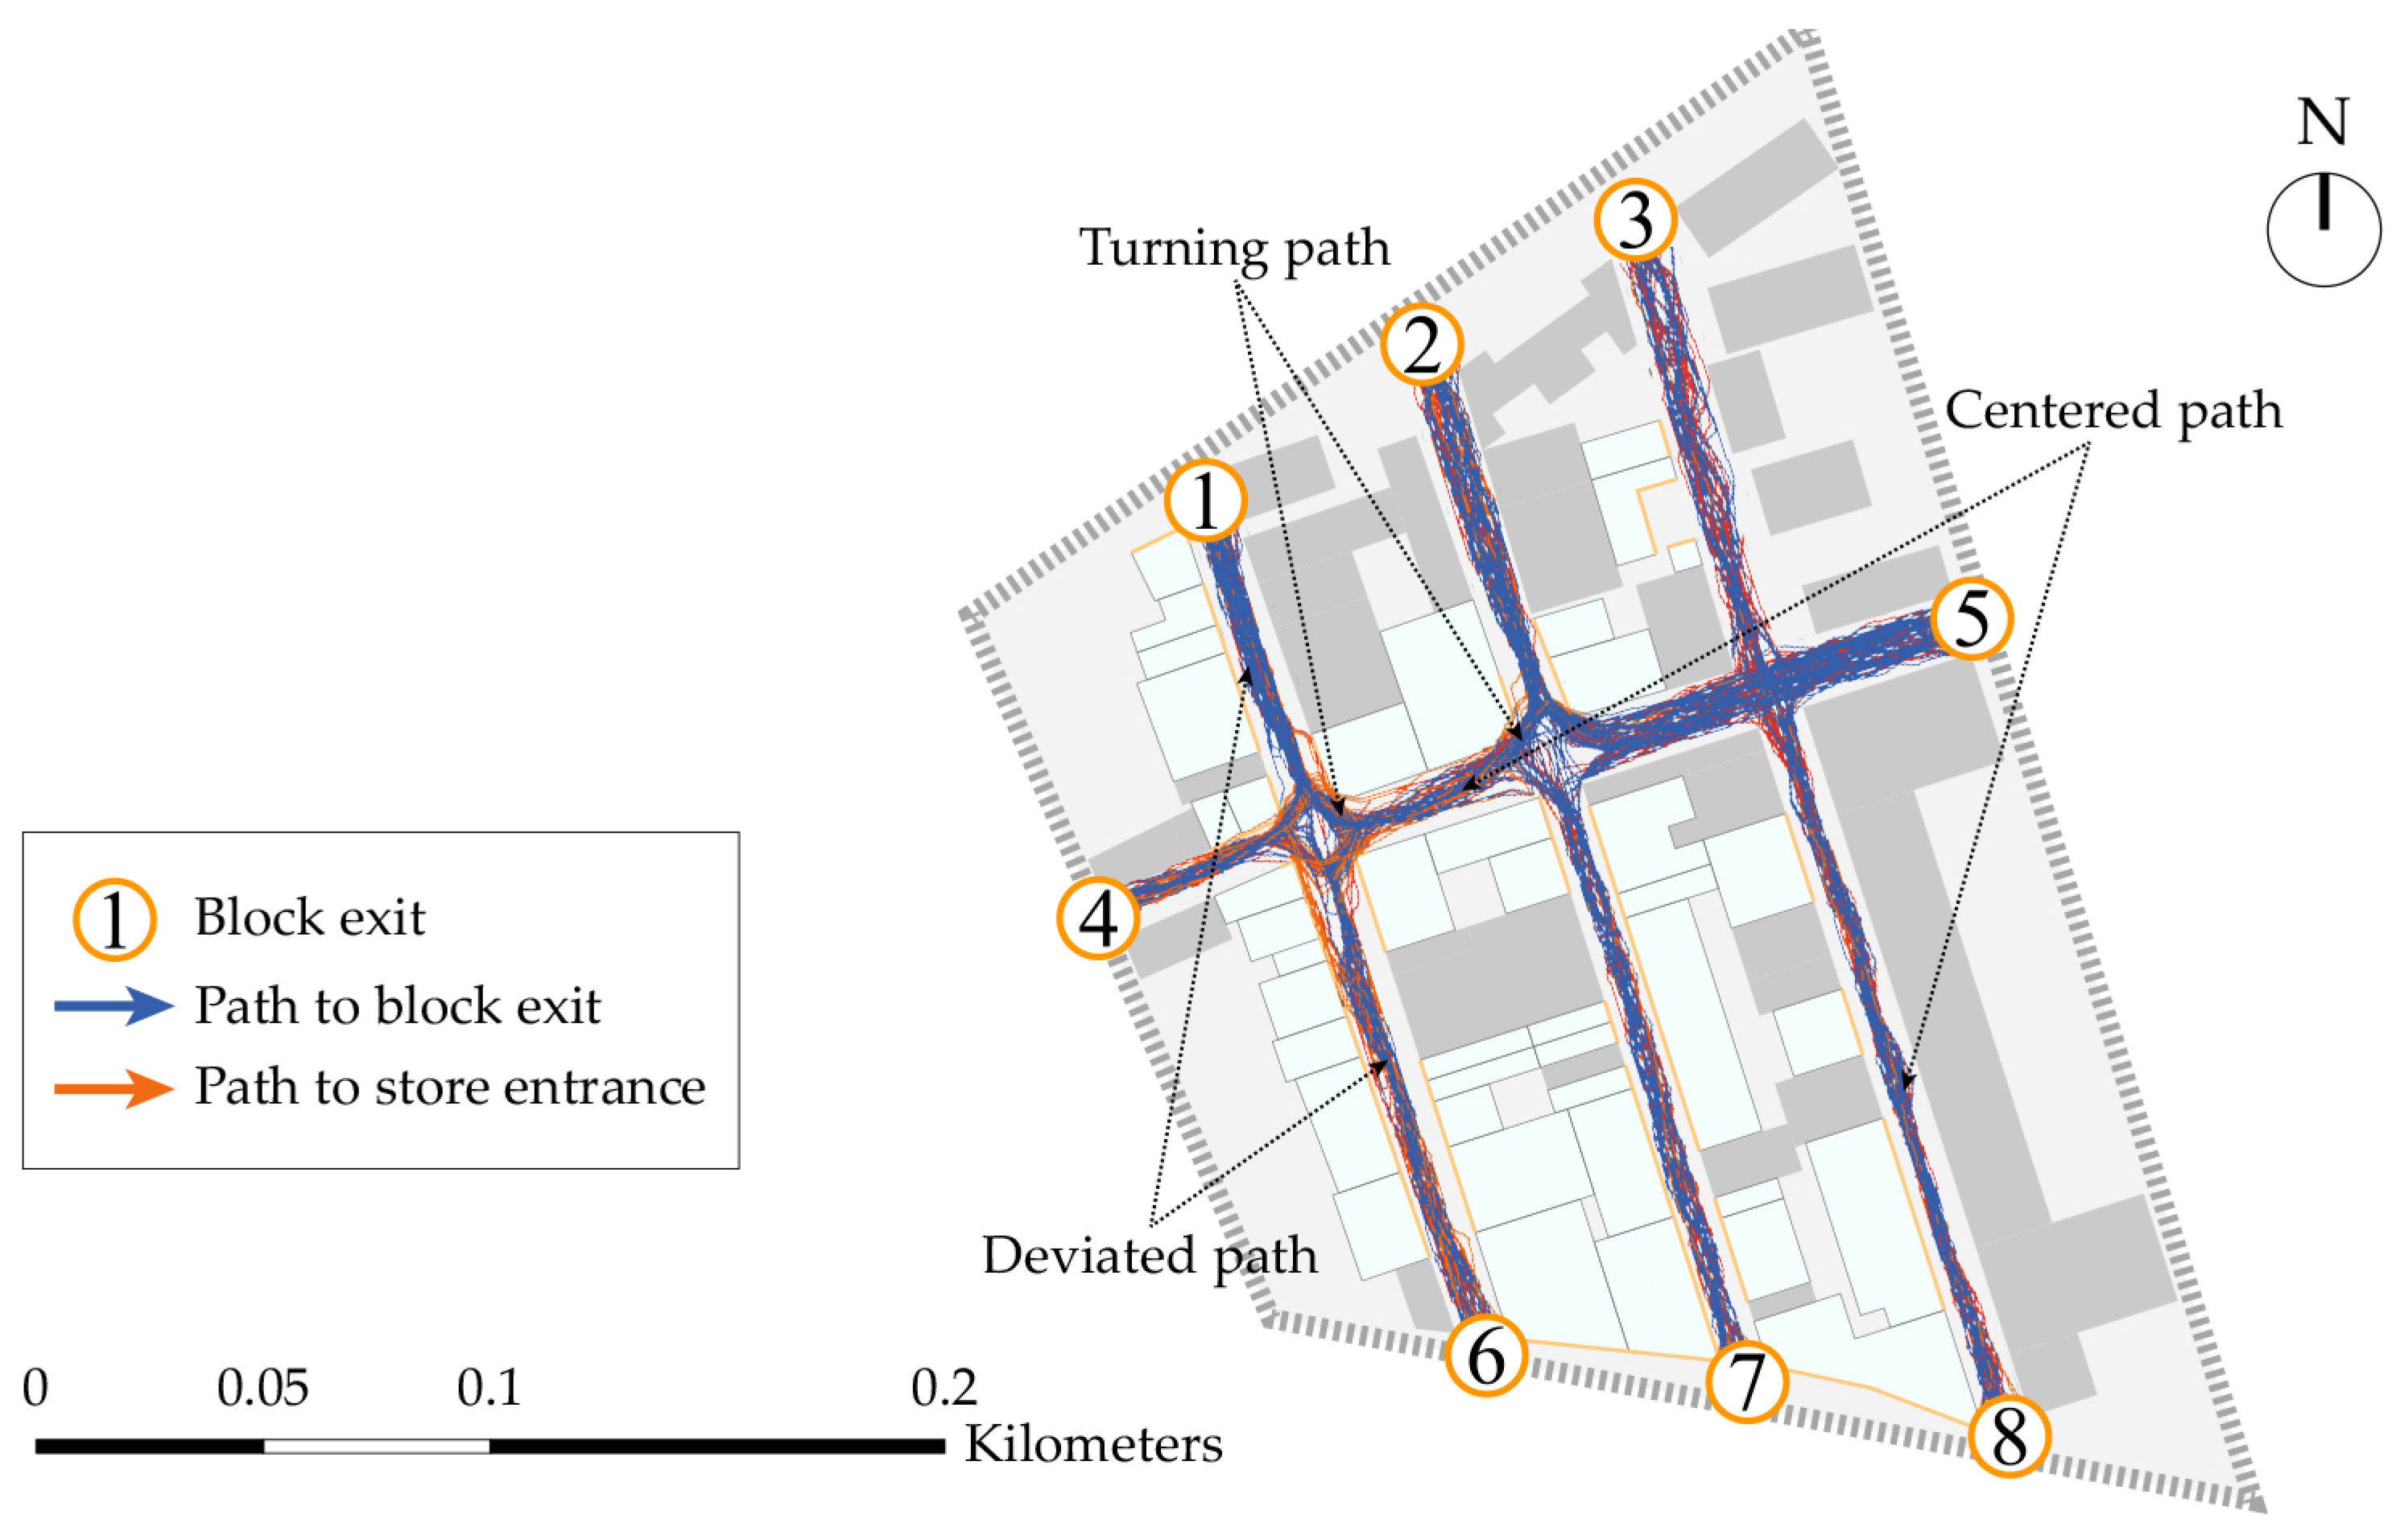
  • Turning directions were simplified into eight directions (east, south, west, north, northeast, southeast, southwest, northwest) (Figure 4).
  • The recorder followed the research subject for video recording, and maintained at least a two-meter distance between the recorder and the research subject to reduce the interference of the experiment on pedestrian activity and decision-making.
  • Subjects were required to inform the authors about the factors that led to changes in their movement.
  • The experiment ended when the recorded subject entered a store or reached the area exit.
After analyzing the pedestrian trajectories collected, the following findings were noted (Figure 5): First, a large number of turns occur at the intersection of Heping Road and Minquan Road. Pedestrians here are more likely to turn than to continue moving in the original direction, possibly due to the narrow width of the intersection. In contrast, the intersection of Minzu Road is wider, allowing pedestrians to obtain more environmental information and maintain their previous activity mode. At smaller intersections, pedestrians, especially unfamiliar tourists, tend to turn to obtain more environmental information.
Second, pedestrian activity paths on Minquan Road and Datong Road are concentrated mainly in the middle due to their narrowness. This is especially true for surrounding residents who use these roads frequently. However, tourists tend to swing forward because of the irregular distribution of historic buildings and high-rise residential buildings on these two roads, with tourists more likely to be attracted to historic buildings.
Third, the above observation is evident in the pedestrian activity paths on Heping Road. The western side of Heping Road is lined with historic buildings, while the eastern side comprises high-rise buildings. Pedestrian activity paths tend to be influenced towards the side with the historical buildings. The authors hypothesize that this could be due to subconscious behavioral habits. However, in some road sections, it can be observed that some pedestrians concentrate on one side, even when they are walking on the left side of the road, which cannot be explained by behavioral habits (Figure 6).
To explore the visual changes in pedestrian activities in traditional Korean places, Hwang developed a computational algorithm that can quantify the foreground and privacy of pedestrians’ vision [24]. Based on this, Karoji developed a pedestrian simulation model that can be used for commercial environment simulation, and integrated the dynamic internal state of pedestrians into the simulation model, emphasizing the important influence of visual intervention on pedestrian activities [23]. He believes that the areas where stores disseminate information (store windows and billboards) are often more attractive to passersby. In addition, the distance between the information and the pedestrians is an important influencing factor. Kent and Schiavon developed a computational method to quantify the distance between window views and residents, called Observer Landscape Distance (OLD). The study also emphasized the importance of visual factors and found that residents prefer to view urban features from a distance, but the same recommendation does not apply to natural environments [49]. After analysis and research, the authors identified three main reasons for this phenomenon. First, pedestrians’ attention may be drawn to the interior environment and advertising signs of the shops, but the external corridors and environmental interferences (such as trees and utility poles) of Qi-lou architecture hinder their observation, forcing them to approach one side of the shops to obtain effective and continuous visual information. Second, for tourists, the exquisite architectural structures and decorations of historical buildings convey rich visual information and are more attractive. Third, the large volume of high-rise residential buildings requires pedestrians to maintain distance in order to obtain more effective visual information.

4. Research and Analysis

4.1. Predictive Model Construction

The authors developed a pedestrian activity MAS based on the NetLogo platform (Table 2). NetLogo is a multi-agent programming language and modeling platform used to simulate natural and social phenomena. It has the capacity to control thousands of agents at the same time, effectively simulating the behavior of micro-individuals and macro-patterns, as well as their relationships. The MAS consists of three main modules: turtles, patches, and observers. In the software, dynamic agents are called turtles, which represent pedestrians in the simulation. Patches are small squares that form a 2D plane when divided by an orthogonal grid, providing the background for the agent activity. The observer is the manipulator that controls the turtles and patches, and has the ability to temporarily change the parameters during the simulation process, which is beneficial for the correction of model operation [50].
First, the study locates different areas within the site by changing the patch colors, such as entrances, points of interest, and obstacles. Corresponding pheromone levels are assigned based on the characteristics of each area, such as higher pheromone levels for points of interest and negative pheromone levels for obstacles. These static pheromones are not affected by agent activities and are currently only used for basic agent navigation. Second, adding commands to the agents’ activities is crucial, such as controlling their basic movements and target search. During the field investigation, the authors found that pedestrians do not move in a straight line when walking on the street, but rather exhibit small random sways. To simulate this characteristic, random commands are used to control agents to perform low-frequency, small sways. The randomness in agent activity increases the uncertainty of simulation results, which can inspire different simulation outcomes. The agents’ search for targets and avoidance of obstacles are mainly achieved through virtual sensors and the difference in pheromones between patches. Virtual sensors are set in a triangular area in front of the agent, simulating the pedestrian’s visual field. During agent activity, if there is a difference in pheromones in the sensor area, the agent is more likely to move towards areas with higher pheromones, thereby achieving the effect of searching for targets and avoiding obstacles. Thirdly, both stochastic parameters, such as the number of agents, wandering angle, and turning angle, and fixed parameters, such as the angle and depth of virtual sensors, can be adjusted in the observer. The authors compared the simulation results obtained under different parameters with the field investigation results to find a parameter combination that reflects reality and conforms to human observation and activity patterns. In the setting of virtual sensors, horizontal viewing angle and visual distance are two important parameters. The simulation results are closest to the field investigation results when the angle is 120° and the distance is between 10 and 16 m. A viewing angle of 60° is generally comfortable, and the effective viewing angle is 120°. Additionally, people can recognize the accurate 3D information within 11 m, but only the basic 3D information can be recognized up to 20 m [51]. Thus, the optimal parameters for the virtual sensor’s angle and depth conform to the observation rules of pedestrians.

4.2. Comparative Analysis

By comparing the simulation results of the initial model with the recorded pedestrian activity paths on site, it can be observed that the model captures certain patterns that reflect the physical environment and human behavior. Specifically, the simulation paths on both sides of Heping Road show a westward shift, indicating the attraction of historic buildings to pedestrian activity. This finding aligns with the recorded pedestrian activity paths. Moreover, the simulation paths on the north side of Minzu Road exhibit a dispersed pattern, while the south side of Minquan Road shows a concentrated and slightly oscillating pattern, both of which match the recorded results perfectly. Similarly, the simulation paths of Minquan Road display similar characteristics to those of Minzu Road, consistent with the recorded results.
However, the simulation paths on Datong Road present a different pattern than what was recorded on site. While the recorded activity paths showed a dispersed pattern on both ends and a concentrated pattern in the middle, the simulation results showed a gradual eastward divergence, which suggests that the model may not fully capture the complexity of human behavior in this area. At the intersections of Heping Road, Minzu Road, and Datong Road, the simulation paths exhibit frequent turning, which is consistent with the survey results. However, the simulation paths at the junction of Minquan Road and Datong Road did not show frequent turning (Figure 7).
Additionally, the on-site survey also counted the number of pedestrians entering shops and reaching the exits of the block, which can reflect the proportion of different groups of people with consumption behavior and passing behavior in the environment. Among them, the number of people entering the shops was 11, accounting for 23% of the total number of people. However, in the simulation results, the proportion of pedestrians consuming only accounted for 16% of the total number of pedestrians, which does not match the actual situation. Further optimization is needed to improve the simulation’s accuracy in reflecting the different types of pedestrian behaviors in the environment (Figure 8).

4.3. Predictive Model Optimization

4.3.1. Refining the Simulation Environment

In response to the issue of the simulation paths being too scattered in the middle section of Datong Road and too concentrated in the western section, the authors propose corresponding optimization solutions. The authors re-compared the areas where pedestrian paths are more scattered or more concentrated and found that they are mainly affected by the width of the environment. It is clear that on Minzu Road and Minquan Road, the north side is significantly wider than the south side. In the absence of obvious asymmetric pheromone interference, agents only need to walk in the middle of the road in a narrow space to effectively obtain information from both sides of the road; therefore, the agent’s activity path is mainly concentrated in the middle of the road. However, if the width of the road exceeds the agent’s field of view, it will trigger a series of random movements by the agent to obtain effective environmental information. The widths of the east, west, and central sections of Datong Road vary, as do the number of obstacles on either side of the road, including trees, streetlights, billboards, and utility poles. These obstacles not only restrict pedestrian movement but also affect their ability to gather useful environmental information, thereby impacting their activity patterns at a sensory level. The impact of obstacles on pedestrian movement is particularly pronounced on Datong Road, exceeding even the influence of environmental dimensions. While the east and west ends of the road are relatively open, the east section has a few large trees as obstructions, concentrated on the north side of the road, while the west section has few obstacles, only a small number of streetlights. It is worth noting that the width of the west section is only 9 m and there is no clustering of pedestrian activity paths, while the central section, with a width of 12 m, has clustered paths. The authors suspect that this is due to the many large trees planted on both sides of the central section of the road, which disrupt pedestrian activity. To prove this hypothesis, the authors measured the obstacles in the environment, classified trees of different sizes, and constructed a more detailed simulation environment to test whether more accurate simulation results could be obtained (Table 3).

4.3.2. VGA Optimized Model

The authors not only refined the simulation environment, but also aimed to find a quick method for evaluating the visibility of shops. On a commercial street, if a store has good visibility, it is more likely to attract pedestrians to enter [24]. However, this evaluation method needs to be linked with the MAS to produce an optimized effect. In 2017, Hu proposed a method using a combination of VGA and multi-agent model to improve the accuracy of pedestrian models [52]. However, this study lacks comparative research between simulated results and actual pedestrian paths, and the feasibility of the model needs further verification. The VGA algorithm model, which is used to evaluate spatial visibility, has the advantages of flexibility and convenience [14]. Additionally, VGA and the MAS in this study are both two-dimensional models that can be associated through planar analysis diagrams. First, the authors determined the valid area for agents to move in AutoCAD, including the block entrance, block space, and store interior. The authors then imported the modified plan into the DepthMap software to build the VGA. The obtained visibility evaluation map through the model calculation only needs to retain the street space part and then convert it into a grayscale image to reduce the complex colors’ interference to MAS. Finally, the VGA grayscale image is combined with the MAS map shape and imported again into NetLogo for simulation operation.
After comparing the optimized simulation results with the recorded paths, it can be found that the simulation results retain the original correct predictions and further improve the deficient parts. The simulated path in the middle section of Datong Road further converges towards the center, and there are signs of turning at the junction of Datong Road and Minquan Road, correcting the problem in the initial model where the agents would continue to walk straight ahead (Figure 9). In terms of data, the initial simulation results showed that the proportion of agents entering the shops was 14% of the total number of agents, while after optimization, the proportion of agents entering the shops increased to 22%, which is close to the field survey result of 23% (Figure 10).

5. Automatically Generated Model

5.1. Model Construction

The pedestrian path model constructed earlier can accurately predict pedestrian activity, but it cannot generate design results. The model achieves one-way interaction between agents and the environment, but it fails to achieve interaction between agents, the environment, and other agents. In other words, individual agents can change their behavior based on certain characteristics of the environment, but their activities cannot affect the environment or other agents. The automatic generation model is inspired by the Ant Colony Optimization (ACO), which is widely used for optimizing models related to path generation. For example, Srivastava’s research found that using ACO can optimize path models, and the optimized models have the ability to automatically generate optimal paths [53]. Sayyari proposed a pathfinding model based on ACO and model-based testing, which has faster running speed and greater coverage [54]. Qu proposed a hybrid solution using mutual learning and ACO (MuL-ACO) to simulate agent motion in uneven environments with various obstacles, and demonstrated that MuL-ACO can generate high-quality collision-free trajectories [55]. Agents can change certain characteristics of the environment through their activities, and the changes in the environment, in turn, affect the agents. Therefore, agents can use the environment as a medium to achieve communication, competition, stimulation, and optimization with other agents, generating infinite possibilities [56]. In addition, while the environment serves as a communication medium, it also serves as a carrier for recording agent activity paths, which is more conducive to the construction and use of infinite loop models. For these reasons, the authors added dynamic properties to the pheromones of the model’s patches based on the pedestrian activity model. After extensive comparative experiments, it was found that the effect was optimal when the three control variables, pheromone-per-step (PPS), minimum-route-pheromone (MinRP), and maximum-route-pheromone (MaxRP), were all set to 60. The model mainly distinguishes the pheromones of different states through three different patch colors: gray, yellow, and red (Table 4).

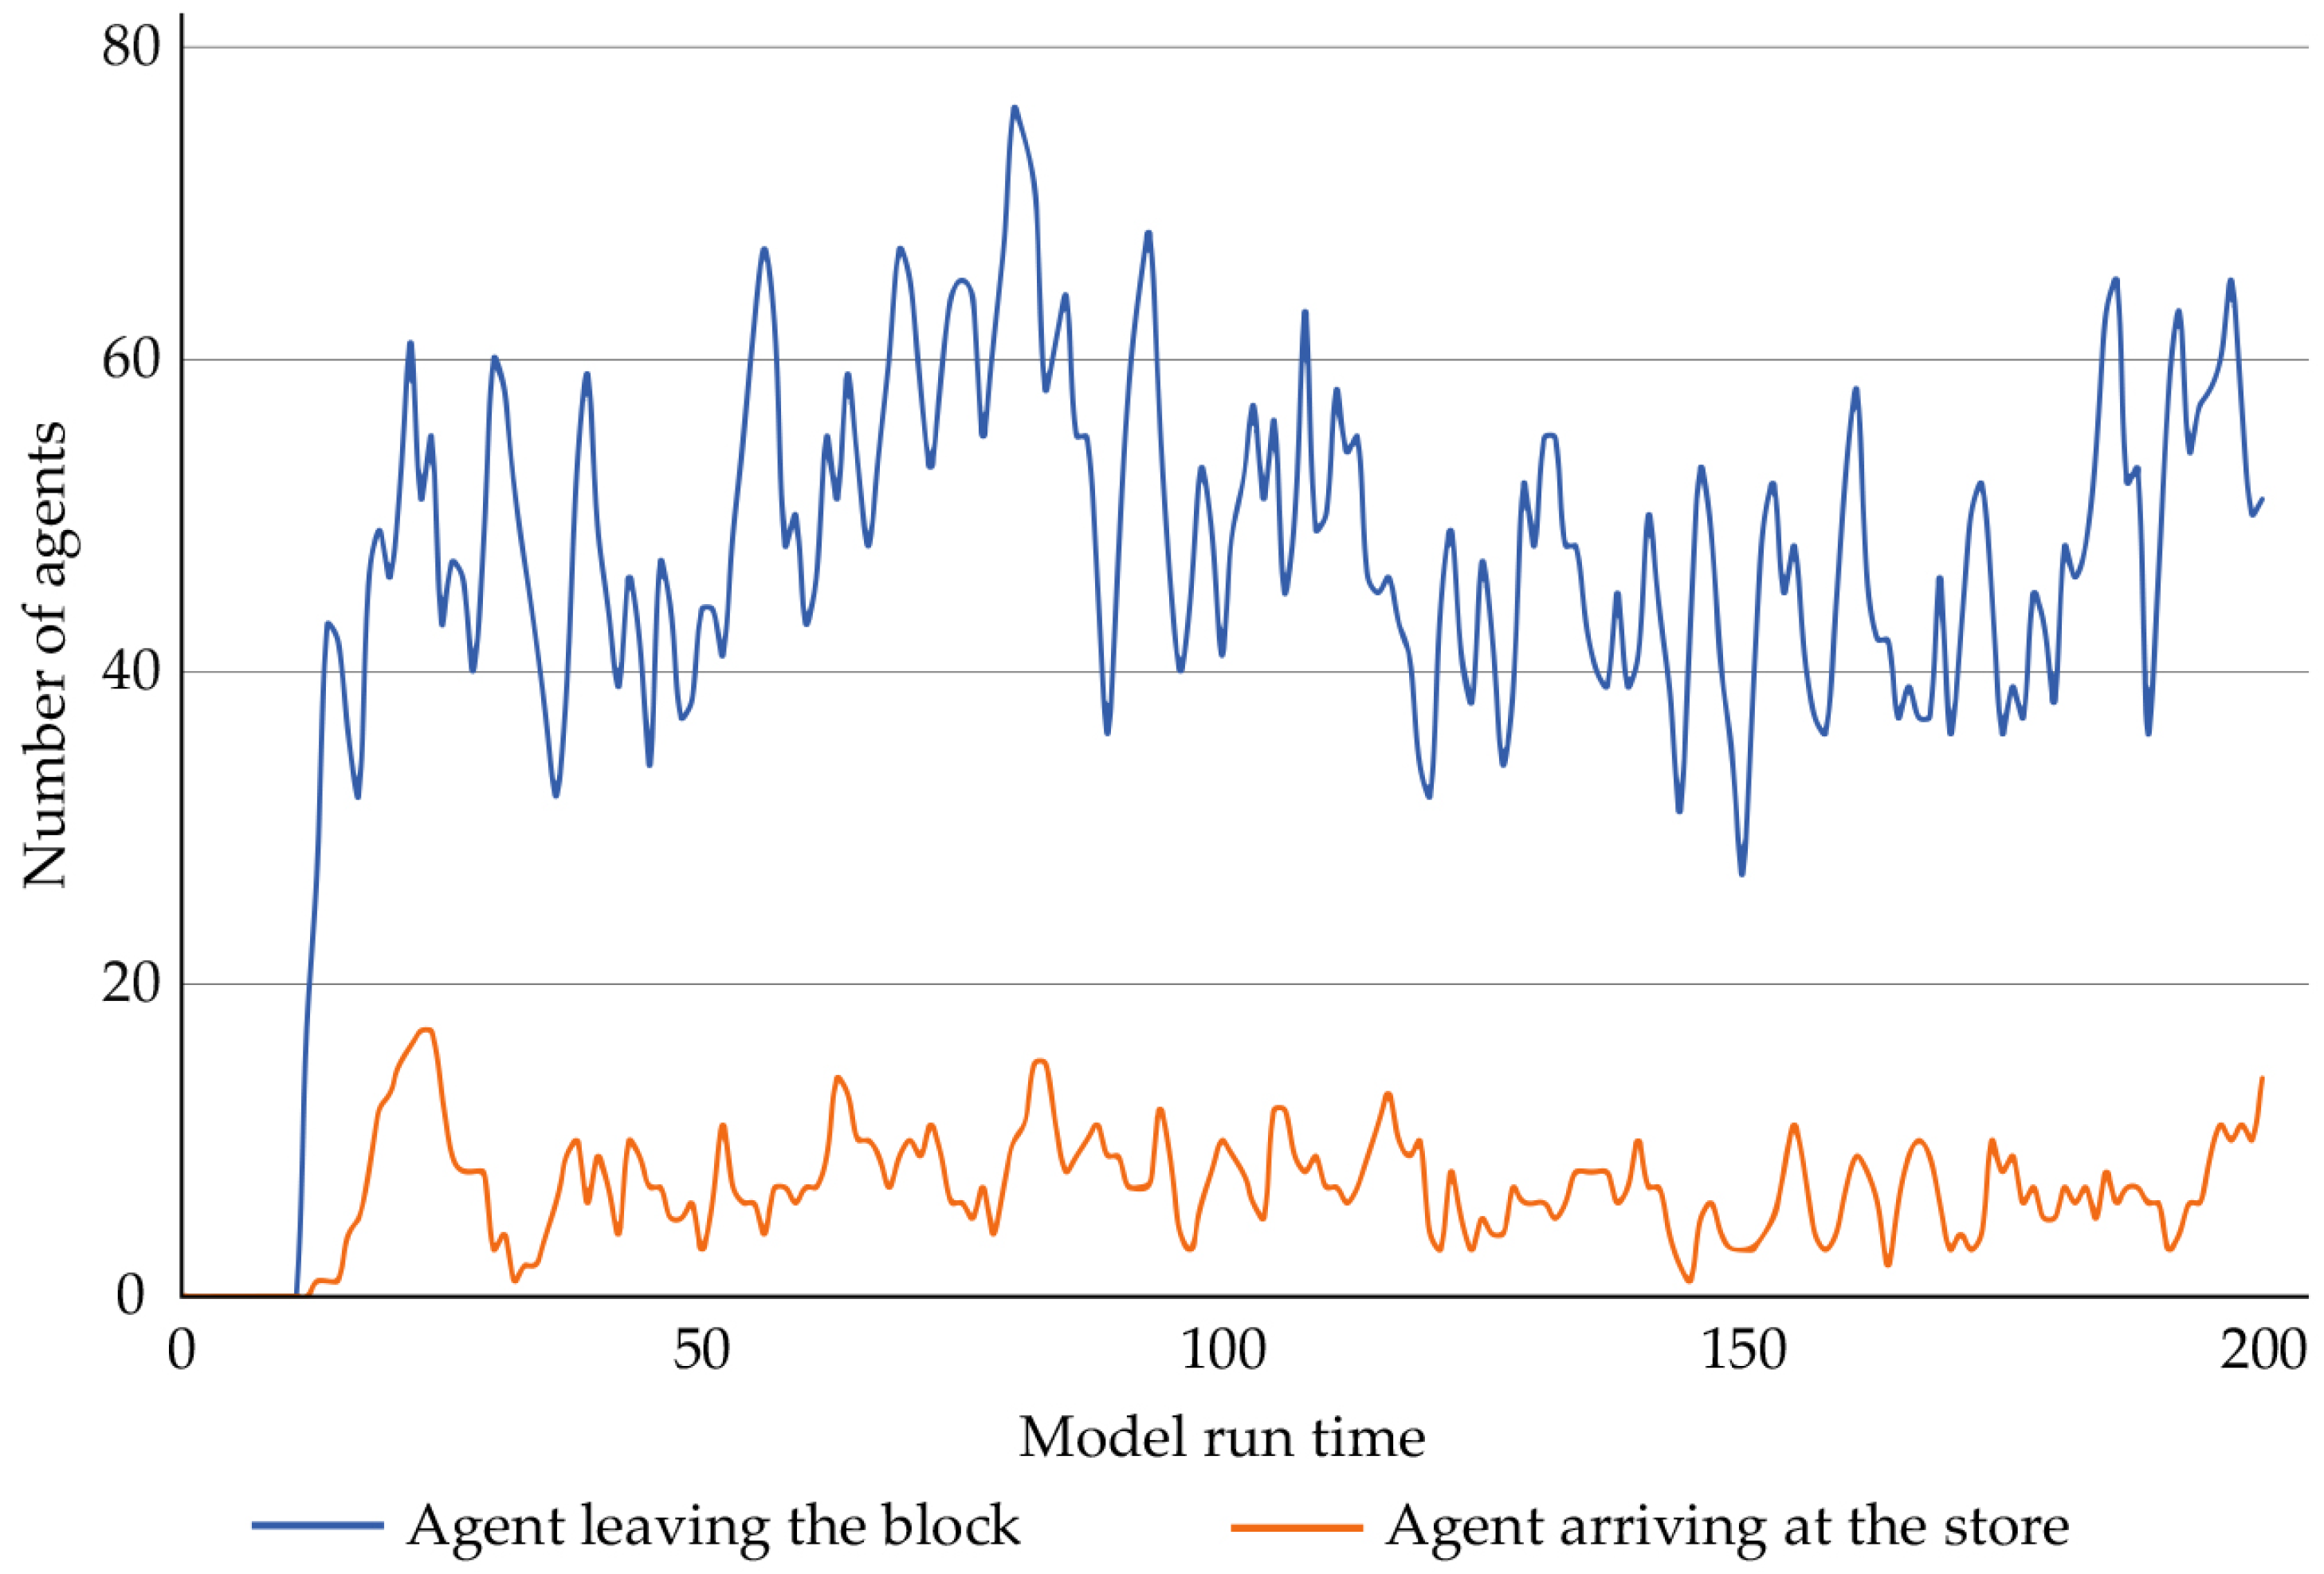
5.2. Model Experiment and Analysis

The model continuously refines and optimizes the agent’s activity path and patch structure during its operation. After loose red patches are eliminated and holes in the patches are repaired, the patch structure eventually stabilizes (Table 5). The study found that the patch structure becomes stable after 300 model runs. Therefore, when ticks are greater than 300, all agents and yellow patches in the environment are eliminated, and the model stops running at tick 320. The view only retains the red patch structure, which requires focused design (Figure 11).

5.3. Sustainability Design Application

In the 1950s, Walter Gropius proposed a method called “Disney’s road design” which aimed to provide visitors with a safe and peaceful environment by separating pedestrians and vehicles. This design maximizes the efficiency and enjoyment of visitors’ tours by utilizing a combination of circular and branching roads, thereby improving their mobility and sense of direction. In addition, he scattered grass seeds in the park, allowing visitors to freely walk on the grass when it grew, and based on the resulting worn paths, he designed the park’s roads [57]. Nowadays, the MAS model can accomplish the same tasks more efficiently and in a more environmentally friendly manner, eliminating the need for designers to wait for grass to grow. The simulation environment’s concentration of pheromones also replaces the worn paths, while countless agents offer designers numerous design options.
Furthermore, the authors compared 20 simulation results and found that even in symmetrical simulation environments, due to the agents’ entry positions and movements’ randomness, the resulting patch structures were not symmetrical. The simulation of this project also showed a combination of circular and branching roads. Most simulation results showed that one end of the plaza had a larger and hollow patches cluster, forming a circular road structure, while the other end had a branching structure of slender roads, facilitating connections to several critical nodes in the area (Figure 12).
Entrances 3, 5, and 6 in the Southwest Plaza connect the parking lot, Gymnasium Branch, and East Plaza, respectively. Residents around the Sports Center can enter the stadium through the West Plaza, while citizens further away will enter from the Southwest Parking Lot. As the space that can accommodate the most users, the Southwest Plaza is also the space that links multiple critical nodes, and a branching road structure can efficiently transport pedestrians to their respective destinations. On the other hand, the Northeast Plaza, although connecting the East and West Plazas, mainly connects the Running Track, Tennis Court, and Gymnasium Branch at locations 2, 4, and 5, where the crowd gathering capacity is weaker and pedestrian activity is more dispersed. Therefore, a circular road can be constructed in the Northeast Plaza to delay pedestrian activity routes, and new functions can be added inside the road’s inner circle to enhance space functionality, interest, and artistry (Figure 12). Based on the sports center plaza’s spatial characteristics, the authors selected a cluster of patches with a circular road in the Northeast and a branching road in the Southwest for detailed design. Based on positive and negative patch structure images from the simulation results, the sports center plaza can be upgraded through pavement, green landscapes, device installation, and lighting. Using circuit and tree-like patch structures, combined with the different characteristics of the Northeast and Southwest Plazas, targeted designs for different plaza areas can enhance their functionality and achieve a harmonious and coordinated art and functional design for the Sports Center’s space.

6. Discussion

6.1. Summary of Case Study

MAS can provide new intelligent models for solving complex design problems. Moreover, as a bottom-up, decentralized, self-organizing, and dynamic modeling approach, it fits perfectly with the characteristics of crowd activities and is applicable to urban renewal design.
This research takes Democratic Road Pedestrian Street as the site for constructing predictive models. Given the relatively simple spatial structure and limited area of the site, the simulation environment becomes highly complex due to the continuously changing historical buildings on both sides of the road and obstacles in the activity area. The aim of this research is to cultivate a highly sensitive pedestrian activity model in such a limited area with complex environmental changes. The authors identified two problems in the simulation results through the first round of comparative experiments: the inability to accurately simulate pedestrian activity on Datong Road and the inability to accurately reflect the proportion of pedestrians entering shops. To address this, the simulation environment was refined, and a static pheromone gradient was constructed using VGA to further refine the gravity in patches and achieve more precise path guidance. The authors verified the feasibility of VGA for optimizing MAS simulation results through the second round of comparative experiments, which also ensured the convenience, rationality, and accuracy of the model operation.
Although the pedestrian activity model can predict the activity status of pedestrians in a place with reasonable accuracy, it cannot complete the task of automatic generation. Therefore, the study proposes a model that can generate design results automatically based on the pedestrian activity model and a dynamically changing pheromone gradient. Agents can influence and change the environment through pheromones, and the environment’s changes, in turn, affect new agents. This interactive communication process is more conducive to stimulating competition, stimulation, and optimization of the model. Through a large number of iterations, the generative model eventually forms a relatively stable simulation result, which goes beyond the scope of design analysis and evaluation and moves towards a higher level of automatic generation. Subsequently, the authors demonstrated the feasibility of using the model’s automatically generated design results in actual projects through design practice. The model can effectively enhance designers’ work efficiency and reduce unnecessary waste during the design process. It has positive implications for urban renewal and historic district preservation, contributing to the achievement of sustainable urban development.

6.2. Significance of Automatically Generated Models in Urban Renewal

This study explores a practical application method that combines MAS with urban renewal design, and the ability to automatically generate design results undoubtedly has significant implications for liberating design productivity. The simulation results of the model are not fixed and can produce multiple different possibilities through multiple simulations. Users can choose the most reasonable simulation results for further design according to their needs. This can reduce the designer’s workload while inspiring their thinking and creativity through different design proposals.
The self-generating model developed in this study also demonstrates good applicability when facing different environments, and researchers do not need to readjust the parameters to obtain relatively reasonable and practical simulation results. At present, this model can be used to complete the work of positioning pavement, canopy, and greenery in urban public space design. Compared with traditional design methods dominated by empiricism, MAS has higher efficiency, lower investment costs, and a wider range of applications. This technology can effectively promote the development of urban renewal and the protection of historic districts, and assist in achieving sustainable urban development at the technical level.

6.3. Research Limitations

In this study, to minimize interference with pedestrian activity and decision-making during the process of recording pedestrian paths, the experiment should maintain a distance of at least two meters from the experimental subject. However, the experimental process may still have an impact on the internal state of pedestrians, as the Hawthorne effect cannot be completely avoided.
Additionally, the Minzhu Road historical block was used as the basis for developing an accurate pedestrian activity model. However, due to the limited space available in the area, there are some issues when using an automatically generated model to simulate the environment. When the parameters are set slightly higher, almost all of the roads in the environment become the focus of reconstruction, while setting the parameters slightly lower results in the inability to create a continuous pedestrian activity space. From a practical standpoint, the roads in historical blocks are typically around 10 m wide and it is difficult to allocate more space for purposes other than pedestrian activities. In this sense, the simulation results generated by the automatically generated model are reasonable. However, if both the front and back models could be completed in the same space, the research process would be more intuitive and the results would be more convincing.
The agent activities in the pedestrian activity model are mainly influenced by the pheromones received by the sensors in the environment. When simulating pedestrian activities in the environment, environmental factors affect individual sensory perceptions through vision, which then interferes with human behavior. However, the automatically generated model is constructed based on the pedestrian activity model and is relatively simple in terms of influencing factors. To build a higher-level automatically generated model that covers the entire design and construction process, a large number of functional modules need to be set up, including site conditions, user behavior, climate conditions, economic indicators, regional policies, etc. Among them, site conditions can be further subdivided into soil, altitude, terrain, etc. Each sub-item can be further subdivided. It can be predicted that as related research and experimentation continue to deepen, the model size will exhibit exponential growth. In comparison, this study provides only a small glimpse into the possibilities of this research field, and further exploration of the potential of related models is still needed. However, if designers are still continuously required to manually develop intelligent programs based on their own needs or for specific issues, instead of fundamentally liberating design productivity, they are simply jumping from the quagmire of design work to the quagmire of software development.

7. Conclusions

This study explores a practical application method that combines MAS technology with urban renewal design. MAS is a bottom-up, decentralized, self-organizing, and dynamic modeling method that is well-suited for use in urban renewal design due to its compatibility with crowd behavior. The authors conducted field research and recorded pedestrian activity information and patterns, and used this as a basis to construct a pedestrian activity model. Comparing the simulation results of the model with the recorded pedestrian activity paths, it was found that some sections and nodes did not achieve the expected results. To optimize the model and obtain simulation results that were closer to reality, the authors combined the basic model with VGA and further refined the gravity in the patches through static pheromone gradient, achieving more accurate path guidance and demonstrating the feasibility of VGA in improving the simulation accuracy of the pedestrian activity model.
Based on the pedestrian activity model, the authors independently developed a self-generating model that can be used for urban renewal design by combining dynamic pheromone theory. The dynamic distribution of pheromones is advantageous in constructing a simulation environment where multiple agents can interact with each other. Agents influence and change the environment by releasing pheromones during the activity process, and the changes in the environment, in turn, affect new agents. This interactive communication process is more conducive to stimulating the competition, stimulation, and optimization of the model. The new model finally forms a relatively stable simulation result through a large number of iterative operations, achieving the goal of self-generation. Additionally, this study tested the feasibility and rationality of the self-generating model through design practice and demonstrated its application value in real urban renewal design work. Compared with the traditional empirical design approach, MAS has higher efficiency, lower investment cost, and a broader range of applications. This technology can effectively promote urban renewal and the protection of historical districts, and provide technical support for achieving sustainable urban development.

Author Contributions

Conceptualization, Z.L.; methodology, Z.L.; software, Z.L.; validation, Z.L.; formal analysis, Z.L.; investigation, Z.L.; data curation, Z.L.; writing—original draft preparation, Z.L.; writing—review and editing, Z.L.; visualization, Z.L.; supervision, G.V. and M.B.Z.; project administration, G.V. and M.B.Z.; funding acquisition, G.V. All authors have read and agreed to the published version of the manuscript.

Funding

The publication of this article was supported by the Faculty of Engineering and Information Technology, University of Pécs, Hungary, within the framework of the ‘Call for Grant for Publication’.

Data Availability Statement

Not applicable.

Conflicts of Interest

The authors declare no conflict of interest.

References

  1. Undesa, P. World Urbanization Prospects: The 2018 Revision; Retrieved August; United Nations: New York, NY, USA, 2018; Volume 26. [Google Scholar]
  2. Zheng, H.W.; Shen, G.Q.; Wang, H. A review of recent studies on sustainable urban renewal. Habitat Int. 2014, 41, 272–279. [Google Scholar] [CrossRef]
  3. Zhong, X.; Chen, X. Demolition, rehabilitation, and conservation: Heritage in Shanghai’s urban regeneration 1990–2015. J. Archit. Urban. 2017, 41, 82–91. [Google Scholar] [CrossRef]
  4. Boussaa, D. Urban regeneration and the search for identity in historic cities. Sustainability 2017, 10, 48. [Google Scholar] [CrossRef]
  5. Xiao, Q.; Zhao, L.; Ji, L.; Xia, J. Ecological characteristics of distributed energy planning in ecological urban renewal design. Energy Rep. 2022, 8, 13037–13046. [Google Scholar] [CrossRef]
  6. Zhang, L.; Chen, J.; Tochen, R.M. Shifts in governance modes in urban redevelopment: A case study of Beijing’s Jiuxianqiao Area. Cities 2016, 53, 61–69. [Google Scholar] [CrossRef]
  7. Cui, J.; Broere, W.; Lin, D. Underground space utilisation for urban renewal. Tunn. Undergr. Space Technol. 2021, 108, 103726. [Google Scholar] [CrossRef]
  8. Zou, Y.; Chen, Z.; Zhong, N.; Zhao, W. Urban planning as a way to pursue quality-oriented urbanization: Anatomy of the urban planning of Xiong’an New Area, China. J. Urban Aff. 2021, 1–16. [Google Scholar] [CrossRef]
  9. Wei, Z.; Jiejing, W.; Bo, Q. Quantity or quality? Exploring the association between public open space and mental health in urban China. Landsc. Urban Plan. 2021, 213, 104128. [Google Scholar]
  10. Pannell, C.W. China’s urban geography. Prog. Hum. Geogr. 1990, 14, 214–236. [Google Scholar] [CrossRef]
  11. Delafons, J. Sustainable Conservation; Routledge: London, UK, 1997; pp. 111–120. [Google Scholar]
  12. Schwab, K. Currency. In The Fourth Industrial Revolution; World Economic Forum: New York, NY, USA, 2017. [Google Scholar]
  13. Huang, X.; Lu, Z.; Zhuang, Z. Analysis of the wind environment to improve the thermal comfort in the colonnade space of a qilou street based on the relative warmth index. Sustainability 2019, 11, 4402. [Google Scholar] [CrossRef]
  14. Bazazzadeh, H.; Nadolny, A.; Attarian, K.; Safar Ali Najar, B.; Hashemi Safaei, S.S. Promoting sustainable development of cultural assets by improving users’ perception through space configuration; case study: The industrial heritage site. Sustainability 2020, 12, 5109. [Google Scholar] [CrossRef]
  15. Rao, X.; Zhou, J.; Ding, K.; Wang, J.; Fu, J.; Zhu, Q. Research on the cultural tracing of the patriarchal clan system of traditional buildings in the Eastern Zhejiang Province, China, based on space syntax: The case study of Huzhai in Shaoxing. Sustainability 2022, 14, 7247. [Google Scholar] [CrossRef]
  16. Monachesi, P.; Witteborn, S. Building the sustainable city through Twitter: Creative skilled migrants and innovative technology use. Telemat. Inform. 2021, 58, 101531. [Google Scholar] [CrossRef]
  17. Xu, P.; Zhang, R.; Deng, Y. A novel visibility graph transformation of time series into weighted networks. Chaos Solitons Fractals 2018, 117, 201–208. [Google Scholar] [CrossRef]
  18. Zolfagharkhani, M.; Ostwald, M.J. The spatial structure of yazd courtyard houses: A space syntax analysis of the topological characteristics of the courtyard. Buildings 2021, 11, 262. [Google Scholar] [CrossRef]
  19. Puusepp, R. Generating Circulation Diagrams for Architecture and Urban Design Using Multi-Agent Systems. Ph.D. Thesis, University of East London, London, UK, 2011. [Google Scholar]
  20. Feng, Y.; Tong, X. Incorporation of spatial heterogeneity-weighted neighborhood into cellular automata for dynamic urban growth simulation. GISci. Remote Sens. 2019, 56, 1024–1045. [Google Scholar] [CrossRef]
  21. Liu, J.; Xiao, B.; Li, Y.; Wang, X.; Bie, Q.; Jiao, J. Simulation of dynamic urban expansion under ecological constraints using a long short term memory network model and cellular automata. Remote Sens. 2021, 13, 1499. [Google Scholar] [CrossRef]
  22. Shatu, F.; Yigitcanlar, T.; Bunker, J. Shortest path distance vs. least directional change: Empirical testing of space syntax and geographic theories concerning pedestrian route choice behaviour. J. Transp. Geogr. 2019, 74, 37–52. [Google Scholar] [CrossRef]
  23. Karoji, G.; Hotta, K.; Hotta, A.; Ikeda, Y. Pedestrian dynamic behaviour modeling. In Proceedings of the 24th International Conference on Computer-Aided Architectural Design Research in Asia: Intelligent and Informed, CAADRIA 2019, Wellington, New Zealand, 15–18 April 2019; pp. 281–290. [Google Scholar]
  24. Hwang, J.H.; Lee, H. 3D visual simulation and numerical measurement of privacy in traditional Korean palace. In Proceedings of the 22nd International Conference on Computer-Aided Architectural Design Research in Asia: Protocols, Flows and Glitches, CAADRIA 2017, Suzhou, China, 5–8 April 2017; pp. 355–363. [Google Scholar]
  25. Lynch, K. Good City Form; MIT Press: Cambridge, MA, USA, 1984. [Google Scholar]
  26. Sharma, N.; Tabandeh, A.; Gardoni, P. Resilience analysis: A mathematical formulation to model resilience of engineering systems. Sustain. Resilient Infrastruct. 2018, 3, 49–67. [Google Scholar] [CrossRef]
  27. Gilbert, N.; Terna, P. How to build and use agent-based models in social science. Mind Soc. 2000, 1, 57–72. [Google Scholar] [CrossRef]
  28. Skyttner, L. General Systems Theory: An Introduction; Springer: Cham, Switzerland, 1996. [Google Scholar]
  29. Minsky, M. Society of Mind; Simon and Schuster: New York, NY, USA, 1988. [Google Scholar]
  30. Shen, W. Multi-Agent Systems for Concurrent Intelligent Design and Manufacturing; CRC Press: Boca Raton, FL, USA, 2019. [Google Scholar]
  31. Von Neumann, J.; Burks, A.W. Theory of self-reproducing automata. IEEE Trans. Neural Netw. 1966, 5, 3–14. [Google Scholar]
  32. Farrelly, T. A review of quantum cellular automata. Quantum 2020, 4, 368. [Google Scholar] [CrossRef]
  33. Vayadande, K.; Pokarne, R.; Phaldesai, M.; Bhuruk, T.; Patil, T.; Kumar, P. Simulation of Conway’s Game of Life Using Cellular Automata. Int. Res. J. Eng. Technol. (IRJET) 2022, 9, 327–331. [Google Scholar]
  34. Rodrigues, A.; Raper, J. Defining Spatial Agents, Spatial Multimedia and Virtual Reality; CRC Press: Boca Raton, FL, USA, 2021; pp. 111–129. [Google Scholar]
  35. Russell, S.J. Artificial Intelligence a Modern Approach; Pearson Education, Inc.: London, UK, 2010. [Google Scholar]
  36. Abate, A.; Gutierrez, J.; Hammond, L.; Harrenstein, P.; Kwiatkowska, M.; Najib, M.; Perelli, G.; Steeples, T. Rational verification: Game-theoretic verification of multi-agent systems. Appl. Intell. 2021, 51, 6569–6584. [Google Scholar] [CrossRef]
  37. Palma-Orozco, R.; Ruiz-Ledesma, E.; Rosas-Trigueros, J. Adaptive learning environment based on intelligent agents. In Proceedings of the 11th International Technology, Education and Development Conference, Valencia, Spain, 6–8 March 2017; pp. 9576–9580. [Google Scholar]
  38. Miorandi, D.; Sicari, S.; De Pellegrini, F.; Chlamtac, I. Internet of things: Vision, applications and research challenges. Ad Hoc Netw. 2012, 10, 1497–1516. [Google Scholar] [CrossRef]
  39. Bonabeau, E.; Guérin, S.; Snyers, D.; Kuntz, P.; Theraulaz, G. Three-dimensional architectures grown by simple ‘stigmergic’ agents. BioSystems 2000, 56, 13–32. [Google Scholar] [CrossRef]
  40. Feng, Y.; Liu, Y.; Tong, X.; Liu, M.; Deng, S. Modeling dynamic urban growth using cellular automata and particle swarm optimization rules. Landsc. Urban Plan. 2011, 102, 188–196. [Google Scholar] [CrossRef]
  41. Raisbeck, P. Provocative Agents: Agent Base Modelling Systems and the Global Production of Architecture; Association of Architecture Schools in Australasia: Flinders Lane, MEL, Australia, 2007. [Google Scholar]
  42. Yamu, C.; Van Nes, A.; Garau, C. Bill Hillier’s legacy: Space syntax—A synopsis of basic concepts, measures, and empirical application. Sustainability 2021, 13, 3394. [Google Scholar] [CrossRef]
  43. Turner, A.; Penn, A. Encoding natural movement as an agent-based system: An investigation into human pedestrian behaviour in the built environment. Environ. Plan. B Plan. Des. 2002, 29, 473–490. [Google Scholar]
  44. Kitazawa, K.; Batty, M. Pedestrian behaviour modelling. In An Application to Retail Movements Using a Genetic Algorithm; Centre for Advanced Spatial Analysis, University College London: London, UK, 2004. [Google Scholar]
  45. Kalay, Y.E. Integrating an agent-based model and a statistical model into a user model. In Design Computing and Cognition’06; Springer: Cham, Switzerland, 2007; p. 61. [Google Scholar]
  46. Resnick, M. Turtles, Termites, and Traffic Jams: Explorations in Massively Parallel Microworlds; MIT Press: Cambridge, MA, USA, 1997. [Google Scholar]
  47. Zhao, D.; Bachmann, B.; Wang, T. ‘Beautiful China’ project: A development proposal for non-heritage rural areas in North China. Pollack Period. 2019, 14, 235–246. [Google Scholar] [CrossRef]
  48. Tan, X.; Altrock, U. Struggling for an adaptive strategy? Discourse analysis of urban regeneration processes—A case study of Enning Road in Guangzhou City. Habitat Int. 2016, 56, 245–257. [Google Scholar] [CrossRef]
  49. Kent, M.; Schiavon, S. Evaluation of the effect of landscape distance seen in window views on visual satisfaction. Build. Environ. 2020, 183, 107160. [Google Scholar] [CrossRef]
  50. Kumeno, F. Multi-agent Simulation for Risk Prediction in Student Projects with Real Clients. In Knowledge-Based Software Engineering: 2022, Proceedings of the 14th International Joint Conference on Knowledge-Based Software Engineering (JCKBSE 2022), Larnaca, Cyprus, 22–24 August 2022; Springer: Cham, Switzerland, 2023; pp. 113–125. [Google Scholar]
  51. Yuen, J. FUI: How to Design User Interfaces for Film and Games. In Featuring Tips and Advice from Artists That Worked on: Minority Report, the Avengers, Star Trek, Interstellar, Iron Man, Stars Wars, the Dark Tower, Black Mirror and More; CreateSpace Independent Publishing Platform: Seattle, WA, USA, 2017. [Google Scholar]
  52. Hu, H.; Luo, Z.; Chen, Y.; Bian, Q.; Tong, Z. Integration of space syntax into agent-based pedestrian simulation in urban open space. In Proceedings of the CAADRIA 2017–22nd International Conference on Computer-Aided Architectural Design Research in Asia: Protocols, Suzhou, China, 5–8 April 2017; pp. 325–334. [Google Scholar]
  53. Srivastava, P.R.; Baby, K.; Raghurama, G. An approach of optimal path generation using ant colony optimization. In Proceedings of the TENCON 2009-2009 IEEE Region 10 Conference, Singapore, 23–26 November 2009; pp. 1–6. [Google Scholar]
  54. Sayyari, F.; Emadi, S. Automated generation of software testing path based on ant colony. In Proceedings of the 2015 International Congress on Technology, Communication and Knowledge (ICTCK), Mashhad, Iran, 11–12 November 2015; pp. 435–440. [Google Scholar]
  55. Qu, F.; Yu, W.; Xiao, K.; Liu, C.; Liu, W. Trajectory generation and optimization using the mutual learning and adaptive ant colony algorithm in uneven environments. Appl. Sci. 2022, 12, 4629. [Google Scholar] [CrossRef]
  56. Zhai, L.; Feng, S. A pedestrian evacuation model based on ant colony algorithm considering dynamic panic spread. J. Ind. Manag. Optim. 2023, 19, 2799–2823. [Google Scholar] [CrossRef]
  57. Qiu, S.Z.P.S. Digital Morphogenesis Research and Design Implementation (Parametric Design in the Field of Industrial Design). In Proceedings of 2019 International Conference on Design for Experience and Wellbeing, Xi‘an, China, 23–25 September 2019. [Google Scholar]
Figure 1. Research framework.
Sustainability 15 07308 g001
Figure 2. Minzhu Road Historic District.
Sustainability 15 07308 g002
Figure 3. Pedestrian activity path recording.
Sustainability 15 07308 g003
Figure 4. Street environment and experimental details.
Sustainability 15 07308 g004
Figure 5. Pedestrian activity path record.
Sustainability 15 07308 g005
Figure 6. (a) Paths for different activity purposes; (b) Path characteristics of different roles.
Sustainability 15 07308 g006
Figure 7. Path results from the initial model simulation.
Sustainability 15 07308 g007
Figure 8. Number of agents with different activity types in the initial model.
Sustainability 15 07308 g008
Figure 9. Path results from the optimized model simulation.
Sustainability 15 07308 g009
Figure 10. Number of agents with different activity types in the optimized model.
Sustainability 15 07308 g010
Figure 11. Simulation process of generative model.
Sustainability 15 07308 g011
Figure 12. Application of Simulation Results in Design.
Sustainability 15 07308 g012
Table 1. Basic information of pedestrians in activity path research.
Datong Road
NumberAgeGenderRolePurposeStartEnd
128MaleVisitorTravelWest entranceHeping Rd. south exit
224MaleVisitorTravelWest entranceMinquan Rd. north exit
323FemaleVisitorTravelWest entranceMinquan Rd. north exit
448MaleResidentTransportationWest entranceEast exit
529FemaleResidentConsumptionWest entranceBakery on Heping Rd.
652MaleResidentConsumptionWest entranceAntique shop on Minzu Rd.
723FemaleVisitorTravelEast entranceHeping Rd. south exit
832MaleVisitorConsumptionEast entranceAntique shop on Minzu Rd.
938MaleVisitorTravelEast entranceMinquan Rd. south exit
1035FemaleVisitorTravelEast entranceMinquan Rd. south exit
1144MaleResidentTransportationEast entranceWest exit
1235FemaleResidentTransportationEast entranceMinzu Rd. north exit
Heping Road
NumberAgeGenderRolePurposeStartEnd
116FemaleVisitorTravelNorth entranceSouth exit
252FemaleVisitorTravelNorth entranceDatong Rd. east exit
323FemaleVisitorTravelNorth entranceSouth exit
425MaleVisitorConsumptionNorth entranceCoffee shop on Heping Rd.
554MaleResidentTransportationNorth entranceDatong Rd. west exit
656MaleResidentTransportationNorth entranceDatong Rd. west exit
736MaleVisitorTravelSouth entranceNorth exit
831FemaleVisitorTravelSouth entranceNorth exit
924MaleVisitorConsumptionSouth entranceShop on Heping Rd.
1041MaleResidentTransportationSouth entranceDatong Rd. west exit
1145MaleResidentTransportationSouth entranceNorth exit
1238FemaleResidentTransportationSouth entranceMinzu Rd. north exit
Minzu Road
NumberAgeGenderRolePurposeStartEnd
126FemaleVisitorTravelNorth entranceHeping Rd. south exit
226FemaleVisitorTravelNorth entranceHeping Rd. south exit
345MaleVisitorTravelNorth entranceMinquan Rd. south exit
439MaleVisitorConsumptionNorth entranceRestaurant on Heping Rd.
551FemaleResidentTransportationNorth entranceDatong Rd. west exit
635FemaleResidentTransportationNorth entranceDormitory on Minzu Rd.
742MaleVisitorConsumptionSouth entranceAntique shop on Minzu Rd.
825MaleVisitorTravelSouth entranceHeping Rd. north exit
948FemaleResidentTransportationSouth entranceNorth exit
1053FemaleResidentTransportationSouth entranceNorth exit
1150MaleResidentTransportationSouth entranceDatong Rd. east exit
1248FemaleResidentTransportationSouth entranceDatong Rd. east exit
Minquan Road
NumberAgeGenderRolePurposeStartEnd
125MaleVisitorConsumptionNorth entranceCoffee shop on Minzu Rd.
243FemaleVisitorConsumptionNorth entranceShop on Heping Rd.
345MaleVisitorTravelNorth entranceSouth exit
431MaleVisitorTravelNorth entranceHeping Rd. north exit
555MaleResidentTransportationNorth entranceDatong Rd. west exit
639MaleResidentTransportationNorth entranceDatong Rd. east exit
723FemaleVisitorTravelSouth entranceHeping Rd. south exit
834MaleVisitorTravelSouth entranceDatong Rd. west exit
926FemaleVisitorConsumptionSouth entranceBakery on Heping Rd.
1055MaleResidentTransportationSouth entranceDatong Rd. east exit
1131MaleResidentConsumptionSouth entranceCoffee shop on Minquan Rd.
1257FemaleResidentTransportationSouth entranceNorth exit
Table 2. Initial model construction.
ComponentsProcessModel Work Order
PatchesImportImport the site plan to NetLogo.
ScaleEach patch has a width of 400 mm, similar to a human’s.
Area divisionEach patch is colored to identify different areas.
ObstaclesUse patch color to identify obstacles and adjust pheromone to reduce agent movement in those areas.
TargetHigh pheromones should be assigned to patches for block exits and store entrances.
PheromonePheromone is critical for the model optimization as it connects agents to their environment and to each other.
TurtlesGenerationThe agent reproduces at the entrance with a limited rate threshold.
ActivityThe turtle checks for obstacles or area boundaries before each step and adjusts movement accordingly, with all operations performed simultaneously and interrelated.
Direction selectionThe agent rotates with small angle random turns during regular movement and to avoid obstacles.
VisionAgent vision is set to move towards visible target points and reduce invalid rotation frequency.
DisappearThe agent dies at the destination.
PathRecord the trajectory of agent from generation to final disappearance.
ObserverWandering angleA 0° angle results in unrealistic straight lines.
A 10° angle produces a more natural slight wiggle. It is more plausible.
The agent appears to wander near the block’s entry at 30° and 60°.
Horizontal viewing angleA 60° angle limits the agents’ field of view, causing illogical twists and gathering at the block entrance.
A 90° angle produces clearer paths with fewer irrational twists and less concentration at the entry.
A 120° angle is the most probable option, based on human vision rules.
A 180° angle results in too much information and leads to aggregation at the entry.
Visual distanceAgent aggregation occurred at 6 and 20 m.
10 and 16 m produced the best route simulation results.
Turning angle after finding the targetA 30° angle results in a dispersed path inconsistent with real pedestrian activity.
A 60° angle roughly depicts pedestrian preferences in specific road segments, showing a preference for turning over proceeding straight.
A 90° and 120° angle result in many unreasonable twists and inflexible broken-line routes.
Table 3. Road size and number of obstacles.
ItemHeping RoadMinzu Road
SectionNorthSouthNorthSouth
Length (m)7510780130
Width (m)11.510139.5
Tree (radius greater than 250 mm)021518
Tree (radius less than 250 mm)12922
Street lamps and utility poles81248
ItemMinquan RoadDatong Road
SectionNorthSouthWestMiddleEast
Length (m)90157407737
Width (m)13109.51214
Tree (radius greater than 250 mm)232403110
Tree (radius less than 250 mm)416000
Street lamps and utility poles1518554
Table 4. Generative model construction.
ComponentsModel Work Order
Gray patchesGray patches indicate the agent’s movable area and have a pheromone of 0 at the simulation’s start.
Before each movement, the agent must check if the next patch is gray (non-entrance, target point, or obstacle), and if it is, pheromone is added based on the PPS slider.
Pheromones on patches impact the agent’s activity, increasing the likelihood of the agent moving towards patches with higher pheromone levels.
Gray patches’ pheromone is set to 0 when they drop below 1.
Yellow patchesPatches’ pheromone levels exceed MinRP only when continuously traversed by the agent, influenced by both PPS and MinRP.
Yellow patches result when pheromone levels exceed MinRP.
Pheromone decay occurs on gray and yellow patches not visited by the agent.
Pheromone levels on yellow patches drop below 1, changing them back to gray and setting the pheromone to 1 until the agent revisits, exceeding MinRP and turning the patch yellow again.
Red patchesRed patches’ pheromone levels decrease over time but remain red and do not disappear.
Patches change from yellow to red when their pheromone levels exceed MaxRP.
When PPS, MinRP, and MaxRP are the same, the patches that the agent traverses no longer change from yellow to red, which is not reasonable. An optimization command inspired by the Game of Life needs to be added to the model.
Before each simulation run, the adjacent red patches need to determine the number of neighboring red patches. When the number is greater than or equal to 2, the patch remains red; when the number is less than 2, it changes to yellow.
Initially, each patch is typically traversed once by the agent, and few red patches are formed due to the above criteria. Over time, the area of these patches expands.
The model produces many scattered red patches and gaps that do not meet design requirements. The model requires commands to remove patch fragments and fill gaps.
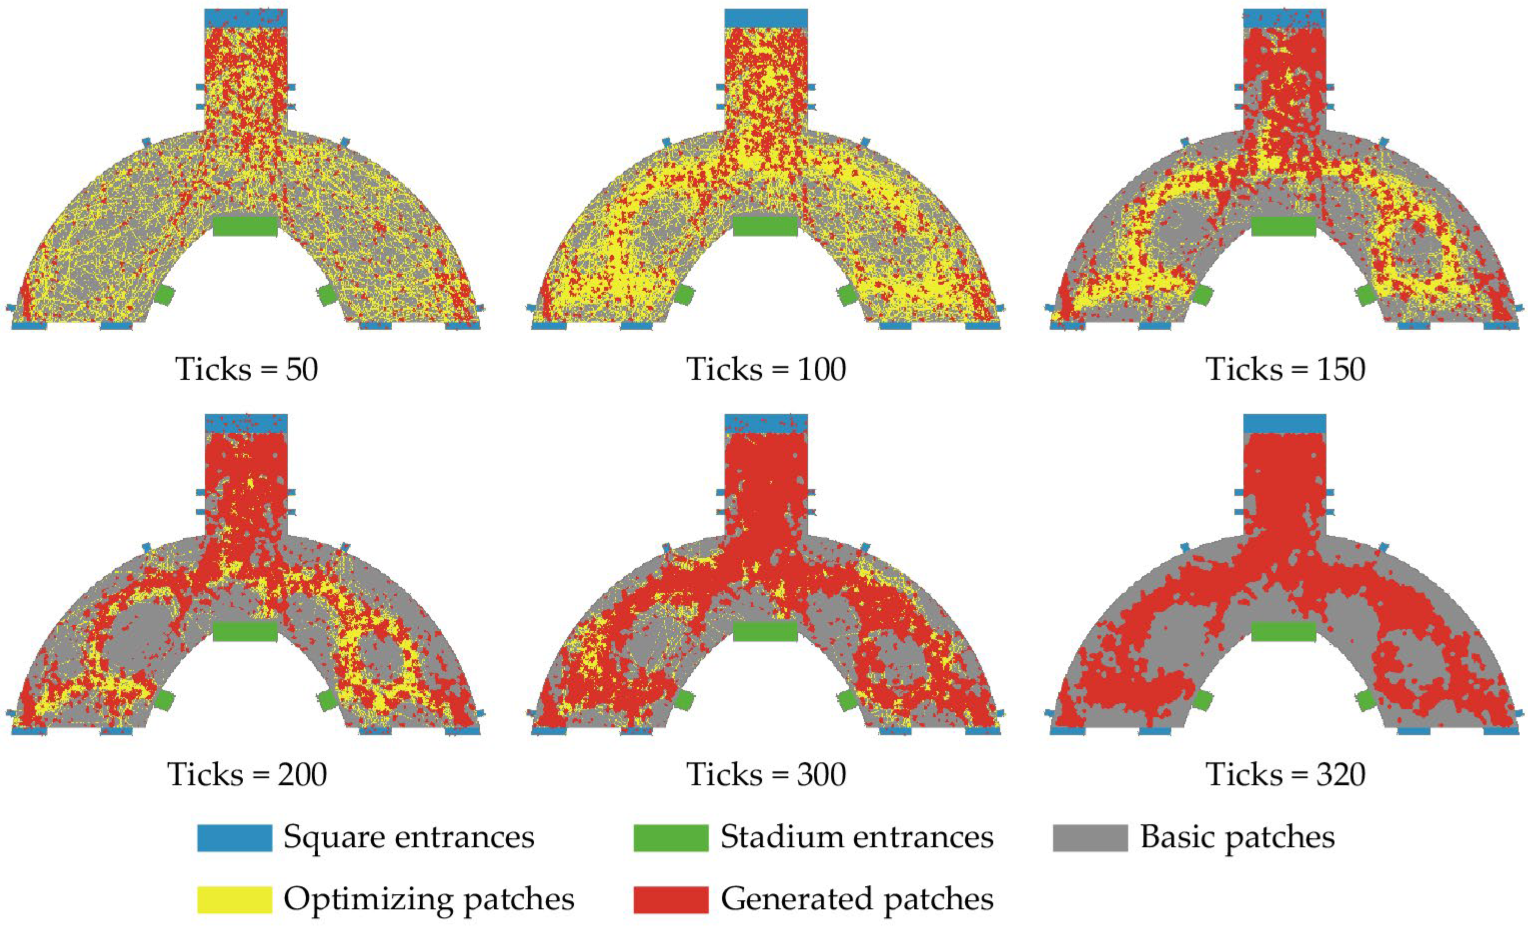
Table 5. Simulation process of generative model.
Number of Model RunsSimulation Results
50 ticksAgent enters from blue and searches for green target with random moves. Model and agent in chaotic stage with no reference value. Many broken red patches at entrance form basis for overall patch group structure.
100 ticksMain agent channel seen from yellow patches, broken red patch area expanding.
150 ticksYellow channel is clearer, red patch group structure more apparent.
200 ticksYellow channel optimized, agent activity inertia formed. Red patch group distributed along channel as pheromone area fixed.
300 ticksYellow patches absorbed by red patches, creating relatively stable structure. Many fractured patches and holes in red structure.
320 ticksAgents and yellow patches eliminated, leaving only optimized red patches.
Disclaimer/Publisher’s Note: The statements, opinions and data contained in all publications are solely those of the individual author(s) and contributor(s) and not of MDPI and/or the editor(s). MDPI and/or the editor(s) disclaim responsibility for any injury to people or property resulting from any ideas, methods, instructions or products referred to in the content.

