Article

Assessing Critical Road Sections: A Decision Matrix Approach Considering Safety and Pavement Condition

1
Department of Civil Engineering, Division of Global Architecture, Graduate School of Engineering, Osaka University, 2-1 Yamadaoka, Suita 565-0871, Japan
2
Addis Ababa City Roads Authority, Sar Bet, Pushkin RA, Addis Ababa P.O. Box 9206, Ethiopia
*
Author to whom correspondence should be addressed.
Sustainability 2023, 15(9), 7244; https://doi.org/10.3390/su15097244
Submission received: 8 March 2023 / Revised: 19 April 2023 / Accepted: 23 April 2023 / Published: 26 April 2023

Abstract

:
Identifying critical road sections that require prompt attention is essential for road agencies to prioritize monitoring, maintenance, and rehabilitation efforts and improve overall road conditions and safety. This study suggests a decision matrix with a hierarchical structure that factors in the pavement deterioration rate, infrastructure safety, and crash history to identify these sections. A Markov mixed hazard model was used to assess each section’s deterioration rate. The safety of the road sections was rated with the International Road Assessment Program star rating protocol considering all road users. Early detection of sections with fast deterioration and poor safety conditions allows for preventive measures to be taken and to reduce further deterioration and traffic crashes. Additionally, including crash history data in the decision matrix helps to understand the possible causes of a crash and is useful in developing safety policies. The proposed method is demonstrated using data from 4725 road sections, each 100 m, in Addis Ababa, Ethiopia. The case study results show that the proposed decision matrix can effectively identify critical road sections which need close attention and immediate action. As a result, the proposed method can assist road agencies in prioritizing inspections, maintenance, and rehabilitation decisions and effectively allocate budgets and resources.

1. Introduction

Roads play a crucial role in transportation systems and help in the development and growth of economies. Roads are essential in ensuring the mobility of people, goods, and services, thus stimulating economic activities. Besides mobility, providing access to basic services, markets, and employment opportunities are other significant advantages of roads. Efficient road networks are among the cornerstones in enhancing the nation’s global competitiveness. Therefore, investing in road infrastructure preservation is vital for ensuring continued economic growth and social development [1,2,3].
In order to preserve safe and efficient road networks, it is essential to carry out proper and timely monitoring and maintenance operations. However, budget limitations make it usually impossible to monitor and maintain the whole network at a time [4]. Moreover, not all roads have the same functional and safety conditions. Some road sections are in a better state and safer for travel compared to others, thus with different timings and levels of preservation needs. Therefore, it is unavoidable for road agencies to identify critical road sections to concentrate monitoring and maintenance efforts and improve overall road conditions and safety.
In assessing critical road sections, the pavement condition can be used as one factor to evaluate the priority due to its direct effect on mobility and user costs [5,6]. As presented in Figure 1, the pavement condition can be used in two ways: based on the level of deterioration and the rate of deterioration. The prioritization of road sections based on their level of deterioration considers highly deteriorated sections as critical. This method is considered reactive as it only identifies the roads as critical after significant damage has occurred. This approach is mainly used to determine road sections’ priority for maintenance by establishing different criteria, and numerous studies have suggested various techniques [7,8]. Criteria related to the pavement condition are fundamental in prioritizing road sections using those techniques [7]. Consequently, road agencies have mainly relied on pavement deterioration conditions to identify critical sections in their road infrastructure management process. For example, in Australia, the Victoria Department of Transport rates road sections based on roughness, rutting, and cracking. The length of road sections with distresses at an intervention level is compared to the whole network, and the resulting percentage is used as a performance measure [9]. Similarly, in the US, the Texas Department of Transportation rates road sections based on a condition score, which is calculated using distress and ride quality related to the pavement condition [10]. The same approach is taken in Ethiopia, where the Addis Ababa City Roads Authority compares road sections based on the severity of four damage types: potholes, cracks, rutting, and raveling. Each damage type is assigned a weight, and the road section with the highest total severity is considered the most critical [11]. However, the pavement-deterioration-condition-based approach leads to a costly reactive maintenance scheme that does not address the underlying cause of deterioration.
In addition to creating a basis to evaluate priority, identifying critical road sections based on the deterioration rate is a proactive approach as it allows early detection. This method helps identify critical sections which need a detailed investigation to identify the root cause and take timely action [12,13]. The importance of a proactive approach to pavement preservation has been acknowledged for a long time [14,15]. Accordingly, much research focus has been placed on developing advanced methods for the early detection of pavement distress and to optimize maintenance strategies in order to achieve proactive pavement preservation. Both distress detection and optimization techniques determine the timing for preventive maintenance over corrective maintenance [16,17,18]. However, these techniques do not account for the rate at which various road sections are deteriorating, preventing an understanding of the source of accelerated deterioration and potentially leading to repeated and costly maintenance. Despite the significance of considering the deterioration rate when identifying critical road sections, existing knowledge on how to identify rapidly deteriorating sections is comparably sparse [13].
Another important factor in identifying critical road sections is road safety [19]. With road traffic crashes being recognized as the eighth leading cause of death globally [20], enhancing road safety is becoming a vital objective for road agencies. The leading cause of fatal crashes is due to deficiencies in the safety features of road infrastructure [21,22]. Thus, improving road infrastructure safety conditions can significantly reduce the social and economic costs resulting from traffic crashes [19,22]. Improving road infrastructure safety entails the identification of critical road sections that pose a high safety risk.
Road sections with high safety risks can be determined by analyzing either past crash history or the degree of infrastructure safety. The first approach classifies road sections with a high record of traffic crashes as critical sections. This approach only takes effect after a significant number of crashes have occurred and been documented [23]. In contrast, the second approach assesses road sections’ potential for crashes and the level of protection against crash severity that they offer, taking into consideration the safety needs of all road user groups to determine which sections pose the greatest risk [21]. The latter approach, being proactive, does not necessitate waiting for crashes to happen to assess high-risk sections, making it preferable to identify critical road sections. However, analyzing previous crash records along with infrastructure safety data helps enhance road safety. This is because it provides a deeper insight into the causes and contributing factors behind crashes. This information can then be used to prevent similar crashes from happening in the future [21,23]. For example, road segments with safe infrastructure but high crash history need to be evaluated to determine if the cause is due to other factors (human or vehicle factors), which can then be considered in road safety policy and regulations. Studies rarely consider the two approaches together, resulting in a deficiency in comprehending road infrastructure safety and the underlying causes of crashes, making it challenging to determine high-risk sections and effective mitigation.
There is an increased research effort in the area of road safety and pavement preservation to ensure safe and efficient road networks. However, previous studies focus on specific pavement characteristics in relation to safety and tend to consider them as separate areas [24]. This approach lacks comprehensiveness in integrating pavement preservation and safety. Furthermore, the essential road features for the safety of non-motorized users have not been considered when identifying the critical section and road network improvement decisions [25]. Though the pavement condition is one factor in determining safe roads, features such as the road geometry, the availability of safety infrastructures for vulnerable road users (e.g., walkways, bicycle lanes, etc.), and the availability of traffic calming measures play a vital role in assuring safe infrastructure for all. Neglecting to consider the safety needs of all road users raises concerns about transport equity among road users. Thus, it is important to evaluate pavement and infrastructure safety conditions from all road users’ perspectives in identifying critical road sections.
This study aims to develop a practical decision matrix to identify critical road sections while filling the research gaps. Our contribution here, therefore, is to employ a pavement condition and infrastructure safety-based proactive approach in identifying critical sections so that extra economic and social costs due to corrective actions can be prevented. The study employs the Markov mixed hazard model to estimate pavement deterioration rate stochastically, whereas the International Road Assessment Program (iRAP) protocol is used to evaluate the infrastructure safety level of road sections for each group of road users, including vehicle occupants, motorcyclists, bicyclists, and pedestrians. In addition, the evaluation of critical road sections also includes the analysis of crash history as an indicator to identify underlying factors beyond infrastructure, which is beneficial in developing safety policies and regulations. To this end, the proposed decision matrix is the first of its kind, to the authors’ knowledge, in incorporating proactive factors, pavement deterioration rate and infrastructure safety that considers all road users’ safety needs, and a retroactive factor, crash history, to identify critical road sections. Furthermore, the decision matrix is used to form a hierarchy of critical sections based on their criticality levels, allowing for prioritization and effective decision-making under resource constraints. The proposed decision matrix is highly practical. Therefore, it is expected to help road agencies make informed decisions regarding monitoring and preserving their road networks to ensure safe and efficient mobility.

2. Literature Review

Due to limited resources and a restricted budget, it is crucial to prioritize which road sections should be monitored and maintained. There are two main approaches to prioritization: optimization and ranking. Optimization techniques are designed to achieve a specific goal, such as improving the condition of the road network within the constraints of a fixed repair budget. These methods determine a collection of road sections that require maintenance but do not guide the order in which they should be worked on. On the other hand, ranking methods evaluate the potential road sections for maintenance based on economic analysis or a composite index. A composite index is the most favorable method for maintenance prioritization since it is simple and produces nearly optimal results [26].
A prioritization method for road maintenance based on a composite index requires the establishment of multiple criteria to evaluate each road section. Many studies have been conducted on applying multi-criteria analysis in road maintenance prioritization, and various methods have been proposed. Despite the diversity of methods, road condition has consistently been used as a common criterion. The pavement condition index (PCI) is a widely used performance indicator for road condition criteria in maintenance prioritization [26,27,28]. PCI value is calculated based on the quantity and severity of different distresses and ranges from 0 (worst condition) to 100 (best condition). The surface distress index (SDI) is another index used to measure pavement performance in factoring road conditions in the road maintenance prioritization process. The SDI is determined based on the crack area and width, the number of potholes, and the rutting depth. For example, Hendhratmoyo et al. [29] used the SDI to prioritize urban road maintenance and reconstruction. Moreover, some studies have used more than one indicator while assessing pavement performance. For instance, Li et al. [30] used the pavement quality index (PQI) as a performance indicator for road condition criterion in the maintenance ranking of 26 streets included in their case study. The PQI is calculated by summing up the PCI, the riding quality index (RQI), the rutting depth index (RDI), and the skid resistance index (SRI). Likewise, Singh et al. [31] applied the international roughness index (IRI) and rutting depth. Similarly, Siswanto et al. [32] assessed road conditions based on surface distress (potholes, deformation, cracking, rutting, shoulder condition, and transverse slope) to prioritize road maintenance. Another approach used to evaluate road conditions is through subjective evaluation. For example, Surbakti and Harefa [33] employed the feedback of specialists through a survey that focused on assessing the state of road surfaces across various sections. This information was subsequently utilized to prioritize maintenance tasks. While different methods have been used to evaluate pavement performance, they all prioritize maintenance for pavements in worse conditions. In other words, road sections with worse pavement conditions are considered critical and given higher priority for maintenance. However, prioritizing road sections based on the level of pavement deterioration leads to a costly reactive maintenance scheme.
The concept of taking a proactive approach to preventive maintenance has been under consideration since the early 1970s [15,34]. Over the years, many studies have been conducted, and with the advancements in computer-aided technologies, various pavement inspection techniques, particularly those related to crack detection, have been proposed. These techniques help to identify cracks early on, allowing for preventive maintenance to be carried out. However, they have limitations when it comes to measuring crack width and length [16], making it impossible to prioritize maintenance sections without knowing the severity and extent of the cracks. Additionally, these methods do not indicate the rate of deterioration, which is useful in evaluating the relative deterioration of each section and determining the cause of rapidly deteriorating sections. To address this issue, Obama et al. [35] proposed the mixed Markov hazard (MMH) model, which is suitable for evaluating different groupings. For example, Han et al. [36] used the relative road deterioration rate to compare the performance of five asphalt types. However, the use of the model for prioritizing individual road sections for maintenance has not been thoroughly investigated.
In addition to the efforts to introduce a proactive approach in road maintenance schemes, various studies have also been conducted to integrate safety into road maintenance prioritization. Sayadinia and Baheshtinia [7] used a qualitative approach to incorporate safety as a criterion in maintenance prioritization. At the same time, other studies utilized quantitative data related to pavement surface texture, such as skid number and friction coefficient [26,31]. However, relying solely on skid resistance is insufficient for assessing the likelihood and severity of a crash. Other factors such as roadside conditions, road characteristics, intersection type and quality, vulnerable road user facilities, and operating speed need to be considered. Tighe et al. [37] suggested an extensive list of pavement conditions to consider in incorporating safety into pavement management, including surface texture, roughness, distress, geometric design, road safety measures, weather, and delineation. However, their study did not sufficiently address factors relevant to vulnerable road users. This study provides a valuable reference for evaluating pavement conditions concerning safety. However, it did not adequately consider factors important for vulnerable road users, such as intersection type and quality, vulnerable road user facilities, and speed. Another study by Vaina et al. [38] proposed a road safety inspection (RSI) approach to evaluate the frequency and severity of crashes and road infrastructure deficiencies. This research considers numerous factors contributing to safety, including features necessary in assessing safety for vulnerable road users, such as intersections. Additionally, the study also takes into account the crash history. Although this approach integrates both crash history and infrastructure safety, it is limited in its ability to evaluate safety for different road user groups separately as the safety levels differ. Moreover, it needs to comprehensively consider factors such as operating speed and external flow influence that impact crash likelihood and severity.
This research differs from similar studies in the following ways:
  • It uses a proactive approach to evaluate pavement performance.
  • It considers a comprehensive set of factors to evaluate the safety of infrastructure for each group of road users separately.
  • It uses crash history data to assess the underlying causes of accidents, in addition to the proactive safety assessment of infrastructure.
  • It introduces a new decision-making matrix that combines the above three factors and applies the proposed matrix to prioritize road maintenance in a real case study in Addis Ababa, Ethiopia.

3. Methodology

A decision matrix is a tool used in the decision-making process by organizing all relevant factors in a matrix form. This helps the decision maker understand all the factors involved in the decision and make an informed choice. The study uses pavement deterioration rate, infrastructure safety, and crash history data to create a decision matrix for identifying critical road sections. The pavement deterioration rate is determined through a Markov mixed hazard (MMH) model. At the same time, the infrastructure safety condition of road sections for different road user groups is evaluated using the International Road Assessment Program (iRAP) protocol, while crash data are acquired from the responsible authority in charge of gathering them. The methodology used in this research is presented in Figure 2.

3.1. Markov Mixed Hazard (MMH) Model

Over time, road pavements deteriorate like any other form of infrastructure. However, the rate they deteriorate differs due to their heterogeneous characteristics in terms of structure, loading, environment, and unobservable factors. Understanding the factors contributing to the deterioration, particularly for fast-deteriorating sections, helps determine the appropriate action. Moreover, detecting those causes before the section’s deterioration reaches conditions that require high investment to restore can help to preserve pavements with reasonably minimum cost. Therefore, identifying the critical sections based on their deterioration rate at an early stage is an important aspect to be addressed. Determining the deterioration rate in an absolute discrete measurement scale is difficult due to its stochastic nature and various attributing factors. However, a probabilistic approach based on pavement performance data is possible. Accordingly, the MMH model is proposed to determine the deterioration rate of road sections in this study.
The Markovian model is widely used to model the deterioration of infrastructure in a probabilistic way [39]. It is a preferred choice for decision-making due to its practicality and risk measurement capabilities [39,40]. The MMH model has gained popularity among the advanced Markovian models [40,41]. Initially, the MMH model, which was developed by Obama et al. to consider the effect of infrastructure heterogeneity on the hazard rate and to compare the deterioration rate of infrastructures through benchmark analysis, uses the maximum likelihood estimator (MLE) [35]. Later, Kaito et al. devised the Bayesian approach to MMH, replacing the maximum likelihood estimator (MLE) [42]. Application of the Bayesian approach overcomes MLE’s shortcomings, such as a requirement for a relatively large amount of data, sensitivity to outliers, and the local maxima estimation. The MMH’s superiority over other Markov models in considering heterogeneity, combined with its capability to determine the life expectancy of infrastructures and quantify uncertainty, satisfies the deterioration model’s requirements [41]. The MMH model is used in this study to assess the deterioration rate of pavement sections due to its advantageous features and practicality.
Like all Markovian models, the MMH model employs discrete condition states to express the transition probability of the condition states in the deterioration process. This paper defines condition states of pavements as i   i = 1 ,   , J , where i = 1 and i = J present the best and the worst (absorbing state) condition states, respectively. Then, the period from i = 1 to i = J can be referred to as the life expectancy. Equation (1) expresses the transition probability of a condition state i at calendar time τ 1 to a condition state j at calendar time τ 2 . The Markov transition probability (MTP) matrix, which represents all possible sets of transition probabilities within the time interval of z   τ 2 τ 1 , is presented in Equation (2). The transition probabilities in the MTP matrix have to fulfill four main preconditions. The two conditions emanate from the probability property in that a probability takes a non-negative value,   π i j   0 , and the sum of all possible transitions of a given condition state should be 1, j = 1 J   π i j = 1 . The other two preconditions are related to the deterioration property that there is no chance for a worse condition to regain a better condition under normal deterioration, unless repaired, i.e.,   π i j = 0 for i > j . Since there is no worse condition than the absorbing state, once reaching the absorbing state in the deterioration process, the probability of remaining in the same state is certain,     π J J = 1 .
  π i j = P r o b ɦ τ 2 = j   ɦ τ 1 = i    
  Π =   π 11   π 1 J 0   π J J
The hazard function λ i y i , also known as the hazard rate, is defined as the instantaneous rate of change in condition state from i at time y i to i + 1 at y i + d y i , represented in Equation (3).
λ i y i = lim d y i 0 P r o b y i ζ i < y i + d y i ζ i y i d y i
The hazard rate, λ i , can be expressed as a function of the explanatory variable, x , and the unknown parameter vector β i = β i , 1   , β i , M   and β i is its transpose. Here, m m = 1 ,   ,   M represents the number of explanatory variables. Thus, the hazard rate can be presented as:
λ i   = f x m :   β i , m
To determine the MTP matrix and other important parameters, such as the deterioration rate using the MMH model, consider a road network with pavement groups denoted by k k = 1 , K and a pavement section in each group denoted by s k s = 1 , ,   S k . Pavement grouping is usually carried out based on characteristics such as pavement type, and each group k will have a total of S k sections. The deterioration process for each pavement group or section is different and is characterized by the heterogeneity factor, ε k . Therefore, utilizing a section that represents the average hazard rate of the entire network (referred to as the benchmark), λ ˜ i s k , for condition i   i = 1 ,   , J 1 , it is possible to express the hazard mixture form as:
λ i s k = λ ˜ i s k   ε k   i = 1 , ,   j 1 ; s = 1 , , S ; k = 1 , ,   K
It is to be noted that the heterogeneity factor ε k always has a positive value as it represents a relative deterioration rate to the benchmark. Thus, when ε k = 1 , it represents the benchmark condition, and as the value of ε k increases, the deterioration rate also increases. The heterogeneity factor ε k can be in the form of a function or stochastic variable. It is assumed to follow the gamma distribution with parameters α and γ , i.e., ε k   ~   G α , γ . This means that it can be expressed using the following function:
f ε k   : α , γ = 1 γ α Γ α ε k α 1 e x p ε k γ   ,
where the cumulative distribution function (CDF) is denoted by Γ . . By taking the product of gamma distribution parameters,   α and γ , the average of the function f ε k   : α , γ can be obtained, while the variance is α γ 2 . Thus, when the average is set to 1 (i.e., α γ = 1 ) and the variance α γ 2 = 1 ϕ , the probability density function (PDF) becomes:
G ¯ ε k   : ϕ = ϕ ϕ Γ ϕ ε k ϕ 1 e x p ϕ ε k
The probability of pavement section s k remaining in condition state i for a time period longer than y i can be represented by the survival or reliability function using Equation (8).
R i y i s k = exp   ( λ ˜ i s k ε ¯ k y i s k )  
We can rephrase Equation (8) as a transition probability of staying in the same condition state i , i.e., π i i , for a time interval of y i , where the symbol [ ˉ ] indicates a measurable value. In the same way, if we consider different possible deterioration paths starting from condition state i , we can calculate the transition probabilities for each step, represented as π i i , …, π i , J , over a fixed time interval of z as follows:
π i i z s k : ε ¯ k   = exp   ( λ ˜ i s k ε ¯ k z s k )  
π i j z s k : ε ¯ k   = s = i j m = i j 1 λ ˜ m s k λ ˜ m s k λ ˜ s s k e x p λ ˜ i s k ε ¯ k z s k   = s = i j ψ i j s λ ˜ i s k e x p λ ˜ i s k ε ¯ k z s k ,
where ψ i j s λ ˜ i s k = m = i j 1 λ ˜ m s k λ ˜ m s k λ ˜ s s k   i = 1 , ,   J 1 ; j = i + 1 ,   ,   J ; k = 1 , ,   K . Given the precondition, j = 1 J   π i j = 1 ,   π i J can be estimated using Equation (11).
π i J z s k : ε ¯ k   = 1 s = i j 1 π i j z s k : ε ¯ k
The possible probability transitions of condition states that constitute the MTP matrix can be calculated using Equations (9)–(11). However, to fully understand each pavement section’s hazard rate, λ ˜ i s k , it is necessary to explain it as a function of the explanatory variable, x ¯ s k , and the unknown parameter vector β i = β i , 1   , β i , M   as it is shown in Equation (4).
Now, to determine the MTP matrix elements,   π i j , a condition inspection data set ξ ¯ s k = ( δ ¯ s k ,   x ¯ s k   ,   z ¯ s k ) is necessary. δ ¯ s k is a dummy variable that takes a value of 1 when ɦ ¯ ( τ 1 k = i and ɦ ¯ ( τ 2 k = j , otherwise, it is 0. The life expectancy for a given condition state i , L E i s k , can be determined by calculating the reciprocal of the hazard function of that state λ ˜ i s k   i = 1 ,   ,   J 1 . To find the total life expectancy from condition state i to the final state J ,   L E i J s k , can be obtained by summing the life expectancies of each condition state. Equations (12) and (13) provide the formulas for these life expectancies.
L E i s k = 0   R i y i s k d y i s k = 0   e x p   λ ˜ i s k ε ¯ k y i s k d y i s k = 1 λ ˜ i s k
L E i J s k = i = 1 J 1 L E i s k
Hence, the application of the MMH model requires a set of inspection data, ξ ¯ s k = ( δ ¯ s k ,   x ¯ s k   ,   z ¯ s k ) , and determination of the unknown parameter vector β i = β i , 1   , β i , M   , heterogeneity factor ε k , and the hyper parameter ϕ . The parameters can be denoted as θ = β i , ϕ , ε k . As explained above, the density function π ε k follows the gamma distribution ε k   ~   G α , γ = ε k   ~   G ϕ , 1 ϕ , and the density function of the hyper parameter π ϕ also follows a gamma distribution ( ϕ   ~   G ( α 0 , γ 0 )), where α γ = 1 and α γ 2 = 1 ϕ . Thus, the heterogeneity factor is drawn by a hierarchical process, π ε k = π ε k :   ϕ and π ϕ = h (   ϕ : α 0 , γ 0 ) . The parameter β i is assumed to follow a multivariate normal distribution β i   ~   N M μ i ,   i . To estimate the parameters using the Bayesian approach, one needs to use the likelihood function defined by the prior distribution and observed data. The posterior distribution π θ ξ ¯ is proportional to the likelihood L θ ξ ¯ and the prior distribution π θ . Equation (14) gives the expression for the posterior distribution.
π θ ξ ¯   L θ ξ ¯ π θ   L θ ξ ¯ i = 1 J 1 k = 1 K π β i   π ε k :   ϕ   π ϕ   i = 1 J 1 j = i J k = 1 K s k S k ψ i j m θ ˜ i s k e x p θ ˜ m s k ε k z ¯ s k δ ¯ i j s k i = 1 J 1 exp 1 2 β i μ i i 1 β i μ i ϕ ϕ Γ ϕ ε k ϕ 1 exp ϕ ε k
Sampling the values of the parameter θ = β i , ϕ , ε k directly from the posterior distribution described in Equation (14) is difficult. Therefore, a non-parametric method called Markov Chain Monte Carlo (MCMC) is used to estimate the parameter. Interested readers can refer to the works of Kaito et al. [42] and Han et al. [36] to further explore the MMH model and the use of MCMC in the parameter estimate.

3.2. International Road Assessment Program (iRAP) Star Rating

The aim of creating a safe road infrastructure is not only to reduce the likelihood of traffic crashes, but also to make the infrastructure forgiving by minimizing the severity in the event of a crash. Achieving a safe road infrastructure requires creating a safe road environment for all road users rather than solely relying on managing road users’ behavior to improve safety. In other words, the road system needs to prevent fatalities and serious injuries due to crashes that may be caused due to road users’ errors [20,23]. In this regard, consideration of the road sections’ level of safety for each road user group is vital. To accomplish this, it is essential to consider the road features that are important for the safety of each group of road users. However, road safety assessment standards and tools have been carried out primarily based on motorized vehicle users, which limits their effectiveness. To address this limitation, the international road assessment program (iRAP) protocol has become the global standard, with 114 countries having adopted it by 2018, according to the World Health Organization [20].
The iRAP protocol utilizes an objective method to evaluate the safety of road sections. The analysis employs seven different data categories, which consist of 78 attributes that are used to examine safety. These categories comprise road context and details, midblock data, roadside data, intersection data, flow data, land use data and facilities for vulnerable road users (VRU), and speed data [43]. The iRAP assessment process assigns a star rating score (SRS) to road sections. SRS measures a relative risk of fatality and serious injury for an individual road user. The safety level is measured on a 5-star scale, with 1-star indicating the lowest safety standard (highest risk) and 5-star indicating the highest safety standard (relatively the lowest risk). The star rating for each road user group is assessed for every 100 m road section [44]. As per the global road safety performance target, a road with a 3-star rating or better is considered safe [20]. The computation of SRS is performed using Equation (15), and the procedure for determining SRS following the iRAP methodology [43] is described below.
S R S u = c = 1 C S R S = c = 1 C L u , c × S u , c × O S u , c × E F I u , c × M T u , c
where u is the road user group and c is the crash type that the road user group u may be involved in. The factors considered in the SRS calculation are: the likelihood of a crash, L , the severity of a crash, S , the operating speed, O S , the external flow influence, E F I , and median transversability, MT.
The types of crashes that different user groups can be involved in vary. When driving, vehicle occupants can experience run-off, head-on, intersection, and access point crashes while driving. In the case of motorcyclists, moving along the road is considered in addition to the vehicle occupants’ crashes. Bicyclists may experience traveling along the road, intersection, and run-off (i.e., when the bicyclist departs from the lane) crashes. Pedestrians may experience crashes while walking along or crossing the road. To calculate the SRS, the safety performance indicator, for a particular user group, you need to determine the SRS for each type of crash that the group may encounter and then add them up.
The road environment features influence the likelihood of a crash and its severity. Such influences are considered in the model through risk factors (modification factors). For example, eight factors affect the likelihood of a bicyclist’s run-off crash: lane width, curvature, curve quality, delineation, street lighting, road condition, grade, and skid resistance. On the other hand, the severity of the bicyclist’s run-off crash is determined by the distance to roadside objects and the presence of objects. For instance, run-off crashes are more likely to occur on sharp curves than straight roads. A risk factor or crash modification factor is utilized to account for this fact. A risk factor of 1, 1.8, 3.5, and 6 for straight, moderate, sharp, and very sharp curvature, respectively, is used. This means that the likelihood of a bicyclist’s run-off crash in very sharp curvature is six times greater than that in a straight road, assuming all other factors are constant. The risk factor values for all factors influencing the likelihood and severity of a particular crash will be determined based on the road section’s characteristics. Finally, the likelihood and severity of the crash will be computed by multiplying the risk factor values of the factors that influence the likelihood and severity of the crash, which will then be employed in Equation (15).
The calculation of SRS requires consideration of additional factors, such as operating speed, external flow, and median transversability. The speed at which a vehicle travels can greatly impact the likelihood and severity of a crash, especially in the case of pedestrian fatalities, where 90% of deaths occur if a vehicle traveling at 80 km/hr hits them [45]. The risk factor associated with different speeds can be determined from curves that relate various road user groups and crash types to the speed. For instance, for bicyclists’ run-off crashes at an operating speed of 50 km/hr, the risk factor is 0.011, while the risk factor for vehicle occupants’ run-off crashes is 0.064. The external flow factor for different crash types can also be obtained from curves. Median transversability is another factor that should be considered. This factor takes a value of 1 if a median can be crossed and 0 otherwise, and it only applies to run-off and head-on crashes involving vehicle occupants and motorcyclists.
The SRS for a particular type of crash is calculated by multiplying the likelihood, severity, operating speed, external flow influence, and median transversability values. Then, by adding up the SRS values for each type of crash in a given road user group, the overall SRS value for that group can be determined. The final step is to assign a safety star rating to the road section for each road user group based on the rating bands outlined in Table 1.

3.3. Decision Matrix Formulation

This study considers three factors to identify critical road sections: the pavement deterioration rate, infrastructure safety, and crash history. Each of these factors is further divided into three levels, with level 1 representing the highest criticality level and level 3 representing the lowest. The pavement deterioration rate is evaluated based on the heterogeneity factor, and the different percentiles that the heterogeneity values of road sections fall into determine the corresponding levels. Infrastructure safety levels are categorized based on star ratings, while the severity of crashes in a road section is used to categorize the levels based on crash history.
Road sections with a pavement deterioration rate below the road network’s average rate are slowly deteriorating sections. These sections have a heterogeneity factor value of less than one and are in the first or second quartile of the heterogeneity value order. On the other hand, road sections in the third and fourth quartiles are considered to have a relatively higher deterioration rate. On the other hand, road sections in the third and fourth quartiles have a relatively higher rate of deterioration. However, the road sections in the fourth quartile are of particular concern, especially those that fall within or above the 90th percentile. As a result, road sections in the 90th percentile and above are classified as having a level 1 deterioration rate, D 1 , while those between the 75th and 90th percentile are classified as level 2, D2, and those below the 75th percentile are classified as level 3, D3.
According to the United Nations, a road safety rating of 3 stars or higher is considered safe [20]. While both 1-star- and 2-star-rated roads are unsafe for users, there is a significant difference in the risk of serious injury and fatality. For example, McInerney and Fletcher [46] conducted a study and found that the costs of fatal and serious crashes per vehicle kilometer are 40% lower on 2-star roads compared to 1-star roads. Accordingly, road sections with a 1-star or 2-star rating are categorized as level 1, S 1 , and level 2, S 2 , respectively, while those with a 3-star or higher rating are categorized as level 3, S 3 . Similarly, road sections with a history of fatal and serious injury crashes are categorized as levels 1, C 1 , and 2, C 2 , respectively. In contrast, those with no or minor injury crash history are categorized in level 3, C 3 . Table 2 presents the levels based on each factor.
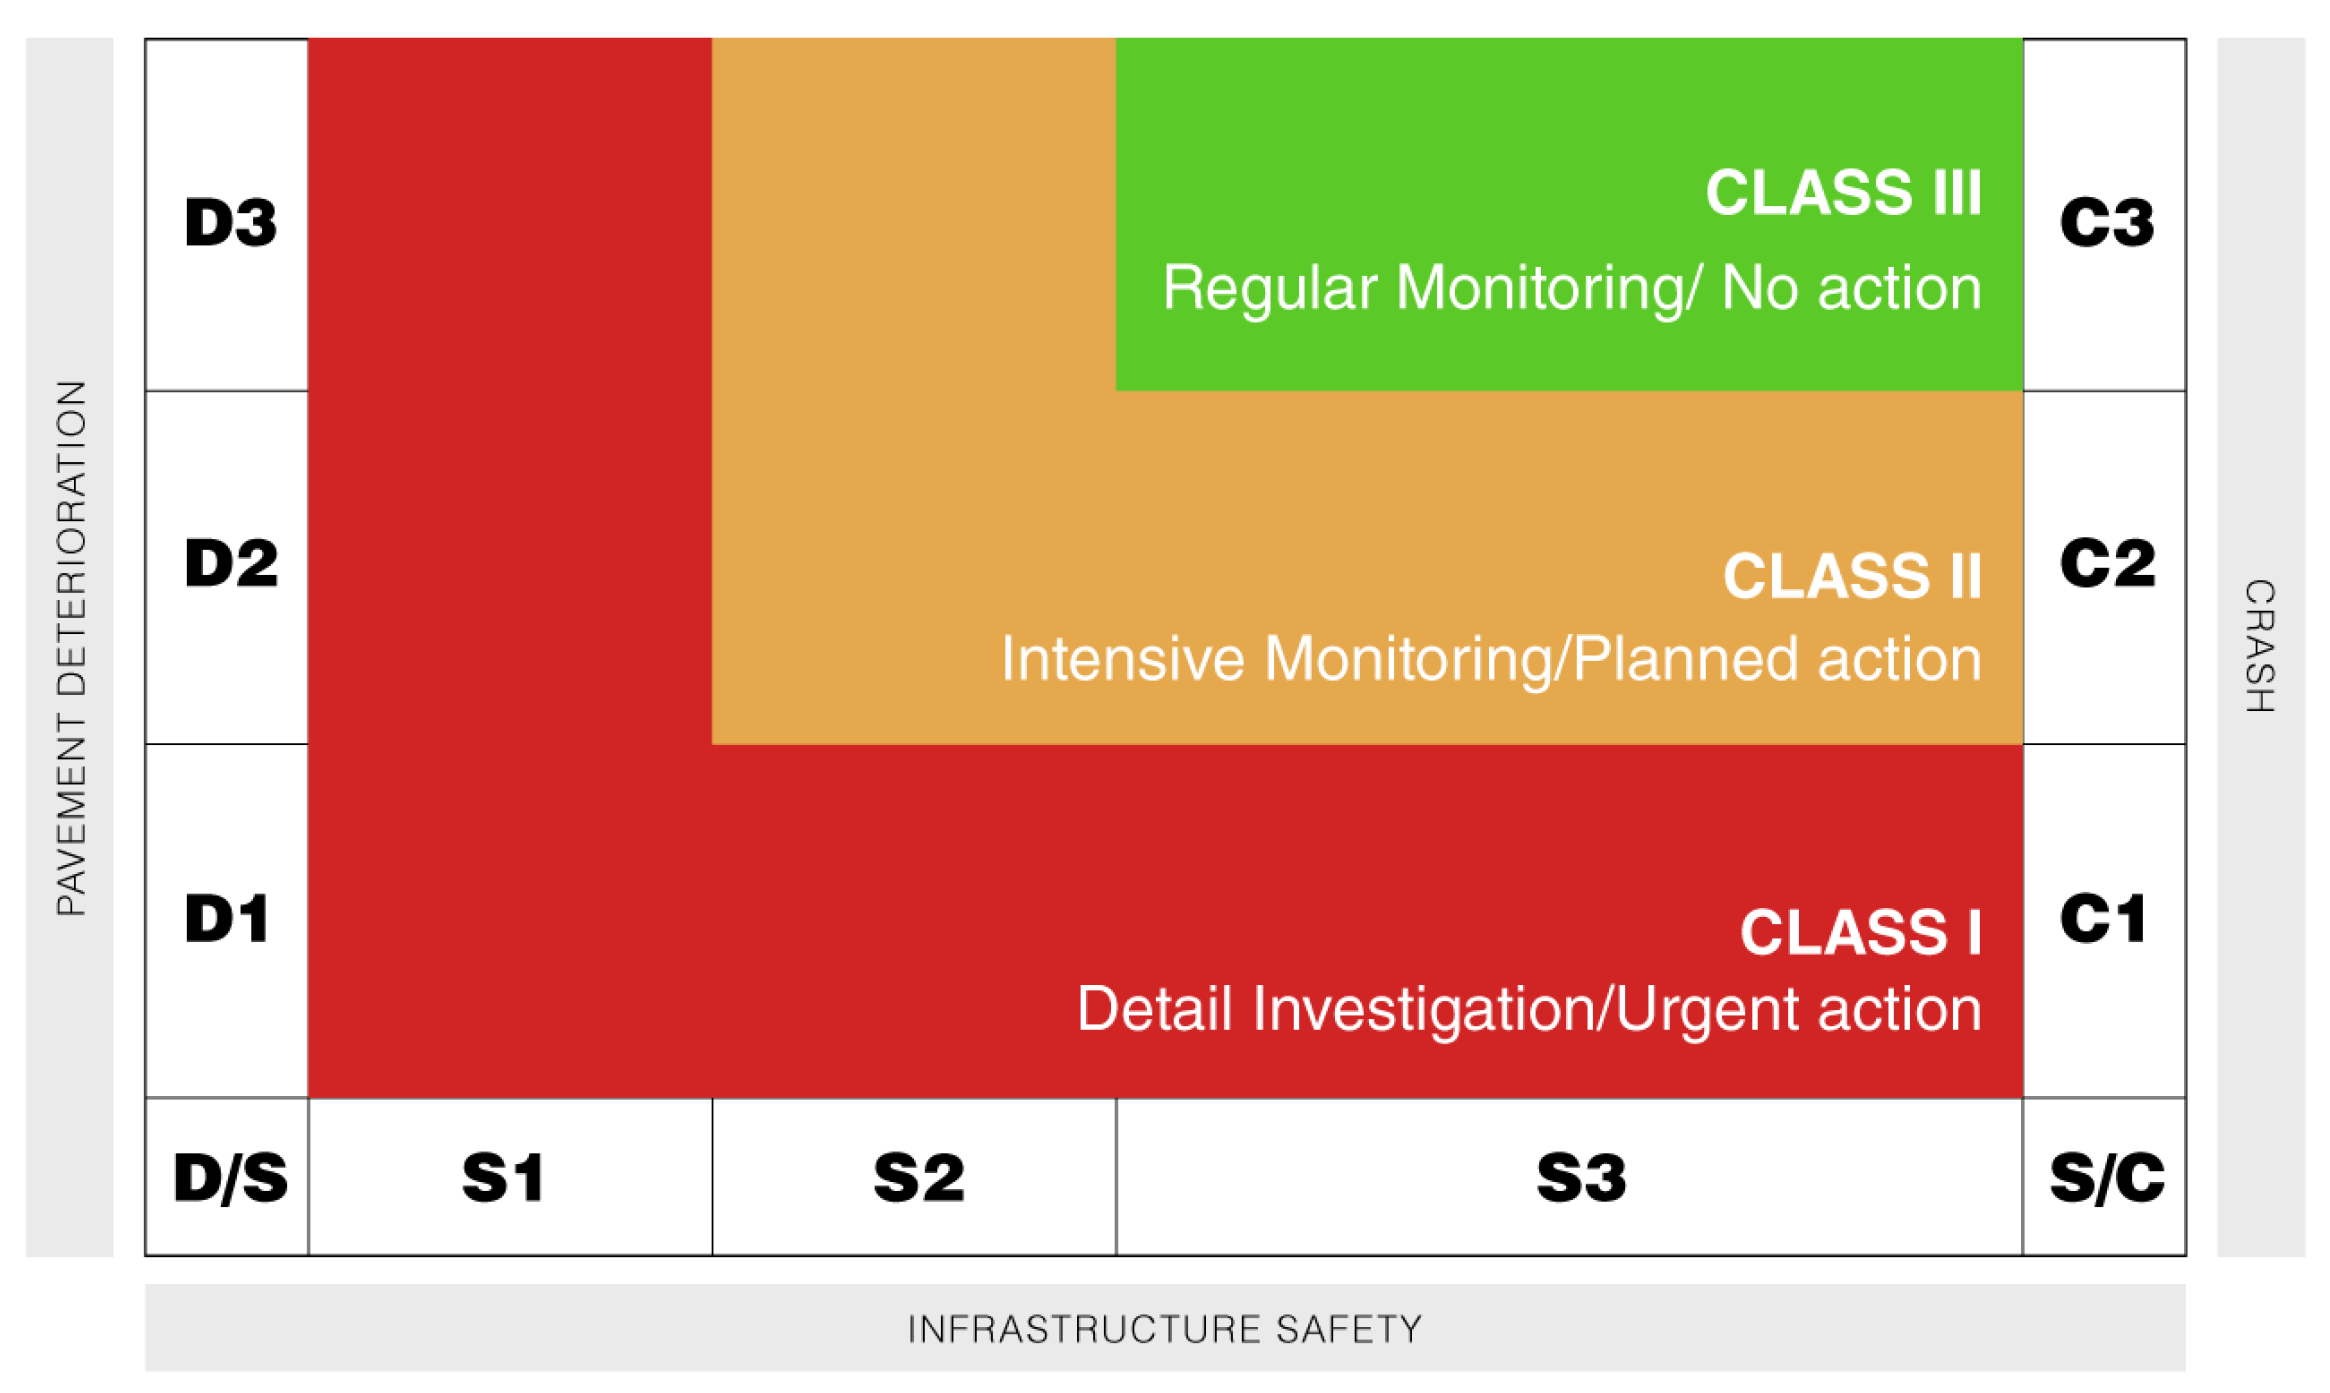
A vector of the level of the three factors D , S , C was used to classify the road sections into three classes. The highest priority was given to C L A S S   I , which is classified as such if they have at least one factor with a level 1 category. The road sections in this class are the most critical and need detailed investigation and urgent action. The second class, C L A S S   I I , of road sections have at least one factor in the level 2 category and require intensive monitoring and planned action. Finally, the least critical road sections are those in C L A S S   I I I , which have all vector values at level 3 and only require regular monitoring. Figure 3 shows the matrix representation of the three classes at the macro level.
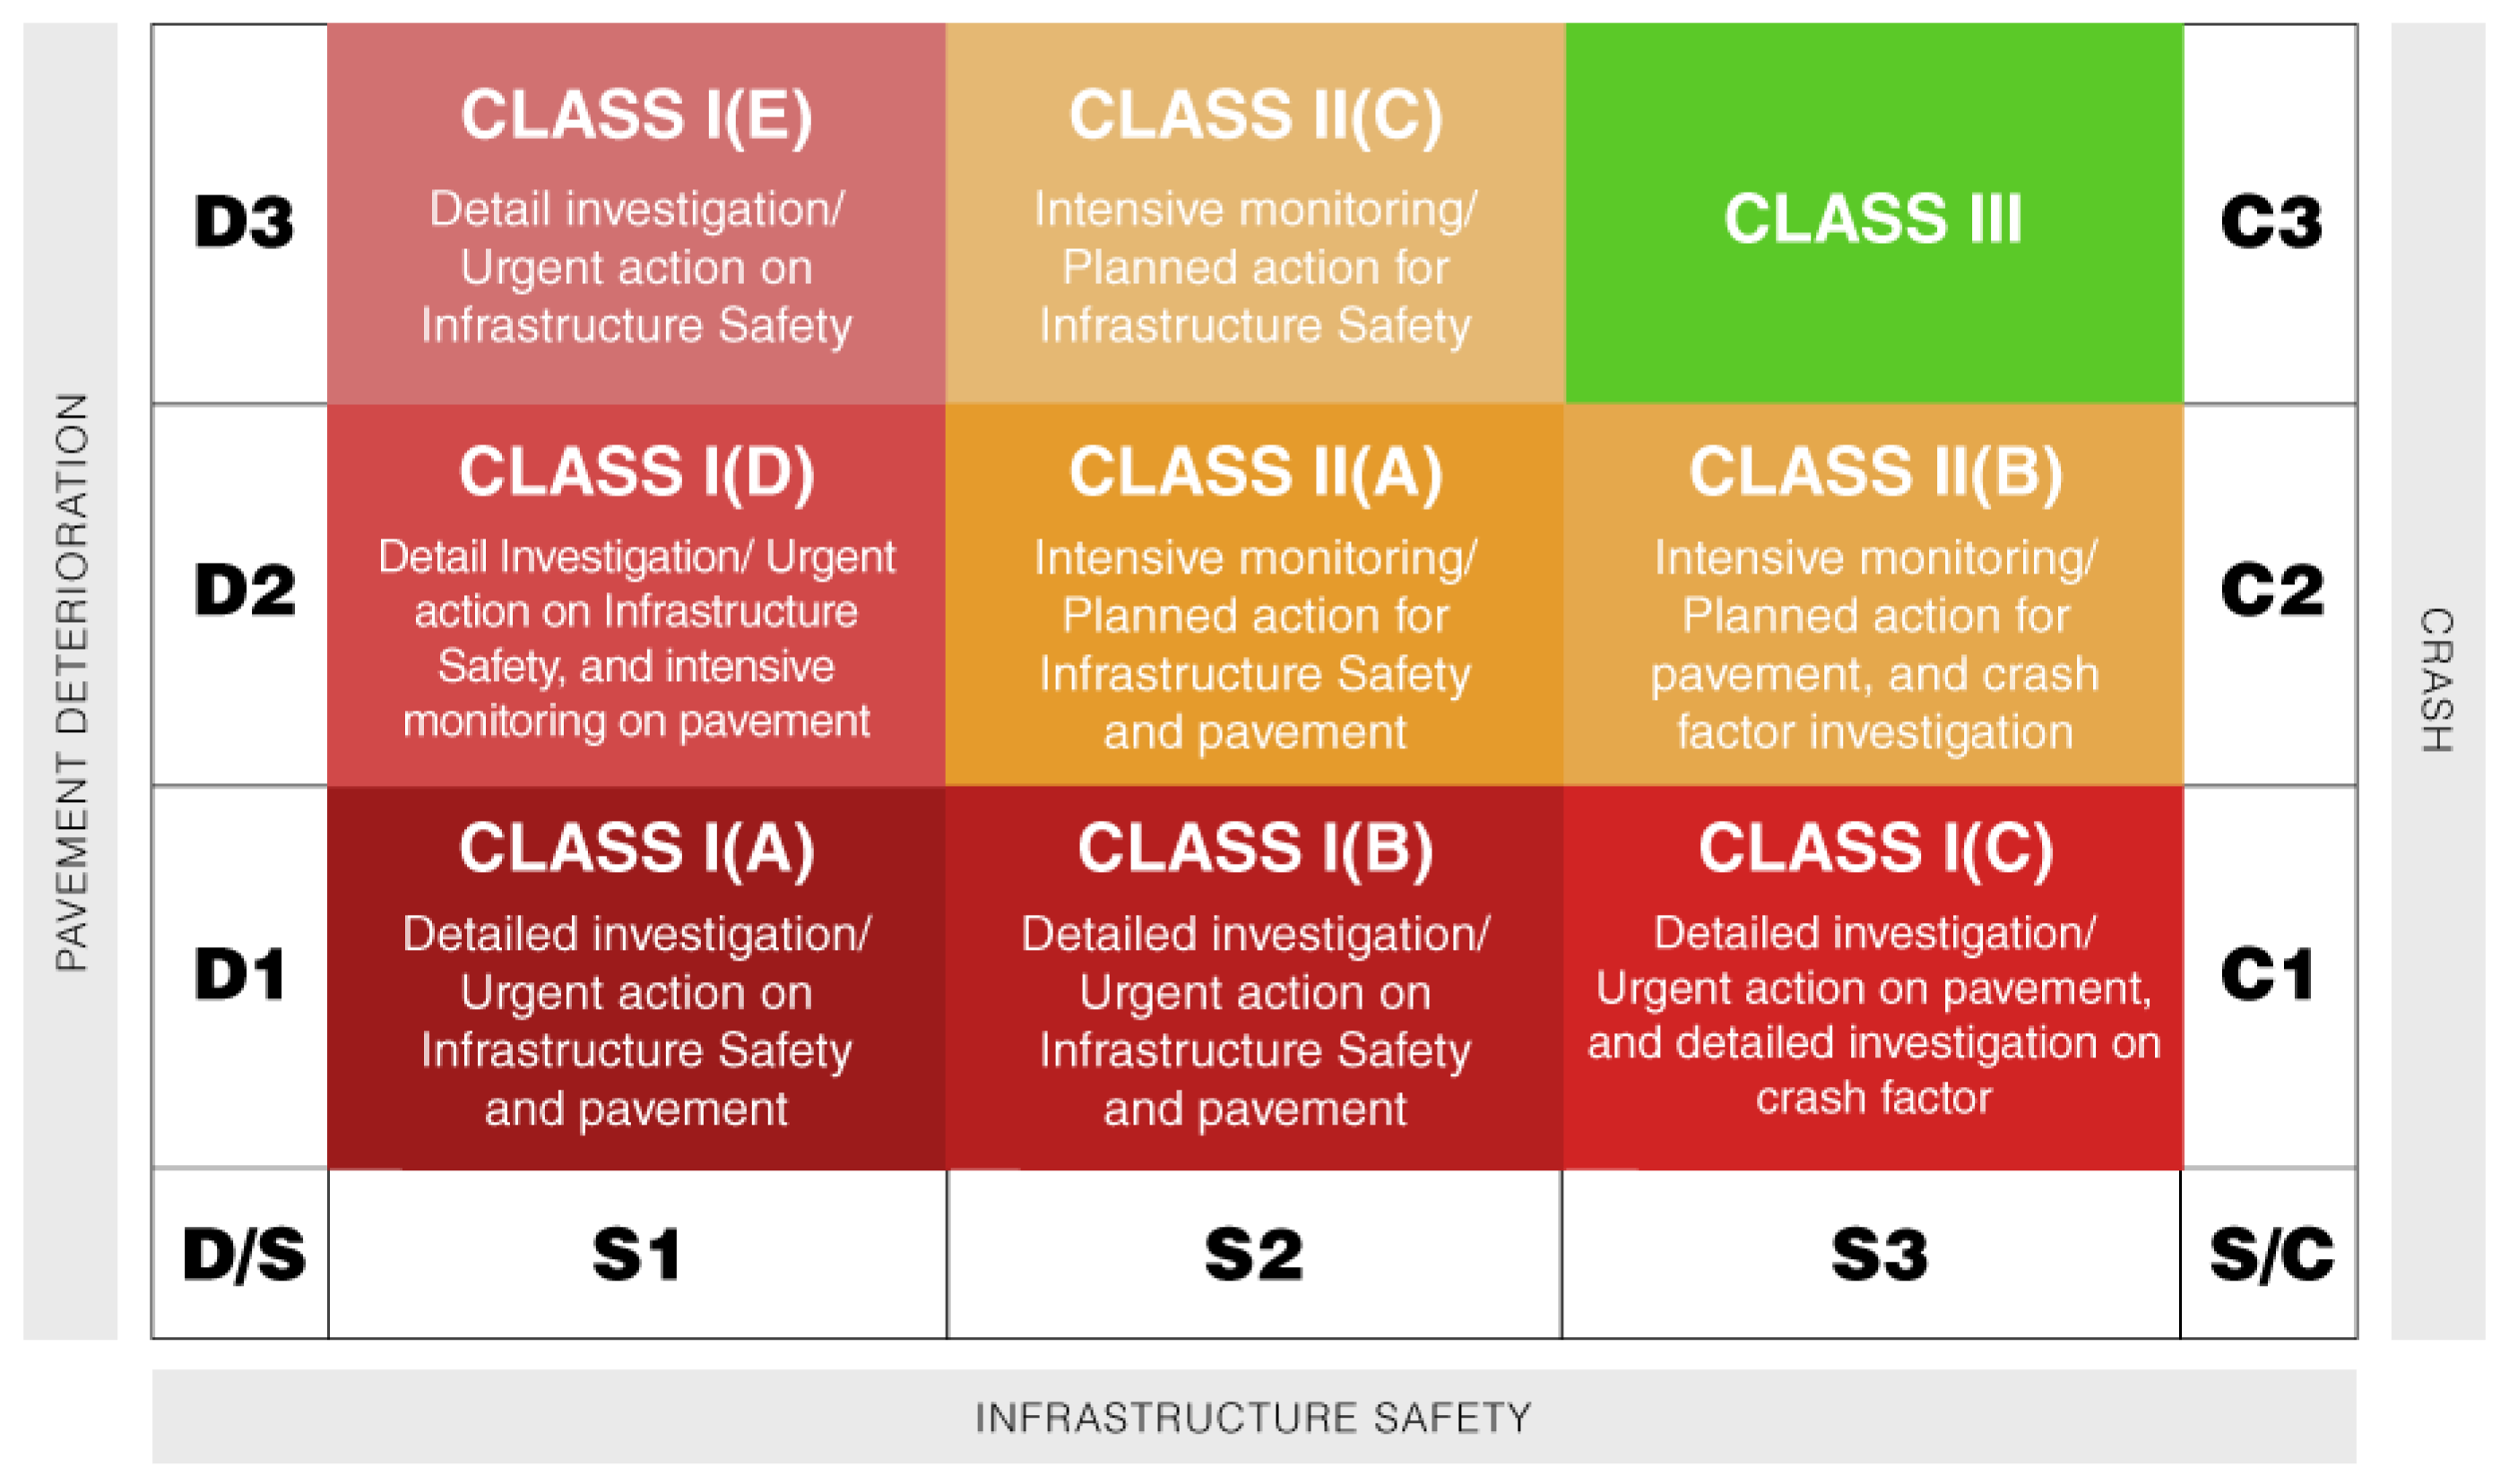
Though all road sections in C L A S S   I are critical, the criticality level differs across all sections. For example, while a road section with a vector of 1 , 1 , 1 and one with 1 , 3 , 3 are both in C L A S S   I , the former is more critical than the latter because it has a level 1 category in all factors. Accordingly, the first road section needs detailed investigation and urgent action on pavement and safety, while the second section requires urgency for the pavement. Therefore, it is essential to establish a hierarchy within the same class in order to prioritize decision-making under resource constraints. Furthermore, subclasses make it possible to pinpoint the particular factor that requires greater focus within a specific section. Therefore, C L A S S   I is subdivided into five matrix cells from highest to lowest criticality, denoted as C L A S S   I A ,   B ,   C ,   D , and E . C L A S S   I A represents a vector of 1 , 1 , 1 or D 1 , S 1 , C 1 , while C L A S S   I E represents a vector of 3 , 1 , 3 or D 3 , S 1 , C 3 . Similarly, C L A S S   I I is subdivided into three sections in order of criticality, denoted as C L A S S   I I A ,   B , and C . Hence, the decision matrix at the subdivision level can be considered the micro level. Figure 4 illustrates the matrix with the hierarchical division within a class.

3.4. Empirical Setting: Case Study

To demonstrate the proposed method empirically, actual data were employed from Addis Ababa, the capital city of Ethiopia. Addis Ababa boasts a road network with a total length of 4843.15 km, consisting of various pavement types of roads, including 1090.11 km of asphalt concrete, 2249.48 km of dressed stone (cobblestone), 177.02 km of undressed stone, 678.48 km of gravel, and 648.06 km of unpaved roads [47]. For this study, data were gathered from 472.5 km of asphalt concrete main roads, which were divided into 4725 sections, each spanning 100 m in length.
International roughness index (IRI) data collected over a three-year period (2018–2020) were used for pavement deterioration analysis. Following Addis Ababa City Roads Authority’s (AACRA) road maintenance guidelines, the pavement condition is classified into five ranks [18]. Condition state 1 denotes the best condition, whereas condition state 5 represents the worst pavement conditions. The ranking is presented in Table 3. Similarly, road sections’ data necessary for infrastructure safety analysis were obtained from iRAP which was collected in the same period in collaboration with AACRA. The crash data were obtained from Addis Ababa City Traffic Management Agency (TMA).

4. Results

The proposed method is illustrated using the road network of Addis Ababa City. The critical sections of the network are determined by analyzing three factors: the pavement deterioration rate, infrastructure safety, and crash history. The pavement deterioration rate is evaluated using the heterogeneity factor estimated by the MMH model to identify these critical sections. Additionally, the safety condition of the sections is assessed using the iRAP star rating and crash history. The findings of the case study are presented below.
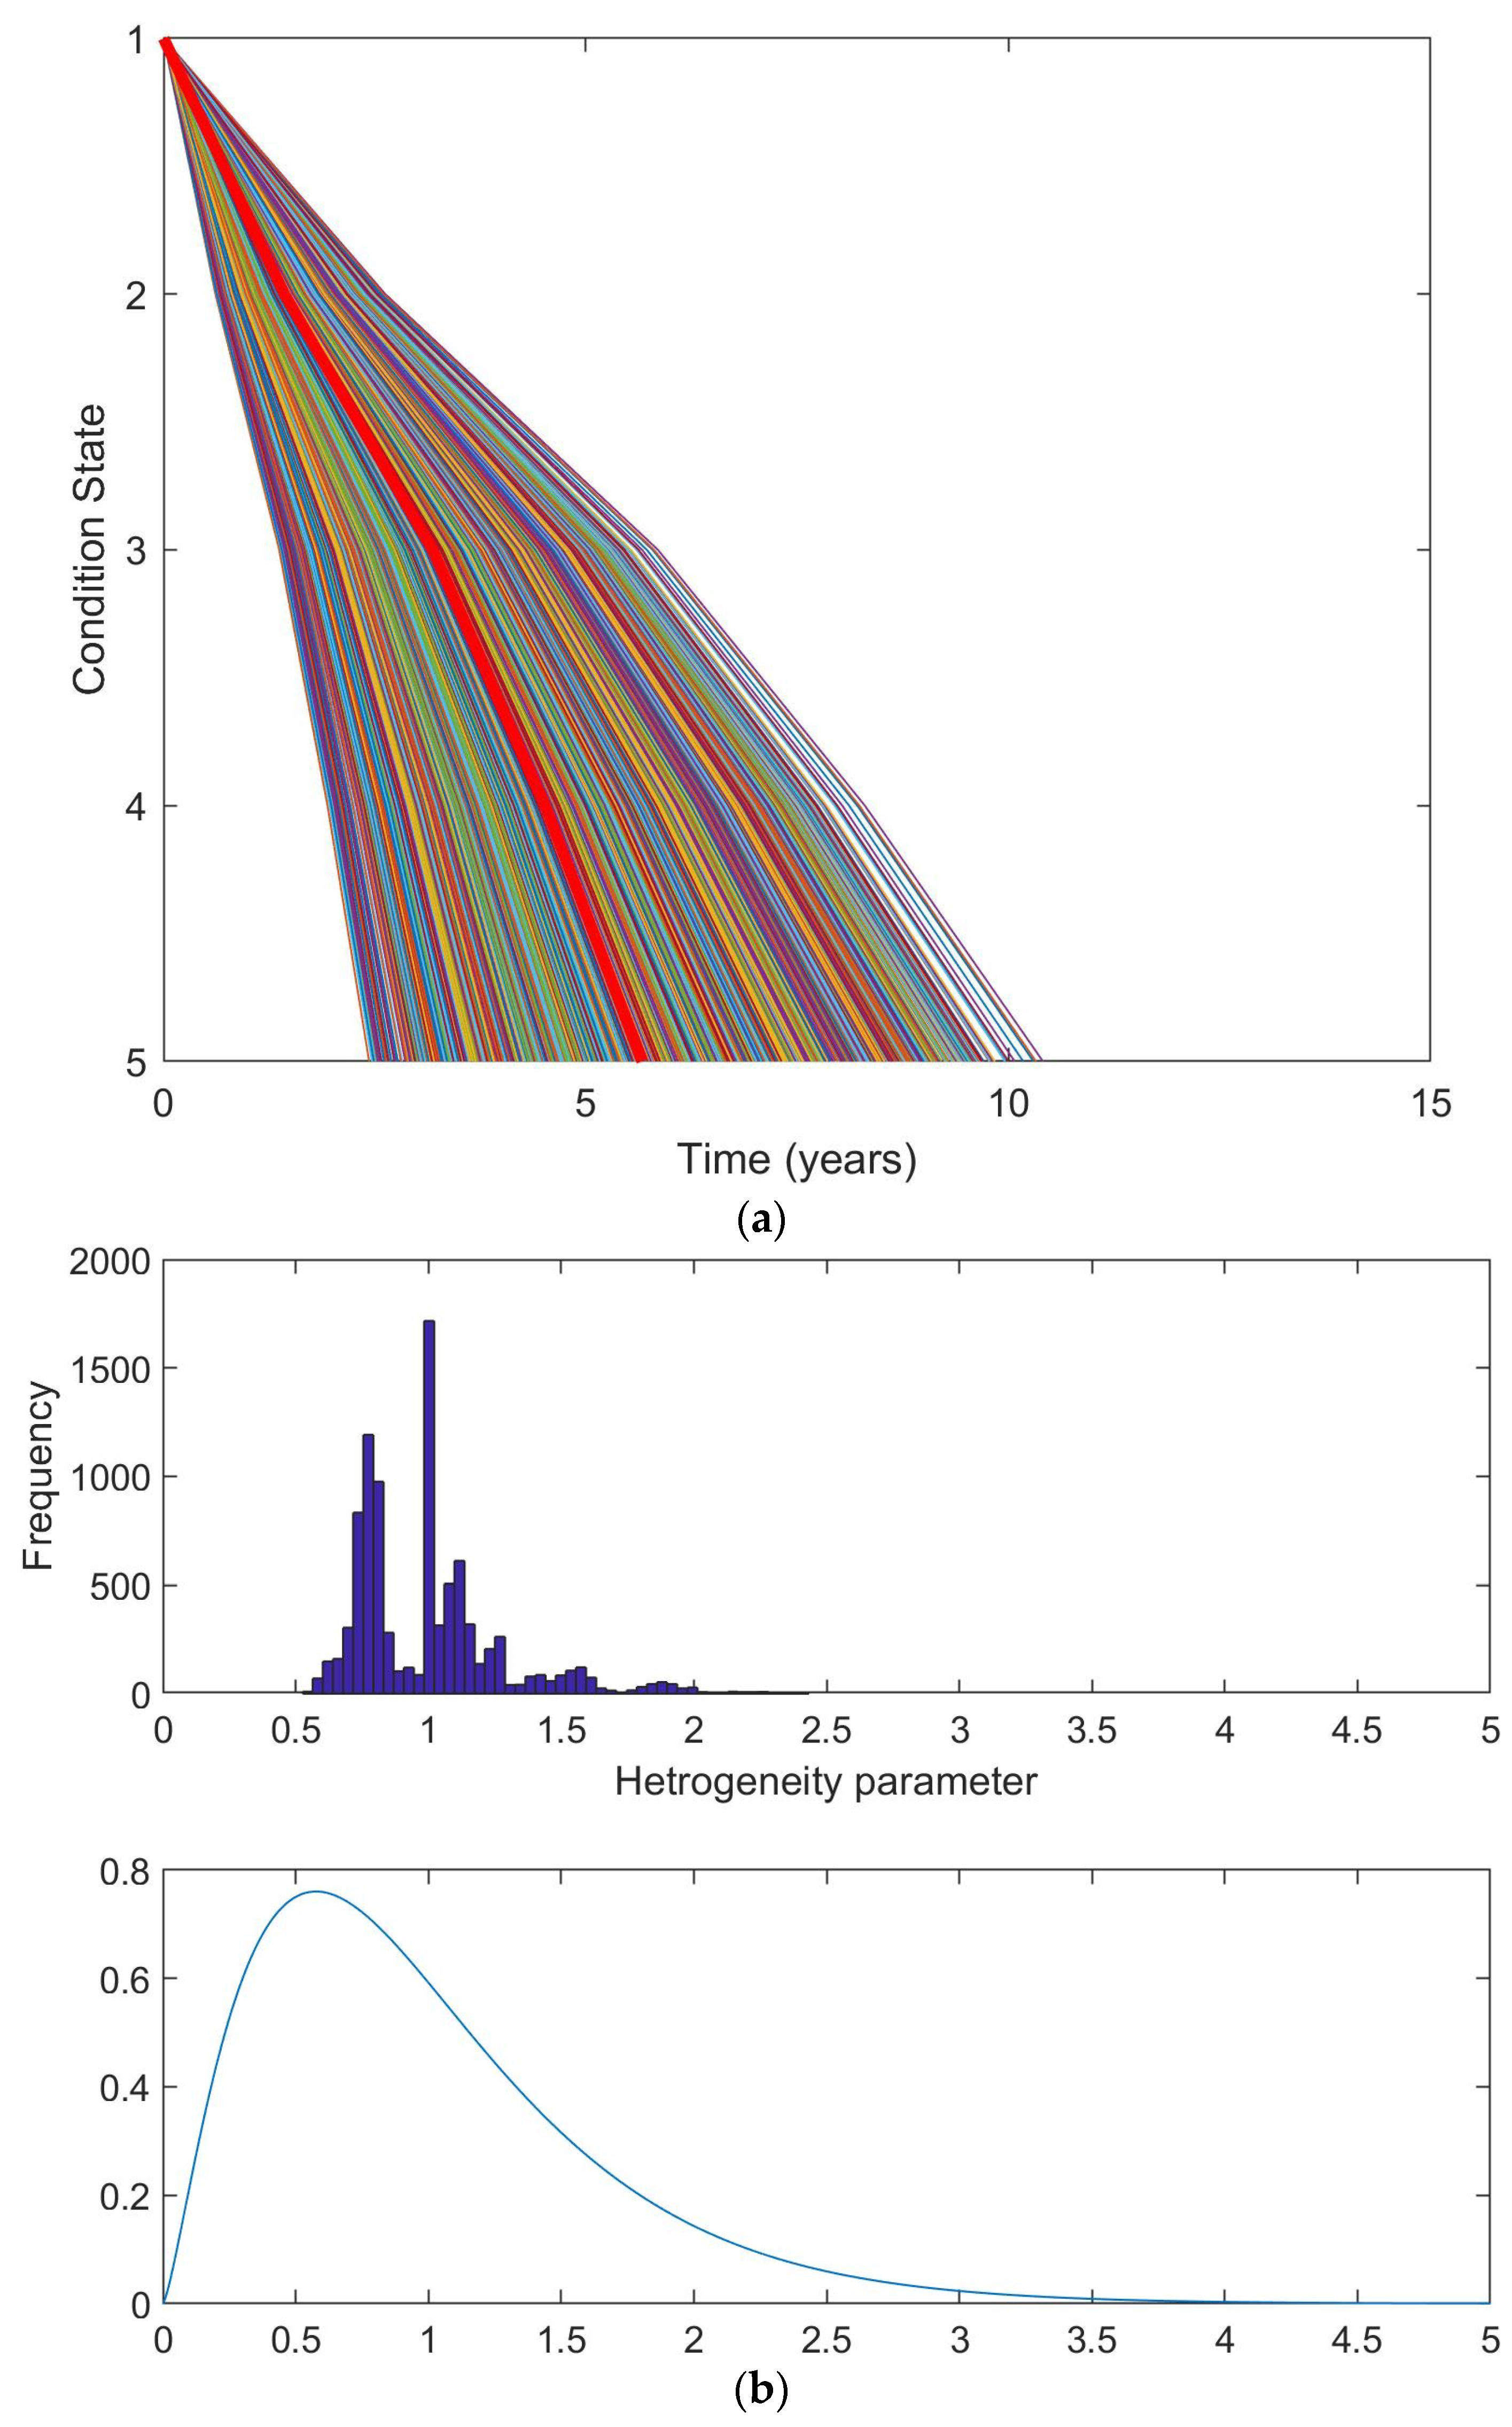
Figure 5a displays the deterioration curve of road sections where the bold red curve is the benchmark deterioration. The road sections located to the left of the benchmark have a heterogeneity factor greater than 1, which means they deteriorate relatively faster. Conversely, road sections with the curves on the right of the benchmark have heterogeneity factor values less than 1, indicating a relatively slower deterioration. Consequently, the road sections on the left have a shorter life expectancy than those on the right. The result showed that the benchmark section has a life expectancy of 6 years, but the life expectancy of the road sections varies from 2.4 to 10.7 years.
The degree of variation in the deterioration among the road sections can be determined using a heterogeneity factor. Based on this factor, it is found that road sections with a heterogeneity factor of 1.31 or higher, at the 90th percentile and above, are categorized to a level 1 deterioration rate, D 1 . This value indicates that these road sections experience deterioration at a rate that is 31% faster than the standard benchmark. Road sections with a heterogeneity factor between 1.1 and 1.31, at the 75th to 90th percentile, fall under level 2, D 2 , while those with a factor less than 1.1, below the 75th percentile, experience a level 3 deterioration rate, D 3 . The heterogeneity factor varies from 0.68 to 2.16. The distribution of the heterogeneity factor can be seen in Figure 5b.
Another important finding from the case study analysis is that most road sections in levels D 1 and D 2 have a pavement condition state that is fair or better. For instance, out of the 47.3 km of roads in level 1, D 1 , 37.8 km (80%) have a pavement condition that is fair or better, meaning their IRI value is less than six. Similarly, out of 70.7 km of roads with a level 2 deterioration rate, D 2 , 57 km (81%) have pavement conditions that are fair to better. It is noteworthy that the road section with the slowest deterioration rate (a heterogeneity factor of 0.68) and the road section with the fastest deterioration rate (a heterogeneity factor of 2.16) both have good pavement conditions with a condition state rank of 2 and an IRI value ranging from two to four. The iRAP star rating protocol was utilized to evaluate the safety of the infrastructure for different groups of road users. Addis Ababa has a road network that is relatively safe for people traveling in vehicles, with only 26% of the sections being unsafe and receiving a rating of 1 or 2 stars. However, the network is much riskier for pedestrians, with 61% of the network receiving a 1- or 2-star rating for this group. The road network is also unsafe for bicyclists following pedestrians, with 52% of the road sections being unsafe, while it is comparatively safer for motorcyclists, with only 40% being unsafe. Even though the network is relatively safe for some road users, there are still significant safety risks for all users. Therefore, the infrastructure safety level of each road section is represented by the minimum star rating among the four user groups to account for all road users’ safety risks. As a result, the network has 343.4 km (73%) of unsafe road sections.
The crash data of 467, which happened in the three years period, were obtained from TMA. Among these, 86% were fatal crashes, 10% resulted in serious injuries, and 4% caused minor injuries. Of all the crashes, 288 occurred on roads with a 1- or 2-star safety rating, 94.4% of them resulting in fatal and serious injuries. On the other hand, 179 crashes occurred on safer roads with 3-star or higher safety ratings.
According to Table 4, C L A S S   I roads make up 43.2% of the road network, which is equivalent to 204.1 km. C L A S S   I roads can be further categorized into C L A S S   I A , C L A S S   I B , and C L A S S   I C , with level vectors of 1 , 1 , 1 , 1 , 2 , 1 , and 1 , 3 , 1 , respectively. The length of these subcategories is 15.5 km (3.3%), 15.5 km (3.3%), and 16.3 km (3.4%), respectively. C L A S S   I roads also include C L A S S   I D and C L A S S   I E , which have level vectors of 2 , 1 , 2 and 3 , 1 , 3 , respectively. These roads cover 24.6 km (5.2%) and 132.2 km (28%), respectively. In addition, C L A S S   I I roads make up 37.4% of the road network, equivalent to 176.4 km. The least critical category of roads, C L A S S   I I I , makes up 19.5% of the road sections, equivalent to 92 km. The map in Figure 6 presents the distribution of critical sections in the road network.

5. Discussion

The study suggests using a decision matrix that considers three factors: the rate of deterioration, infrastructure safety, and crash history. The case study results show that it is crucial to consider the deterioration rate and infrastructure safety factors to assess pavement performance and safety proactively. Additionally, analyzing crash history can assist in identifying the root causes of crashes. The results also show the advantages of using a hierarchical decision matrix approach when resources are limited. This section focuses on discussing the findings of the case study.
It is a common practice to consider a highly deteriorated pavement as a critical section and to consider prioritization based on the level of deterioration for maintenance and repair. This approach follows corrective action rather than preventative. However, identifying critical road sections based on the deterioration rate allows for the early detection of sections with a relatively faster deterioration trend. The difference in the deterioration rates among the road sections is inevitable due to their heterogeneity. Consequently, the expected lifespan of the pavement network ranges from 2.4 to 10.7 years, with an average of 6 years. The variation in the lifespan is reflected in the heterogeneity factor, which ranges from 0.68 to 2.16. This means that some sections deteriorate much faster than others, with rates that are more than twice the average. The case study results support the importance of using the deterioration rate to identify critical sections, considering the heterogeneity property, instead of relying on prioritization based on the level of deterioration.
If critical sections are identified based on pavement condition ranks, pavements with “very poor” and “poor” conditions would be given the highest priority since they are highly deteriorated. However, while evaluating the network using the deterioration rate, only 20% of the road sections in the level 1 D 1 category is in the highly deteriorated state, whereas 80% is in “fair” or better conditions. Similarly, 81% of the level 2 D 2 pavement sections is in fair and better conditions. These results indicate that even if the pavement condition of the road sections is relatively good, they are deteriorating at an alarming rate. In other words, these sections can potentially reach their worst condition in a relatively short time if no action is taken. Therefore, early identification of sections with high deterioration speed can benefit road authorities to investigate the reason and take timely action.
Moreover, the result show that the pavements with the fastest and the slowestdeterioration rate were in the same pavement condition. Despite having a similar “good” condition, these sections had life expectancies of 2.4 and 10.7 years, respectively. This emphasizes the importance of using a deterioration rate to identify critical sections. If these two sections had been evaluated only based on their current pavement condition states they would have received the same level of attention. However, considering their deterioration rates, the section with the highest rate requires the most attention, while the other requires the least. Therefore, utilizing a deterioration rate helps to account for the variation in deterioration among the road sections due to heterogeneity, regardless of their current condition.
The case study results of the safety analysis revealed a correlation between the infrastructure safety level and crashes. It was found that the majority of crashes, specifically 61.7%, occurred on unsafe road sections. These crashes also resulted in fatal or serious injuries 94.4% of the time, which is consistent with an earlier study [38]. Therefore, this emphasizes the need for actions to improve the infrastructure safety of roads with 1- or 2-star ratings. Even if other factors contribute to crashes, enhancing the road infrastructure’s safety can reduce the severity of crashes. The remaining 38.3% of crashes occur on road sections with safe infrastructure conditions. Therefore, it is essential to investigate these incidents to determine their underlying causes and develop appropriate safety policies and regulations.
According to the case study, 43.2% of the road network, which is equivalent to 204.1 km, is classified as the C L A S S   I criticality level and requires urgent attention and detailed investigation. However, addressing all critical sections might be difficult in some situations due to resource constraints. In such cases, it is necessary to have a hierarchy of priority within each category as described in the methodology section. For example, an authority may decide to address the critical sections in phases, with the priority given to the first three subclasses of C L A S S   I . In doing so, the critical sections requiring immediate attention can be reduced to 47.3 km from 204.1 km, which allows for the concentration of resources to the 10% of the network that demands the most urgent attention.

6. Conclusions

This study proposed a decision matrix to facilitate a proactive road asset management strategy toward providing safe and effective transportation. By using the pavement deterioration rate obtained using the MMH model as a basis for detecting road sections with a high rate of deterioration, it is possible to investigate the cause in detail and take prompt action. Similarly, using the iRAP star rating in evaluating infrastructure safety enables the identification of high-risk road sections considering all road user groups, allowing appropriate action to be taken before traffic crashes occur. As demonstrated in the case study, this approach effectively identifies critical road sections in advance, favoring preventive measures over corrective ones and ultimately saving economic and social costs. Moreover, incorporating the crash history into the analysis provides initial insight to investigate the potential causes of traffic crashes, which can be used to inform the development of road safety policies and regulations.
The case study indicates that using the matrix approach is advantageous in making informed decisions when identifying critical sections instead of relying on a single factor. Specifically, this was evident in 132.2 km of road sections categorized as CLASS I (E), where they were deemed a high priority when evaluated using three factors but would be of lower priority if pavement deterioration alone was considered. The study also emphasized the importance of selecting an appropriate performance indicator within the matrix formulation. The results revealed that road sections with the same pavement conditions could be ranked as the most or least critical, up on using deterioration rate as a performance indicator. As a result, the proposed matrix approach provides a comprehensive strategy for identifying critical sections considering relevant factors and their performance indicators.
The suggested approach is applicable at various levels of decision-making. The macro-level decision matrix classifies criticality into three categories at the network level, allowing for an overall evaluation of resource needs. Meanwhile, the micro-level decision matrix divides criticality into nine categories, providing detailed information on required actions. The micro-level decision matrix helps with resource allocation by fine-tuning resource labeling. This hierarchical approach assists road authorities in planning actions within resource constraints. Furthermore, the approach offers a chance to consider other parts of the road in addition to the pavement that is necessary for the safety of non-motorized road users since the safety evaluation is conducted separately for each group of road users and the course of action is determined based on the assessment. As a result, the proposed decision matrix can be effectively used to ensure safe and efficient mobility.
The study proposes a decision matrix based on three factors, which could be used to identify critical sections for monitoring and repair. Future studies can focus on evaluating the efficiency and effectiveness of implementing this matrix in prioritizing road maintenance compared to the conventional reactive approach. Additionally, research can be conducted to identify the main factors responsible for the heterogeneity of pavement sections, particularly those with high deterioration rates.

Author Contributions

Conceptualization, A.A.A., K.S. and K.K.; methodology, A.A.A., K.S. and K.K.; formal analysis, A.A.A.; data curation, A.A.A.; writing—original draft preparation, A.A.A.; writing—review and editing, A.A.A., K.S. and K.K; supervision, K.K. All authors have read and agreed to the published version of the manuscript.

Funding

This research received no external funding.

Data Availability Statement

The data used in this study are available from the corresponding author upon reasonable request.

Acknowledgments

The authors would like to thank the Addis Ababa City Authority, Addis Ababa City Traffic Management Agency, and the International Road Assessment Program (iRAP) for providing the data used in this study.

Conflicts of Interest

The authors declare no conflict of interest.

References

  1. Canning, D.; Bennathan, E. The Social Rate of Return on Infrastructure Investments; The World Bank: Washington, DC, USA, 2000. [Google Scholar]
  2. Gunasekera, K.; Anderson, W.; Lakshmanan, T.R. Highway-induced Development: Evidence from Sri Lanka. World Dev. 2008, 36, 2371–2389. [Google Scholar] [CrossRef]
  3. Ng, C.P.; Law, T.H.; Jakarni, F.M.; Kulanthayan, S. Road Infrastructure development and Economic Growth. In Proceedings of the 10th Malaysian Road Conference & Exhibition, Selangor, Malaysia, 29–31 October 2018. [Google Scholar] [CrossRef]
  4. Burningham, S.; Stankevich, N. Why Road Maintenance Is Important and How to Get It Done; The World Bank: Washington, DC, USA, 2005. [Google Scholar]
  5. Okte, E.; Al-Qadi, I.L.; Ozer, H. Effects of Pavement Condition on LCCA User Costs. TRR 2019, 2673, 339–350. [Google Scholar] [CrossRef]
  6. Hammarstrom, U.; Erikson, J.; Karlson, R.; Yahya, M.R. Rolling Resistance Model, Fuel Consumption Model and the Traffic Energy Saving Potential from Changed Road Surface Conditions; VTI Rapport 748A; Swedish National Road and Transport Research Institute (VTI): Linkoping, Sweden, 2012. [Google Scholar]
  7. Sayadinia, S.; Beheshitinia, M.A. Proposing a New Hybrid Multi-Criteria Decision-making Approach for Road Maintenance Approach. Int. J. Qual. Reliab. 2021, 38, 1661–1679. [Google Scholar] [CrossRef]
  8. Deluka-Tibljas, A.; Karleusa, B.; Dragicevic, N. Review of Multicriteria-analysis Methods Application in Decision Making About Transport Infrastructure. Gradevinar 2013, 65, 619–631. [Google Scholar]
  9. Victoria State Government Department of Treansport (Vicroads). Pavement Management Strategic Plan; Vicroads: Melbourne, Australia, 2021. [Google Scholar]
  10. Texas Department of Transportation. Condition of Texas Pavements: PMS Annual Report FY 2018–2021; Texas Department of Transportation: Austin, TX, USA, 2021.
  11. Japan International Cooperation Agency. Road Maintenance Plan Guideline; Japan International Cooperation Agency: Addis Ababa, Ethiopia, 2019.
  12. Ragnoli, A.; De Balsiis, M.R.; Di Benedetto, A. Pavement Distress Detection Methods: A Review. Infrastructures 2018, 3, 58. [Google Scholar] [CrossRef] [Green Version]
  13. Kaito, K.; Sakai, Y.; Tsukamoto, S.; Mizutani, D.; Kobayashi, K. A Multi-Hierarchical Mixed Markov Deterioration Hazard Model: Applying for Deterioration Speed Evaluation for Joint Members. J. Jpn. Soc. Civ. Eng. 2015, 71, 1–18. (In Japanese) [Google Scholar]
  14. Federal Highway Administration (FHWA). Pavement Preservation: A Road Map for the Future. In Proceedings of the Pavement Preservation Forum, Kansas City, MO, USA, 26–28 October 1998. [Google Scholar]
  15. Federal Highway Administration (FHWA). Insights into Pavement Reservation: A Compendium; FHWA: Washington, DC, USA, 2000.
  16. Munawar, H.S.; Hammad, A.W.A.; Haddad, A.; Soares, C.A.P.; Waller, S.T. Image based crack detection Methods: A Review. Infrastructures 2021, 6, 115. [Google Scholar] [CrossRef]
  17. Karballaeezadeh, N.; Zaremotekhases, F.; Shamshirband, S.; Mosavi, A.; Navipour, N.; Csiba, P.; Varikonyi-Koczy, A.R. Intelligent Road Inspection with Advanced Machine Learning; Hybrid Prediction Models for Smart Mobility and Transportation Maintenance Systems. Energies 2020, 13, 1718. [Google Scholar] [CrossRef] [Green Version]
  18. Chen, W.; Zheng, M. Multi-objective optimization for pavement maintenance and rehabilitation decision-making: A critical review and future directions. Autom. Constr. 2021, 130, 103840. [Google Scholar] [CrossRef]
  19. Abdel-Aty, M.A.; Radwan, A.S. Modeling Traffic Accident Occurrence and Involvement. Accid. Anal. Prev. 2000, 32, 633–642. [Google Scholar] [CrossRef]
  20. World Health Organization (WHO). Global Status Report on Road Safety 2018; WHO: Geneva, Switzerland, 2018. [Google Scholar]
  21. Stigson, H.; Krafft, M.; Tingvall, C. Use of Fatal Real-life Crashes to Analyze a Safe Road Transport System Model, Including the Road User, the Vehicle, and the Road. Traffic Inj. Prev. 2008, 9, 463–471. [Google Scholar] [CrossRef] [PubMed]
  22. Miller, T.R.; Zaloshinja, E. On a Crash Course: The Dangers and Health Costs of Deficient Roadways; Pacific Institute for Research and Evaluation (PIRE): Washington, DC, USA, 2009. [Google Scholar]
  23. Wegman, F. The Future of Road Safety: A Worldwide Perspective. IATTS 2017, 40, 66–71. [Google Scholar] [CrossRef] [Green Version]
  24. Lee, J.; Nam, B.; Abdel-Aty, M. Effects of Pavement Surface Conditions on Traffic Crash Severity. J. Transp. Eng. 2015, 141, 04015020. [Google Scholar] [CrossRef]
  25. Agarwal, P.K.; Jain, V.; Bhawsar, U. Development of a Hierarchical Structure to Identify Critical Maintenance Components Affecting Road Safety. Procedia Soc. Behav. Sci. 2013, 104, 292–301. [Google Scholar] [CrossRef] [Green Version]
  26. Ramadhan, R.H.; Al-Abdul Wahhab, H.I.; Duffuaa, S.O. The Use of an Analytical Hierarchy Process in Pavement Maintenance Priority Ranking. J. Qual. Maint. Eng. 1999, 5, 25–39. [Google Scholar] [CrossRef]
  27. Moazami, D.; Behbahani, H.; Muniandy, R. Pavement Rehabilitation and Maintenance Prioritization of Urban Roads Using Fuzzy Logic. Expert Syst. Appl. 2011, 38, 12869–12879. [Google Scholar] [CrossRef]
  28. Babashamsi, P.; Golzadfar, A.; Yusef, N.I.M.; Ceylan, H.; Nor, G.M.N. Integrated Fuzzy Analytic Hierarchy Process and VIKOR Method in the Prioritization of Pavement Maintenance Activities. Int. J. Pavement Res. Technol. 2016, 9, 112–120. [Google Scholar] [CrossRef] [Green Version]
  29. Hendhratmoyo, A.; Syafi, I.; Pramesti, F.P. The Evaluation of Screening Process and Local Bureaucracy in Determining the Priority of Urban Roads Maintenance and Rehabilitation. J. Phys. Conf. Ser. 2017, 909, 012072. [Google Scholar] [CrossRef]
  30. Li, H.; Ni, F.; Dong, Q.; Zhu, Y. Application of Analytic Hierarchy Process in Network Level Pavement Maintenance Decision-making. Int. J. Pavement Res. Technol. 2018, 11, 345–354. [Google Scholar] [CrossRef]
  31. Singh, A.P.; Sharma, A.; Mishra, R.; Wagle, M.; Sarkar, A.K. Pavement Condition Assessment Using Soft Computing Techniques. Int. J. Pavement Res. Technol. 2018, 111, 564–581. [Google Scholar] [CrossRef]
  32. Siswanto, H.; Supriyanto, B.; Pranoto, R.; Prihatditya, P.; Friansa, M.A. District Road Maintenance Priority Using Analytical Hierarchy Process. AIP Conf. Proc. 2019, 2114, 060019. [Google Scholar]
  33. Surbakti, M.; Harefa, K.C. Study of Road Maintenance Program Priority, Using the Analytical Network Process. IOP Conf. Ser. Mater. Sci. Eng. 2017, 180, 012144. [Google Scholar] [CrossRef]
  34. Batac, G.; Ray, M. French Strategy for Preventive Road Maintenance: Why and How? TRR 1988, 1183, 22–34. [Google Scholar]
  35. Obama, K.; Okada, K.; Kaito, K.; Kobayashi, K. Disaggregated Hazard Rates Evaluation and Bench-marking. J. Jpn. Soc. Civ. Eng. 2008, 64, 857–874. (In Japanese) [Google Scholar] [CrossRef] [Green Version]
  36. Han, D.; Kaito, K.; Kobayashi, K.; Aoki, K. Performance Evaluation of Advanced Pavement Materials by Bayesian Markov Mixture Hazard Model. KSCE J. Civ. Eng. 2016, 20, 729–737. [Google Scholar] [CrossRef]
  37. Tighe, S.; Li, N.; Falls, L.C.; Haas, R. Incorporating Road Safety into Pavement Management. TRR 2000, 1699, 1–10. [Google Scholar] [CrossRef]
  38. Vaiana, R.; Perri, G.; Iuele, T.; Gallelli, V. A Comprehensive Approach Combining Regulatory Procedures and Accident Data Analysis for Road Safety Management Based on the European Directive 2019/1936/EC. Safety 2021, 7, 6. [Google Scholar] [CrossRef]
  39. Karimzadeh, A.; Shoghli, A. Predictive Analytics for Roadway Maintenance: A Review of Current Models, Challenges, and Opportunities. Civ. Eng.J. 2020, 6, 602–625. [Google Scholar] [CrossRef] [Green Version]
  40. Kobayashi, K.; Kaito, K. Big Data-based Deterioration Prediction Models and Infrastructure Management: Towards Assetmetrics. Struc. Infrastruct. Eng. 2016, 13, 84–93. [Google Scholar] [CrossRef]
  41. Han, D. Heterogeneous Deterioration Process and Risk of Deficiencies of Aging Bridges for Transportation Asset Management. Sustainability 2021, 13, 7094. [Google Scholar] [CrossRef]
  42. Kaito, K.; Kobayashi, K.; Aoki, K.; Matsuoka, K. Hierarchical Bayesian Estimation of Mixed Hazard Models. J. Jpn. Soc. Civ. Eng. 2012, 68, 255–271. (In Japanese) [Google Scholar]
  43. iRAP Methodology Fact Sheets—iRAP. Available online: https://irap.org/methodology/ (accessed on 12 January 2023).
  44. International Road Assessment Programme (iRAP). iRAP Star Rating and Investment Plan Manual; iRAP: London, UK, 2021. [Google Scholar]
  45. International Road Assessment Programme (iRAP). iRAP Model Factsheet—Operating Speed; iRAP: London, UK, 2014. [Google Scholar]
  46. McInerney, R.; Fletcher, M. Relationship between Star Ratings and Crash Cost per Kilometre Travelled: The Bruce Highway, Australia. Available online: http://www.irap.org (accessed on 12 January 2023).
  47. Addis Ababa City Roads Authority (AACRA). Addis Ababa City Road Inventory Report; Addis Ababa City Roads Authority (AACRA): Addis Ababa, Ethiopia, 2020. [Google Scholar]
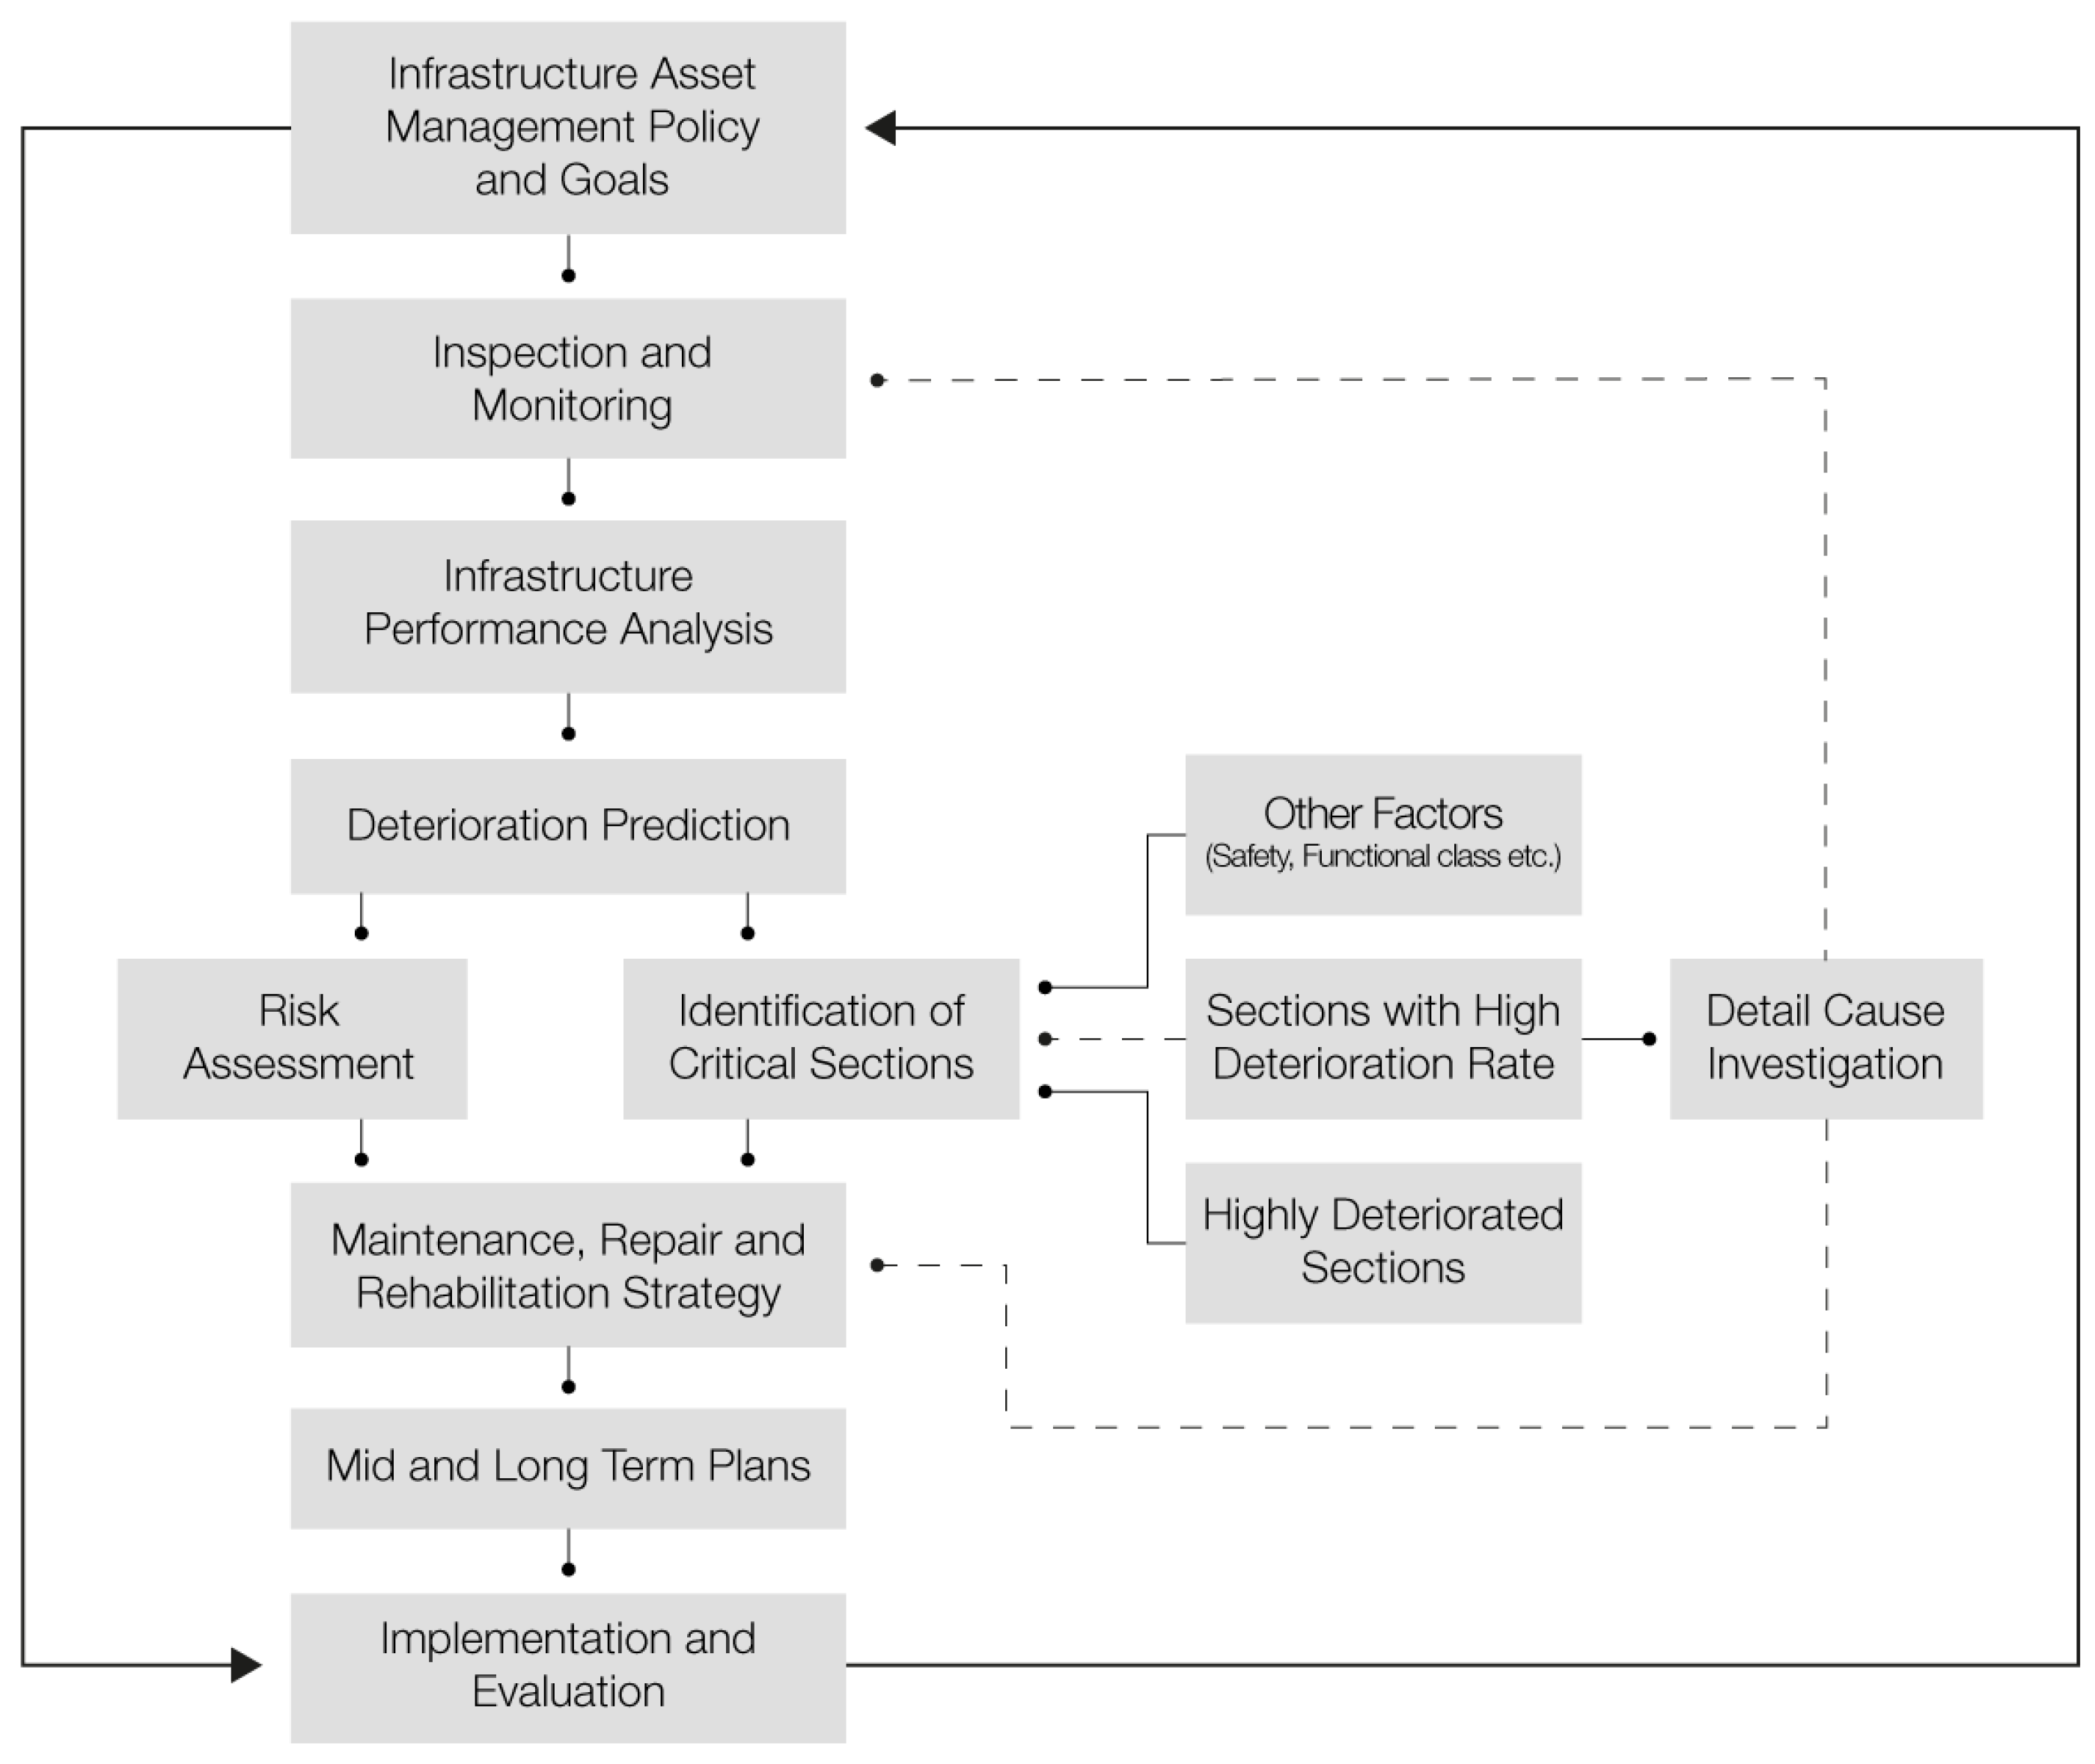
Figure 1. Simplified road infrastructure management flowchart. The dotted lines indicate the suggested proactive approach to be considered in the process.
Sustainability 15 07244 g001
Figure 2. Research process diagram.
Sustainability 15 07244 g002
Figure 3. Macro level road section criticality decision matrix.
Sustainability 15 07244 g003
Figure 4. Micro level road section criticality decision matrix.
Sustainability 15 07244 g004
Figure 5. Heterogeneous deterioration among the pavement sections. (a) Pavement deterioration curves where the bold red curve is the benchmark deterioration and (b) dispersion of pavement deterioration rates as expressed by the heterogeneity factor’s histogram (upper) and density plot following the gamma distribution in Equation (6) (lower).
Sustainability 15 07244 g005
Figure 6. Road Network Map Highlighting Critical Sections (Classes I, II, and III as 1 (red), 2 (yellow), and 3 (green), respectively).
Sustainability 15 07244 g006
Table 1. Star rating bands.
Star RatingStar Rating Score
Vehicle Occupants and MotorcyclistsBicyclistsPedestrians
TotalAlongCrossing
50 to <2.50 to <50 to <50 to <0.20 to <4.8
42.5 to <55 to <105 to <150.2 to <14.8 to <14
35 to <12.510 to <3015 to <401 to <7.514 to <32.5
212.5 to <22.530 to <6040 to <907.5 to <1532.5 to <75
122.5+60+90+15+75+
Table 2. Road sections’ criticality levels.
CategoryFactors
Pavement Deterioration Rate
(Percentile of ε)
Infrastructure Safety
(Star Rating)
Crash History
(Injury Severity)
Level 1 90 th percentile ( D 1 )1-star ( S 1 )Fatal ( C 1 )
Level 2 75 th 90 th percentile ( D 2 )2-star ( S 2 )Serious injury ( C 2 )
Level 3Below 75 th percentile ( D 3 )3-star and above ( S 3 )Minor injury ( C 3 )
Table 3. Pavement condition rating.
Condition StatesIRI (m/km)Remark
1<2Very Good
22 ≤ IRI < 4Good
34 ≤ IRI < 6Fair
46 ≤ IRI < 8Poor
5IRI ≥ 8Very Poor
Table 4. Critical road sections’ proportion in the road network.
CLASSLength (km)Percentage (%)
CLASS IA15.53.3
B15.53.3
C16.33.4
D24.65.2
E132.228
Total204.143.2
CLASS IIA25.35.4
B20.84.4
C130.327.6
Total176.437.4
CLASS III9219.5
Disclaimer/Publisher’s Note: The statements, opinions and data contained in all publications are solely those of the individual author(s) and contributor(s) and not of MDPI and/or the editor(s). MDPI and/or the editor(s) disclaim responsibility for any injury to people or property resulting from any ideas, methods, instructions or products referred to in the content.