Abstract
Pile base resistance is an important part of the ultimate bearing capacity, and the soil within a certain range above and below the pile end contributes to the pile base resistance. In general, pile base resistance is calculated according to the average value of soil strength within a certain range of the pile end in the current calculating method, so it is very important to determine the influence range of pile base resistance. Based on the soil parameters and the results of the cone penetration test of the LiuHua 11-1 site in the South China Sea, the difference of pile base resistance calculated by different methods, the regularity of pile base resistance affected by calculation depth range is revealed. Additionally, the numerical simulation method is used to analyze the distribution of a plastic zone around the pile end in homogeneous soil and stratified soil, the results show the influence depth range of pile base resistance is 0.12 D above the pile end to 0.83 D below the pile end in clay, and the influence depth range is 0.9 D above the pile end to 1.3 D below the pile end in stratified soil.
1. Introduction
Pile foundation is the main foundation form of offshore platform and offshore wind power [1,2,3,4]. The ultimate bearing capacity is an important content in the design of pile foundation, and there are two main methods to calculate the bearing capacity of pile foundation in the current relevant specifications for marine engineering; one is based on the undrained shear strength of soil [5], and the other is based on the results of an in situ cone penetration test (CPT/CPTU). Regardless of the calculation method, the bearing capacity is divided into skin friction and base resistance.
The method, which is based on undrained shear strength to calculate pile base resistance, can be divided into theoretical method and empirical method based on experimental data. Terzaghi [6], Meyerhof [7,8,9,10], Berezantzev [11], and Hu [12] proposed theoretical calculation methods of unit pile base resistance based on limit analysis theory according to the failure mode of soil in the pile end. Vesic [13] proposed a calculation method of pile base resistance based on the theory of cavity expansion, and the formula for calculating pile base resistance by all theoretical methods is NcSu, where Nc is the coefficient of pile base resistance. Wilson [14] suggested that Nc should be taken as 8.0 by the pile base resistance tests in clay. To measure pile base resistance, six tests were conducted by Meigh [15] and Yassin [16] in undisturbed soil and remolded soil in Imperial College London, and Skempton [17] suggested that Nc should be taken as 9.0 based on six test results and the theoretical analysis of Meyerhof and Mott–Gibson. Randoplh et al. [18], who combined with the empirical coefficient of deep foundation base resistance of Skempton and the theoretical solution of base resistance coefficient established by Vesic based on cavity expansion theory, recommended Nc as 9.0. This coefficient was introduced into the American Petroleum Institute (API), which is a standard method widely used in offshore pile foundation engineering for determining unit pile base resistance based on undrained shear strength. The end is at least three diameters above the bottom of the layer to preclude punch-through in layered soils, and the unit pile base resistance should be corrected if this distance cannot be reached.
The penetration mechanism of the cone penetration test and driven pile is similar, and with the improvement of in situ test technology and data acquisition, the measurement results are more accurate and reliable, so the method of calculating pile base resistance based on in situ cone penetration test results gradually emerged in recent years [19,20,21,22]. Scholars proposed a variety of methods for calculating pile base resistance based on the cone penetration test. These methods all adopt the method of multiplying cone penetration resistance by empirical coefficient. Each method considers the influence of soil in a certain range above and below the pile end on the pile base resistance because the soil in a certain range above and below the pile end contributes to the pile base resistance. However, due to the complexity of determining the depth range of pile base resistance, the depth range of cone penetration resistance is different when calculating pile base resistance by various methods, which leads to the difference of calculation results. For example, the average cone penetration resistance depth proposed by Schmertmann [23] ranges from 8 D above the pile end to 0.7 D–4 D below the pile end. The average cone penetration resistance depth range of European [24] is 0.7 D–4 D below the pile end. ICP [25] and LCPC [26] adopt the depth range of ±1.5 D at the pile end. Based on the test results of the unified database, Lehane [27] proposed to use the range of 20 times the pile wall thickness below the pile end. Although the depth range of the Fugro [28] method also uses ± 1.5 D at the pile end, it takes the average value of the net cone penetration resistance.
It can be seen that the influence range of pile base resistance has a great influence on the calculation of pile base resistance, especially when the pile end is in the clay layer with the thin sand layer. Based on the soil layer data and cone penetration test data of the Liuhua site in the South China Sea, this paper analyzes the differences of the calculation methods of ultimate unit base resistance, analyzes the distribution of the plastic zone of the soil around the pile end by numerical simulation, and gives the recommended range of influence of the pile base resistance. The research results can provide a reference for the pile base resistance in the South China Sea.
2. Difference in Calculation Formula of Pile Base Resistance
2.1. Engineering Example
The design parameters of the pile foundation of a deep water jacket platform in Liuhua are shown in Table 1. The sampling depth of the borehole in the site is 170 m, and the geological data exposed are shown in Table 2.

Table 1.
Design parameters of pile foundation.
Table 2.
Soil parameters.
The penetration depth of an in situ cone penetration test is 170 m, and the test results are shown in Figure 1.
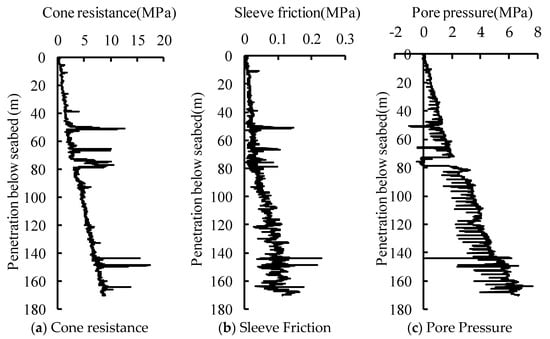
Figure 1.
Data of cone penetration test.
2.2. Results of Pile Base Resistance
The common methods for calculating pile base resistance include API/ISO, NGI, ICP, LCPC, and Fugro, etc. The soil parameter types (soil shear strength Su or cone resistance) and the empirical coefficients are different in these methods. Because the pile base resistance has a certain range of influence above and below the pile end, the depth range of the soil at the pile end is different when calculating the pile base resistance by various methods, and the comparison is shown in Table 3.
Table 3.
Methods for calculating unit pile base resistance.
The methods for calculating pile base resistance can be divided into three categories as shown in Table 3. The first class of methods is based on the shear strength at the pile end, including API/ISO, NGI, Penpile, and Takesue; the second class of methods is based on the average of cone resistance within a certain range below the pile end, including Lehane and European; and the last class of methods is based on the average of the cone resistance, corrected cone resistance, and other parameters of the soil within a certain range above and below the pile end. The calculation range of soil at the pile end is different, and the specific calculation range is shown in Table 3.
The bearing capacity of pile foundation in the Liuhua site is calculated using the method in Table 3, and the distribution of pile base resistance along the depth is shown in Figure 2.
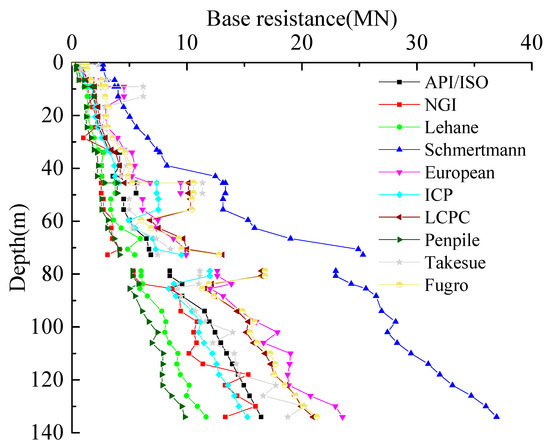
Figure 2.
Distribution of pile base resistance along the depth.
The difference of pile base resistance calculated by each method is obvious as shown in Figure 2; the value of Schmertmann is the largest, and the value of Penpile is the minimum. The soil within the depth range of 49.4–51.6 m and 72.7–78.8 m is sand, so the cone resistance increases rapidly, which results in a sudden change in the pile base resistance calculated near this depth. In order to verify the effect of thin sand on pile base resistance, the pile base resistance at the depth of z = 33 m, 49 m, 80 m, and 134 m of each method is taken as shown in Figure 3.
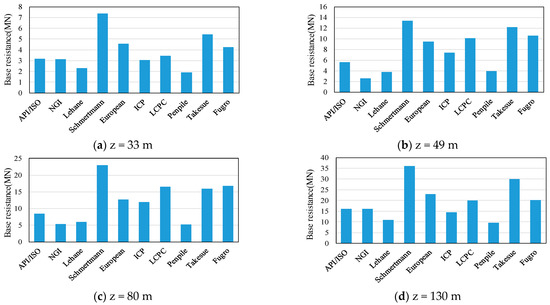
Figure 3.
Base resistance calculated by methods at different depths.
It can be seen from Figure 3 that the base resistance calculated by each method has large dispersion and difference. The maximum, minimum, mean, variance, and coefficient of variation in pile base resistance at different depths are summarized in Table 4.
Table 4.
Difference of base resistance at different depths.
It can be seen from Table 4 that the maximum base resistance calculated by various methods at different depths is about 4–6 times the minimum. The differences are mainly caused by two aspects: one is the difference of soil parameter and empirical coefficient, and the other is the difference of calculation depth range of soil at the pile end. At the depth of 33 m and 130 m, the calculation results of each method are similar because the soil distribution is uniform and because of the absence of the sand interlayer. While at the depth of 49 m and 80 m, due to the presence of the sand layer, the soil strength is affected by the calculation depth range of the pile end, which leads to significant differences in the calculation results of each method. It can be seen that the difference of pile base resistance caused by the different calculation depth range of the pile end is far greater than the difference caused by the calculation method itself.
The soil within the depth of 49.4–51.6 m of the Liuhua site is sand, and within a range above and below the sand, the pile base resistance is calculated by each method at the depth of 44 m, 49 m, 52 m, 57 m, and 62 m. The results are shown in Figure 4.
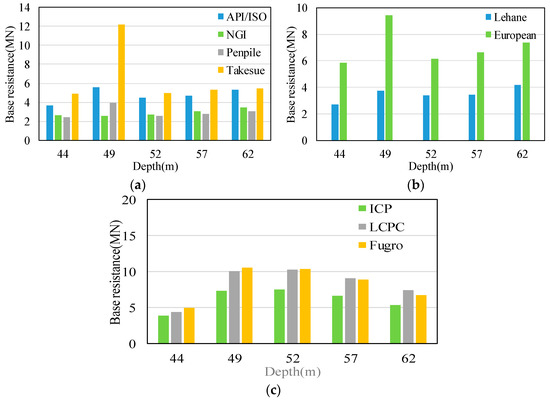
Figure 4.
Base resistance at representative depth. (a) Based on the parameters at the pile end, (b) based on the average of parameters below the pile end, (c) and based on the average of parameters above and below the pile end.
The method of calculating the pile base resistance uses the cone resistance at the pile end in Figure 4a. In these methods, the pile base resistance in the upper and lower clay is not affected by sand, so it does not have a sudden change. However, the influence of pore pressure cannot be ignored in the Takesue method, and the pore pressure suddenly dissipates when close to the sand in Figure 1c. As a result, the pile base resistance increases sharply when it is close to the sand, which also indirectly proves that the sand has an impact on the pile base resistance in the overlying clay layer. The two methods in Figure 4b are to calculate the pile base resistance by using the average of the soil parameters below the pile end. When only considering the influence of the soil below the pile end, the base resistance increases at a depth of 49 m near the sand layer, while the European method increases more significantly at the position close to the sand because the large range of soil depth is calculated downward.
The three methods in Figure 4c are the methods of calculating the pile base resistance using the average of the soil above and below the pile end. When considering the influence of the soil above and below the pile end, the cone resistance of the sand is much larger than that of the clay, resulting in the pile base resistance calculated at the depth of 49 m and 52 m being the same, with a sharp increase trend compared with the pile base resistance at the depth of 44 m.
The difference of pile base resistance calculated by different methods is analyzed, and the conclusions are obtained: when calculating the pile base resistance, the range of the soil near the pile end has a significant impact on the results, and the distance between the sand and the clay and the thickness of the sand have an important impact on the pile base resistance.
3. Numerical Simulation on Influence Range of Pile Base Resistance
3.1. Numerical Model and Verification
The finite element method (FEM) is used to analyze the influence range of pile base resistance in homogeneous clay and sand-layered clay. The linear model is adopted for the pile, with the diameter D = 2.743 m, the length L0 = 85.29 m, the length of the embedded L = 82.29 m, and the length–diameter ratio L/D = 30. The Mohr–Coulomb model is adopted for soil, the effective The relationship between mass and mobility is often expressed with the effective density, which is defined as the mass of the particle divided by its mobility equivalent volume, of soil is taken, Poisson’s ratio is taken as 0.49, and the elastic modulus is taken as 500 Su. The parameters of FEM are shown in Table 5.
Table 5.
Parameters of FEM.
The diameter of soil is 20 D and the vertical height is L + 20 D in the numerical model to avoid boundary effect. In order to improve the calculation speed, the axisymmetric model is used in the numerical simulation. In the model, the vertical displacement U3 is limited at the bottom, horizontal displacement U1 is limited at the right, and symmetric boundary conditions are set on the left side of the model. The numerical model of a steel pipe pile is shown in Figure 5.
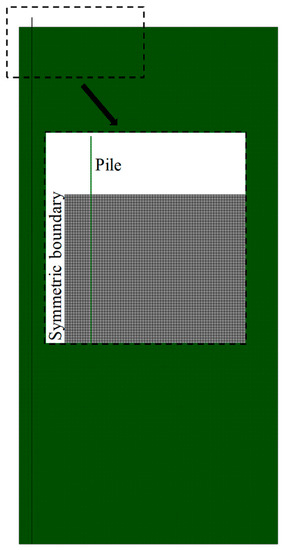
Figure 5.
Axisymmetric model of a steel pipe pile.
The contact pair is set between pile and soil, the pile surface is regarded as the main surface, and the soil surface is treated as the slave surface. The ‘Penalty Function’ is established in the contact property. The friction coefficient between pile and clay is set to 0.4, and the friction coefficient between piles and sand is set to 0.3.
The lateral boundary of the soil is subject to horizontal constraints, the bottom boundary is subject to horizontal and vertical constraints, and the symmetric boundary is subject to axisymmetric constraints. The soil unit type is C3 D8R, and the soil grid is 0.05 D. The reference point is coupled in the middle of the pile top surface, and vertical displacement of 0.05 D is applied on the reference point to calculate the base resistance.
In order to verify the rationality of the calculation results of FEM, the undrained shear strength of the soil is set to 40 kPa, and the load–displacement curve calculated by FEM and API is compared, as shown in Figure 6. The trend of the load–displacement curve calculated by FEM is basically the same as that calculated by the API, and the ultimate bearing capacity of the pile foundation calculated by FEM is 28.1 MN, and the ultimate bearing capacity calculated by the API is 26.5 MN, the difference between the two is 5.7%, and the error is small, so the rationality of FEM is verified.
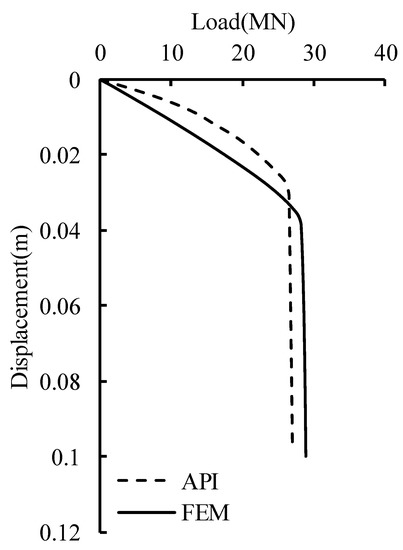
Figure 6.
Verification of FEM.
3.2. Results in Homogeneous Clay
The influence range of pile base resistance in homogeneous clay is studied. In the numerical model, the undrained shear strength of homogeneous clay is set as 20 kPa, 40 kPa, 60 kPa, 80 kPa, and 100 kPa, respectively, to analyze the distribution of the plastic zone of the pile end and determine the influence range of pile base resistance. The results are shown in Figure 7.
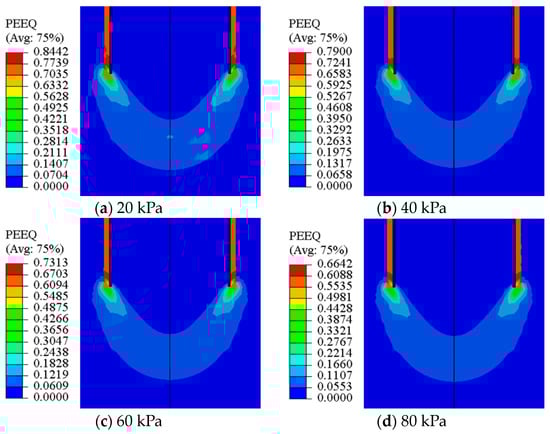
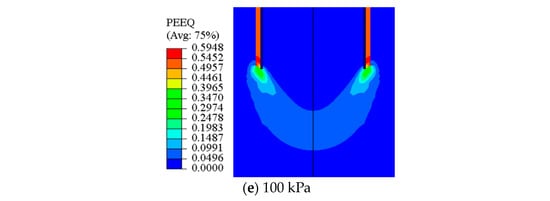
Figure 7.
Distribution of plastic zone at pile end under the different undrained shear strength.
It can be seen from Figure 7 that with the increase in undrained shear strength of soil, the distribution range of the plastic zone near the pile end did not change significantly, that is, the undrained shear strength in homogeneous clay has little effect on the development of plastic zone. The influence range of pile base resistance is about 0.12 D at the upper part of the pile end and about 0.83 D at the lower part of the pile end.
The undrained shear strength of homogeneous clay is taken as 40 kPa, and the distance between the pile end and the soil bottom boundary is set as 0.5 D, 1.0 D, 1.5 D, 2.0 D, and 3.0 D. The distribution of the plastic zone at the pile end, load–displacement curve, and the relationship between ultimate bearing capacity and distance are shown in Figure 8 and Figure 9.
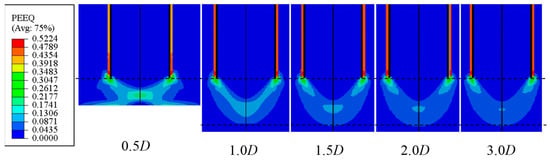
Figure 8.
Distribution of plastic zone at pile end under the different distance between the pile end and the soil bottom boundary.
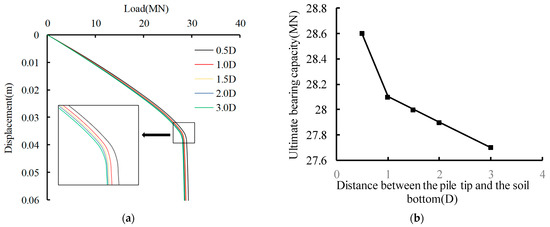
Figure 9.
Ultimate bearing capacity. (a) Load–displacement curve, (b) relationship between ultimate bearing capacity and distance.
It can be seen from Figure 8 that when the distance between the pile end and the soil bottom boundary reaches 1.0 D, the plastic zone at the pile end does not reach the soil bottom boundary. With the increase in the distance, the development depth of the plastic zone is unchanged. Therefore, the influence range of the pile base resistance is still 0.12 D above the pile end and 0.83 D below the pile end.
It can be seen from Figure 9 that when the distance between the pile end and the soil bottom boundary reaches 1.0 D, the load–displacement curve is nearly coincident. The ultimate bearing capacity of the pile foundation is reduced with the distance between the pile end and the soil bottom boundary, but the change is not obvious, which indicates that the distance 1.0 D can meet the development of the plastic zone. Based on the results in Figure 7 and Figure 8, it can be considered that the distribution range of the plastic zone and the range of the influence depth of the pile base resistance reflected by the load–displacement curve have good consistency. From the results in Figure 7, Figure 8 and Figure 9, it can be considered that the influence range of the pile base resistance in the homogeneous clay is 0.12 D above the pile end and 0.83 D below the pile end.
3.3. Results when the Clay Is above the Sand
3.3.1. Influence of Distance between Sand and the Pile End
A sand layer is set under the pile end to analyze the influence of the sand under the clay on the pile base resistance. Additionally, the influence of the distance between the top of the sand and the pile end on the pile base resistance is analyzed. This distance H1 is taken as 0.5 D, 1.0 D, 1.5 D, 1.7 D, and 2.0 D, respectively. The results are shown in Figure 10b.
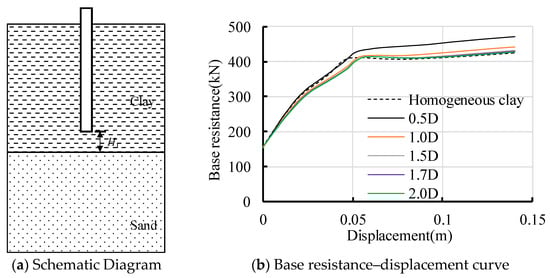
Figure 10.
Influence of the distance between the pile end and top of the sand on pile base resistance.
It can be seen from Figure 10 that the pile base resistance is enhanced when the distance between the top of the sand and the pile end is 0.5 D, increasing by about 10.8%. With the increase in the distance, the pile base resistance decreases gradually. When the distance exceeds 1.5 D, the sand under the clay has little effect on the pile base resistance.
3.3.2. Influence of Sand Thickness
The influence of sand on pile base resistance is mainly within the range of the distance between the top of the sand and the pile end and is less than 1.5 D in the above analysis. Therefore, the distance is set to 0.5 D, and the thickness of the sand is changed to 0.3 D, 0.5 D, 0.8 D, 1.0 D, and 1.5 D, respectively, to analyze the influence of sand thickness on pile base resistance; the thickness of sand T1 is shown in Figure 11a, and the result is shown in Figure 11b.
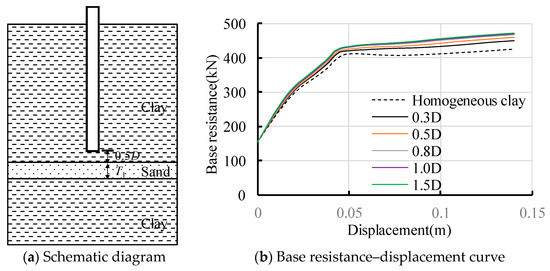
Figure 11.
Influence of sand thickness under the pile end on pile base resistance.
With the increase in the thickness of the sand, the pile base resistance gradually increases. When the thickness of the sand exceeds 0.8 D, the continuous increase in the thickness of sand has no effect on the pile base resistance. Compared with the pile end in homogeneous clay, when the sand thickness is 0.3 D and 0.5 D, respectively, the pile base resistance increases by 5.7% and 8.4%. Therefore, when there is a sandy layer under the clay, and the distance between the pile end and the top surface of the sand is not more than 1.5 D, it is recommended that the influence range of the pile base resistance is 1.3 D.
3.4. Results when the Clay Is under the Sand
3.4.1. Influence of Distance between Sand and the Pile End
A sand layer is set above the pile end to analyze the influence of the sand above the clay on the pile base resistance. Additionally, the influence of the distance between the bottom of the sand and the pile end on the pile base resistance is analyzed. This distance H2 is taken as 0.1 D, 0.2 D, 0.5 D, 1.0 D, and 1.5 D, respectively. The results are shown in Figure 12.
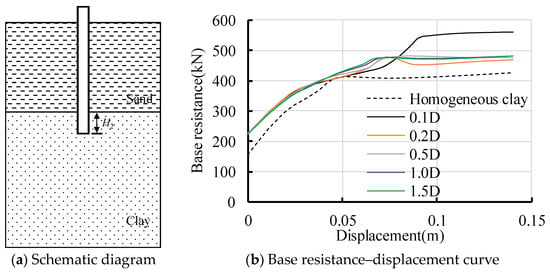
Figure 12.
Influence of distance between the pile end and bottom of sand on pile base resistance.
The pile base resistance increases when the sand is above the pile end compared with the pile end in homogeneous clay, and the influence is very significant. When the distance between the bottom of the sand and the pile end is 0.1 D and 0.2 D, the pile base resistance increases by 32.1% and 10.0%. When the distance exceeds 0.5 D, pile base resistance is not affected by distance.
3.4.2. Influence of Sand Thickness
The distance between the bottom of the sand and the pile end is 0.1 D, and the change in the thickness of sand to 0.3 D, 0.5 D, 0.8 D, 1.0, D and 1.5 D, respectively, to analyze the influence of sand thickness on pile base resistance, the thickness of sand T2 is shown in Figure 13a, and the result is shown in Figure 13b.
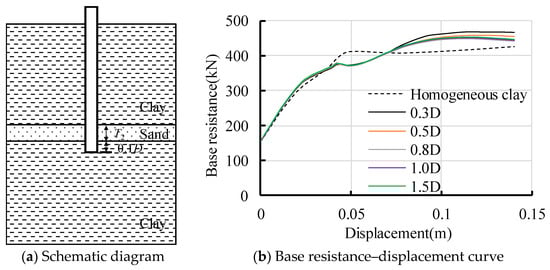
Figure 13.
Influence of sand thickness above the pile end on pile base resistance.
As shown in Figure 13, with the increase in the thickness of sand, the pile base resistance decreases gradually. When the thickness of sand exceeds 0.8 D, the thickness of sand has no effect on the pile base resistance. Therefore, in the case of sand above the clay, when the distance between the bottom of sand above the clay and the pile end is less than 0.5 D, it is suggested that the influence range of pile base resistance is 0.9 D.
4. Conclusions
In the present study, the influence range of pile base resistance is studied in homogeneous clay and sand-layered clay. The influence of the strength and thickness of the soil near the pile end on the pile base resistance is revealed, and the recommended influence range of pile base resistance is given. The following conclusions can be achieved:
The pile base resistance has a certain influence range above and below the pile end, and the range of soil used to calculate the average strength at the pile end is different in the current calculation methods, resulting in different pile base resistance calculated by different methods; especially when the there is sand-layered clay, t he difference is more significant.
The influence range of pile base resistance is 0.12 D above the pile end and 0.83 D below the pile end when the pile end is located in homogeneous clay.
When there is sand above or below the clay where the pile end is located, the distance between the sand and the pile end and the thickness of the sand has an impact on the pile base resistance. When the sand is above the clay, the influence range of the pile base resistance is 0.9 D above the pile end, and when the sand is below the clay, the influence range of pile base resistance is 1.3 D below the pile end.
Author Contributions
Conceptualization, D.F. and H.Z.; methodology, S.L.; software, Y.J.; validation, H.Z., R.L. and C.L.; formal analysis, D.F.; investigation, S.L.; resources, D.F.; data curation, R.L.; writing—original draft preparation, D.F.; writing—review and editing, Y.J.; visualization, C.L.; supervision, C.L.; All authors have read and agreed to the published version of the manuscript.
Funding
This research received no external funding.
Institutional Review Board Statement
Not applicable.
Informed Consent Statement
Not applicable.
Data Availability Statement
Not applicable.
Conflicts of Interest
The authors declare no conflict of interest.
References
- Wu, X.; Hu, Y.; Li, Y.; Yang, J. Foundations of offshore wind turbines: A review. Renew. Sustain. Energy Rev. 2019, 104, 379–393. [Google Scholar] [CrossRef]
- Li, L.; Zheng, M.; Liu, X.; Wu, W. Numerical analysis of the cyclic loading behavior of monopile and hybrid pile foundation. Comput. Geotech. 2022, 144, 104635. [Google Scholar] [CrossRef]
- Basack, S.; Goswami, G.; Dai, Z.H.; Baruah, P. Failure-mechanism and design techniques of offshore wind turbine pile foundation: Review and research directions. Sustainability 2022, 14, 12666. [Google Scholar] [CrossRef]
- Zhang, X.; Liu, C.; Wang, P.; Zhang, G. Experimental simulation study on dynamic response of offshore wind power pile foundation under complex marine loadings. Soil Dyn. Earthq. Eng. 2022, 156, 107232. [Google Scholar]
- American Petroleum Institute. Geotechnical and Foundation Design Considerations. In ANSI/API Recommended Practice 2GEO, 1st ed.; API Publishing Services: Washington, DC, USA, 2014. [Google Scholar]
- Terzaghi, K.T. Theoretical Soil Mechanics; John Wiley and Sons Inc.: Hoboken, NJ, USA, 1943. [Google Scholar]
- Meyerhof, G.G. The ultimate bearing capacity of foundations. J. Geotech. 1951, 2, 301–332. [Google Scholar] [CrossRef]
- Meyerhof, G.G. The ultimate bearing capacity of foundations under eccentric and inclined loads. In Proceedings of the third International Conference on Soil Mechanics and Foundation Engineering, Zurich, Switzerland, 16–27 August 1953; Volume 1. [Google Scholar]
- Meyerhof, G.G. Influence of roughness of base and ground-water conditions on the ultimate bearing capacity of foundations. J. Geotech. 1955, 5, 227–242. [Google Scholar] [CrossRef]
- Meyerhof, G.G. Bearing capacity and settlement of pile foundations. J. Geotech. Eng. Div. 1976, 102, 197–228. [Google Scholar] [CrossRef]
- Berezantzev, V.G. Load bearing capacity and deformation of piled foundations. In Proceedings of the 5th International Conference on Soil Mechanics and Foundation Engineering ISSMFE, Paris, France, 17–22 July 1961; Volume 2, pp. 11–12. [Google Scholar]
- Hu, G.C.Y. Variable-factors theory of bearing capacity. J. Soil Mech. Found. Div. 1964, 90, 85–95. [Google Scholar] [CrossRef]
- Vesic, A.S. Design of Pile Foundations; Transportation Research Board, National Research Council: Washington, DC, USA, 1977. [Google Scholar]
- Wilson, G. The Bearing Capacity of Screw Piles and Screwcrete Cylinders. J. Inst. Civ. Eng. 1950, 34, 4–73. [Google Scholar] [CrossRef]
- Meigh, A.C. Model Footing Tests on Clay. Master’s Thesis, Imperial College London, London, UK, 1950. [Google Scholar]
- Yassin, A.A. Model Studies on Bearing Capacity of Piles. Ph.D. Thesis, Imperial College London, London, UK, 1950. [Google Scholar]
- Skempton, A.W. The Bearing Capacity of Clays. Build. Res. Congr. 1951, 1, 180–189. [Google Scholar]
- Randolph, M.; Gourvenec, S. Offshore Geotechnical Engineering; CRC Press: Boca Raton, FL, USA, 2017. [Google Scholar]
- Gavin, K.; Kovacevic, M.S.; Igoe, D. A review of CPT based axial pile design in The Netherlands. Undergr. Space 2019, 6, 85–99. [Google Scholar] [CrossRef]
- Amirmojahedi, M.; Abu-Farsakh, M. Evaluation of 18 Direct CPT Methods for Estimating the Ultimate Pile Capacity of Driven Piles. Transp. Res. Rec. J. Transp. Res. Board 2019, 2673, 127–141. [Google Scholar] [CrossRef]
- Leetsaar, L.; Korkiala-Tanttu, L.; Kurnitski, J. CPT, CPTu and DCPT methods for predicting the ultimate bearing capacity of cast in situ displacement piles in silty soils. Geotech. Geol. Eng. 2022, 41, 631–652. [Google Scholar] [CrossRef]
- Heidari, P.; Ghazavi, M. Statistical Evaluation of CPT and CPTu Based Methods for Prediction of Axial Bearing Capacity of Piles. Geotech. Geol. Eng. 2021, 39, 1259–1287. [Google Scholar] [CrossRef]
- Schmertmann, J.H. Guidelines for Cone Penetration Test: Performance and Design; Federal Highway Administration: Washington, DC, USA, 1978. [Google Scholar]
- De Kuiter, J.; Beringen, F.L. Pile foundations for large North Sea structures. J. Mar. Georesour. Geotechnol. 1979, 3, 267–314. [Google Scholar] [CrossRef]
- Jardine, R.; Chow, F.; Overy, R. ICP Design Methods for Driven Piles in Sands and Clays; Thomas Telford: London, UK, 2005. [Google Scholar]
- Bustamante, M.; Gianeselli, L. Pile bearing capacity prediction by means of static penetrometer CPT. In Proceedings of the 2nd European Symposium on Penetration testing, Amsterdam, The Netherlands, 24–27 May 1982; Volume 2, pp. 493–500. [Google Scholar]
- Lehane, B.M.; Liu, Z.; Bittar, E.J. CPT-based axial capacity design method for driven piles in clay. J. Geotech. Geoenviron. Eng. 2022, 148, 04022069. [Google Scholar] [CrossRef]
- Van Dijk, B.F.J.; Kolk, H.J. CPT-based design method for axial capacity of offshore piles in clays. J. Front. Offshore Geotech. II 2011, 555–560. [Google Scholar]
- Price, G.; Wardle, I.F. A comparison between cone penetration test results and the performance of small diameter instrumented piles in stiff clay. In Proceedings of the 2nd European Symposium on Penetration Testing, Amsterdam, The Netherlands, 24–27 May 1982; Volume 2, pp. 775–780. [Google Scholar]
- Takesue, K.; Sasao, H.; Matsumoto, T. Correlation between ultimate pile skin friction and CPT data. In Proceedings of the First International Conference on Site Characterization, Atlanta, Georgia, 19–22 April 1998; pp. 1177–1182. [Google Scholar]
Disclaimer/Publisher’s Note: The statements, opinions and data contained in all publications are solely those of the individual author(s) and contributor(s) and not of MDPI and/or the editor(s). MDPI and/or the editor(s) disclaim responsibility for any injury to people or property resulting from any ideas, methods, instructions or products referred to in the content. |
© 2023 by the authors. Licensee MDPI, Basel, Switzerland. This article is an open access article distributed under the terms and conditions of the Creative Commons Attribution (CC BY) license (https://creativecommons.org/licenses/by/4.0/).