Article

An Improved Multi-Objective Optimization and Decision-Making Method on Construction Sites Layout of Prefabricated Buildings

Key Laboratory of New Technology for Construction of Cities in Mountain Area, School of Civil Engineering, Chongqing University, Chongqing 400045, China
*
Author to whom correspondence should be addressed.
Sustainability 2023, 15(7), 6279; https://doi.org/10.3390/su15076279
Submission received: 24 February 2023 / Revised: 22 March 2023 / Accepted: 4 April 2023 / Published: 6 April 2023
(This article belongs to the Special Issue Sustainable Structures and Construction in Civil Engineering)

Abstract

:
Construction site layout planning (CSLP) that considers multi-objective optimization problems is essential to achieving sustainable construction. Previous CSLP optimization methods have applied to traditional cast-in-place buildings, and they lack the application for sustainable prefabricated buildings. Furthermore, commonly used heuristic algorithms still have room for improvement regarding the search range and computational efficiency of optimal solution acquisition. Therefore, this study proposes an improved multi-objective optimization and decision-making method for layout planning on the construction sites of prefabricated buildings (CSPB). Firstly, the construction site and temporary facilities are expressed mathematically. Then, relevant constraints are determined according to the principles of CSLP. Ten factors affecting the layout planning on the CSPB are identified and incorporated into the method of layout planning on the CSPB in different ways. Based on the elitist non-dominated sorting genetic algorithm (NSGA-II), an improved multiple population constraint NSGA-II (MPC-NSGA-II) is proposed. This introduces the multi-population strategy and immigration operator to expand the search range of the algorithm and improve its computational efficiency. Combined with the entropy weight and technique for order preference by similarity to an ideal solution (TOPSIS), improved multi-objective optimization and decision for the CSLP model is developed on the CSPB. Practical cases verify the effectiveness and superiority of the algorithm and model. It is found that the proposed MPC-NSGA-II can solve the drawbacks of the premature and low computational efficiency of NSGA-II for multi-constrained and multi-objective optimization problems. In the layout planning on the CSPB, the MPC-NSGA-II algorithm can improve the quality of the optimal solution and reduce the solution time by 75%.

1. Introduction

With increasing attention to environmental protection and sustainability, the construction industry is becoming aware of its role in environmental protection and sustainability [1]. The new intelligent construction technology is a vital instrument for achieving energy management, environmental protection and safety, and improving the sustainability of buildings [2]. Prefabricated buildings are an important component of sustainable construction, and they are typically space-constrained projects. Prefabricated buildings require adequate resources for various materials, equipment, and temporary facilities for the extensive prefabrication operations on the CSPB [3,4]. Among these resources, hoisting equipment and prefabricated components occupy a large space on the CSPB [5]. Unreasonable layout planning of CSPB can cause conflict in the workspace, increase the distance of material transportation, and increase the workload of mechanical equipment. Furthermore, a cluttered layout of CSPB can increase the safety uncertainties on the construction site [6,7].
Relevant scholars have explored the CSPL problem of traditional cast-in-place buildings [8,9,10,11]. Currently, the CSPL optimization methods are mainly divided into mathematical programming [12,13] and heuristic algorithms [14,15,16]. The mathematical programming method mainly uses integer programming [17], linear programming [18], nonlinear programming [19], dynamic programming [20], and other mathematical methods [21] to produce a single-objective or multi-objective optimization function of the exact solution to provide a reasonable scheme of CSPL. However, its computational complexity is large, its solution time is long, and it is only suitable for solving small-scale problems, often making it impractical for engineering purposes [18,19]. Heuristic algorithms emphasize solving combinatorial optimization problems based on empirical rules. At this stage, heuristic algorithms usually focus on simulating natural selection and the natural evolution of organisms, such as genetic algorithms [22,23], particle swarm algorithms [24], and ant colony algorithms [25]. Heuristic algorithms are used to find the suboptimal solution of a problem or its optimal solution with a certain probability. Their good generality, stability, and fast convergence make them more commonly used in engineering [22,25]. Genetic algorithms have global search capabilities and can quickly solve complex non-linear problems. However, their programming implementation can be complex, and they have a slower search speed, which can tend to fall into prematureness [22]. The non-dominated sorting genetic algorithm (NSGA) proposes a non-dominated ranking criterion based on the classical genetic algorithm. The NSGA algorithm has shown significant advantages in solving multi-objective optimization problems. However, there are also complications, including great computational effort, lack of optimal individual retention schemes, and difficulty determining shared parameters [26]. The NSGA-II algorithm introduces improvements such as fast non-dominated sorting, crowding degree, and elite strategy based on the NSGA algorithm, which can be used without setting any parameters and reduces computational complexity. However, the NSGA-II algorithm tends to be premature in multi-constrained, multi-objective optimization problems, making it challenging to obtain the entire Pareto front surface and thus losing part of the optimal solution [27,28,29].
The heuristic algorithm commonly used in CSPL needs further improvement and optimization. For the characteristics of CSPB, a more reasonable and improved CSPL method is needed to achieve sustainable building construction [30,31]. The authors propose an improved multi-objective optimization and decision-making method in Section 2. Firstly, the construction site and temporary facilities are expressed mathematically, then three constraints are identified. Furthermore, ten factors affecting the layout planning on the CSPB are identified and incorporated into the method of layout planning on the CSPB in different ways. The MPC-NSGA-II algorithm applicable to layout planning on the CSPB is proposed. Furthermore, the solutions output from the MPC-NSGA-II algorithm is evaluated and selected by combining the entropy weight-TOPSIS method. In Section 3, a multi-objective optimization and decision model for layout planning of CSPB is proposed through practical engineering cases. The parameters required for calculating the improved algorithm are determined. The improved algorithm and the model for layout planning on the CSPB are validated using MATLAB 2020b software in Section 4. Meanwhile, the MPC-NSGA-II algorithm is compared with the NSGA-II algorithm in the layout planning on the CSPB. Finally, the conclusions of this study are drawn.

2. The Improved Multi-Objective Optimization and Decision-Making Method

2.1. Construction Site and Temporary Facilities Analysis

Many factors, including site area, structure type, duration, and transportation conditions, influence the CSPL. Necessary assumptions about the construction site and temporary facilities need to be made to facilitate the construction of a multi-objective optimization and decision model for the layout planning on the CSPB. Currently, the common assumption methods used on construction sites include location distribution, continuous space, and raster methods. The common assumptions for temporary facilities on construction sites include the ignoring facility size method, the actual shape method, and the approximate geometric shape method (AGSM). Different expressions of the construction site and temporary facilities can affect the process of searching for the optimal solution of the model.
After arranging and combining the construction site assumptions and construction site temporary facilities assumptions, all optional combinations are shown in Figure 1.
The location assignment method has a simple calculation process. However, its way of determining the predetermined location in advance leads to the limitation of the model [32]. The continuous space method is closest to the actual site space, but its calculation process is complex and requires much time [33]. The raster method considers the advantages of the location assignment and continuous space methods. It balances the computational complexity and the accuracy of the optimization results [34]. Furthermore, the raster method is more flexible, thus, applicable to different construction sites. Representing temporary facilities by shape center point in the ignoring facility size method can simplify the calculation but is different from the actual situation [10]. In the actual shape method, the horizontal projection of the actual shape of the construction site facilities represents the temporary facilities closest to the actual site space [35]. However, it has more constraints on the construction function and is more difficult to calculate. Considering the influence of the facility shape on the search results and the complexity of the calculation, the basic geometry of the temporary facility represented by the AGSM can envelop the actual edge of the facility [31]. Therefore, the construction site of the model is assumed by the grid method, and the AGSM represents the temporary facilities.
Considering other influencing factors, the prerequisite assumptions of the improved multi-objective optimization and decision-making method include: (1) The construction site space is divided by the grid method, and the AGSM represents the construction site’s temporary facilities; (2) It is flat and even inside the construction site; (3) The southwest corner of the construction site is considered the origin of the arrangement for later calculations; (4) The location of the fixtures is predetermined and will not be changed; (5) The model uses the centroid position of the field facilities to represent the real position of the temporary facilities; (6) The model assumes that the shape and dimensions of the site facilities remain unchanged throughout the project construction period.

2.2. Constraints Analysis

2.2.1. Site Boundary Constraints

The site boundary constraint means that temporary facilities must be placed within the red line boundary of the construction site regardless of any construction phase of the project. Furthermore, it should be ensured that the temporary facilities boundary of the construction site is kept at a sufficient safety distance from the construction fence.
Assume that the coordinates of the form center of the temporary facilities to be arranged at the construction site are x i , y i . The length in the x -direction is l i . The length in the y -direction is h i . The red line horizontal coordinate range of the construction site is a 1 ~ a 2 . The range of vertical coordinates is b 1 ~ b 2 . Therefore, the coordinates of the temporary facility i should meet Equation (1).
y i h i 2 b 1 φ 0 y i + h i 2 b 2 + φ 0 x i l i 2 a 1 φ 0 x i + l i 2 a 2 + φ 0
where φ is the safety distance between the consideration of temporary facilities and the construction fence. In the actual CSPB, the value of φ is usually taken as 3.0 m.

2.2.2. Facility Coverage Constraints

The facility coverage constraint means that there should be no coverage conflicts between individual construction facilities. Facility coverage constraints need to be satisfied to avoid spatial conflicts. With construction facility i and construction facility j , the required fire distance between the two facilities is W i j . The facility coverage constraint stipulates that at least one of the criteria in Equation (2) should be met.
x i x j l i + l j 2 W i j y i y j h i + h j 2 W i j

2.2.3. Tower Crane Coverage Constraints

The tower crane boom needs to cover all temporary production facilities as far as possible. It can safety the fixed tower crane layout principles while avoiding the secondary handling of components and raw materials in the field as far as possible.
Assume that the site coordinates of the fixed tower crane are x t , y t and the boom length of the tower crane is R t . The temporary construction site facilities and the tower crane should be met by Equation (3).
x t x c 2 + y t y c 2 R t
Temporary living spaces and office facilities should be as far from the tower crane’s coverage as possible to protect staff safety.

2.3. Optimization Factor Ranking Analysis

A multi-objective optimization problem is one in which multiple objectives need to be achieved in each scenario. However, there is generally a conflict between objectives, and the optimization of one objective is at the cost of the deterioration of other objectives, so it is not easy to have a unique optimal solution. Therefore, the determination of optimization objectives must be based on the importance of the influencing factors.
Before determining the optimization objectives of the model, various factors affecting the layout of temporary facilities on CSPB need to be clarified. Through literature analysis, 16 influencing factors with high frequencies in relevant construction site temporary facilities arrangement studies were initially summarized.
An expert scoring method distributed questionnaires to industry experts and relevant practitioners. Based on their opinions, the importance of 16 influencing factors in determining the arrangement scheme of temporary facilities on CSPB was analyzed. The sources and composition of the experts are shown in Table 1. The contents of the questionnaire are in the Supplementary Materials.
The reliability analysis of this questionnaire was performed using Cronbach’s alpha coefficient method. The reliability coefficient value of 0.858 was obtained using SPSS 26 software analysis [36]. Therefore, the data obtained from this expert scoring is stable and reliable. The results of the questionnaire analysis are shown in Figure 2.
From Figure 2, we can see that the standard deviation of the five factors of “Natural condition”, “Site utilization rate”, “Surrounding environmental impact”, “Noise control”, and “Property protection” is greater than 1. It means that the expert’s opinions are inconsistent, so they are excluded. The average score for “Aesthetic requirements” was only 2.70. According to the scoring rules, an average score of less than 3 is not a significant factor, so this factor was removed. A total of 10 influencing factors were finally included in the model consideration. In descending order of average score, they are: “Security risk”, “Economic benefit”, “Hoisting duration”, “Stacking rationality”, “Smoothness”, “Convenience”, “Spatial conflict”, “Management efficiency”, “Spatial adjustability”, and “Work comfort”. Among them, the three influencing factors, “Security risk”, “Economic benefit”, and “Hoisting duration”, have an average score greater than 4. Therefore, these three influencing factors should be focused on the temporary facility layout of CSPB. The prefabricated component combination “stacking reasonableness” is taken as the input constraint of the model to ensure the proper stacking of prefabricated components. Two influencing factors, “space conflict” and “working comfort”, are considered in the constraints. The rest of the factors are incorporated into the decision factors.
The top three influencing factors are taken as the optimization objectives. The objective functions are minimizing security risks, maximizing economic benefits, and minimizing hoisting durations.

2.4. Objective Functions Determination

2.4.1. Security Risk Function

Construction facilities can be divided into risk source facilities prone to security risks and vulnerable facilities that need protection. The construction security risk value can be quantified by analyzing the interaction process of the two types of facilities. Assuming that the hazard transfer value of the facility is H , and the vulnerability of the facility is V . Then the security risk interaction value R can be obtained from Equation (4).
R = H × V
where H is the hazard transfer matrix and the individual element values represent the magnitude of the hazard transfer values.
The diagonal elements in H are the hazard levels between construction site facilities, which could be calculated from Equation (5).
H = h 11 h n n
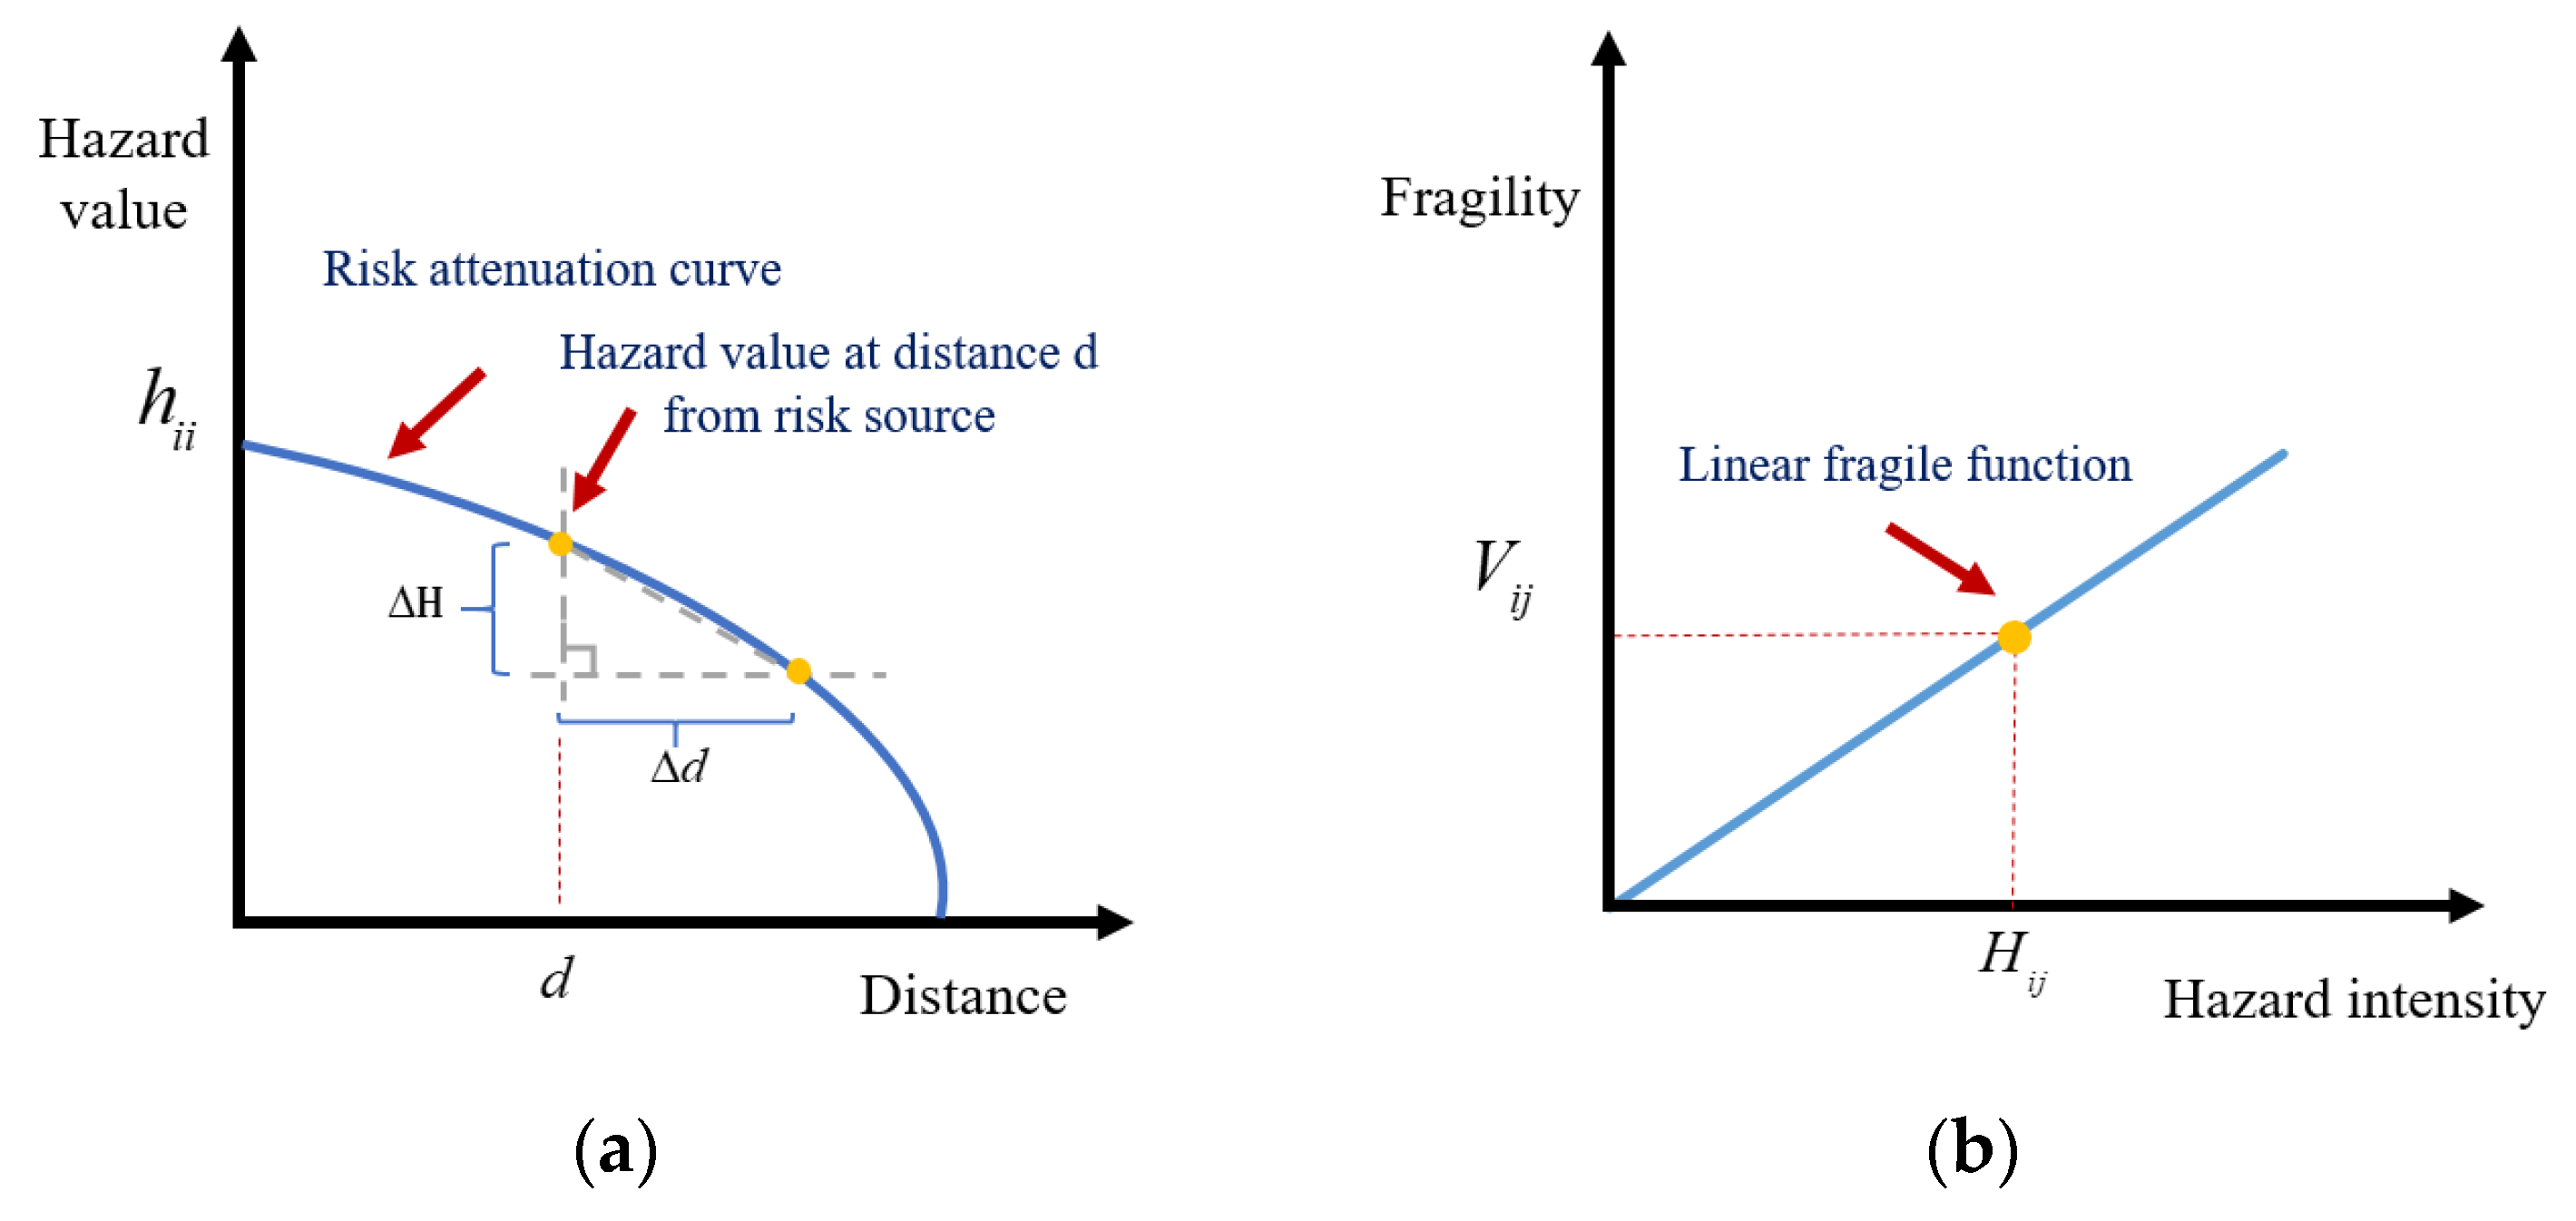
The hazard generated by the source decays with distance, and the remaining elements in H can be determined according to the law of risk decay from Figure 3 and Equation (6).
        h i j = max h i i + d H d d × d i j × ρ 0
When i = j , ρ = 0 , when i j , ρ = 1 , d i j is the Euclidean distance. The relevant research suggests that the slope of the risk attenuation curve takes the value of 0.01 at the construction site [37].
The hazard transfer matrix is normalized in Equation (7).
h i j = h i j max h i i
It is assumed that the hazards do not occur simultaneously. Therefore, the total risk of the construction site is the accumulation of the risks arising from each object. The objective function of security risk is set to minimize the potential security risk. The objective function of security risk can be deduced in Equation (8):
F 1 = min i = 1 n j = 1 n R i j = min H V
H in the equation is the normalized hazard transfer matrix and V is the normalized fragility matrix.

2.4.2. Economic Benefit Function

The economy is one of the critical concerns of decision-makers in engineering project management. Some researchers have shown that the temporary facilities on the CSPL significantly impact the transportation costs of components and raw materials within the construction site. A reasonable scheme of CSPL can significantly reduce the related costs [38]. In addition, the location of temporary facilities may change during different stages of the project. This results in the cost of changes to the temporary facilities due to dismantling, relocation, and installation. The second objective function F 2 is to minimize the sum of the above two costs to maximize the economic benefits of the resulting construction site temporary facilities layout solution. The mathematical expression for F 2 is Equation (9).
F 2 = min i = 1 n j = 1 i C i j d i j + k = 1 n t = 1 T C D k + C k d k t 1 , t + C B k z k t
Where C i j is the transportation cost per unit distance between construction facility i and construction facility j ; d i j is the distance between construction facility i and construction facility j ; C D k is the cost of dismantling temporary facilities k ; C k is the unit distance movement cost of temporary facility k ; d k t , t + 1 is the spatial distance between temporary facility k in stage 1 and stage 2; C B k is the cost of installation required for the rearrangement of temporary facilities k ; z k t is the value for judging the change of location of temporary facility k . When a change occurs, z k t takes the value of 1, otherwise, it takes the value of 0. The value of C D k , C k , and C B k need to be determined in accordance with the relevant standards, combined with the actual project works to determine the value of parameters.

2.4.3. Hoisting Duration Function

Prefabricated components are significant in number and individual weight, and installation machines are used frequently on the CSPB. The hoisting objective function is to make the shortest hoisting duration for prefabricated components through a reasonable layout of temporary facilities on the CSPB.
The hoisting process of a single prefabricated component contains six operations: tying, hoisting, alignment, temporary fixing, alignment, and final fixing [5]. The hoisting action can be divided into horizontal motion (horizontal tangential motion, horizontal radial running) and vertical motion. Therefore, the hoisting duration of a single prefabricated component can be divided into two parts: horizontal movement duration and vertical movement duration.
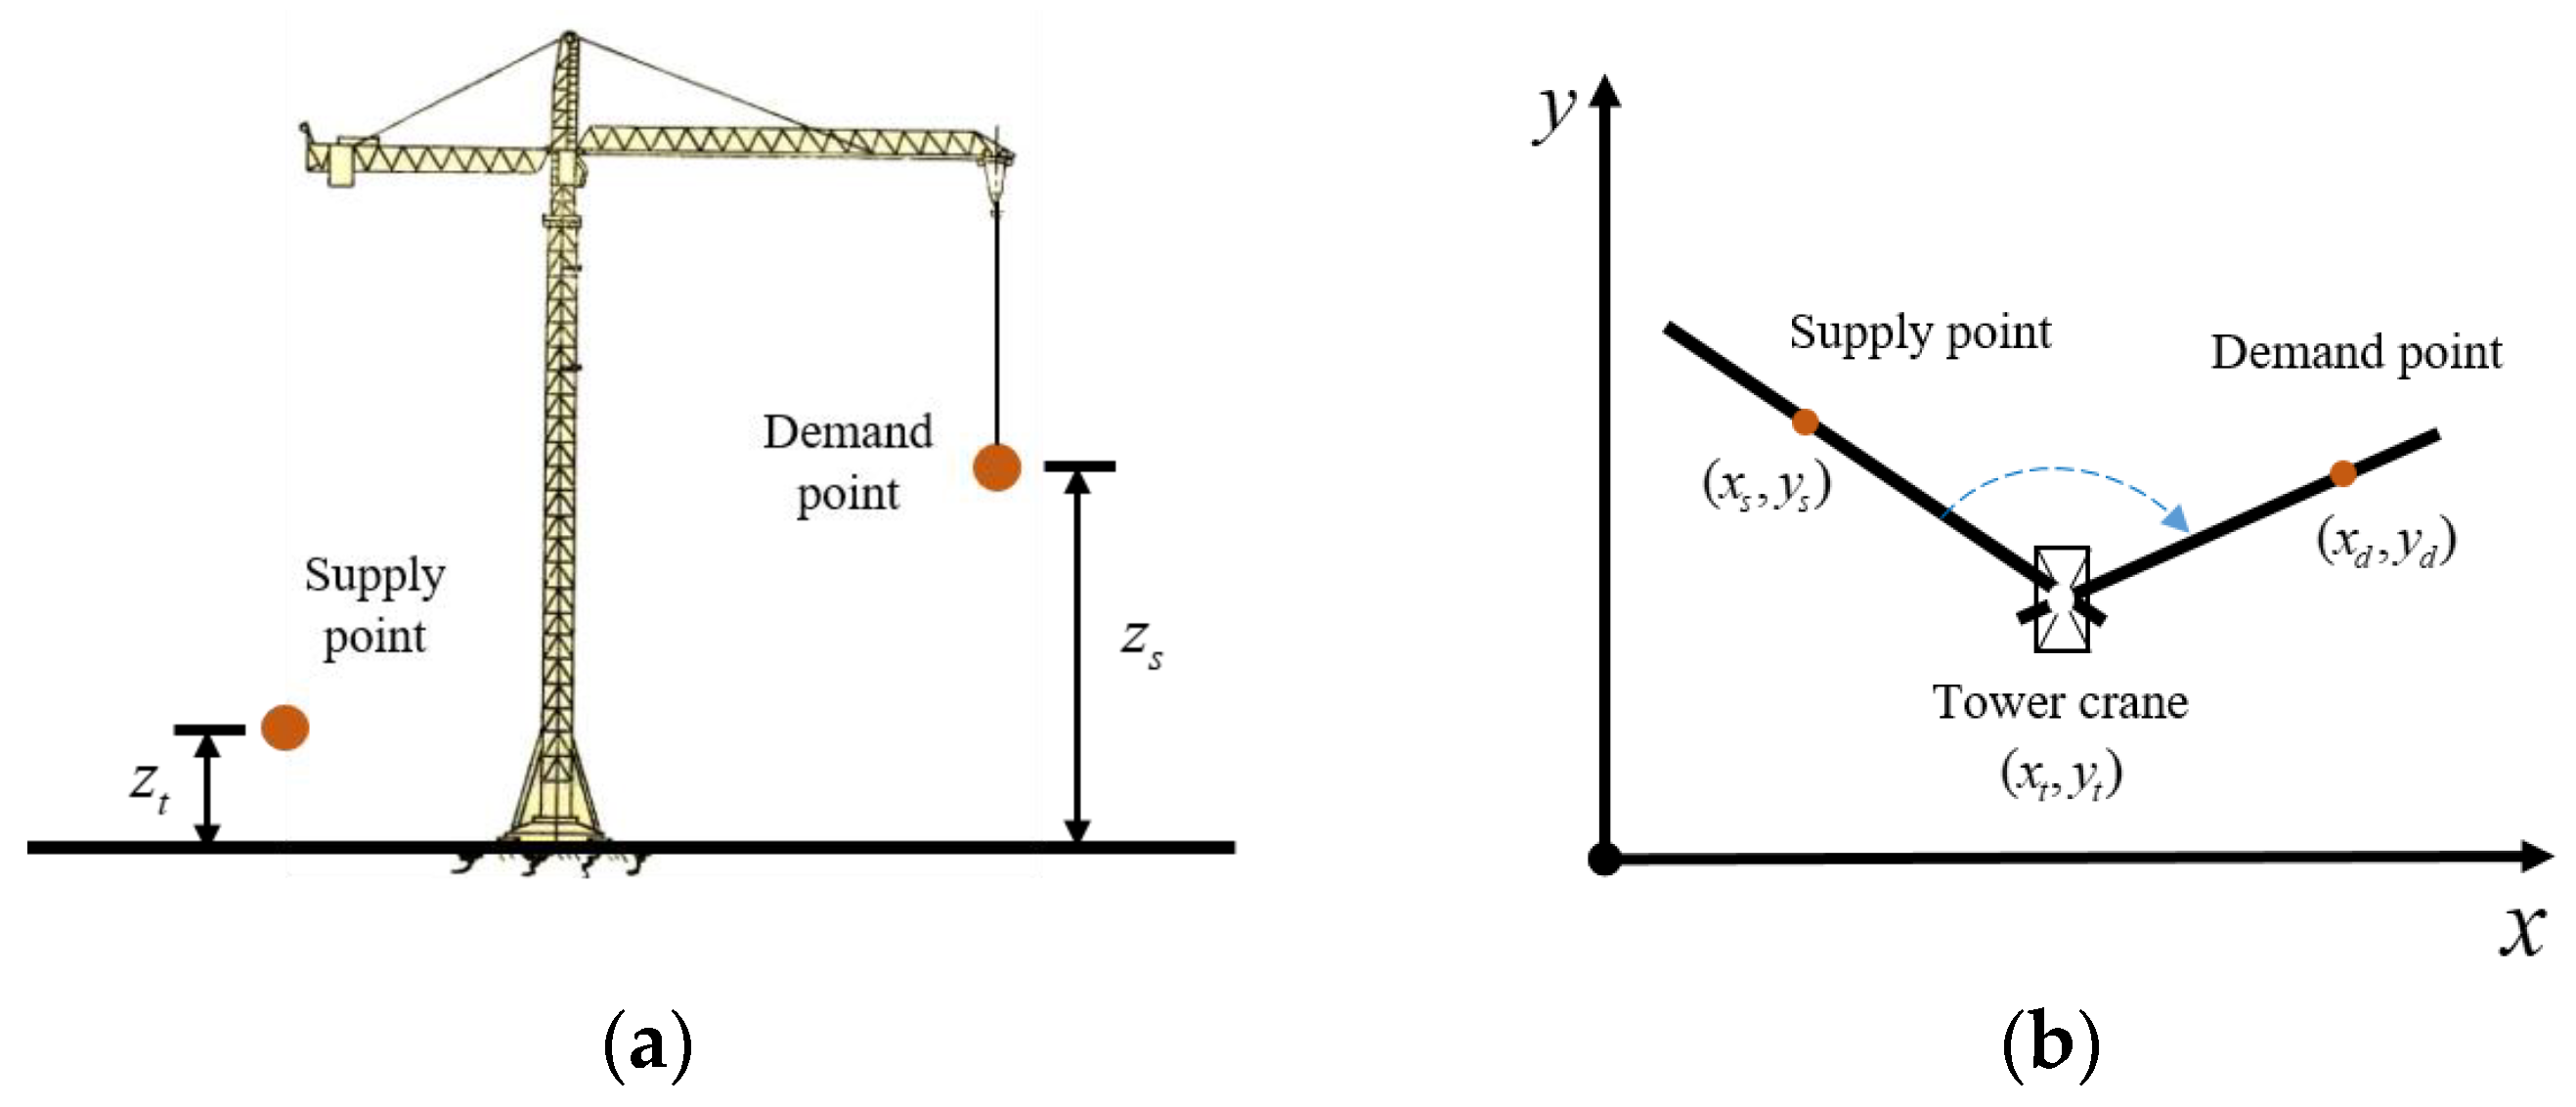
Assume that the fixed tower crane position is x t , y t , supply point position is x s , y s , z s , demand point position is x d , y d , z d , and hoisting reserved safety operation height is h . The hoisting schematic diagram is shown in Figure 4.
The hook horizontal movement duration can be divided into three types, including radial travel duration, tangential travel duration, and horizontal movement duration, and the calculation methods are shown in Equations (10)–(12), respectively.
T r = x d 2 + y d 2 x s 2 + y s 2 V r
T a = tan 1 y d y t x d x t tan 1 y s y t x s x t V a
T h = max T r , T a + λ min T r , T a
The λ in Equation (12) considers the operator’s ability to move the hook in the radial and tangential directions simultaneously. That is, considering the degree of overlap between the radial and tangential movements, λ takes a value between 0 and 1.
  • The hook vertical movement duration calculation method is given in Equation (13).
    T v = 2 z d z s + h V v
  • Furthermore, the total hook travel duration can be calculated from Equation (14).
    T t = μ max T h , T v + η min T h , T v × Q
The μ parameter indicates the uncontrollable conditions of the construction site, such as extreme weather and obstructions to the view, and the value of μ is 0.1. The smaller the value of μ , the more favorable the site is for hoisting; the η parameter is the ability of the operator to move the hook in both horizontal and vertical directions, and the value of Q is the number of prefabricated components to be hoisted.
The hoisting duration objective function of F 3 can be expressed as Equation (15):
F 3 = min μ max T h , T v + η min T h , T v
The objective function of the multi-objective optimization problem of temporary facilities arrangement on the CSPB can be expressed as F , and it is shown in Equation (16). The constraints of CSPB can be summarized in Equation (17).
F = F 1 = min H V F 2 = min i = 1 n j = 1 i C i j d i j + k = 1 n t = 1 T C D k + C k d k t 1 , t + C B k z k t F 3 = min μ max T h , T v + η min T h , T v
s . t . = y i h i 2 b 1 φ 0 y i + h i 2 b 2 + φ 0 x i l i 2 a 1 φ 0 x i + l i 2 a 2 + φ 0 x i x j l i + l j 2 W i j y i y j h i + h j 2 W i j x t x c 2 + y t y c 2 R t

2.5. MPC-NSGA-II Optimization Algorithm

Premature maturity is a highly likely phenomenon in multi-constraint and multi-objective optimization problems. In this case, the applicability of the NSGA-II algorithm is low [39]. Therefore, this study proposes a multi-objective optimization algorithm based on the NSGA-II algorithm with the constraint domination method to improve the initialization population and crowding distance in the NSGA-II algorithm. It proposes that the MPC-NSGA-II algorithm applies to the layout planning on the CSPB. The specific optimization elements of the improved MPC-NSGA-II algorithm are: (1) Adopting the Multi-population Strategy to expand the search range of the algorithm while achieving elite retention and thus avoiding premature maturity; (2) Reducing the interference of subjectively determined parameters through the constrained dominance method; (3) Introducing Harmonic distance to determine the congestion degree.

2.5.1. Multi-Population Strategy

Multi-population strategy is practiced by introducing three populations, the immigration operator and non-dominated sorting. The introduced populations are POP-a, POP-b, and POP-c. The POP-a population has a low variation probability and is responsible for searching for local optimal solutions. The POP-b population has a high variation probability and is responsible for searching for optimal global solutions. The POP-c population is an elite population responsible for recording the optimal solutions appearing in POP-a and POP-b populations. The formation process of the elite population POP-c is shown in Figure 5. The advantage of introducing this strategy is that by setting populations with different parameters, the global and local search capabilities of the algorithm are taken into account, thus expanding the search range. The elite population control algorithm process avoids the premature problem in the NSGA-II algorithm.
The immigration operator is a procedural operator that periodically introduces the optimal solution in a population to other populations during the algorithm iteration, which works as shown in Figure 6. The optimal solutions in the two populations are replaced by the relatively inferior solutions of the other populations through the migration operator. On one hand, it realizes the synergistic exchange between the two populations of POP-a and POP-b to promote co-evolution. On the other hand, this exchange operation speeds up the elimination of inferior individual solutions and drives the convergence of the algorithm.
The relatively inferior solutions within the set are removed by non-dominated sorting. It is possible to maintain optimal individuals without losing them and elite populations without crossover and mutation.

2.5.2. Constraint Domination Methods

Currently, the multi-constraint optimization problem is mainly solved by the following four methods [40]: (1) Considering feasible solution methods; (2) Penalty functions; (3) Random ordering methods; (4) Constraint domination methods. The constraint domination method avoids the artificial parameter interference present in the previous three methods while dealing with the constraints; hence, the method has been applied in this research.
Compared with the crowding distance in the NSGA-II algorithm, the Harmonic distance can better reflect the crowding level between individuals and is a more effective method. The crowding distance is introduced and given in Equation (18).
d i = N 1 1 d i , 1 + 1 d i , 2 + + 1 d i , j + + 1 d i , N , i j
where N is the population size and d i j denotes the spatial Euclidean distance between individual X i and individual X j . The flow chart of the improved MPC-NSGA-II algorithm is shown in Figure 7.

2.6. Entropy Weight-TOPSIS Decision-Making Method

After the MPC-NSGA-II optimization algorithm is used to output multiple construction site temporary facilities layout optimization schemes, the schemes are selected by a comprehensive evaluation and decision-making method by combining other influencing factors. To minimize the influence of human factors on the results, the entropy weight-TOPSIS integrated decision-making method is used to evaluate the output optimization solutions to obtain the best solution.
The entropy weight method determines the weight of indicators based on the amount of information reflected by the data of each indicator. Compared with subjective weighting methods (expert scoring, hierarchical analysis, etc.), the entropy weight method can reflect the importance of each index more objectively and accurately [41].
In an evaluation system with m options to be evaluated and n evaluation indicators, the weight ω i of the i evaluation indicator is defined in Equation (19).
ω i = 1 Φ i n i = 1 n Φ i
where the entropy value of the i evaluation indicator Φ i is defined in Equation (20).
Φ i = 1 ln m j = 1 m C o i j ln C o i j
where ω i is the entropy weight coefficient, Φ i is the entropy value of the first i evaluation index, and n represents that there are n evaluation indexes.
A larger ω i means that the greater the amount of information represented by the indicator, the greater the effect on the comprehensive evaluation the greater the effect.
TOPSIS, also known as the “ideal solution method”, is based on calculating the distance between the evaluation object and the optimal and inferior solutions. The basic principle of the TOPSIS method is to calculate the distance between the evaluation object and the optimal solution and the worst solution as the primary basis for evaluating the merits of the solution [42]. The ideal proximity C * is calculated in this research from Equation (21).
C = S i S i + + S i , i = 1 , 2 , , m
where S + is the distance scale from the target to the ideal solution and S is the distance scale from the target to the anti-ideal solution. After calculating C * , each solution is ranked according to the size of C * . The larger C * means the better scheme, and the best scheme is selected.

3. Engineering Analysis

3.1. Engineering Situations

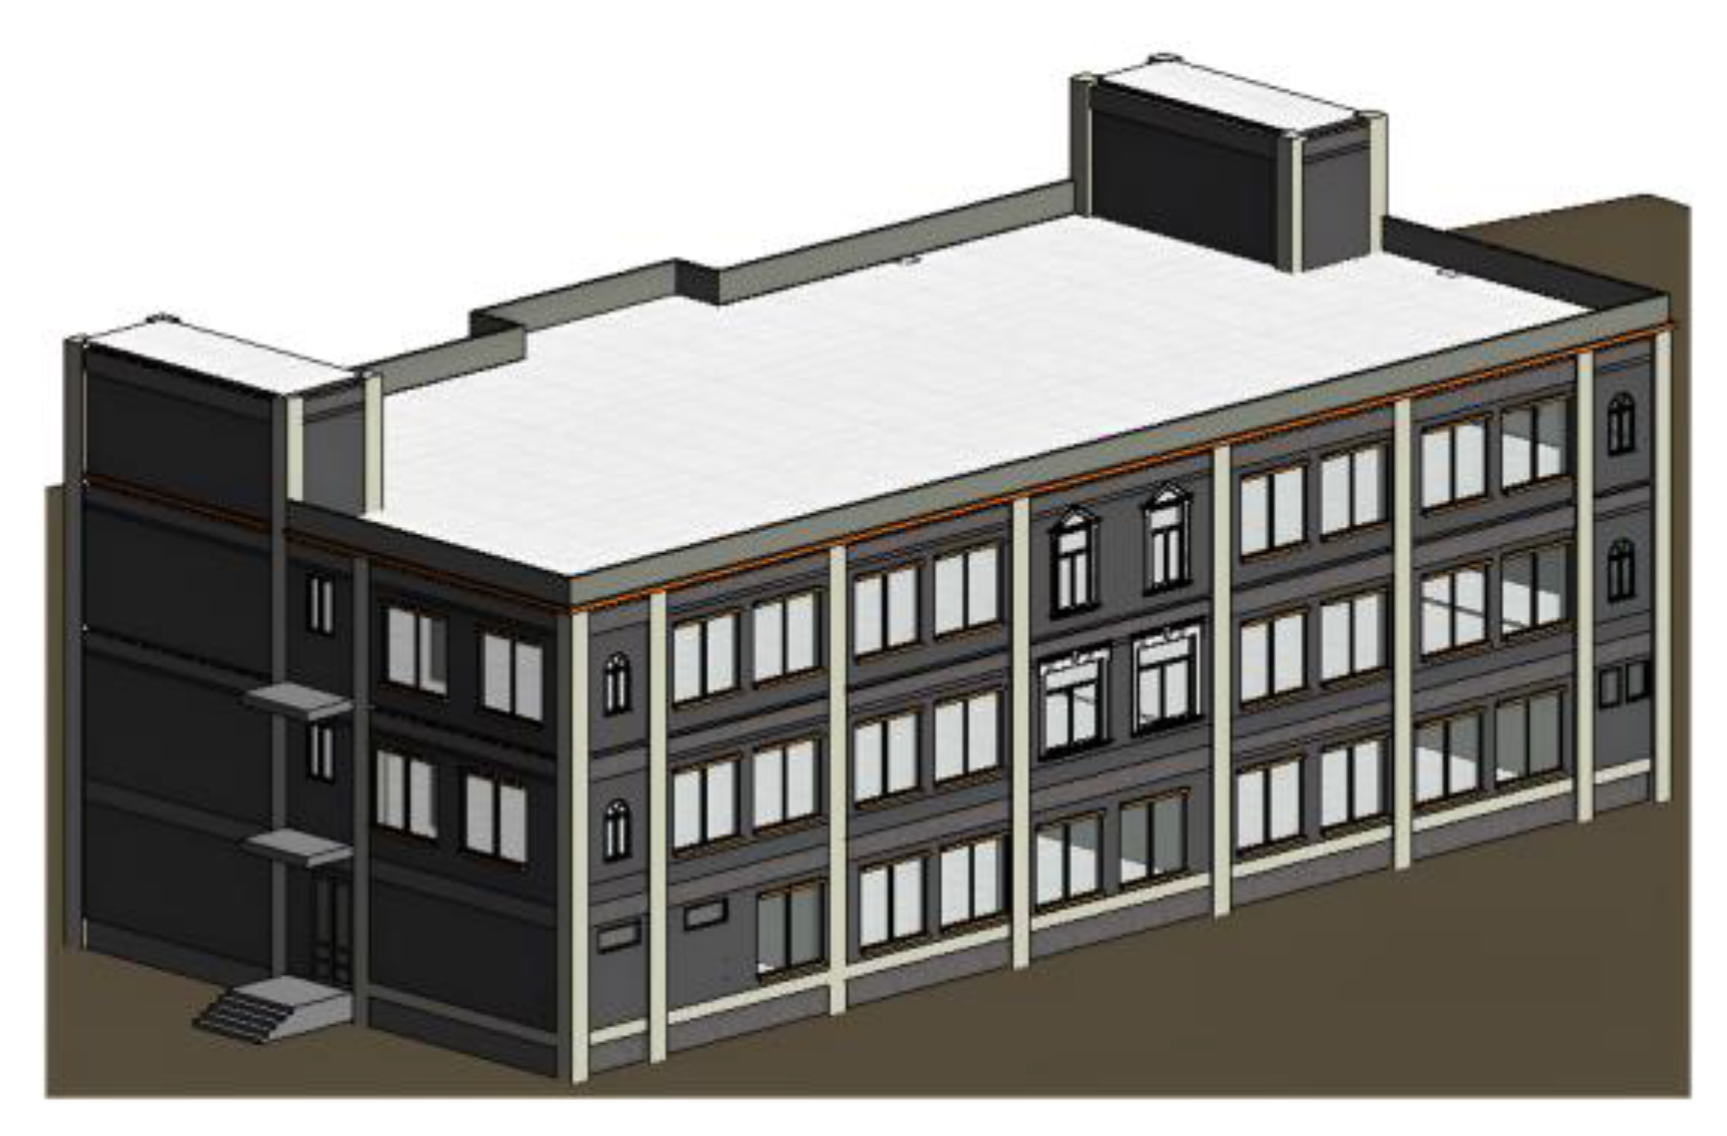
The project has two teaching buildings with three floors. The length of the building is 40 m, the width is 20 m, the story height is 3.9 m, and the total height is 17.05 m. The building belongs to a Class A public building, with a total construction area of 4478 m2. The BIM model of the building is shown in Figure 8.
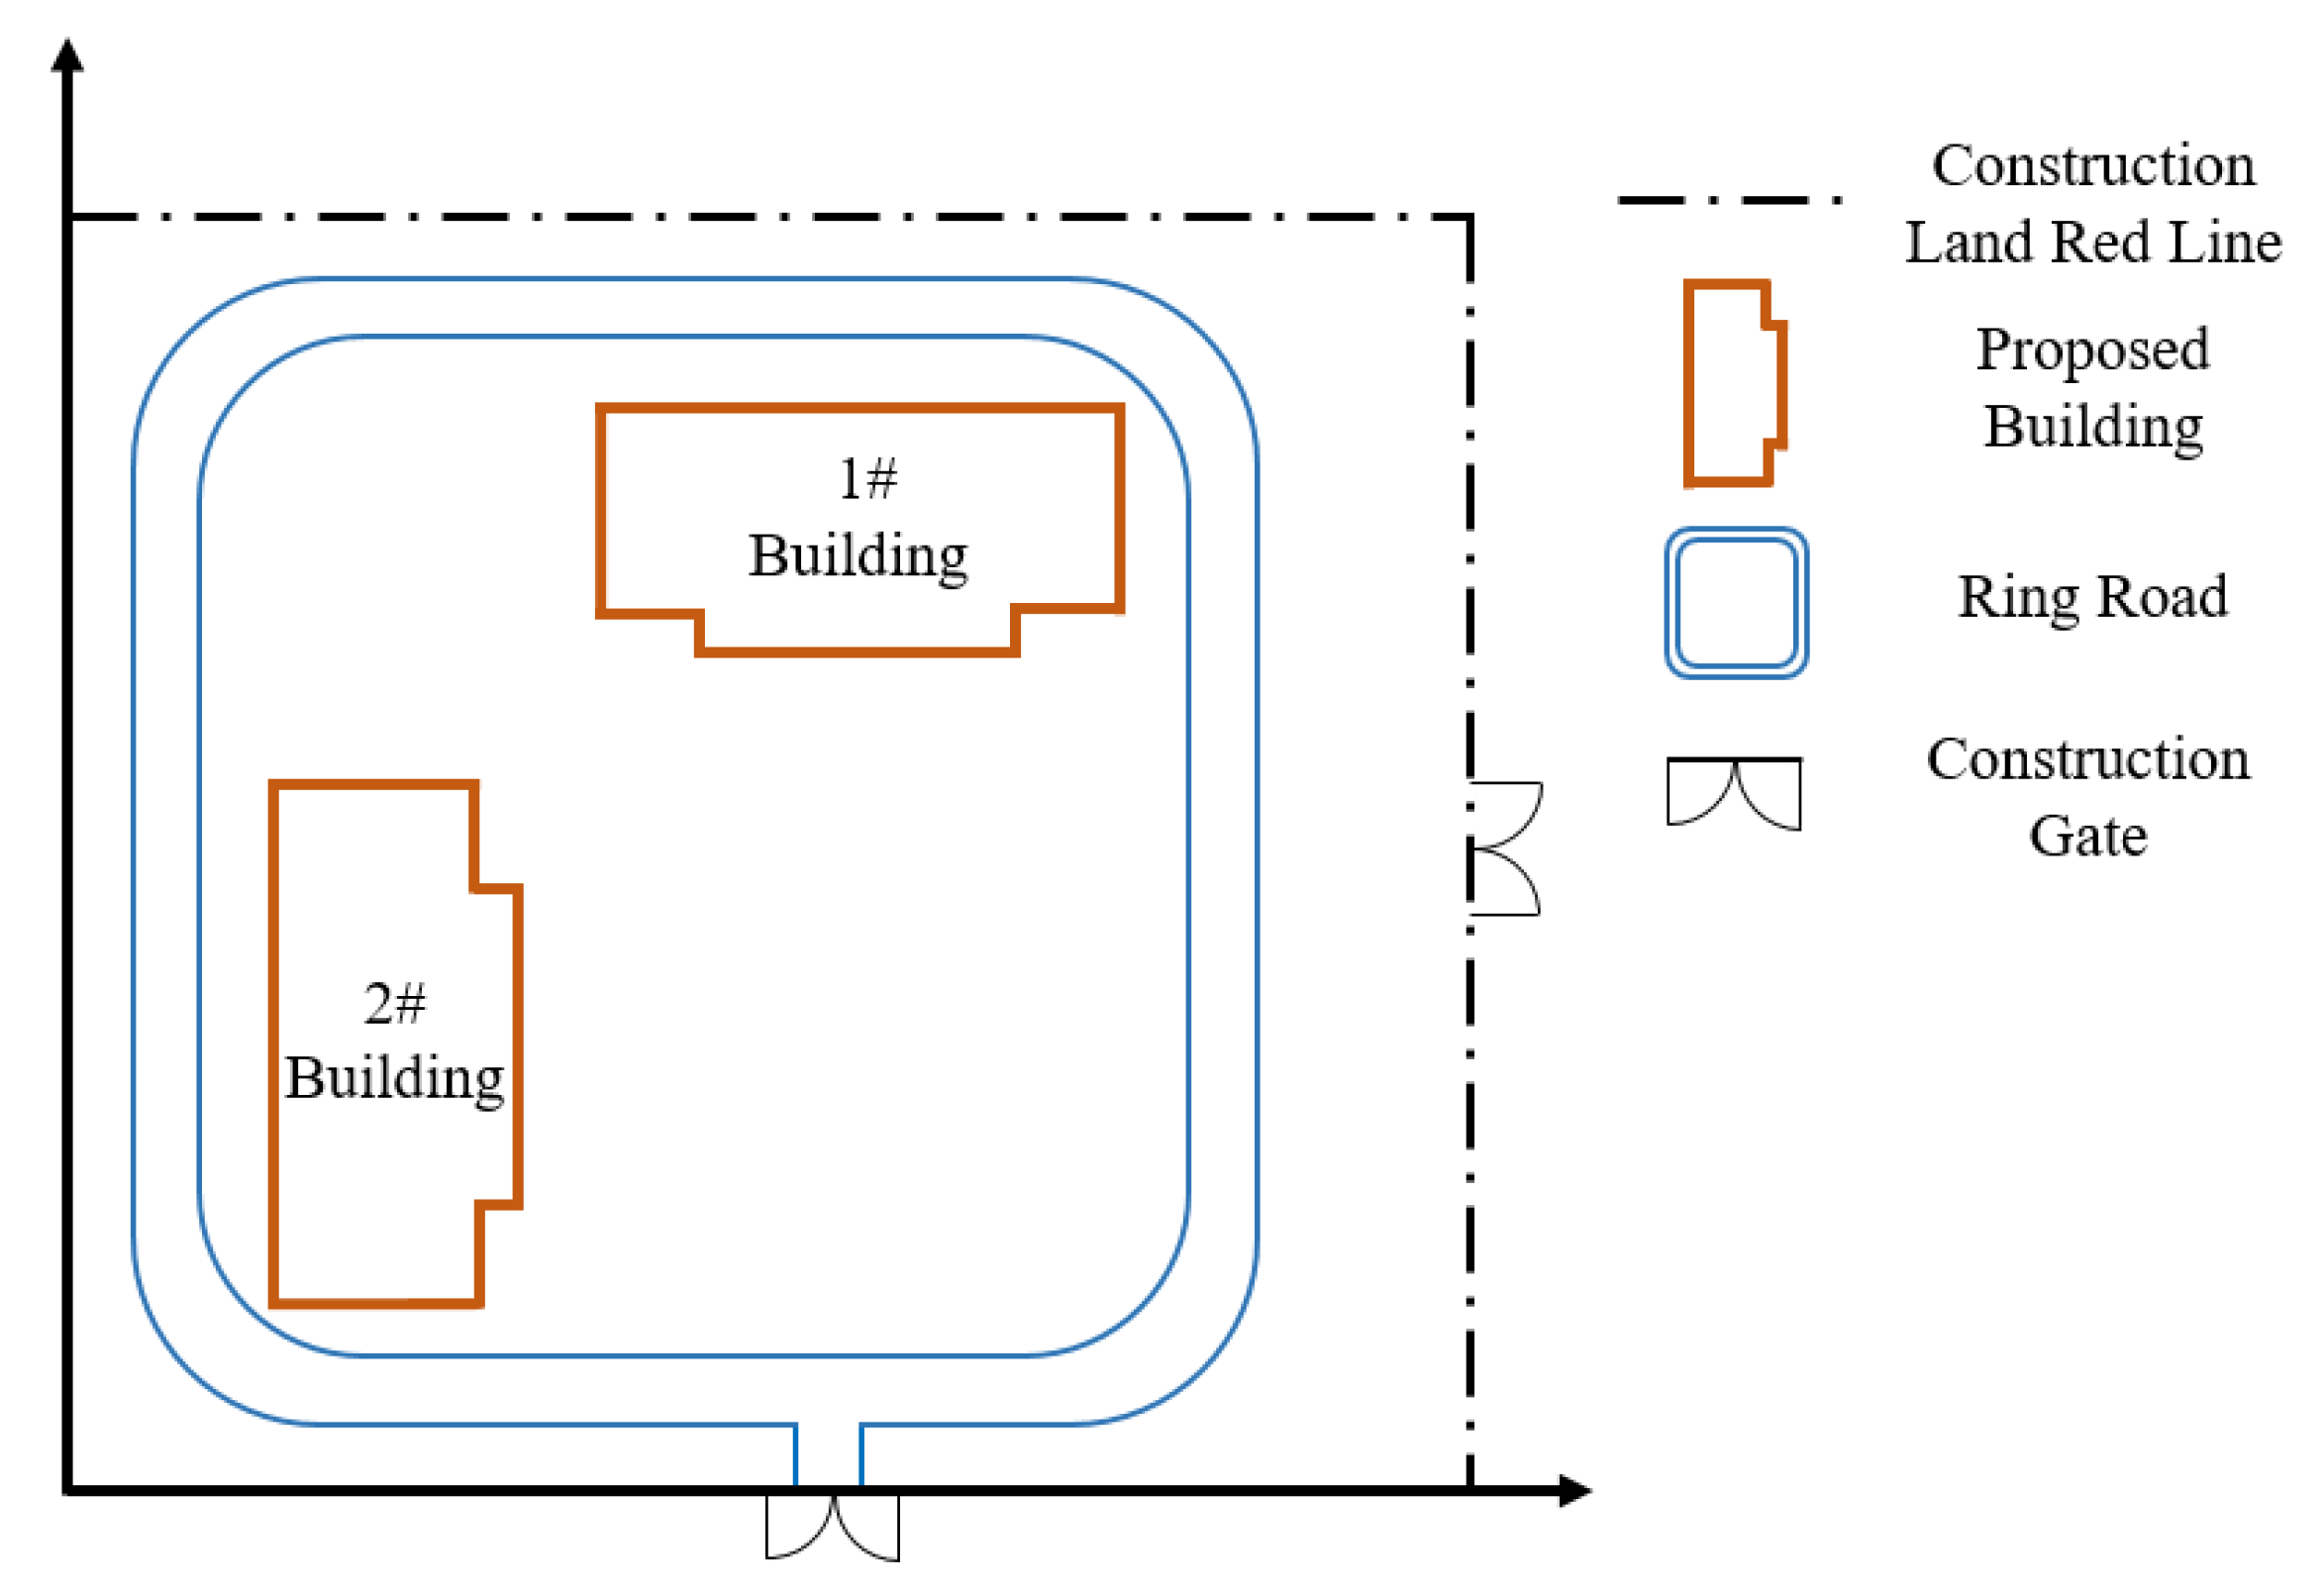
The prefabricated components in the project are composite slabs and prefabricated stairway sections. The construction site layout size is 105 × 100 m. There is a 5.0 m wide proposed permanent circular road within the site. According to the principle of construction road layout, it will be used as a construction road. There are two entrances to the CSPB communication with the outside world. The main entrance is located on the south side of the site, and the secondary entrance is located on the east side of the site. According to the principle of fixed tower crane selection, the QTZ5010 was used on-site for hoisting work. The initial construction site of the project is shown in Figure 9.

3.2. Technical Analysis Route

The multi-objective optimization and decision-making model structure of temporary facilities arrangement on the CSPB is shown in Figure 10.
The MPC-NSGA-II multi-objective optimization algorithm consists of three main parts: initializing the populations, loop iteration, and loop termination.
Take the southwest corner of the site as the origin of the coordinate system of the whole construction site based on the basic information of the construction site. Divide the grid size (usually square grid) according to the actual situation and determine the coordinate information of fixed facilities. From Section 2.1, the model has too many constraints. If the initial population is randomly generated, it will increase the difficulty of searching for feasible solutions. Constraints must be checked and passed before a valid initial population is obtained. Therefore, the entire Pareto front surface can be obtained so that the solutions generated by the initialized population are all in the feasible domain.
The population evolves continuously in a loop iteration, so the iterative result gradually approximates the actual Pareto front surface. The loop iteration process of the model consists of three key components: population selection, crossover, mutation operations, immigration operator updates, and elite population updates.
The selection, crossover, and mutation of populations give the algorithm a powerful spatial search capability.
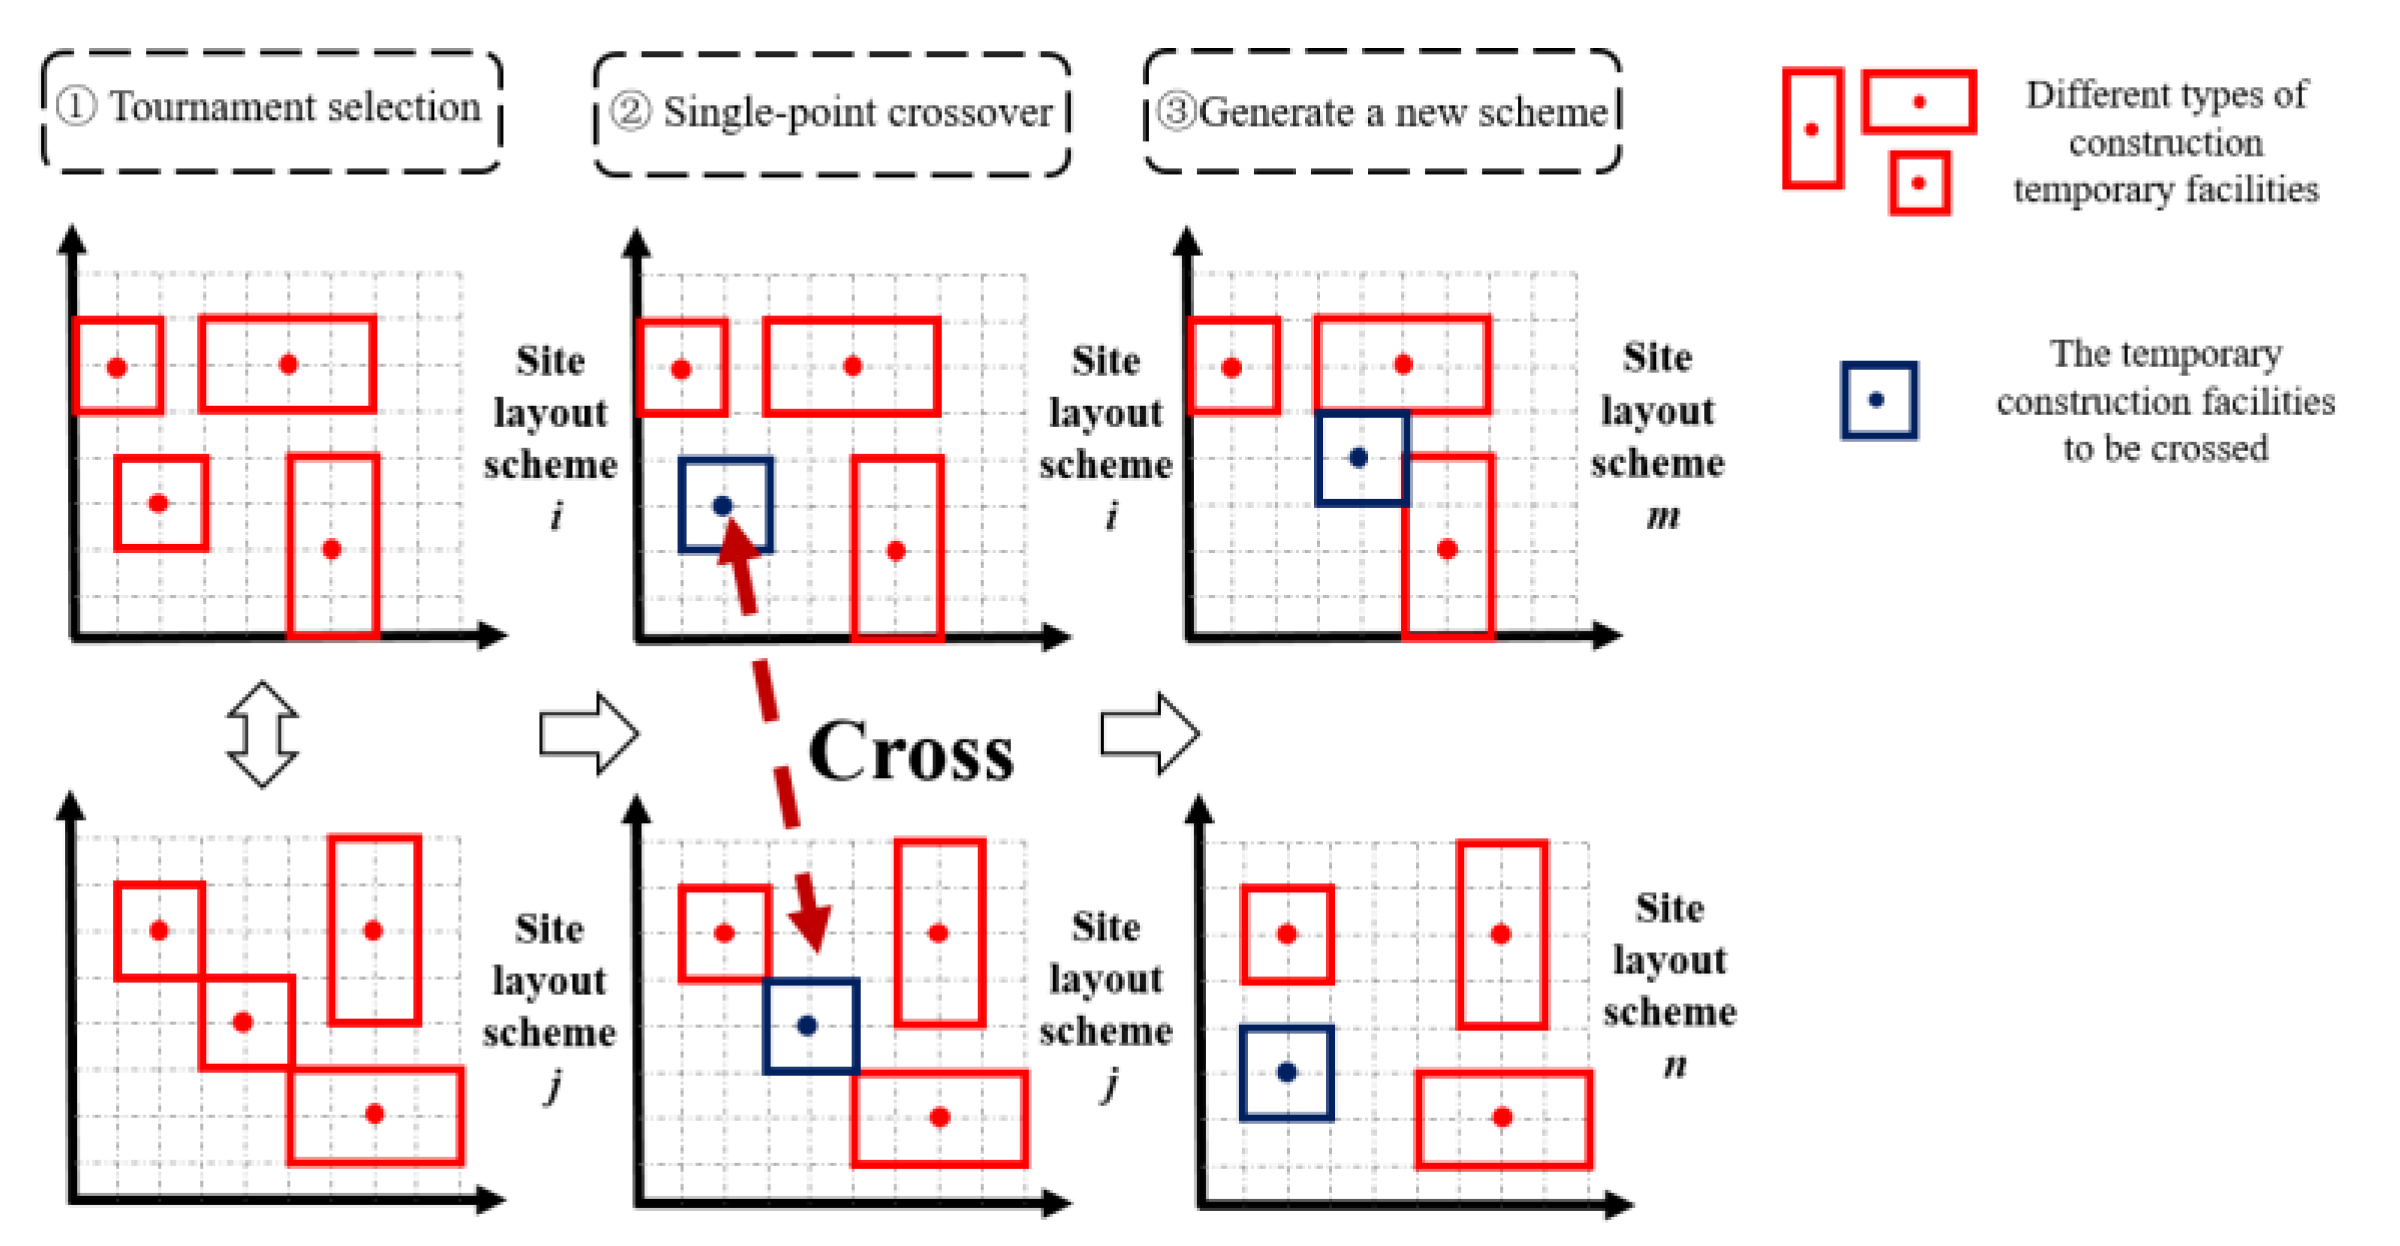
The selection is the operational process of transmitting good genes to the next generation by selecting high-quality individuals in the parent population. The binary tournament selection method places randomly selected individuals into the mating pool.
The crossover is performed by exchanging chromosomal information of two individuals in the mating pool, forming a new individual. Assume that the parents are X i and X j , respectively, and a single point of crossover is used between them to achieve the update of genetic information. The process is shown in Figure 11.
The mutation is a mutation of genetic information somewhere in a chromosome that results in the formation of a new individual. Due to the constraint relationship between individual facilities in a feasible temporary facility layout scheme, classical variation can easily lead to the generation of infeasible solutions. Therefore, the model does not use the classical variation approach. A new arrangement scheme is generated when the chromosome satisfies the mutation condition.
The model is terminated by the number of generations in which the optimal number of individuals remains constant with the maximum number of iterations. In other words, the model is stopped when the number of generations in which the optimal number of individuals in the elite population POP-c remains constant, reaches a preset value or when the maximum number of iterations is set.

3.3. Parameter Determination

The parameters to be determined are site and fixed facility parameters, temporary facilities parameters, hazard scale division parameters, logistics intensity classification situation, and hoisting parameters information parts.

3.3.1. Site and Fixed Facility Parameters

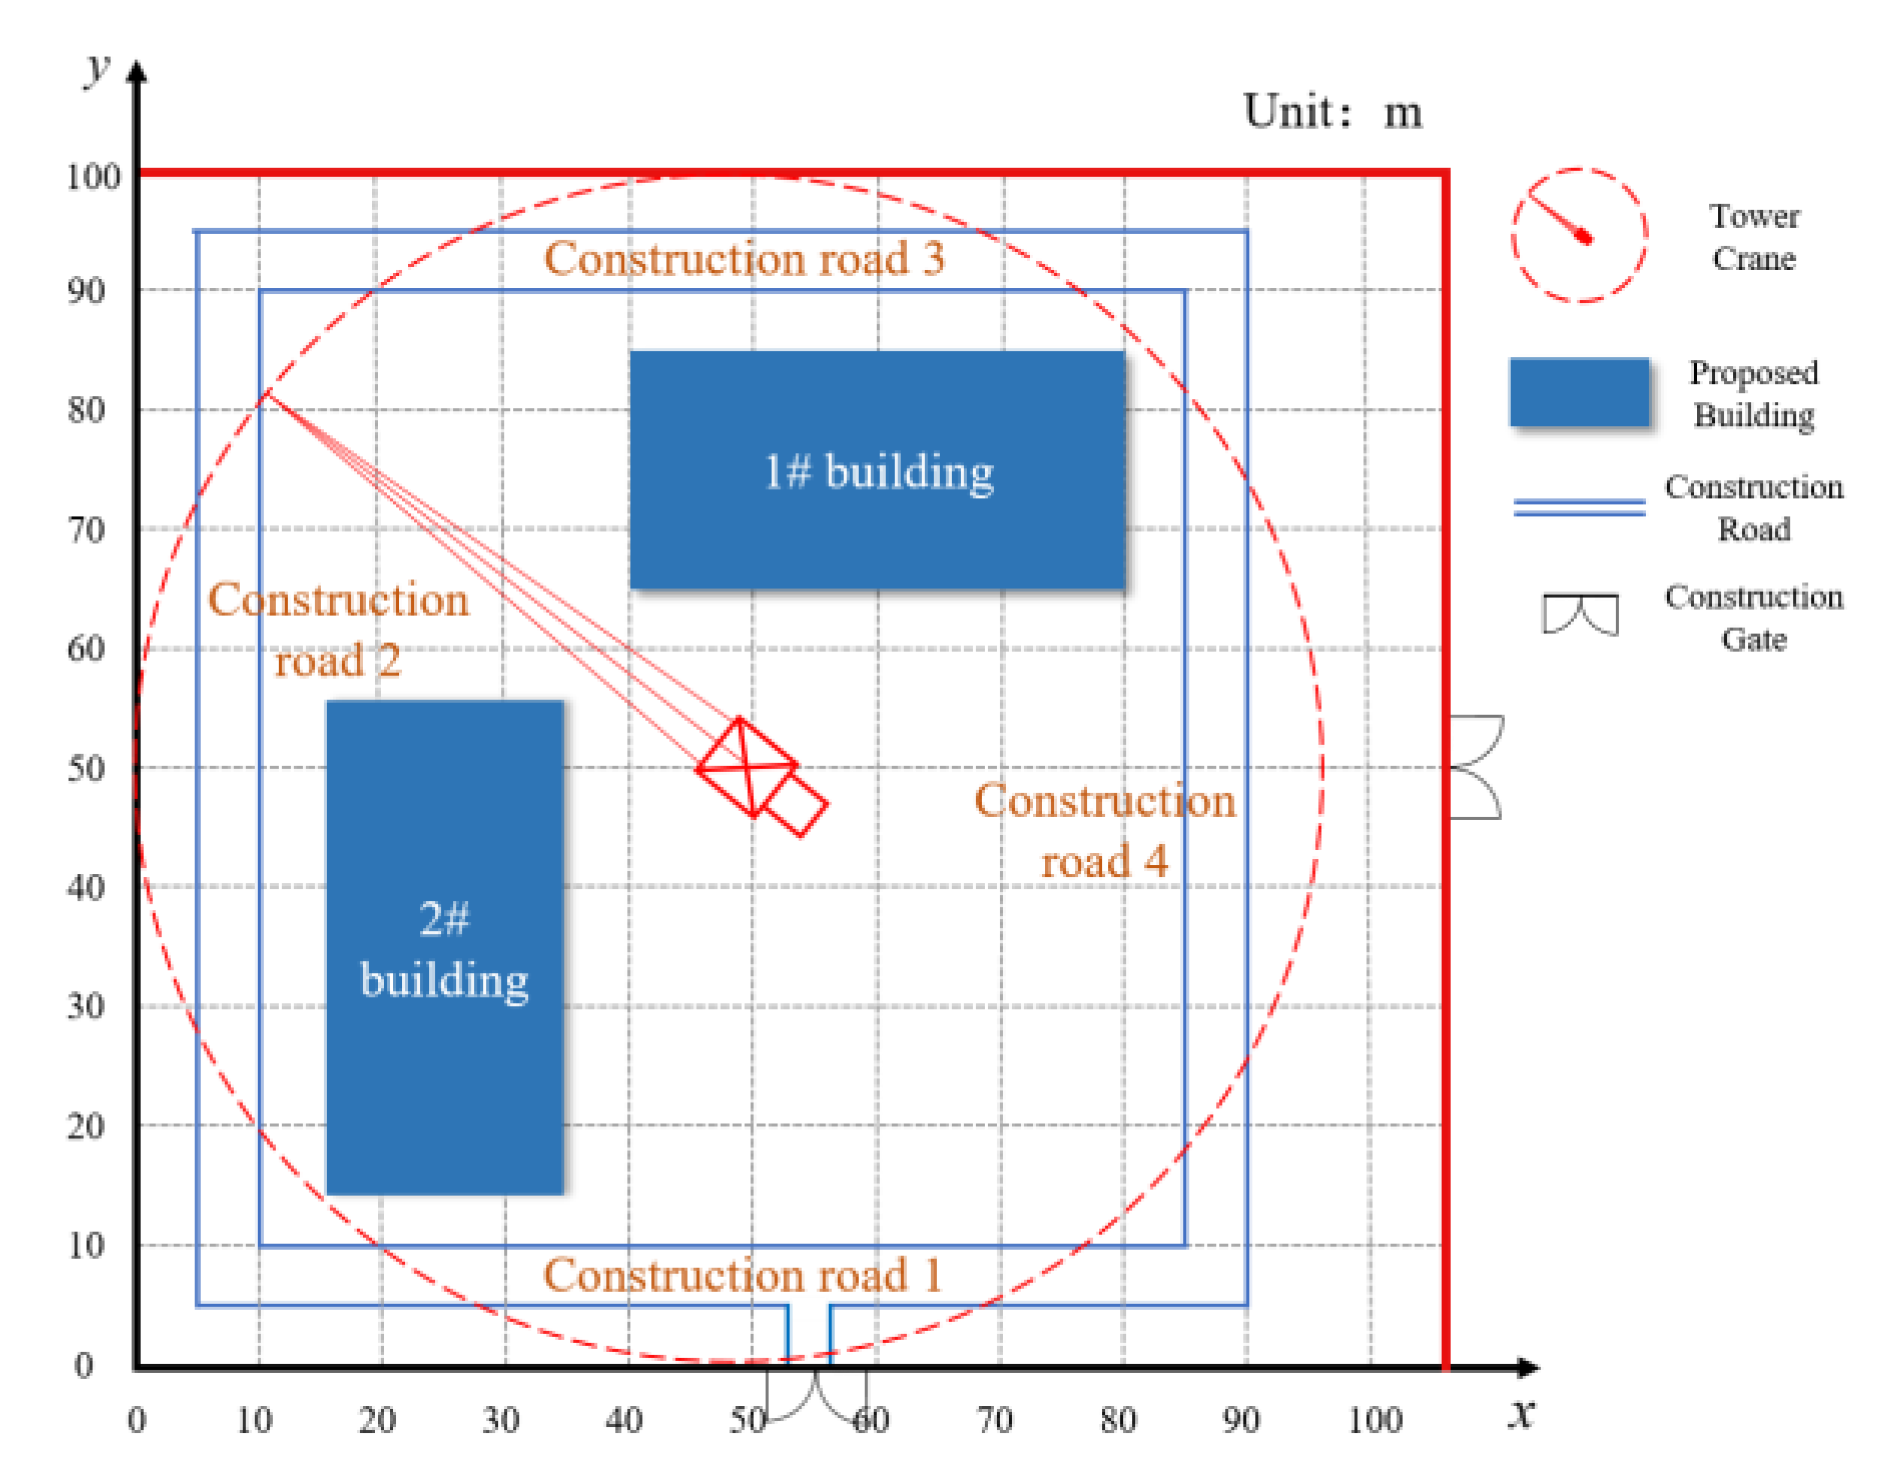
The southwest corner of the project construction site is taken as the origin of the coordinate axis, the AGSM is used to simplify the teaching building into a 40 × 20 m rectangular block, and the circular road within the site is regarded as a combination of four rectangular blocks to obtain the fixed facility coordinates. The length of the tower crane tail end of QTZ5010 is 12.72 m. According to the tower crane arrangement method, the proposed tower crane was arranged at (50, 50). Table 2 provides the relevant location information of the fixed facilities.
The simplified initial construction layout is shown in Figure 12.
According to the simplified preliminary construction layout plan, combined with the actual situation on-site, the coordinate range of the available sites for other temporary facilities is divided.

3.3.2. Temporary Facility Parameters

The prefabricated component yard is the key consideration in the temporary facilities layout on CSPB. Therefore, it is necessary to determine the area of the prefabricated components yard and its size first. The two buildings in the project have the same structure. A total of 76 prefabricated laminated panels are required for this floor, with a total of 2 types of sizes, of which 54 are required for DBS-67-3318 and 18 are required for DBS-67-4218. The prefabricated stairs are selected from SAT-39-25, and 2 stairs are required for each floor, with 4 stair sections.
The dimensions of all prefabricated components are summarized in Table 3.
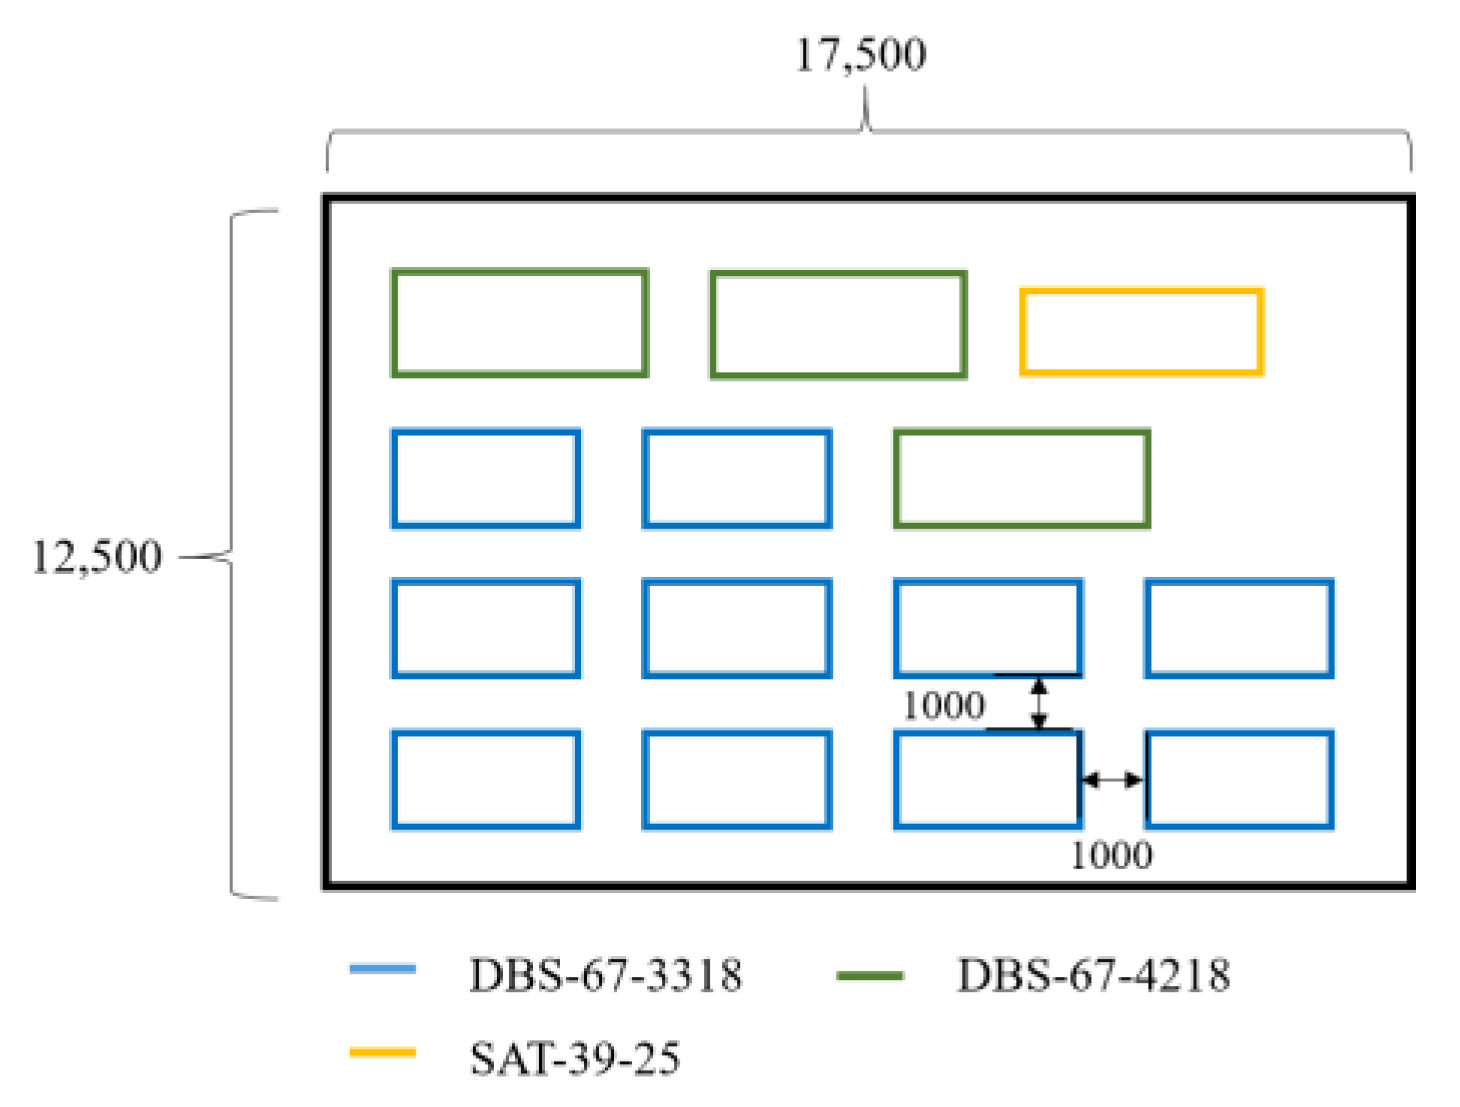
According to the construction plan and site conditions, a layer of prefabricated components needs to be reserved at the construction site. Therefore, 10 stacks of DBS-67-3318 precast laminated panels, 3 stacks of DBS-67-4218 precast laminated panels, and 1 stack of precast stairs were calculated. Considering the prefabricated components stacking requirements and the construction site space, the prefabricated laminated panels and stairs are placed in one yard.
The schematic diagram of the temporary storage of prefabricated components is based on the prefabricated component stacking requirements, as shown in Figure 13. The figure shows that the interval distance between prefabricated component stacks is 1 m, as reserved space for operation.
In addition, seven temporary production facilities and two temporary living facilities were selected according to the actual situation on-site, and the information related to the temporary facilities is summarized in Table 4.

3.3.3. Hazard Scale Parameters

The hazard scales of each facility need to be divided in advance to calculate the objective function. Related research [37] generated the criteria for dividing the hazard scales of construction facilities in his research. The hazard scales of the facilities in this project are shown in Table 5.

3.3.4. Logistics Intensity Classification

We must grade the logistics intensity between the construction facilities before determining the objective function. According to the information on the engineering budget of the Ministry of Commerce for the project, the logistics intensity grading between construction facilities is shown in Figure 14.
Related research generated quantitative values of logistic intensity levels using the fuzzy set theory [28], proving the suggested values’ validity by using practical projects [43]. Therefore, these suggested values are used in this case: A is 7776, E is 1296, I is 216, O is 36, U is 6, and X is 1. This project is the main structure construction phase, and the temporary facilities do not change their location during the construction period of 0.

3.3.5. Hoisting Information Parameters

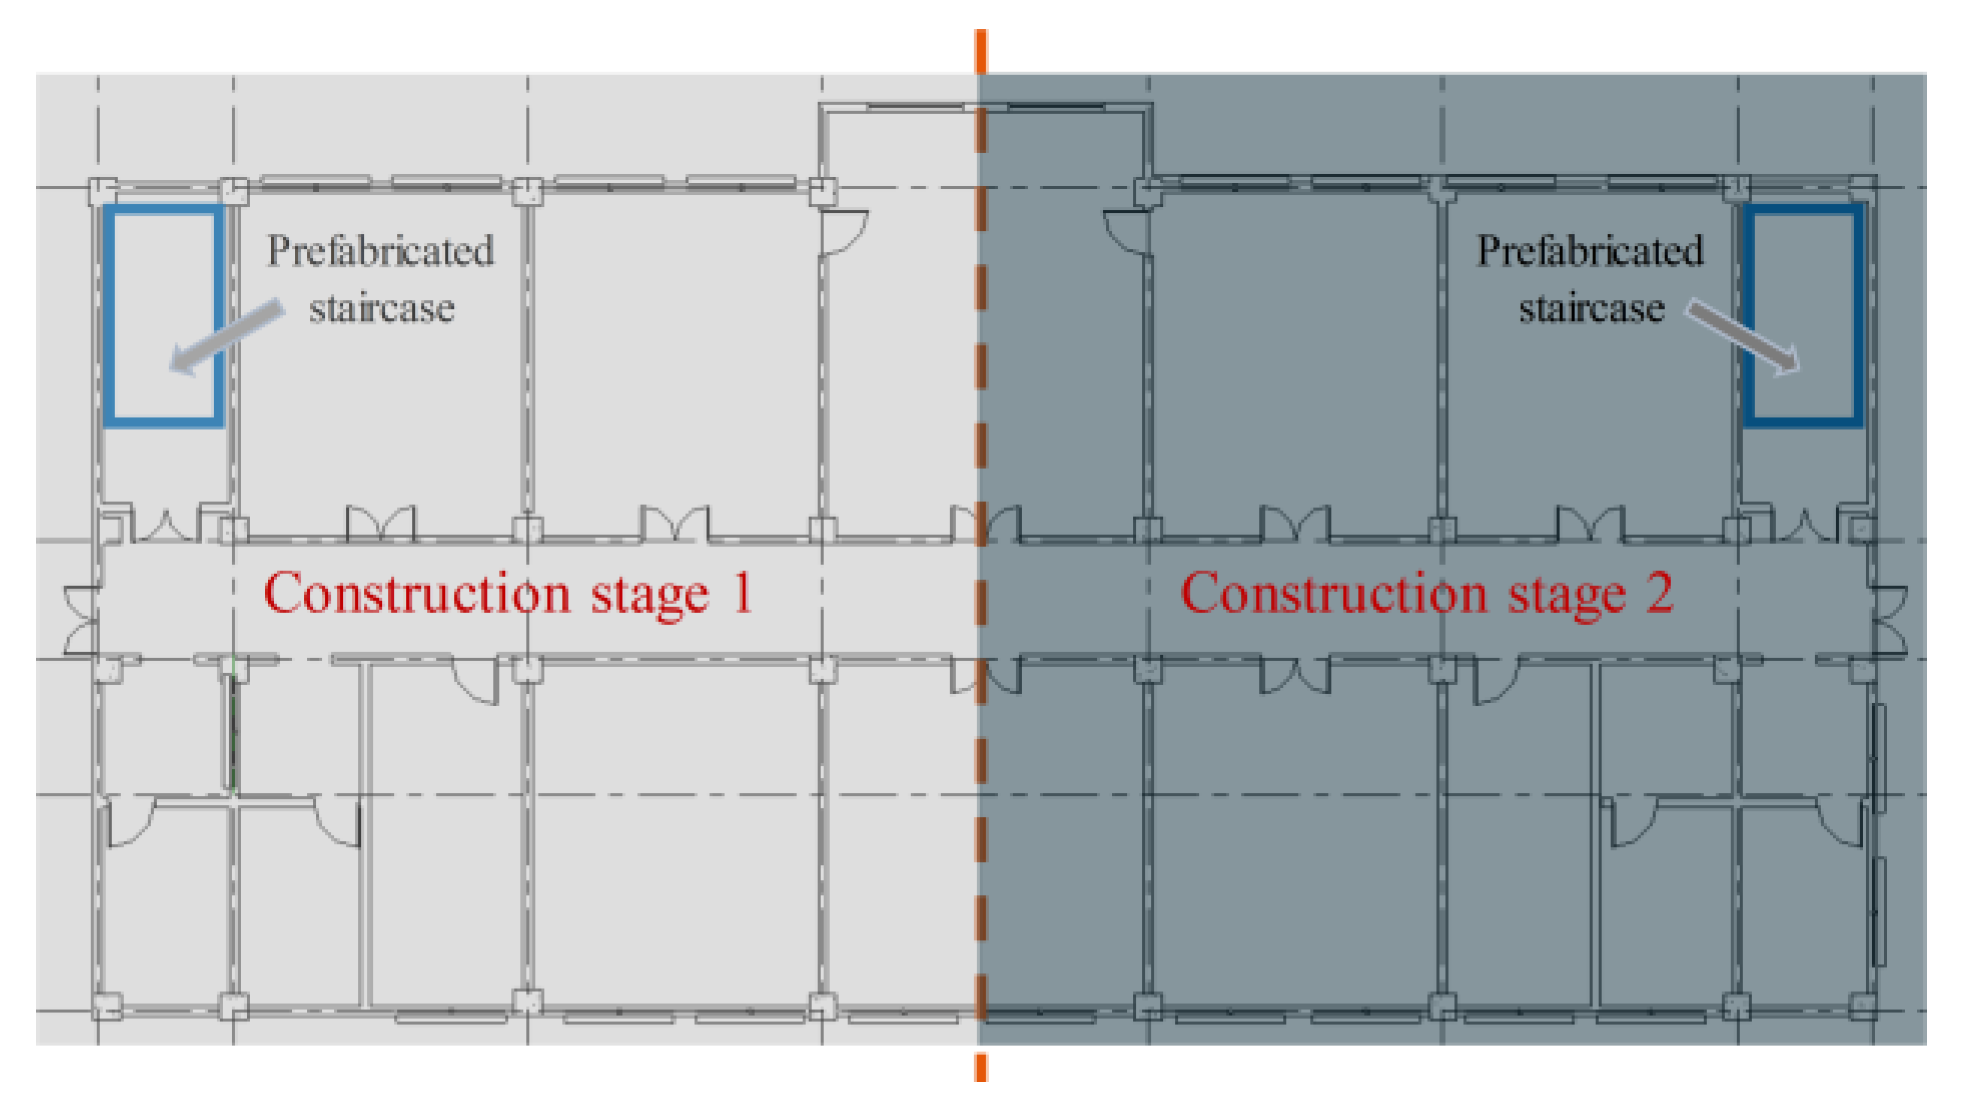
The construction and installation machinery used in this project is the QTZ5010 tower crane. To ensure smooth installation work, the tower crane is used to hoist at four times the rate. Hook hoisting and radial and rotation speeds are 0.6 m/min, 20 m/min, and 0.5 rad/min, respectively. The prefabricated components of the proposed building are arranged symmetrically from left to right. Considering the flowing construction, the whole building is divided into two construction sections, and each section is considered as a whole, as shown in Figure 15. The center of the prefabricated staircase is used as the hoisting point, and the location of the prefabricated staircase demand point can be obtained. Because of many prefabricated laminated panels, the centers of the two construction sections are used as the demand point coordinates of the prefabricated laminated panels to consider the calculation volume and accuracy.

4. Results and Discussion

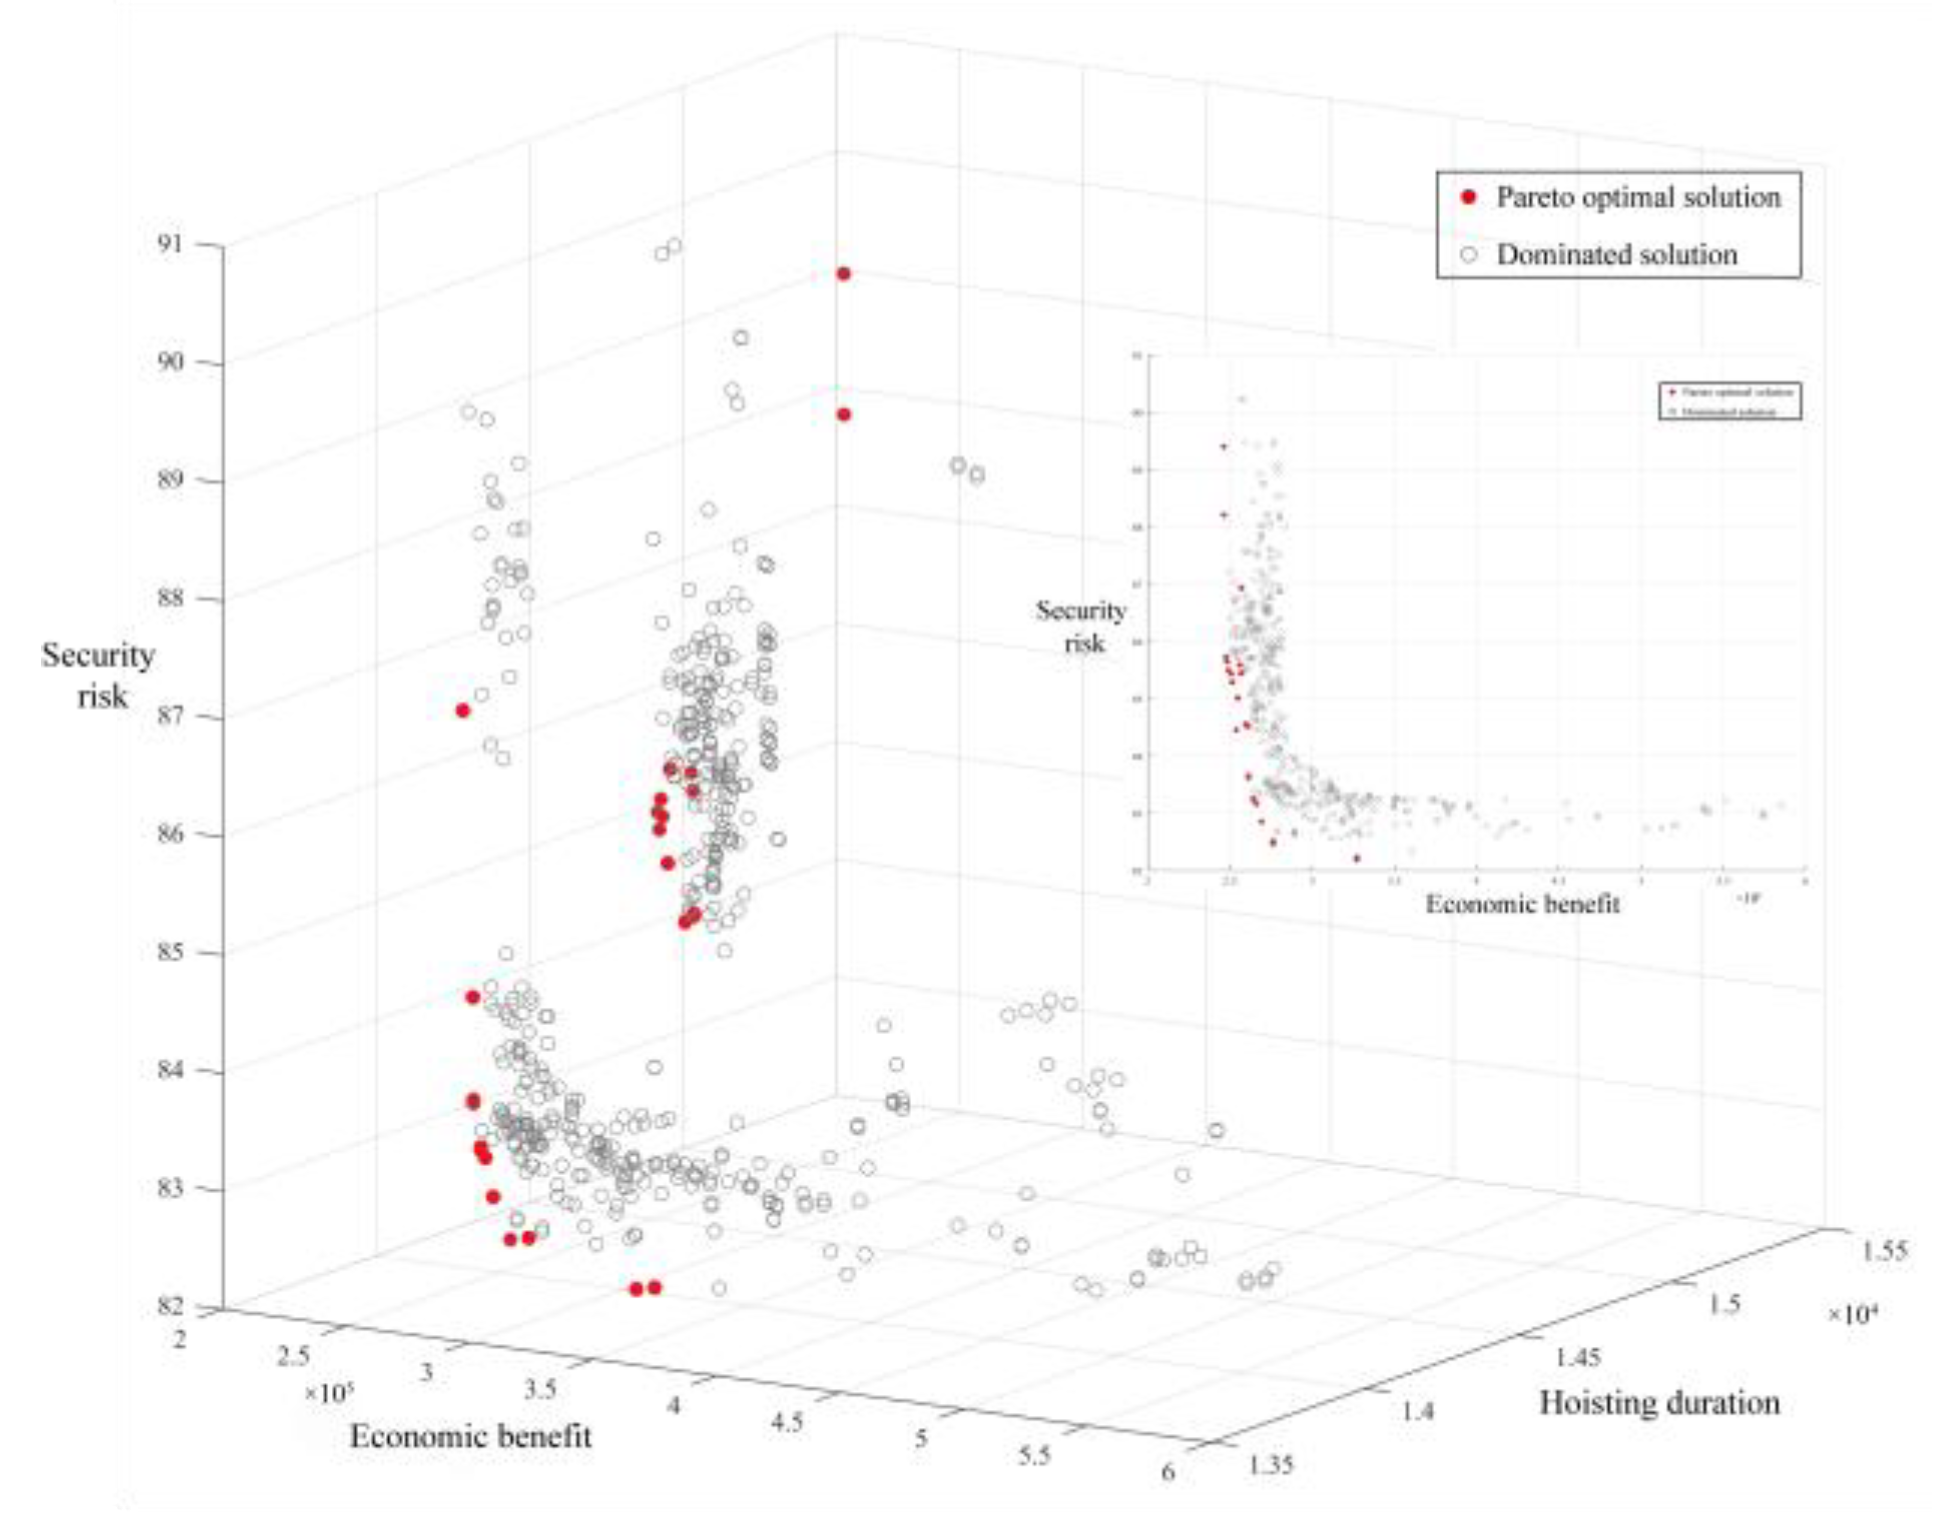
The computer hardware configuration for this validation simulation experiment is Intel (R) Core (TM) i5-13600KF CPU @ 5.10GHz, 32.0G of RAM, and a 64-bit operating system. The model was run in MATLAB 2020b. The input parameters were assigned to the MPC-NSGA-II optimization algorithm. The POP-a, POP-b, and POP-c population sizes were set to 150, the crossover rate was 0.9, the mutation rate was set to 0.05 and 0.7, respectively, and the maximum number of iterations was 200. A total of 23 optimal feasible solutions were generated from the model runs, and the results are shown in Figure 16 and Table 6.
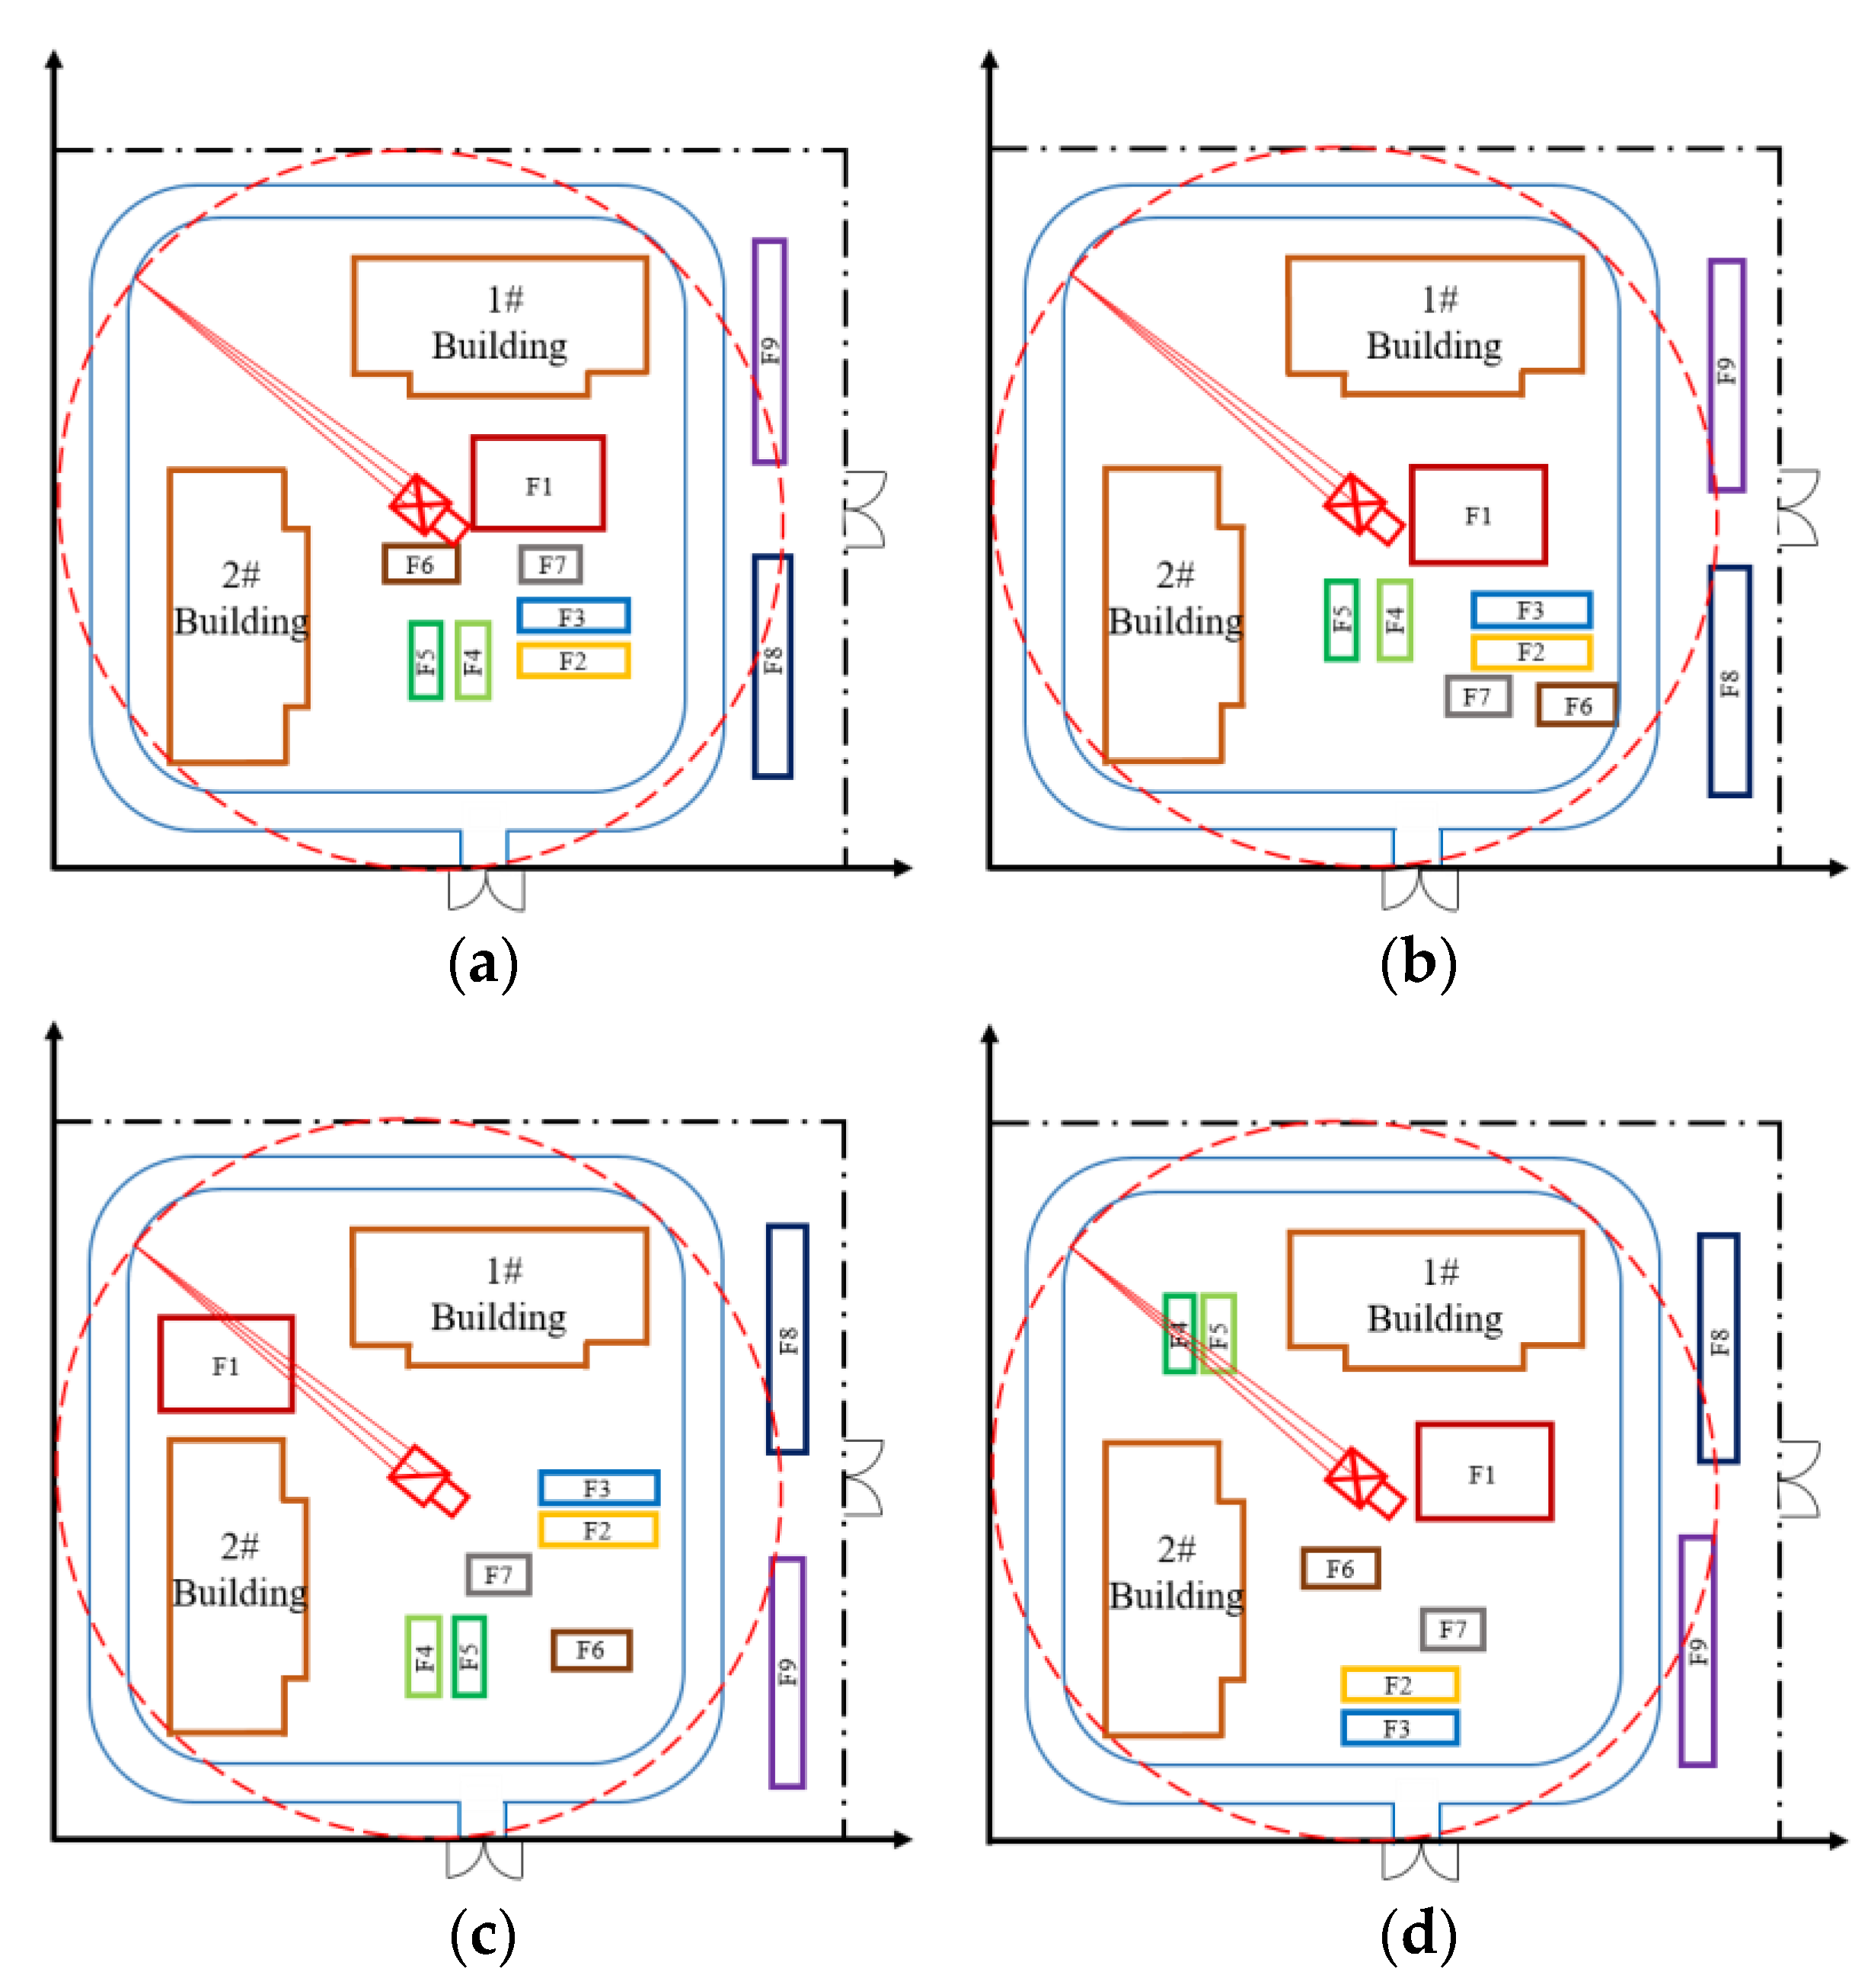
To provide a more precise illustration of the decision part of the model, four Pareto optimal solution schemes with significant layout differences were selected from the above optimization results for comparison. The simple arrangement of the four schemes is shown in Figure 17. The parameters are shown in Table 7.
To choose the best solution, a comprehensive evaluation is proposed using the entropy weight-TOPSIS method. There are four evaluation attributes to be considered: “Smoothness”, “Convenience”, “Management efficiency”, and “Spatial adjustability”.
The project manager performs the fuzzy evaluation of the four judging factors of each program. First, the set of judging index factors U f is established in Equation (22).
U f = Smoothness , Convenience , Management   efficiency , Spatial   adjustability
The evaluation level V e is established in Equation (23).
V e = V 1 , V 2 , V 3 , V 4 , V 5 = Excellent , Good , Fair , Pass , Poor
V 1 V 5 correspond to 5, 4, 3, 2, and 1 scores, respectively. The initial decision matrix is obtained by combining the fuzzy evaluation results of the three project managers and then normalizing the decisionalization matrix.
The ideal and anti-ideal solutions are in Equations (24) and (25)
C + = 0.1344 0.3334 0.1090 0.0705
C = 0.0768 0.1192 0.0672 0.0434
Finally, the ideal proximity C is calculated, and the results are listed in Table 8.
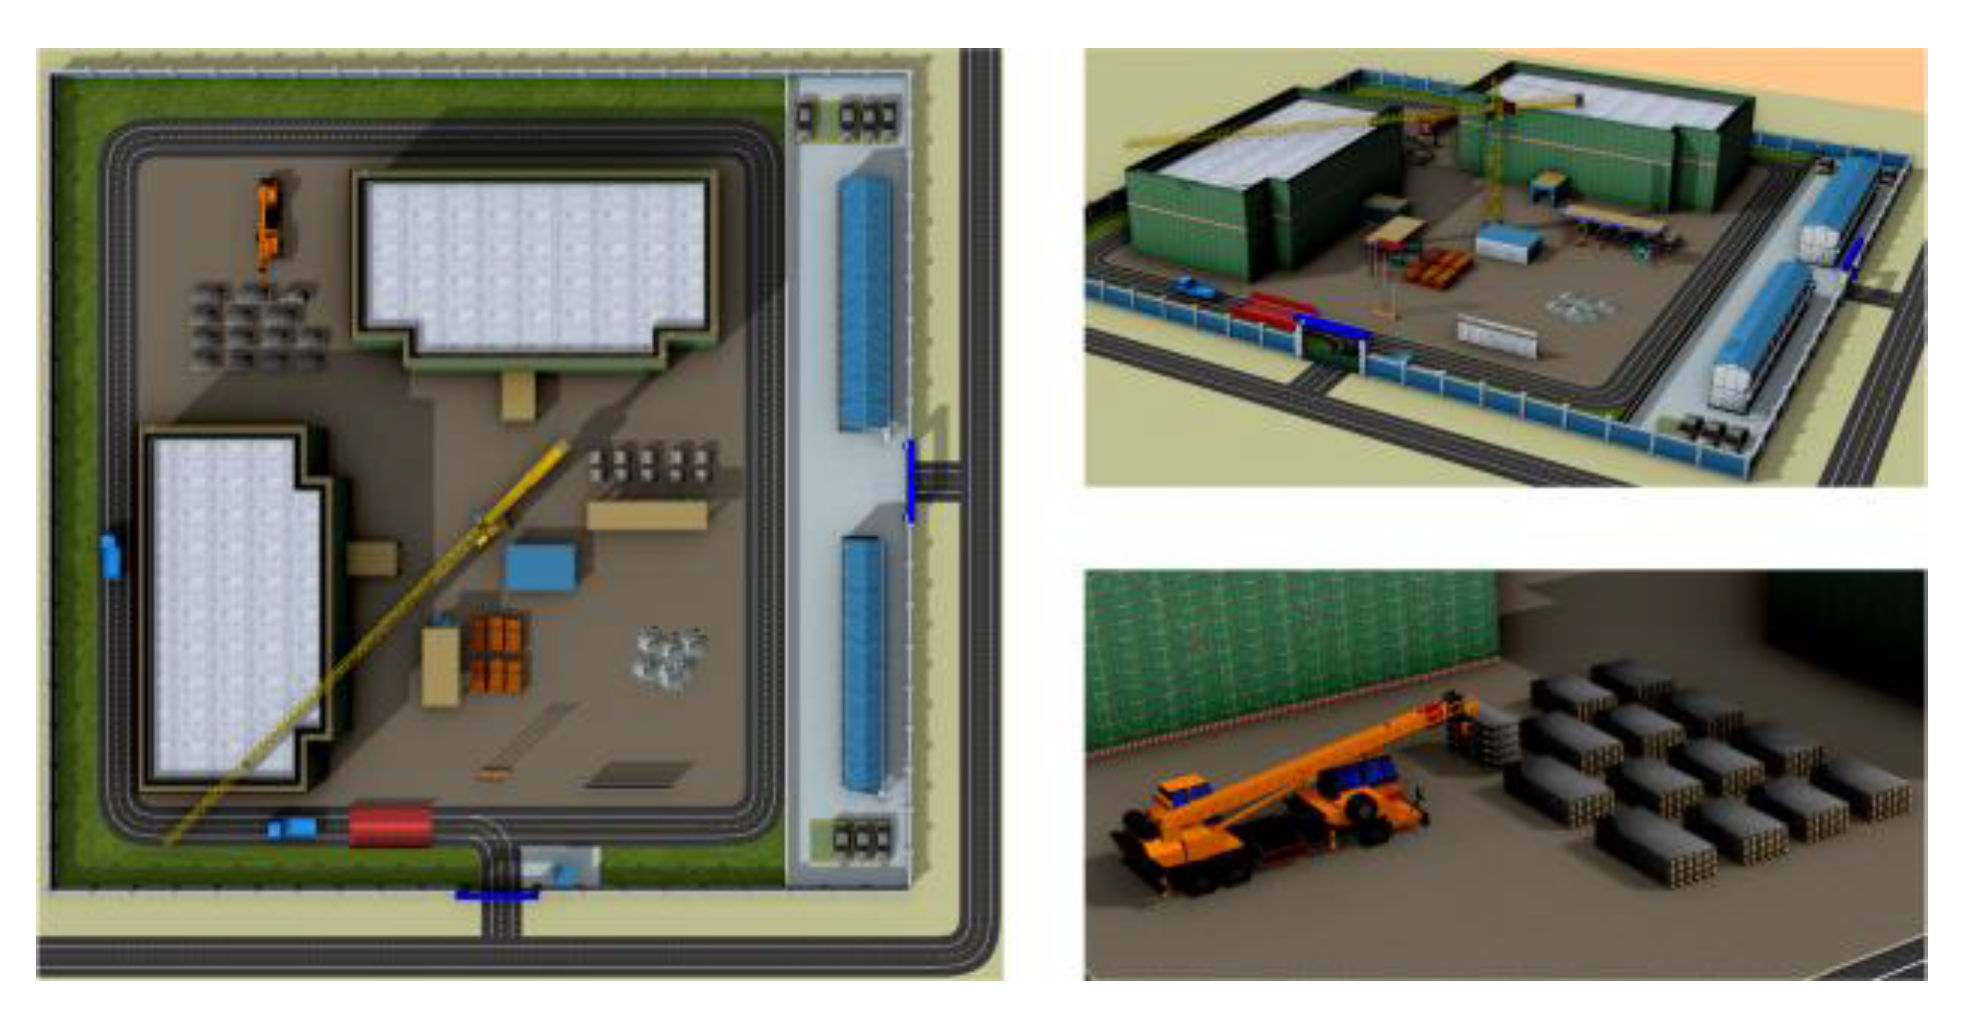
According to the evaluation results, scheme 5 is the best temporary facilities layout scheme on CSPB. To visually check whether the output best scheme is reasonable, a 3D temporary facilities layout model was established in BIMMAKE 2022, and the results are shown in Figure 18.
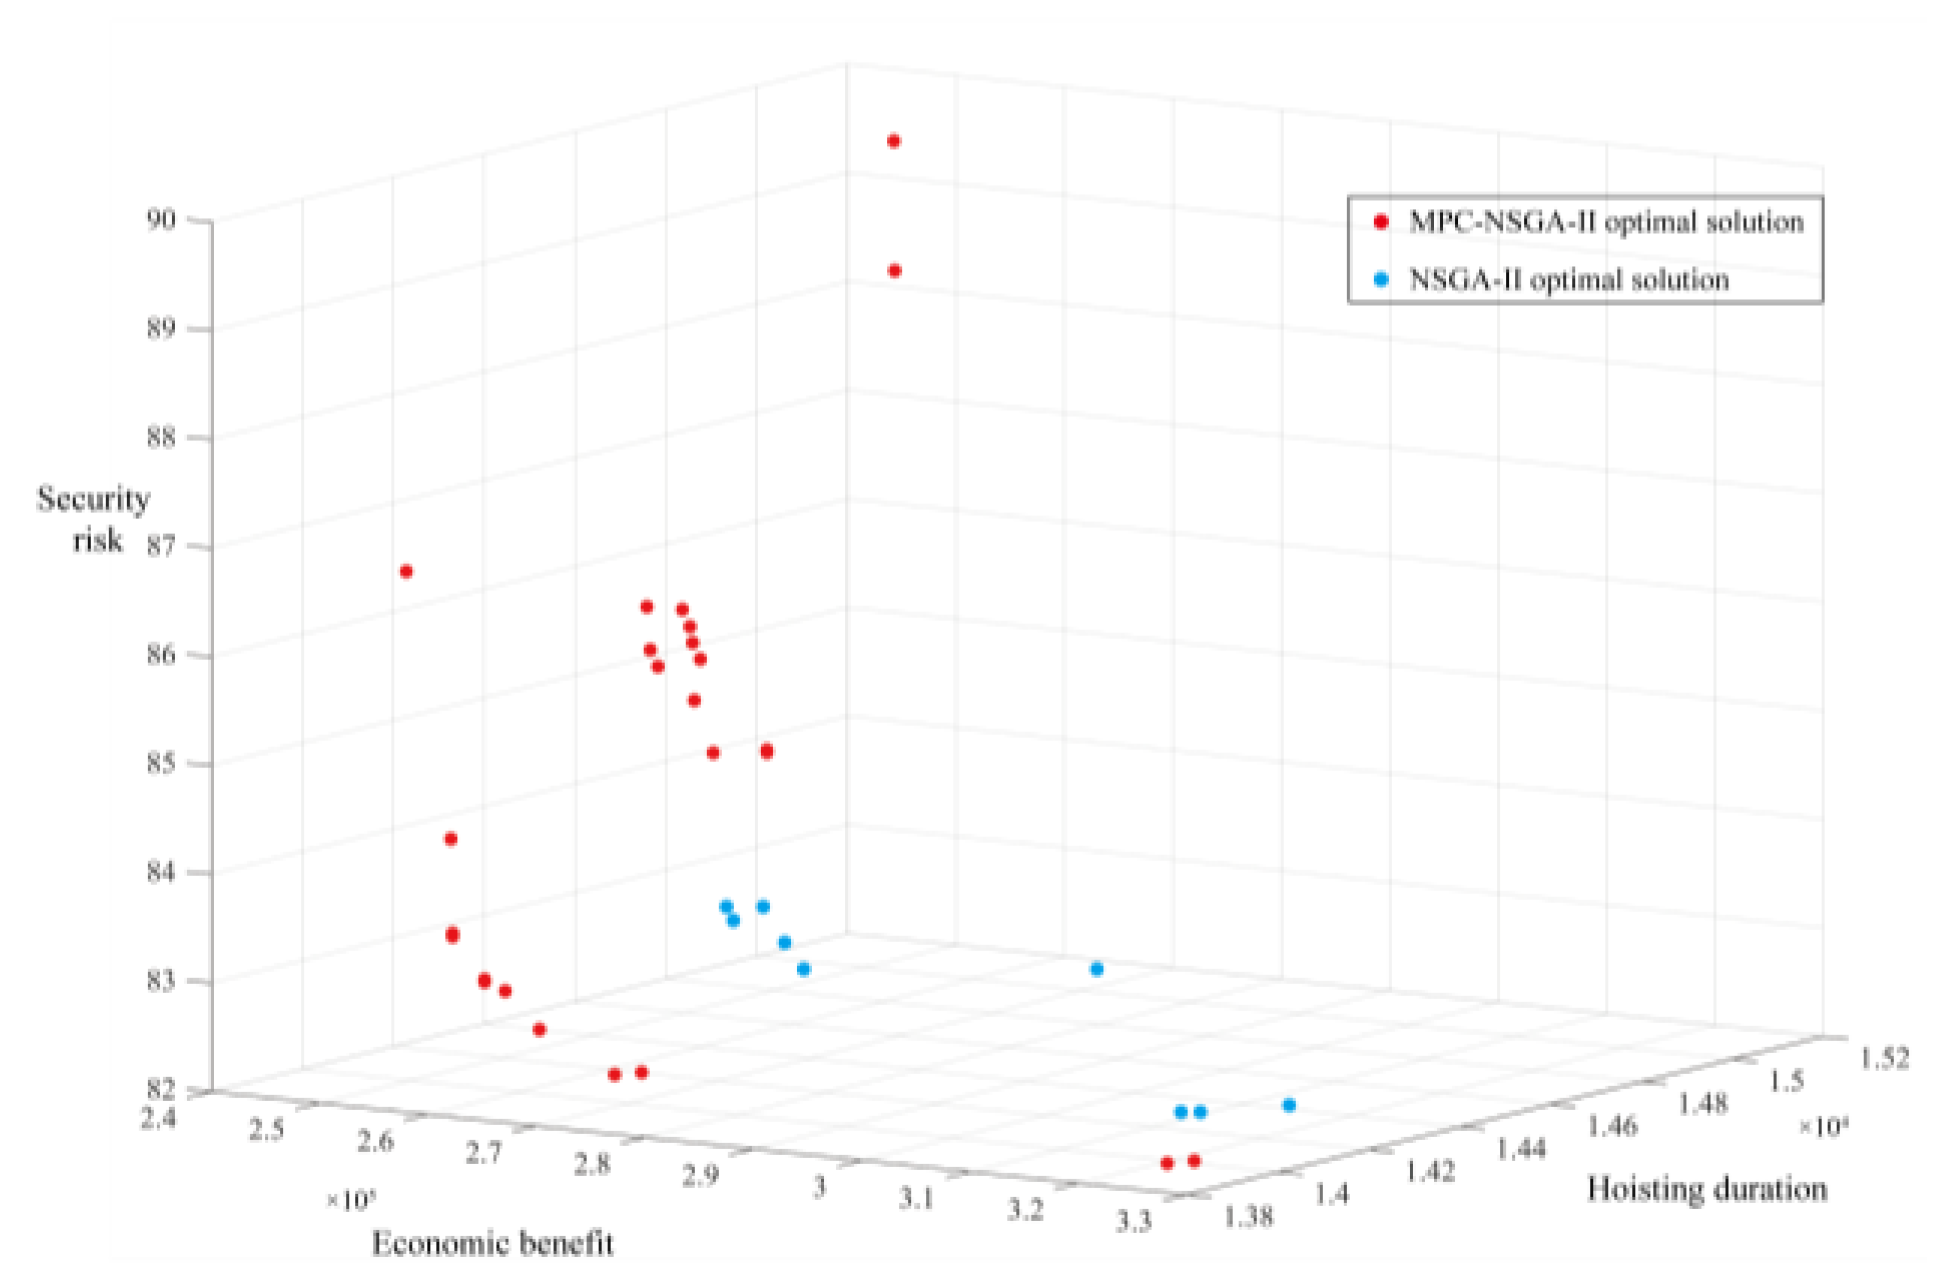
To verify the superiority of the MPC-NSGA-II algorithm, the classical NSGA-II algorithm in the field of multi-objective optimization is used as a control experiment. The optimization results of the MPC-NSGA-II algorithm are compared with those of the NSGA-II algorithm in multiple dimensions. To eliminate the influence of chance factors as much as possible, the simulation tests were run 10 times, and the best optimization results were selected for comparison. The test parameters of the NSGA-II algorithm in the test were set as follows: population size N was 300, crossover probability was 0.8, variation probability was 0.1, and the maximum number of iterations was 200 generations.
The test results in Figure 19 show that for this case, the MPC-NSGA-II optimization algorithm is more computationally efficient, the number of Pareto optimal solutions obtained is higher, and the quality is higher. In terms of computational time, the NSGA-II algorithm takes 1702.0 s on average, while the MPC-NSGA-II algorithm takes 421.0 s on average, and its computational time is only 25% of that of the NSGA-II algorithm. In terms of computational results, the number of optimal solutions obtained by the NSGA-II algorithm is 9, and the number of optimal solutions obtained by the MPC-NSGA-II algorithm is 23. In terms of computational quality, the optimal solutions obtained by the MPC-NSGA-II algorithm dominate the optimal solutions obtained by the NSGA-II algorithm. Therefore, the MPC-NSGA-II optimization algorithm obtains more and better solutions with higher computational efficiency.

5. Conclusions

This study proposes that the MPC-NSGA-II algorithm applies to multi-constraint and multi-objective optimization problems based on the basis and general principles of layout on the CSPB. The main results of this study are as follows.
(1) The construction site and temporary facilities assumptions for the CSPB were determined by literature analysis. It is found that the grid method assumption of the construction site and the AGSM for temporary facilities are more suitable for CSPB analysis. With a large workload of hoisting work on the CSPB, the tower crane coverage constraint, site boundary constraint, and facility coverage constraint should be taken as constraints on the CSPB. Influencing factors of temporary facilities layout on the CSPB were screened out by literature analysis. The expert scoring method ranked the degree of importance of the influencing factors. Ten factors to be included in the model were finally identified and incorporated into the method of layout planning on the CSPB in different ways.
(2) The multi-objective optimization functions of CSPB were determined, and the quantitative formulas were proposed. Combined with the characteristics of CSPB, the Security risk function was quantified by the hazard interaction matrix and the vulnerability interaction matrix; the Economic benefits function was quantified by the systematic layout planning method; the Hoisting duration function was quantified by decomposing the hoisting process and calculating the horizontal and vertical running time respectively.
(3) The MPC-NSGA-II algorithm for multi-constraint and multi-objective optimization problems was proposed. It effectively improved the NSGA-II algorithm with disadvantages such as premature maturity and computational inefficiency. By introducing multiple swarm strategies, the global search and local search capabilities of the algorithm were taken into account, thus expanding the search range. Meanwhile, introducing elite populations avoided the loss of optimal solutions and improved the stability of the optimal solution set. The migration operator promoted collaborative communication among populations, sped up the elimination of inferior individual solutions, and improved the computational efficiency of the algorithm. Adopting the constraint domination method reduced the interference of the considered parameters. Harmonic distance improved the distribution of feasible solutions and sets and increased the efficiency of the algorithm.
(4) The multi-objective optimization and decision-making model of temporary facilities arrangement on the CSPB was established. The MPC-NSGA-II algorithm combined the entropy weight-TOPSIS decision-making method to output the best temporary facility arrangement scheme based on a practical case. The BIMMAKE 2022 established a visualized 3D construction site temporary facilities layout to verify the rationality of the best scheme and the theoretical model.
(5) The practical case verified the superiority of the MPC-NSGA-II algorithm and the theoretical model. The results of the MPC-NSGA-II and NSGA-II algorithms were compared in multiple dimensions. It was found that the MPC-NSGA-II algorithm has 3 times higher computational efficiency, 1.6 times higher number of optimal solutions, and higher quality of optimal solutions.
(6) There are also areas for improvement in this study. Only stationary tower cranes on the CSPB were considered. Mobile cranes also take on the critical role of transporting components in practical applications. Subsequent studies could consider the impact of each type of transport machinery working in concert with the temporary facility of the CSPL. Meanwhile, only one case was used in this study for validation analysis, and different cases should be used in future studies to demonstrate the model’s generalizability.

Supplementary Materials

The following supporting information can be downloaded at: https://www.mdpi.com/article/10.3390/su15076279/s1, Expert Consultation Form.

Author Contributions

Conceptualization, G.Y. and Y.Y.; methodology, G.Y.; software, R.L.; validation, G.Y., Y.Y. and R.L.; formal analysis, Y.Y.; investigation, R.L.; resources, G.Y.; data curation, R.L.; writing—original draft preparation, R.L. and Y.Y.; writing—review and editing, G.Y., Y.Y. and R.L.; visualization, R.L.; supervision, G.Y.; project administration, G.Y. and R L.; funding acquisition, G.Y. and Y.Y. All authors have read and agreed to the published version of the manuscript.

Funding

This work was funded by the 111 project of the Ministry of Education and the Bureau of Foreign Experts of China (No. B18062) and the National Key R&D Program of the Ministry of Science and Technology (No. 2019YFD1101005-4).

Data Availability Statement

The data presented in this study are available on request from the corresponding author.

Conflicts of Interest

The authors declare no conflict of interest.

References

  1. Ogunmakinde, O.E.; Egbelakin, T.; Sher, W. Contributions of the circular economy to the UN sustainable development goals through sustainable construction. Resour. Conserv. Recycl. 2022, 178, 106023. [Google Scholar] [CrossRef]
  2. Guo, Z.; Li, L. A Conceptual Framework for Collaborative Development of Intelligent Construction and Building Industrialization. Front. Environ. Sci. 2022, 10, 802. [Google Scholar] [CrossRef]
  3. Xie, L.; Chen, Y.; Chang, R. Scheduling Optimization of Prefabricated Construction Projects by Genetic Algorithm. Appl. Sci. 2021, 11, 5531. [Google Scholar] [CrossRef]
  4. Yang, B.; Fang, T.; Luo, X.; Liu, B.; Dong, M. A BIM-Based Approach to Automated Prefabricated Building Construction Site Layout Planning. Ksce J. Civ. Eng. 2022, 26, 1535–1552. [Google Scholar] [CrossRef]
  5. Lu, Y.; Zhu, Y. Integrating Hoisting Efficiency into Construction Site Layout Plan Model for Prefabricated Construction. J. Constr. Eng. Manag. 2021, 147, 04021130. [Google Scholar] [CrossRef]
  6. Yi, W.; Wang, S.; Zhang, A. Optimal transportation planning for prefabricated products in construction. Comput.-Aided Civ. Infrastruct. Eng. 2020, 35, 342–353. [Google Scholar] [CrossRef]
  7. Yuan, Z.; Zhang, Z.; Ni, G.; Chen, C.; Wang, W.; Hong, J. Cause Analysis of Hindering On-Site Lean Construction for Prefabricated Buildings and Corresponding Organizational Capability Evaluation. Adv. Civ. Eng. 2020, 2020, 8876102. [Google Scholar] [CrossRef]
  8. Huang, C.; Wong, C.K. Optimisation of site layout planning for multiple construction stages with safety considerations and requirements. Autom. Constr. 2015, 53, 58–68. [Google Scholar] [CrossRef]
  9. RazaviAlavi, S.; AbouRizk, S. Site Layout and Construction Plan Optimization Using an Integrated Genetic Algorithm Simulation Framework. J. Comput. Civ. Eng. 2017, 31, 04017011. [Google Scholar] [CrossRef]
  10. Kaveh, A.; Vazirinia, Y. Construction Site Layout Planning Problem Using Metaheuristic Algorithms: A Comparative Study. Iran. J. Sci. Technol. Trans. Civ. Eng. 2019, 43, 105–115. [Google Scholar] [CrossRef]
  11. RazaviAlavi, S.; AbouRizk, S. Construction Site Layout Planning Using a Simulation-Based Decision Support Tool. Logistics 2021, 5, 65. [Google Scholar] [CrossRef]
  12. Duhbaci, T.B.; Ozel, S.; Bulkan, S. Water and energy minimization in industrial processes through mathematical programming: A literature review. J. Clean. Prod. 2021, 284, 124752. [Google Scholar] [CrossRef]
  13. Slivkoff, S.; Gallant, J.L. Design of complex neuroscience experiments using mixed-integer linear programming. Neuron 2021, 109, 1433–1448. [Google Scholar] [CrossRef] [PubMed]
  14. Hamza, M.F.; Yap, H.J.; Choudhury, I.A. Recent advances on the use of meta-heuristic optimization algorithms to optimize the type-2 fuzzy logic systems in intelligent control. Neural Comput. Appl. 2017, 28, 979–999. [Google Scholar] [CrossRef]
  15. Halim, A.H.; Ismail, I. Combinatorial Optimization: Comparison of Heuristic Algorithms in Travelling Salesman Problem. Arch. Comput. Methods Eng. 2019, 26, 367–380. [Google Scholar] [CrossRef]
  16. Ozdemir, G.; Karaboga, N. A review on the cosine modulated filter bank studies using meta-heuristic optimization algorithms. Artif. Intell. Rev. 2019, 52, 1629–1653. [Google Scholar] [CrossRef]
  17. De Santis, M.; Grani, G.; Palagi, L. Branching with hyperplanes in the criterion space: The frontier partitioner algorithm for biobjective integer programming. Eur. J. Oper. Res. 2020, 283, 57–69. [Google Scholar] [CrossRef] [Green Version]
  18. Aydemir, E.; Yilmaz, G.; Oruc, K.O. A grey production planning model on a ready-mixed concrete plant. Eng. Optim. 2020, 52, 817–831. [Google Scholar] [CrossRef]
  19. Hammad, A.W.A.; Rey, D.; Akbarnezhad, A. A cutting plane algorithm for the site layout planning problem with travel barriers. Comput. Oper. Res. 2017, 82, 36–51. [Google Scholar] [CrossRef]
  20. Hammad, A.W.A.; Akbarnezhad, A.; Rey, D. A multi-objective mixed integer nonlinear programming model for construction site layout planning to minimise noise pollution and transport costs. Autom. Constr. 2016, 61, 73–85. [Google Scholar] [CrossRef]
  21. Aussel, D.; Svensson, A. Is Pessimistic Bilevel Programming a Special Case of a Mathematical Program with Complementarity Constraints? J. Optim. Theory Appl. 2019, 181, 504–520. [Google Scholar] [CrossRef]
  22. Katoch, S.; Chauhan, S.S.; Kumar, V. A review on genetic algorithm: Past, present, and future. Multimed. Tools Appl. 2021, 80, 8091–8126. [Google Scholar] [CrossRef]
  23. Farmakis, P.M.; Chassiakos, A.P. Genetic algorithm optimization for dynamic construction site layout planning. Organ. Technol. Manag. Constr. 2018, 10, 1655–1664. [Google Scholar] [CrossRef] [Green Version]
  24. Zhu, H.; Hu, Y.; Zhu, W. A dynamic adaptive particle swarm optimization and genetic algorithm for different constrained engineering design optimization problems. Adv. Mech. Eng. 2019, 11, 1–27. [Google Scholar] [CrossRef]
  25. Zouein, P.P.; Kattan, S. An improved construction approach using ant colony optimization for solving the dynamic facility layout problem. J. Oper. Res. Soc. 2022, 73, 1517–1531. [Google Scholar] [CrossRef]
  26. Li, J.; Yang, B.; Zhang, D.; Zhou, Q.; Li, L. Development of a multi-objective scheduling system for offshore projects based on hybrid non-dominated sorting genetic algorithm. Adv. Mech. Eng. 2015, 7, 17. [Google Scholar] [CrossRef] [Green Version]
  27. Zhao, Y.; Lu, J.; Yan, Q.; Lai, L.; Xu, L. Research on Cell Manufacturing Facility Layout Problem Based on Improved NSGA-II. Cmc-Comput. Mater. Contin. 2020, 62, 355–364. [Google Scholar] [CrossRef]
  28. Elarbi, M.; Bechikh, S.; Gupta, A.; Ben Said, L.; Ong, Y.-S. A New Decomposition-Based NSGA-II for Many-Objective Optimization. IEEE Trans. Syst. Man Cybern.-Syst. 2018, 48, 1191–1210. [Google Scholar] [CrossRef]
  29. Chen, G.; Qiu, S.; Zhang, Z.; Sun, Z.; Liao, H. Optimal Power Flow Using Gbest-Guided Cuckoo Search Algorithm with Feedback Control Strategy and Constraint Domination Rule. Math. Probl. Eng. 2017, 2017, 14. [Google Scholar] [CrossRef]
  30. Xu, M.; Mei, Z.; Luo, S.; Tan, Y. Optimization algorithms for construction site layout planning: A systematic literature review. Eng. Constr. Archit. Manag. 2020, 27, 1913–1938. [Google Scholar] [CrossRef]
  31. Hawarneh, A.A.; Bendak, S.; Ghanim, F. Construction site layout planning problem: Past, present and future. Expert Syst. Appl. 2021, 168, 114247. [Google Scholar] [CrossRef]
  32. Li, Z.; Shen, W.; Xu, J.; Lev, B. Bilevel and multi-objective dynamic construction site layout and security planning. Autom. Constr. 2015, 57, 1–16. [Google Scholar] [CrossRef]
  33. Al Hawarneh, A.; Bendak, S.; Ghanim, F. Dynamic facilities planning model for large scale construction projects. Autom. Constr. 2019, 98, 72–89. [Google Scholar] [CrossRef]
  34. Ning, X.; Qi, J.; Wu, C.; Wang, W. A tri-objective ant colony optimization based model for planning safe construction site layout. Autom. Constr. 2018, 89, 1–12. [Google Scholar] [CrossRef]
  35. Sanad, H.M.; Ammar, M.A.; Ibrahim, M.E. Optimal construction site layout considering safety and environmental aspects. J. Constr. Eng. Manag. Asce 2008, 134, 536–544. [Google Scholar] [CrossRef]
  36. Tanner-Smith, E.E.; Tipton, E. Robust variance estimation with dependent effect sizes: Practical considerations including a software tutorial in Stata and SPSS. Res. Synth. Methods 2014, 5, 13–30. [Google Scholar] [CrossRef]
  37. Abune’meh, M.; El Meouche, R.; Hijaze, I.; Mebarki, A.; Shahrour, I. Optimal construction site layout based on risk spatial variability. Autom. Constr. 2016, 70, 167–177. [Google Scholar] [CrossRef]
  38. Ning, X.; Qi, J.; Wu, C.; Wang, W. Reducing noise pollution by planning construction site layout via a multi-objective optimization model. J. Clean. Prod. 2019, 222, 218–230. [Google Scholar] [CrossRef]
  39. Deb, K.; Pratap, A.; Agarwal, S.; Meyarivan, T. A fast and elitist multiobjective genetic algorithm: NSGA-II. IEEE Trans. Evol. Comput. 2002, 6, 182–197. [Google Scholar] [CrossRef] [Green Version]
  40. Amaran, S.; Sahinidis, N.V.; Sharda, B.; Bury, S.J. Simulation optimization: A review of algorithms and applications. 4OR Q. J. Oper. Res. 2014, 12, 301–333. [Google Scholar] [CrossRef]
  41. Markechova, D.; Riecan, B. Entropy of Fuzzy Partitions and Entropy of Fuzzy Dynamical Systems. Entropy 2016, 18, 19. [Google Scholar] [CrossRef] [Green Version]
  42. Mirzanejad, M.; Ebrahimi, M.; Vamplew, P.; Veisi, H. An online scalarization multi-objective reinforcement learning algorithm: TOPSIS Q-learning. Knowl. Eng. Rev. 2022, 37, e7. [Google Scholar] [CrossRef]
  43. Oral, M.; Bazaati, S.; Aydinli, S.; Oral, E. Construction Site Layout Planning: Application of Multi-Objective Particle Swarm Optimization. Tek. Dergi 2018, 29, 8691–8713. [Google Scholar] [CrossRef] [Green Version]
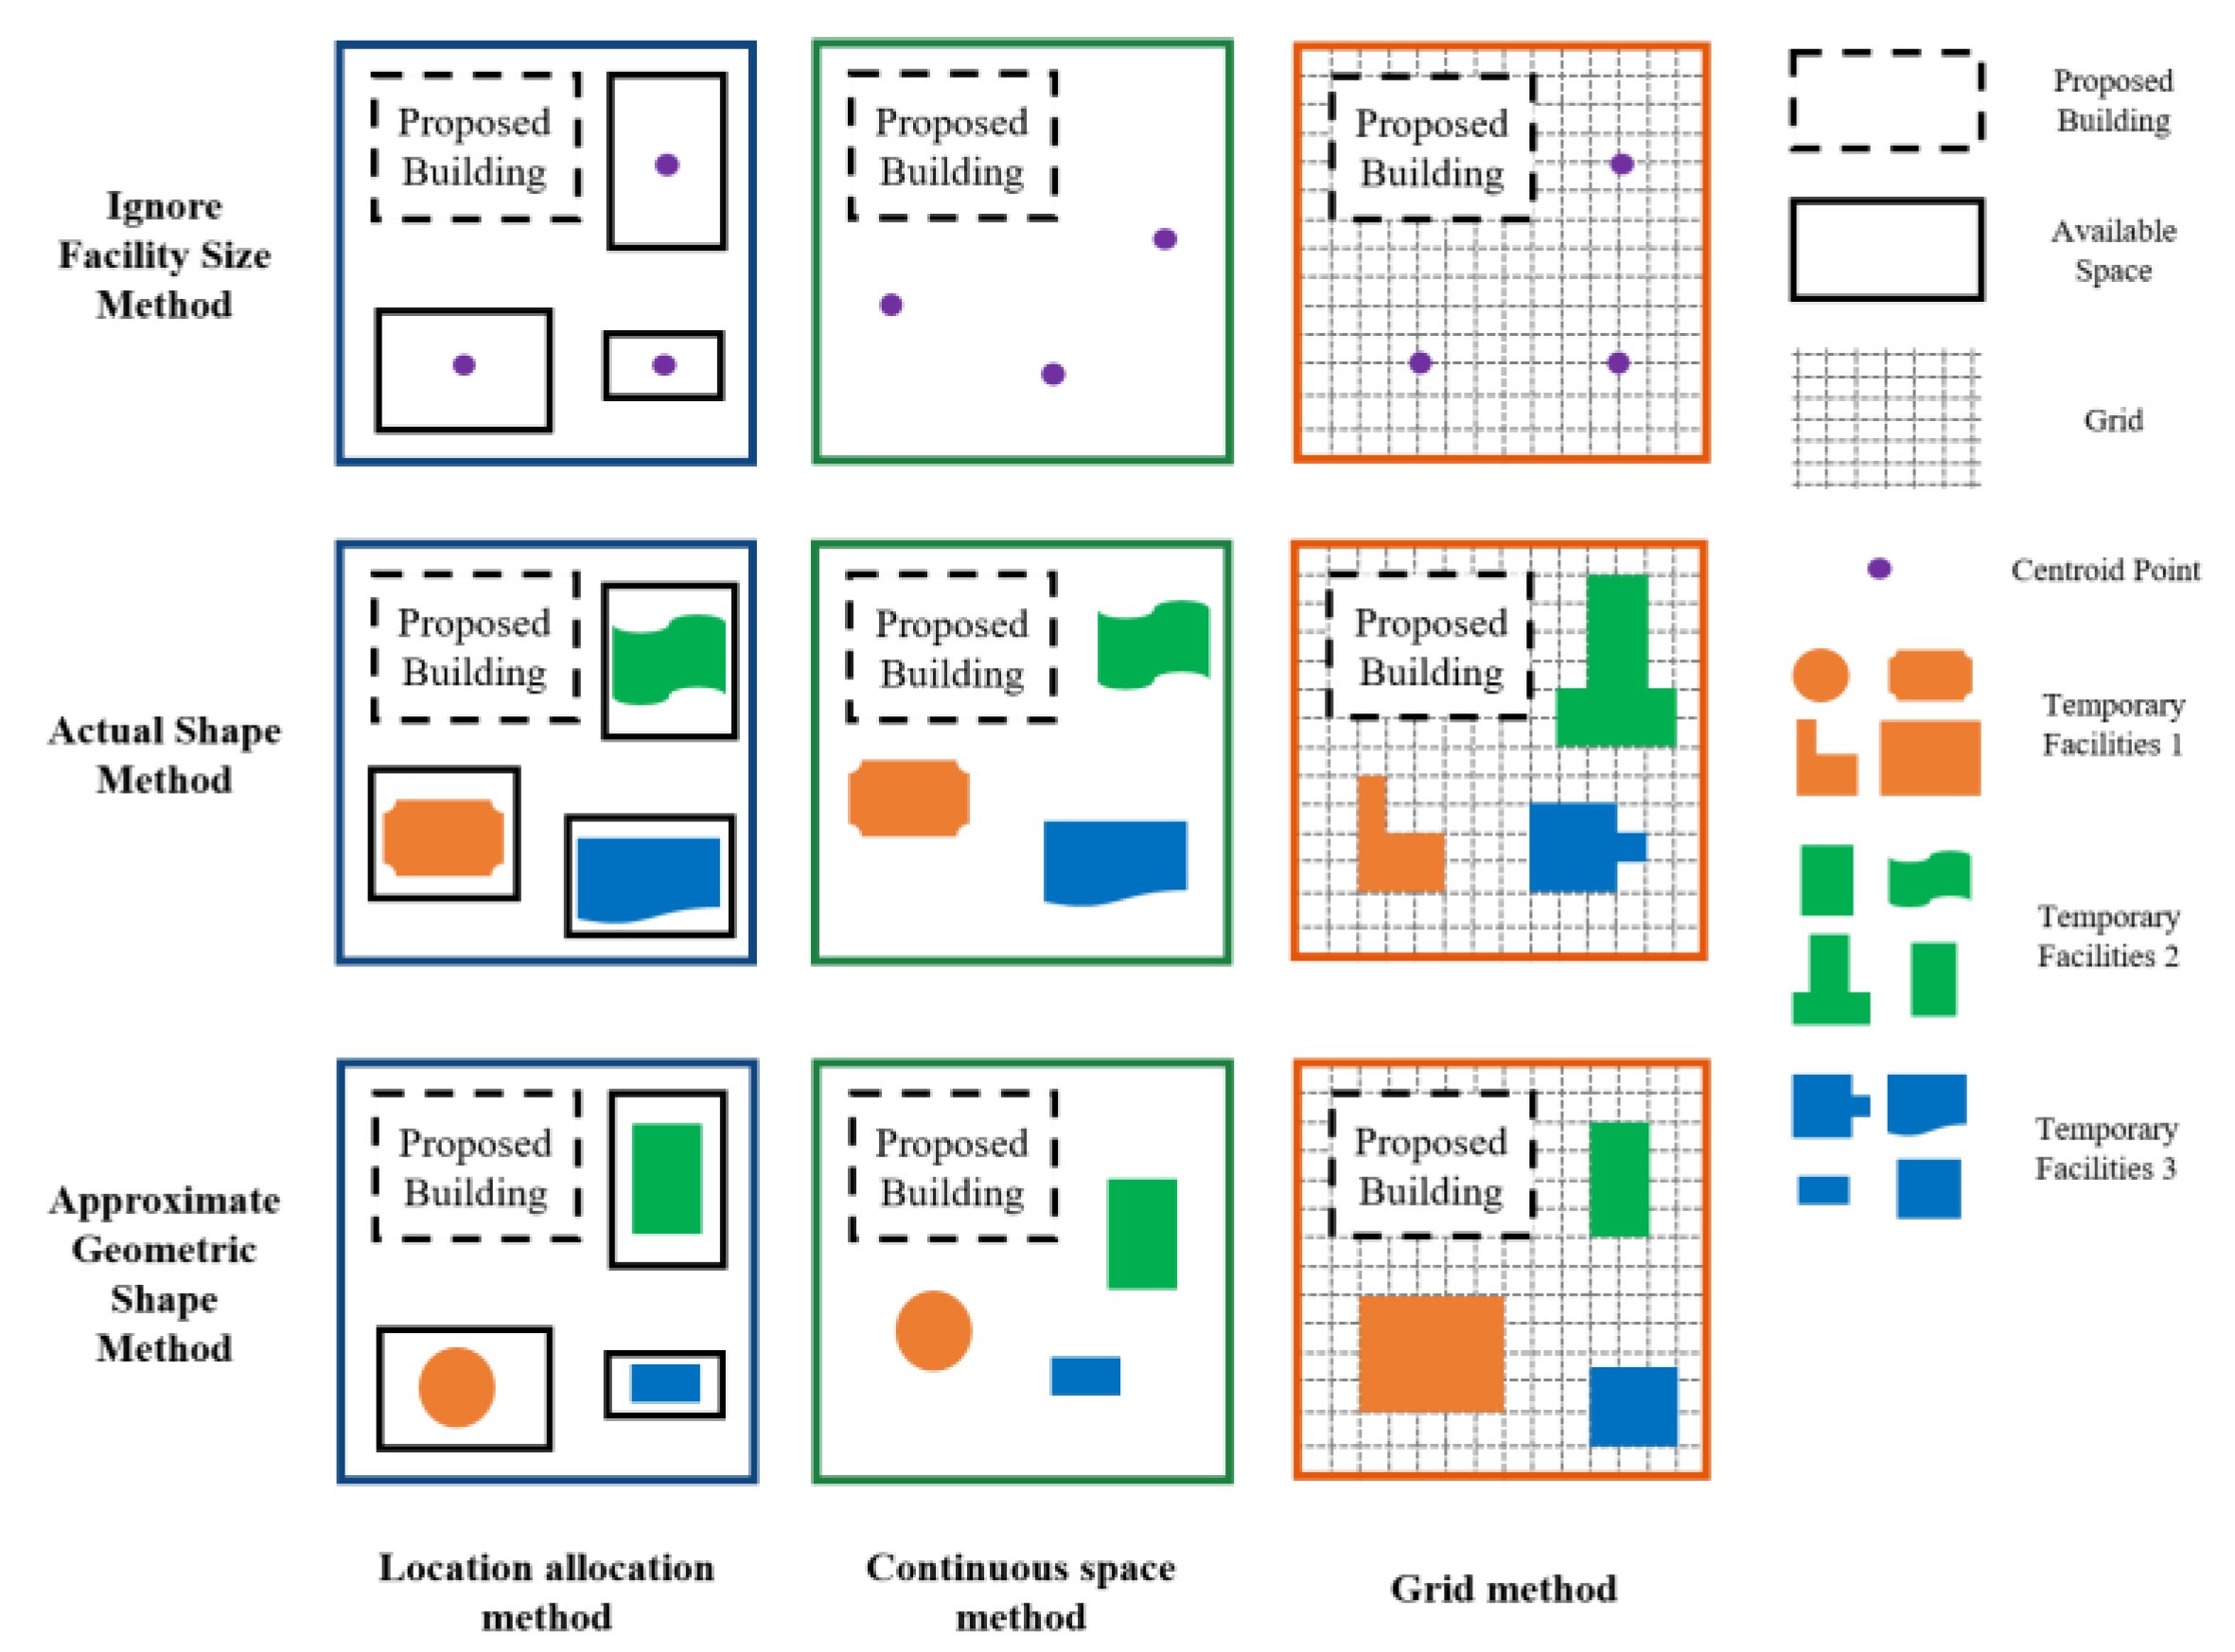
Figure 1. Construction site assumptions and construction site temporary facilities assumptions combination arrangement diagram.
Sustainability 15 06279 g001
Figure 2. Statistical results of expert scores.
Sustainability 15 06279 g002
Figure 3. Risk attenuation curve and Linear fragile function (a) Risk attenuation curve; (b) Linear fragile function.
Sustainability 15 06279 g003
Figure 4. Schematic diagram of tower crane hoisting. (a) Tower crane hoisting front view; (b) Tower crane hoisting overhead view.
Sustainability 15 06279 g004
Figure 5. Elite population formation process.
Sustainability 15 06279 g005
Figure 6. Working principle of the immigration operator.
Sustainability 15 06279 g006
Figure 7. Algorithm flow chart of MPC-NSGA-II.
Sustainability 15 06279 g007
Figure 8. BIM model of the building.
Sustainability 15 06279 g008
Figure 9. Initial construction site of the project.
Sustainability 15 06279 g009
Figure 10. Multi-objective optimization and decision-making model structure of temporary facilities arrangement on the CSPB.
Sustainability 15 06279 g010
Figure 11. Schematic diagram of population crossing.
Sustainability 15 06279 g011
Figure 12. Simplified initial construction layout drawing.
Sustainability 15 06279 g012
Figure 13. The layout of prefabricated components on the construction site.
Sustainability 15 06279 g013
Figure 14. Logistics intensity classification.
Sustainability 15 06279 g014
Figure 15. Division of construction section.
Sustainability 15 06279 g015
Figure 16. MPC-NSGA-II model iteration results.
Sustainability 15 06279 g016
Figure 17. Schematic diagram of four Pareto optimal solution layout schemes. (a) Scheme 1; (b) Scheme 2; (c) Scheme 5; (d) Scheme 9.
Sustainability 15 06279 g017
Figure 18. The layout of prefabricated components on the construction site.
Sustainability 15 06279 g018
Figure 19. Comparison of results of two algorithms.
Sustainability 15 06279 g019
Table 1. Number and source of experts.
InstitutionNumber of PeoplePercentage
Construction enterprise1648.5%
College and universities824.2%
Design institute927.3%
Total33100%
Table 2. Dimensions and coordinates of fixed facilities.
NumberFacility NameCoordinatesSize (Unit: m)
B11 # Teaching building(60, 75)40 × 20
B22 # Teaching building(25, 35)40 × 20
O1Tower crane(50, 50)2 × 2
O2Construction Road 1(47.5, 7.5)75 × 5
O3Construction Road 2(7.5, 45)5 × 90
O4Construction Road 3(47.5, 92.5)75 × 5
O5Construction Road 4(87.5, 45)5 × 90
O6South gate(55, 0)——
O7East gate(105, 50)——
Table 3. Summary of parameters of prefabricated components on the second floor.
NameSize (mm)Number per Layer
DBS-67-33183120 × 180054
DBS-67-42184020 × 180018
SAT-39-253660 × 11804
Table 4. Temporary facilities information.
Facilities NumberFacility NameSize (Unit: m × m )Facilities Properties
F1Precast component yard17.5 × 12.5Non-fixation
F2Steel processing shed15 × 4Non-fixation
F3Steelyard15 × 4Non-fixation
F4Woodworking processing shed5 × 10Non-fixation
F5Woodworking yard4 × 10Non-fixation
F6Construction waste yard10 × 5Non-fixation
F7Small warehouse8 × 5Non-fixation
F8Dormitories5 × 30Non-fixation
F9Office building4 × 30Non-fixation
Table 5. Hazard scale division of temporary facilities.
Temporary FacilityB1B2O1F1F2F3F4F5F6F7F8F9
Hazard scale224333332411
Table 6. The fitness value of the Pareto optimal solution set.
Serial NumberEconomic BenefitSecurity RiskHoisting DurationSerial NumberEconomic BenefitSecurity RiskHoisting Duration
1269,24582.8513,824.4813261,06684.5213,824.48
2266,08383.1813,824.4814276,17682.5113,824.48
3253,83984.4614,574.4415276,14582.4713,884.65
4251,44385.2914,509.6716246,25789.4015,152.66
5250,74085.4414,509.6717246,33288.2115,152.66
6248,97785.5014,639.0318259,52484.5614,556.61
7254,80485.0214,509.6719259,53484.5414,556.61
8247,71185.7414,574.4420264,18383.2413,824.48
9256,96386.9413,824.4821264,17883.2613,824.48
10255,99085.5914,477.6522261,23283.6313,824.48
11248,27485.6514,639.0323261,23183.6613,824.48
12256,69385.4514,477.65
Table 7. Four Pareto optimal solution layout schemes.
SchemeCoordinateF1F2F3F4F5F6F7F8F9
1x657070565149679797
y522834282841412770
2x657272544778659898
y523439383827283070
5x247373505672609898
y684651292930407127
9x655454302546619997
y522520727241337030
Table 8. Entropy weight-TOPSIS evaluation calculation results.
Evaluation ObjectIdeal Solution DistanceAnti-Ideal Solution Distance Ideal   Proximity   C Ranking
Scheme 10.18360.04710.20433
Scheme 20.22630.01070.04534
Scheme 50.00980.22500.95831
Scheme 90.04780.18290.79272
Disclaimer/Publisher’s Note: The statements, opinions and data contained in all publications are solely those of the individual author(s) and contributor(s) and not of MDPI and/or the editor(s). MDPI and/or the editor(s) disclaim responsibility for any injury to people or property resulting from any ideas, methods, instructions or products referred to in the content.