
In Silico Investigation of the Impact of Reaction Kinetics on the Physico-Mechanical Properties of Coconut-Oil-Based Rigid Polyurethane Foam

 , , ,
, , ,  , and
, and 
Abstract
:1. Introduction
Isocyanate Polyol Polyurethane
Simulation Bases

| Assumption/Heuristics |
|---|
|
|
|
|
|
|
|
|
2. Materials and Methods
2.1. Materials
Bio-Based Polyol Character
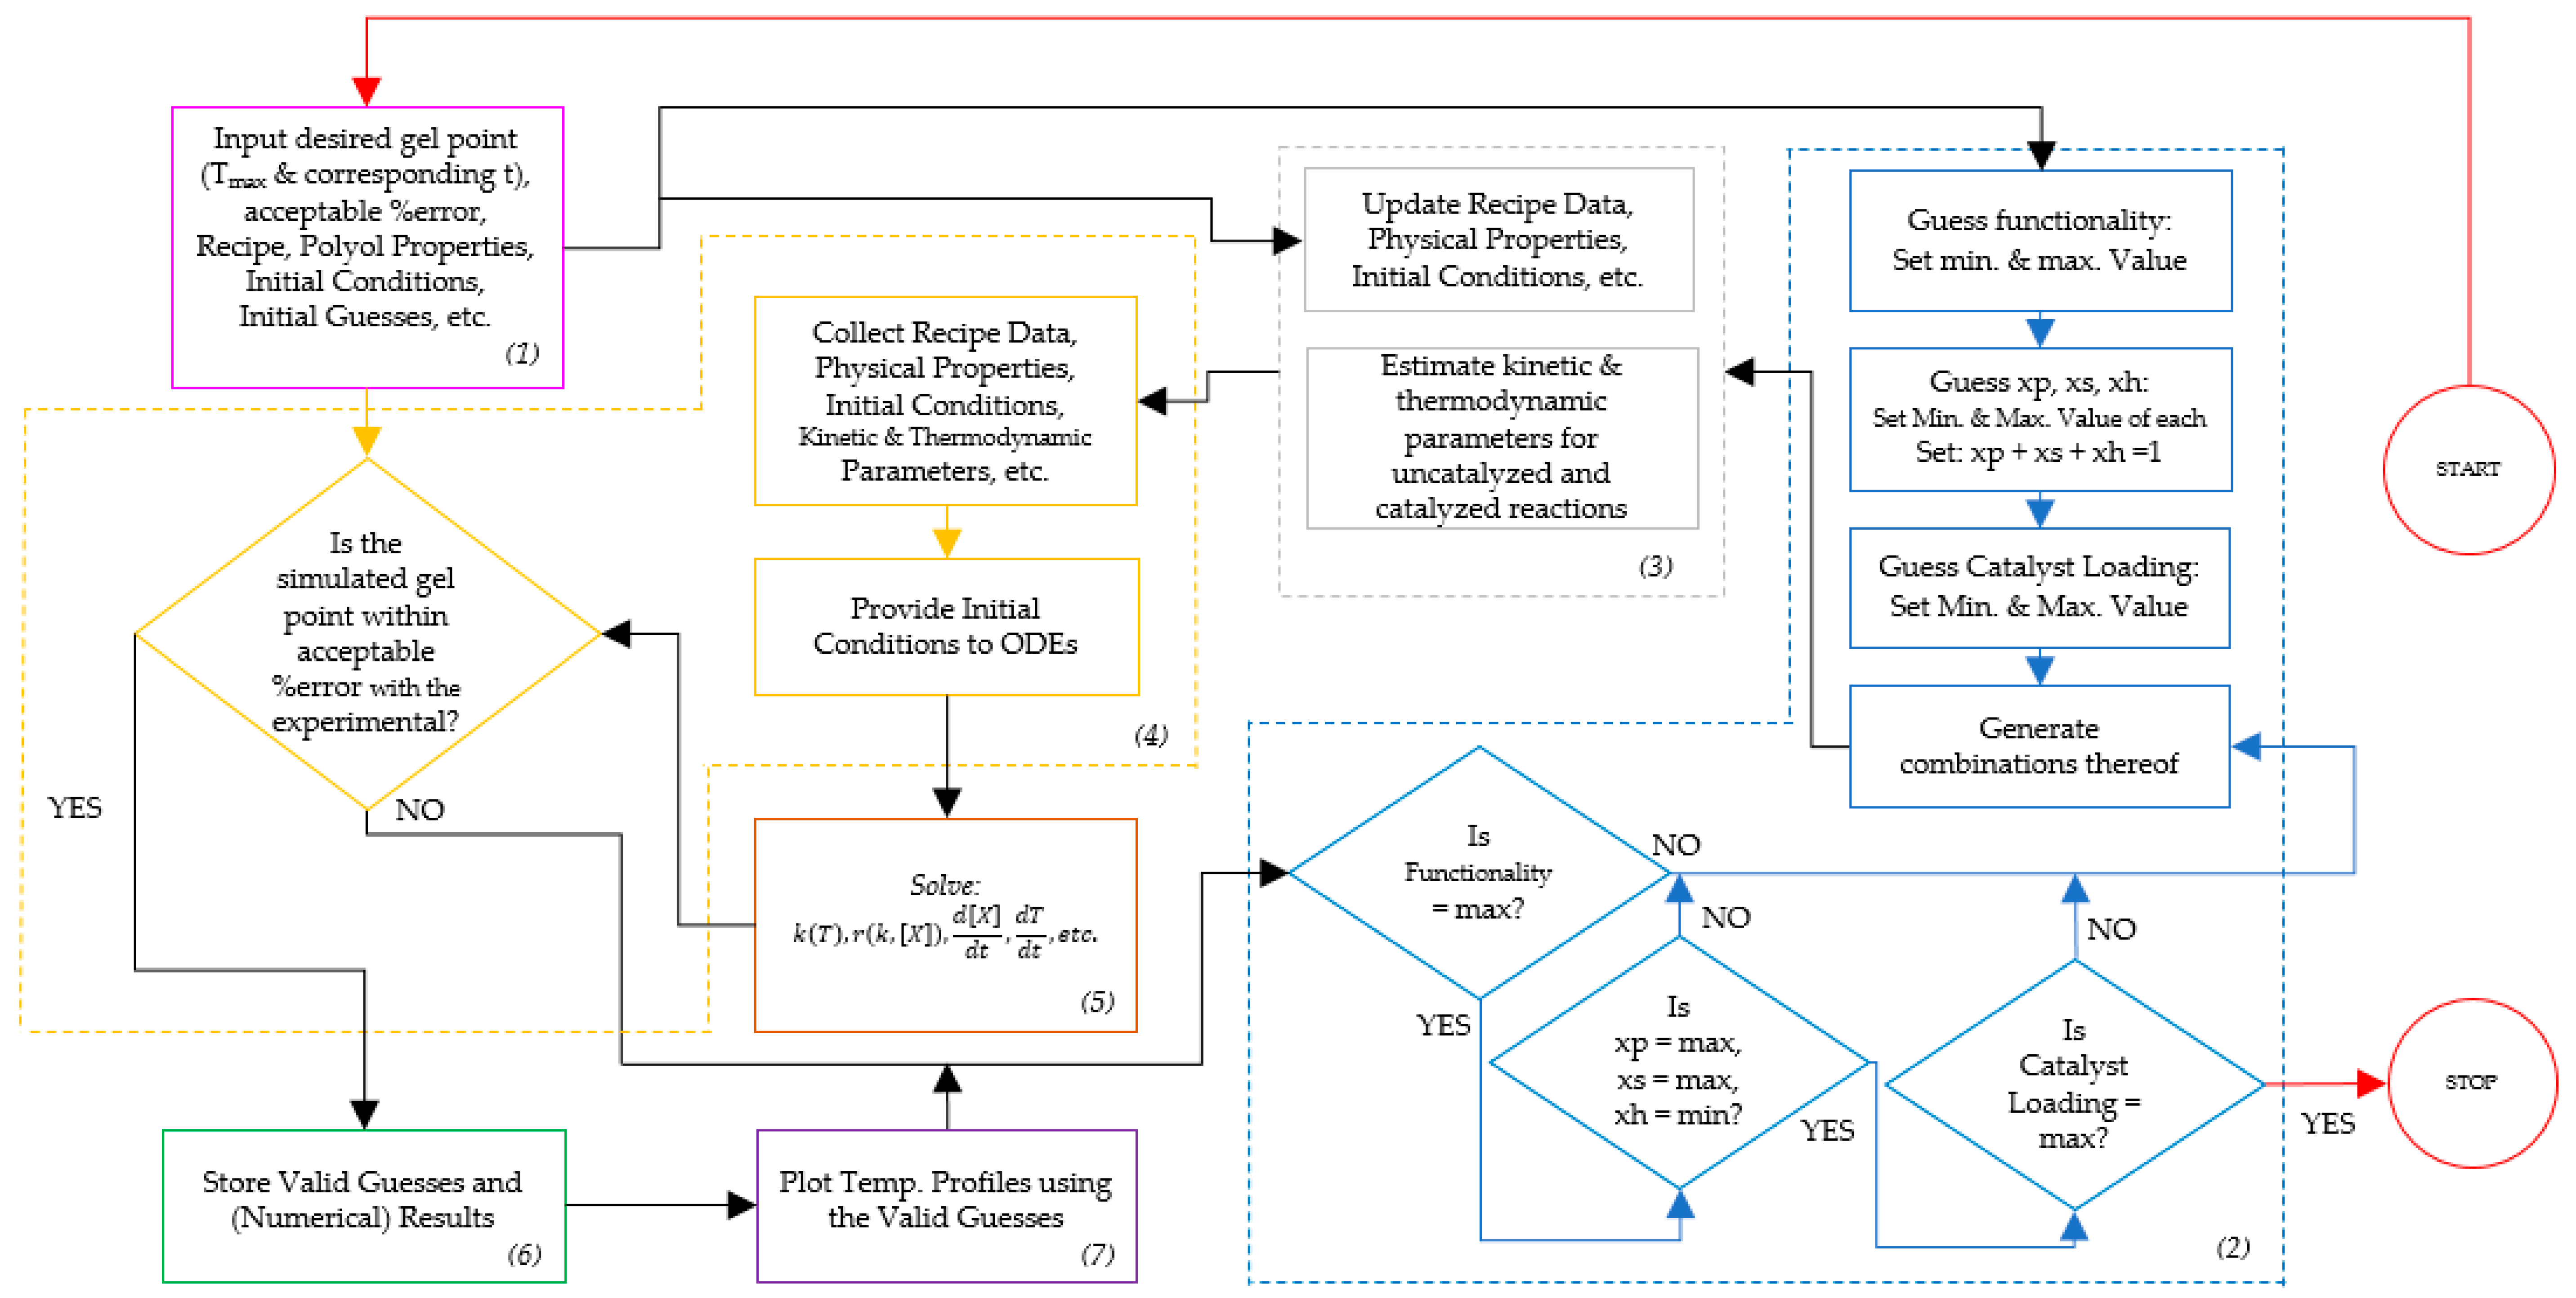
2.2. Simulations and Simulation Approach in Material Design
3. Results and Discussion
3.1. Simulation Results
3.2. Foam Design Using Simulation
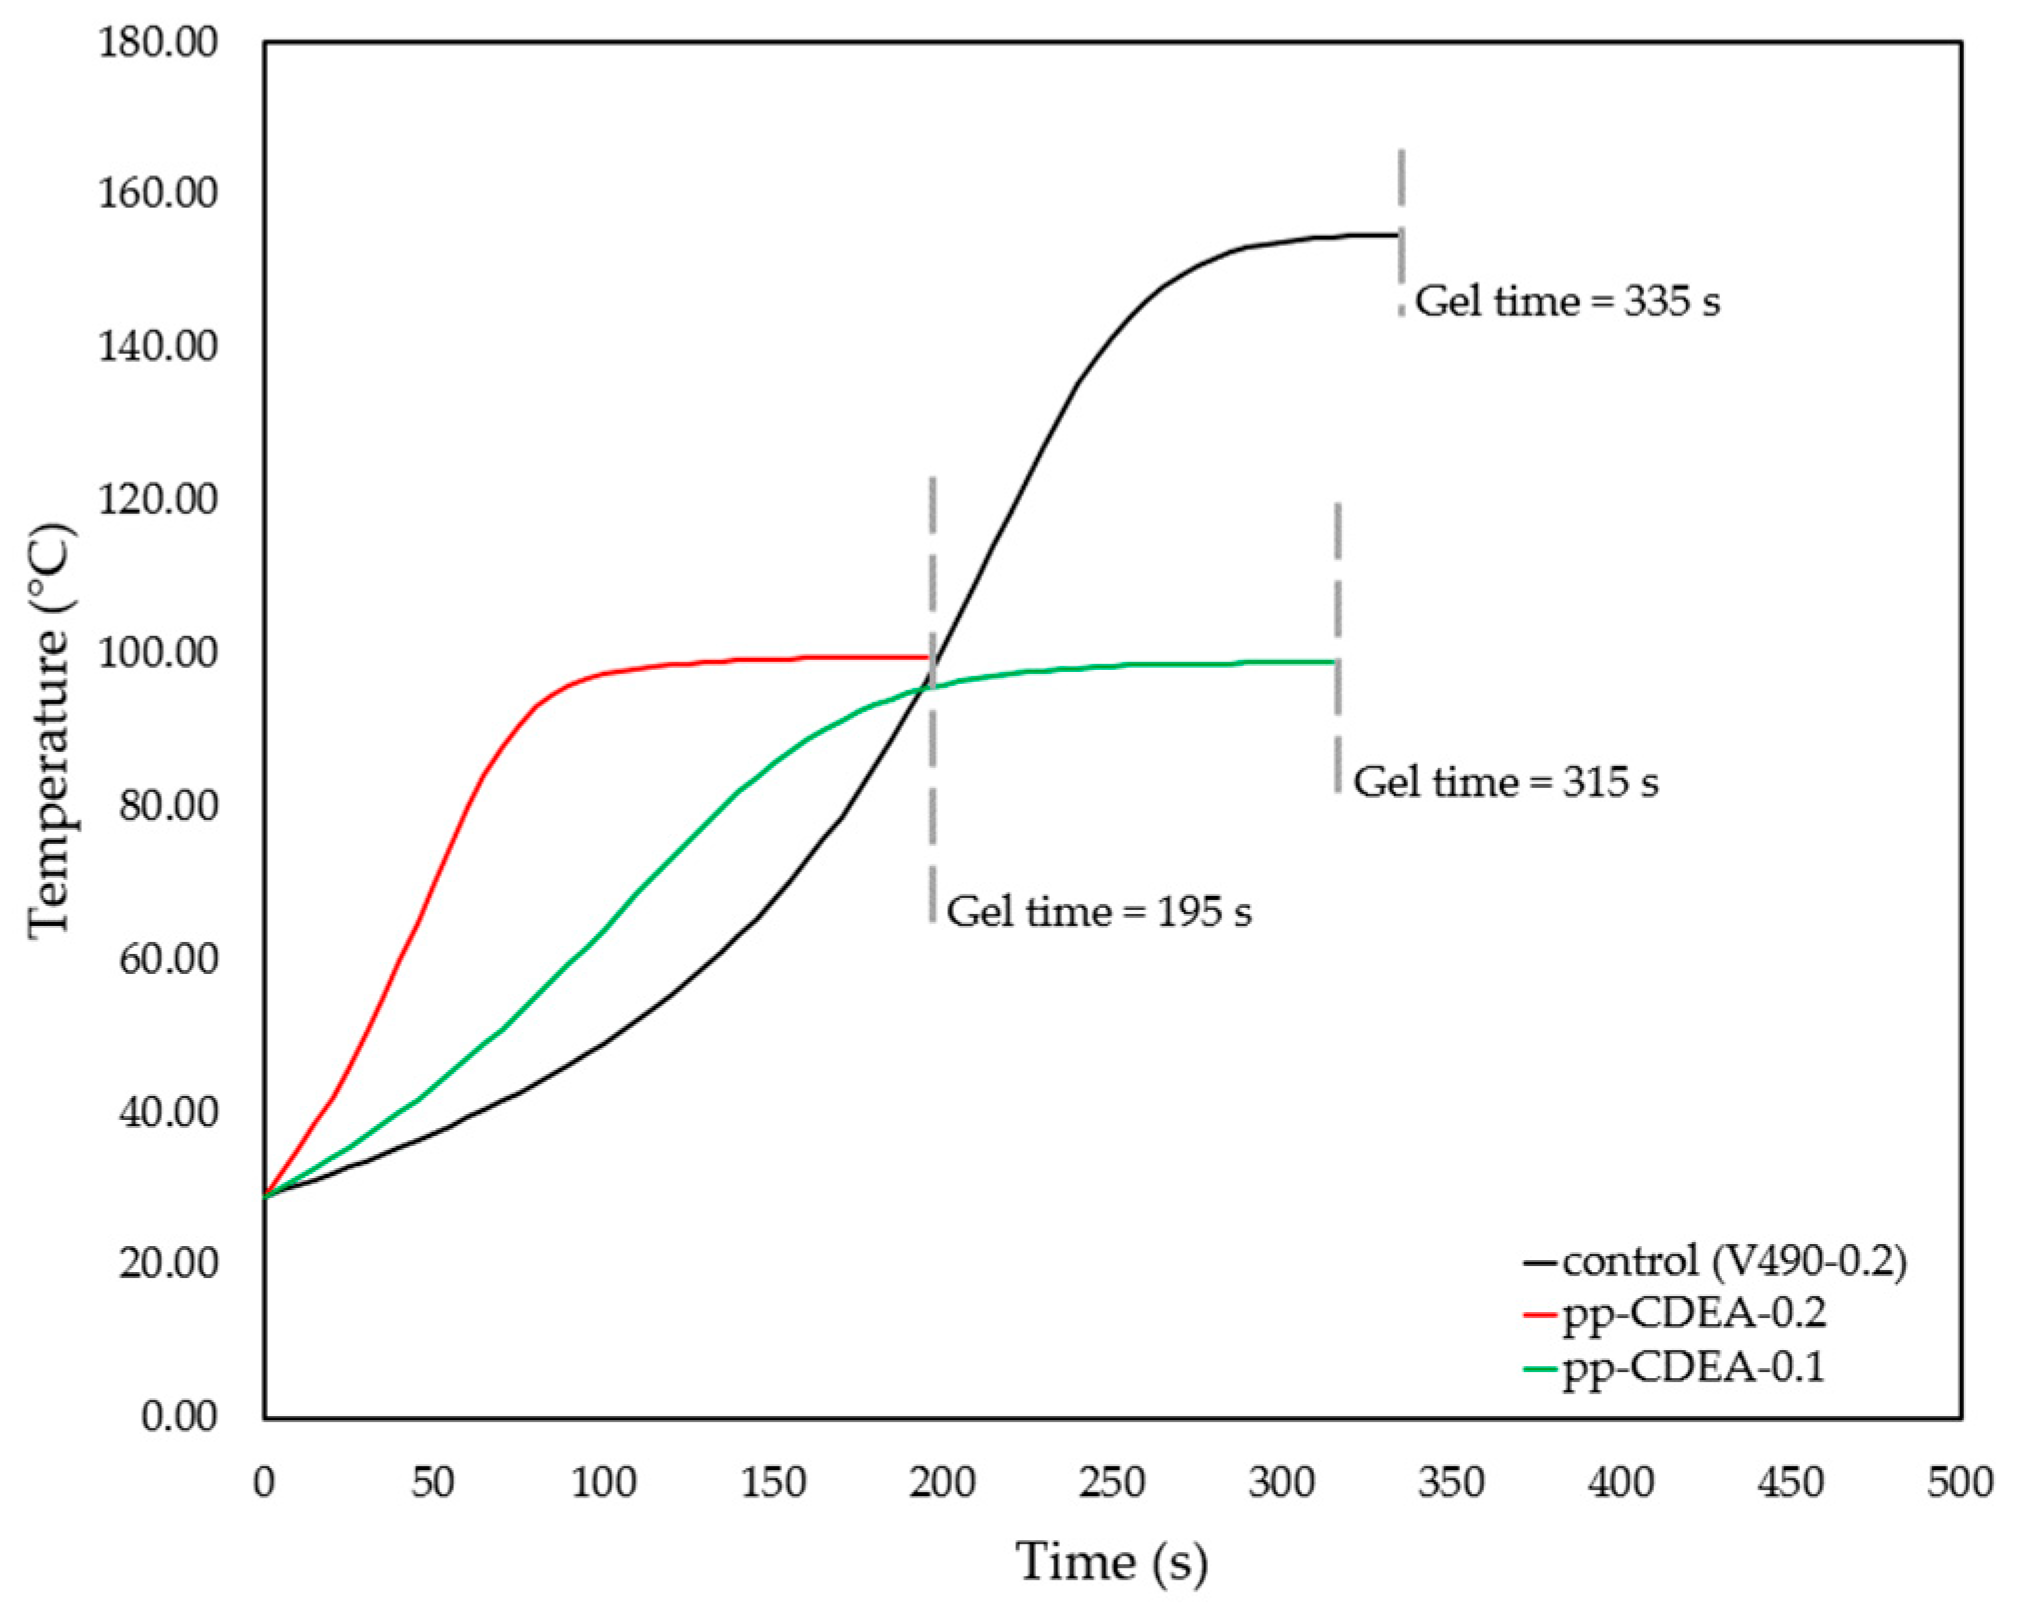
3.3. Gel Time Investigation
4. Conclusions
Author Contributions
Funding
Institutional Review Board Statement
Informed Consent Statement
Data Availability Statement
Acknowledgments
Conflicts of Interest
References
- Zieleniewska, M.; Leszczyński, M.K.; Kurańska, M.; Prociak, A.; Szczepkowski, L.; Krzyżowska, M.; Ryszkowska, J. Preparation and characterisation of rigid polyurethane foams using a rapeseed oil-based polyol. Ind. Crops Prod. 2015, 74, 887–897. [Google Scholar] [CrossRef]
- Krol, P. Synthesis methods, chemical structures and phase structures of linear polyurethanes. Properties and applications of linear polyurethanes in polyurethane elastomers, copolymers and ionomers. Prog. Mater. Sci. 2007, 52, 915–1015. [Google Scholar] [CrossRef]
- Zhao, Y. Modeling and Experimental Study of Polyurethane Foaming Reactions. Doctoral Dissertation, University of Missouri-Columbia, Columbia, MO, USA, 2015. Available online: https://hdl.handle.net/10355/48715 (accessed on 31 November 2022).
- Al-Moameri, H.H. Simulation Aided Analysis and Experimental Study of Polyurethane Polymerization Reaction and Foaming Process. Doctoral Dissertation, University of Missouri-Columbia, Columbia, MO, USA, 2017. Available online: https://hdl.handle.net/10355/61892 (accessed on 31 November 2022).
- Jaf, L. Modeling and Experimental Study of Polyurethane Foaming and Gelling Reactions. Doctoral Dissertation, University of Missouri-Columbia, Columbia, MO, USA, 2018. Available online: https://hdl.handle.net/10355/66081 (accessed on 31 November 2022).
- Rusche, H.; Karimi, M.; Ferkl, P.; Karolius, S. Simulating Polyurethane Foams Using the MoDeNa Multi-Scale Simulation Framework. In OpenFOAM®; Springer Nature AG: Basel, Switzerland, 2019; pp. 401–417. [Google Scholar] [CrossRef]
- Raimbault, C.; Laure, P.; François, G.; Boyer, S.; Vincent, M.; Choquart, F.; Agassant, J.F. Foaming parameter identification of polyurethane using FOAMAT® device. Polym. Eng. Sci. 2021, 61, 1243–1256. [Google Scholar] [CrossRef]
- Wright, H.C.; Cameron, D.D.; Ryan, A.J. FoamPi: An open-source raspberry Pi-based apparatus for monitoring polyurethane foam reactions. HardwareX 2022, 12, e00365. [Google Scholar] [CrossRef] [PubMed]
- Ghoreishi, R.; Zhao, Y.; Suppes, G.J. Reaction modeling of urethane polyols using fraction primary secondary and hindered-secondary hydroxyl content. J. Appl. Polym. Sci. 2014, 131, 40388. [Google Scholar] [CrossRef]
- Zhao, Y.; Zhong, F.; Tekeei, A.; Suppes, G.J. Modeling impact of catalyst loading on polyurethane foam polymerization. Appl. Catal. A-Gen. 2014, 469, 229–238. [Google Scholar] [CrossRef]
- Al-Moameri, H.; Ghoreishi, R.; Zhao, Y.; Suppes, G.J. Impact of the maximum foam reaction temperature on reducing foam shrinkage. RSC Adv. 2015, 5, 17171–17178. [Google Scholar] [CrossRef]
- Al-Moameri, H.; Zhao, Y.; Ghoreishi, R.; Suppes, G.J. Simulation of liquid physical blowing agents for forming rigid urethane foams. J. Appl. Polym. Sci. 2015, 132, 42454. [Google Scholar] [CrossRef]
- Al-Moameri, H.; Ghoreishi, R.; Suppes, G. Impact of inter-and intra-molecular movements on thermoset polymerization reactions. Chem. Eng. Sci. 2017, 161, 14–23. [Google Scholar] [CrossRef]
- Furtwengler, P.; Avérous, L. Renewable polyols for advanced polyurethane foams from diverse biomass resources. Polym. Chem. 2018, 9, 4258–4287. [Google Scholar] [CrossRef]
- Malani, R.S.; Malshe, V.C.; Thorat, B.N. Polyols and polyurethanes from renewable sources: Past, present and future—Part 1: Vegetable oils and lignocellulosic biomass. J. Coat. Technol. 2022, 19, 201–222. [Google Scholar] [CrossRef]
- Malani, R.S.; Malshe, V.C.; Thorat, B.N. Polyols and polyurethanes from renewable sources: Past, present, and future—Part 2: Plant-derived materials. J. Coat. Technol. 2022, 19, 361–375. [Google Scholar] [CrossRef]
- Leng, X.; Li, C.; Cai, X.; Yang, Z.; Zhang, F.; Liu, Y.; Yang, G.; Wang, Q.; Fang, G.; Zhang, X. A study on coconut fatty acid diethanolamide-based polyurethane foams. RSC Adv. 2022, 12, 13548–13556. [Google Scholar] [CrossRef] [PubMed]
- Dingcong, R.; Malaluan, R.; Alguno, A.; Estrada, D.; Szczepkowski, L.; Lubguban, A.A.; Resurreccion, E.; Dumancas, G.; Al-Moameri, H.; Lubguban, A.A. A Novel Reaction Mechanism for the Synthesis of Coconut Oil-Derived Biopolyol for Rigid Poly(urethane-urea) Hybrid Foam Application. RSC Adv. 2023, 13, 1985–1994. [Google Scholar] [CrossRef] [PubMed]
- Al-Moameri, H.; Zhao, Y.; Ghoreishi, R.; Suppes, G. Simulation Silicon Surfactant Rule on Polyurethane Foaming Reactions. Iran. J. Chem. Chem. Eng. 2021, 40, 1256–1268. [Google Scholar] [CrossRef]


| Reaction Number (i) | Reaction | Reaction Number (i) | Reaction |
|---|---|---|---|
| 1 | A + Bp → P | 7 | A + BpP → P |
| 2 | A + Bs → P | 8 | A + BsP → P |
| 3 | A + Bt → P | 9 | A + BtP → P |
| 4 | AP + Bp → P | 10 | AP + BpP → P |
| 5 | AP + Bs → P | 11 | AP + BsP → P |
| 6 | AP + Bt → P | 12 | AP + BtP → P |
| Material | OHV 3 [mg KOH/g] | MW 3 [g/mol] | Functionality | Density [g/cm3] | Specific Heat [J/g] |
|---|---|---|---|---|---|
| PAPITM 27 | - | 340 | 2.7 | 1.23 | 1.8 |
| VORANOLTM 490 | 490 | 491 | 4.3 | 1.11 | 1.8 |
| Material | OHV [mg KOH/g] | MW [g/mol] | Functionality | Density [g/cm3] | Specific Heat [J/g] | NHV 2 [mg KOH/g] |
|---|---|---|---|---|---|---|
| pp-CDEA | 305 | 791 | 4.3 | 0.9 | 3.5 | 12 |
| Sample | A-Side | B-Side | ||||
|---|---|---|---|---|---|---|
| Iso [g] | V490 [g] | pp-CDEA [g] | Cat 8 [g] | INV 690 [g] | DABCO [g] | |
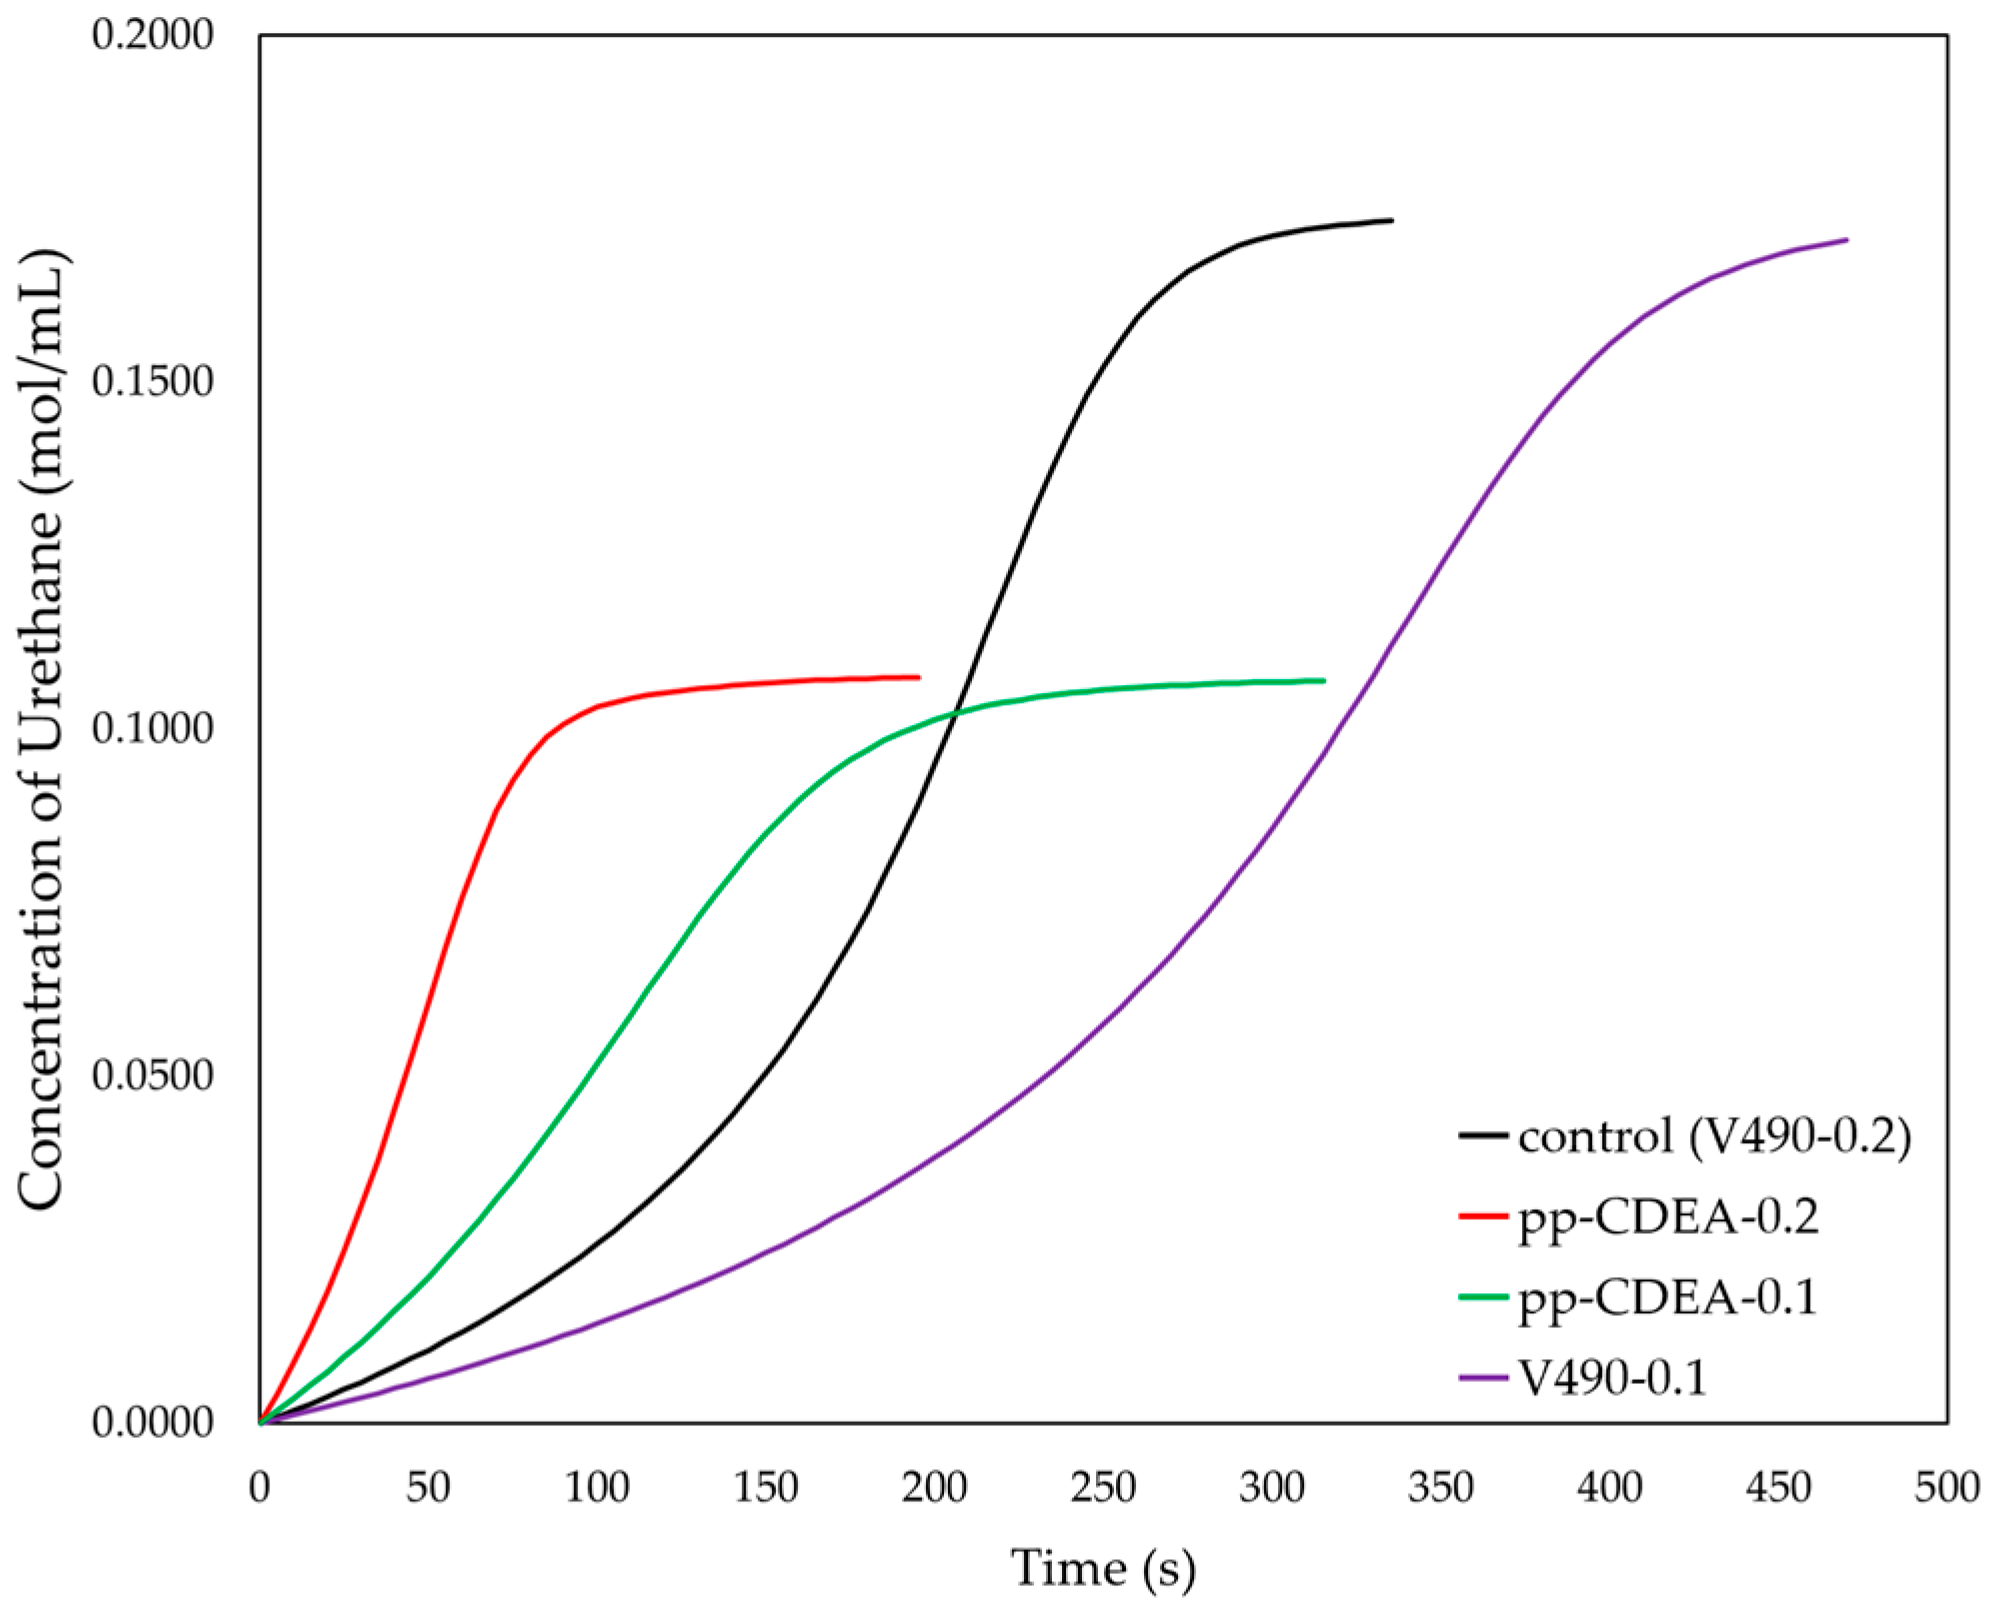
| V490-0.2 2 (control) | 29.0 | 20.0 | 0.0 | 0.2 | 0.1 | 0.1 |
| V490-0.1 | 29.0 | 20.0 | 0.0 | 0.1 | 0.1 | 0.1 |
| pp-CDEA-0.2 2 | 18.4 | 0.0 | 20.0 | 0.2 | 0.1 | 0.1 |
| pp-CDEA-0.1 | 18.4 | 0.0 | 20.0 | 0.1 | 0.1 | 0.1 |
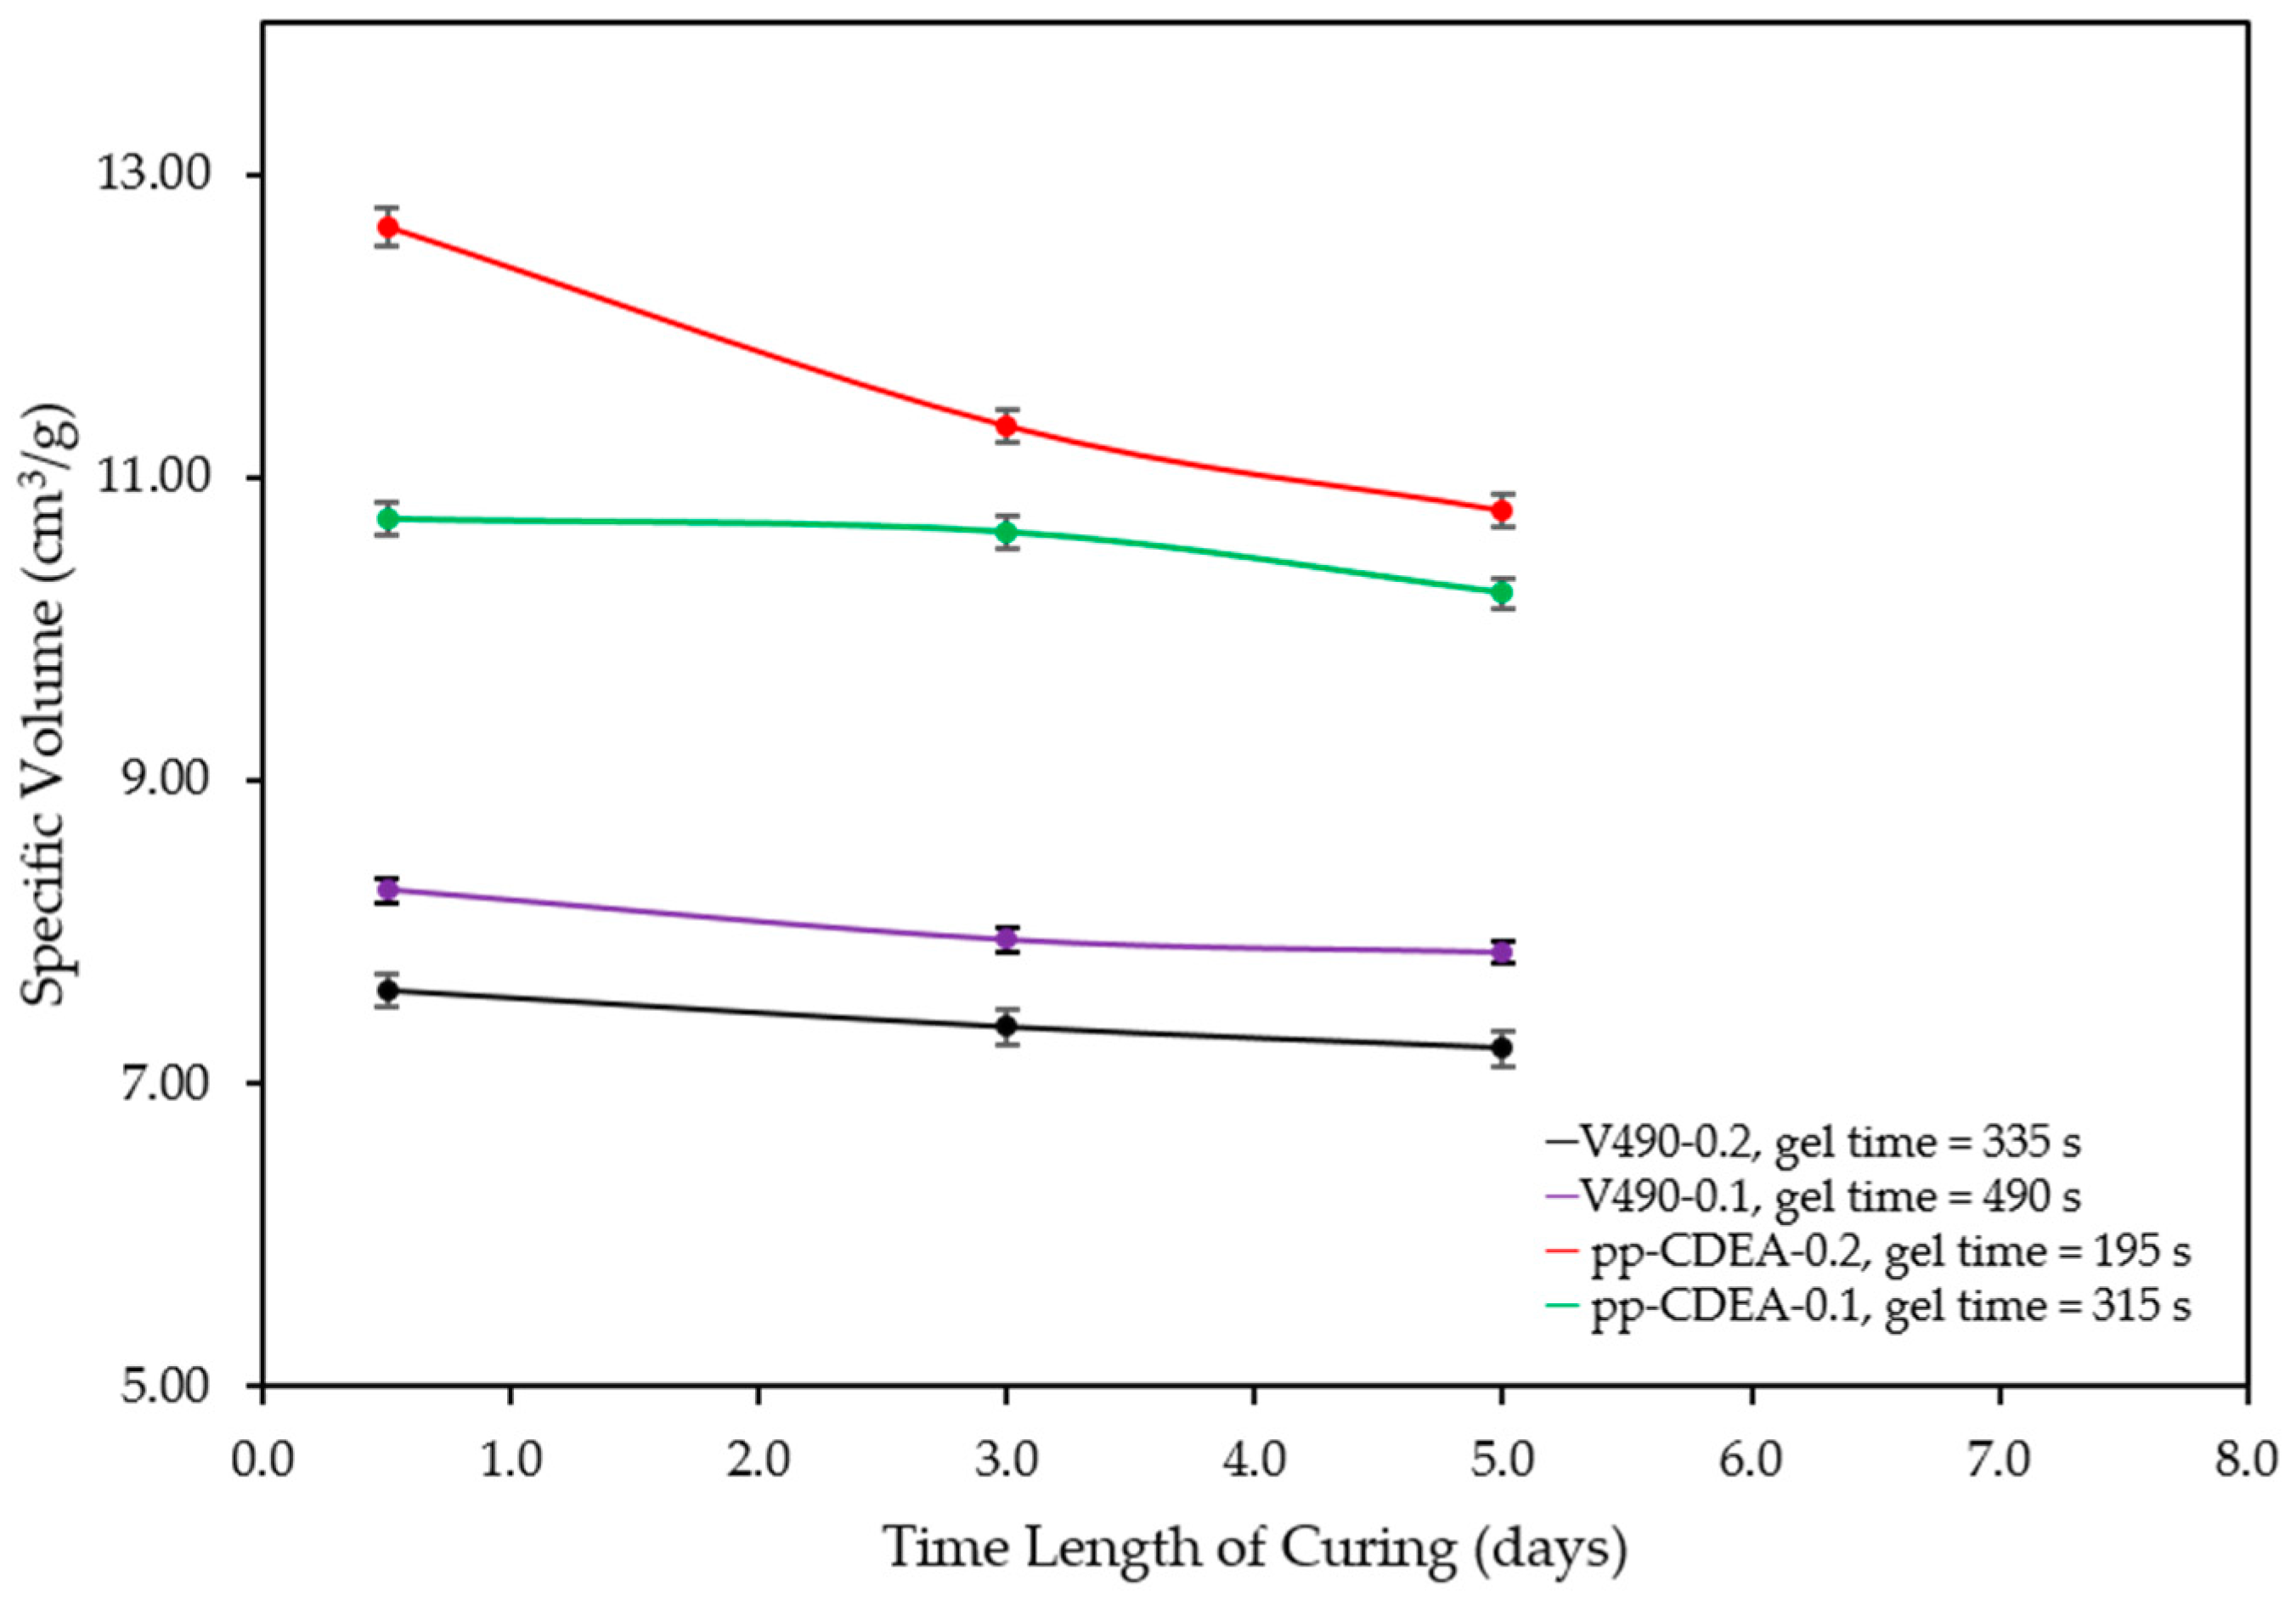
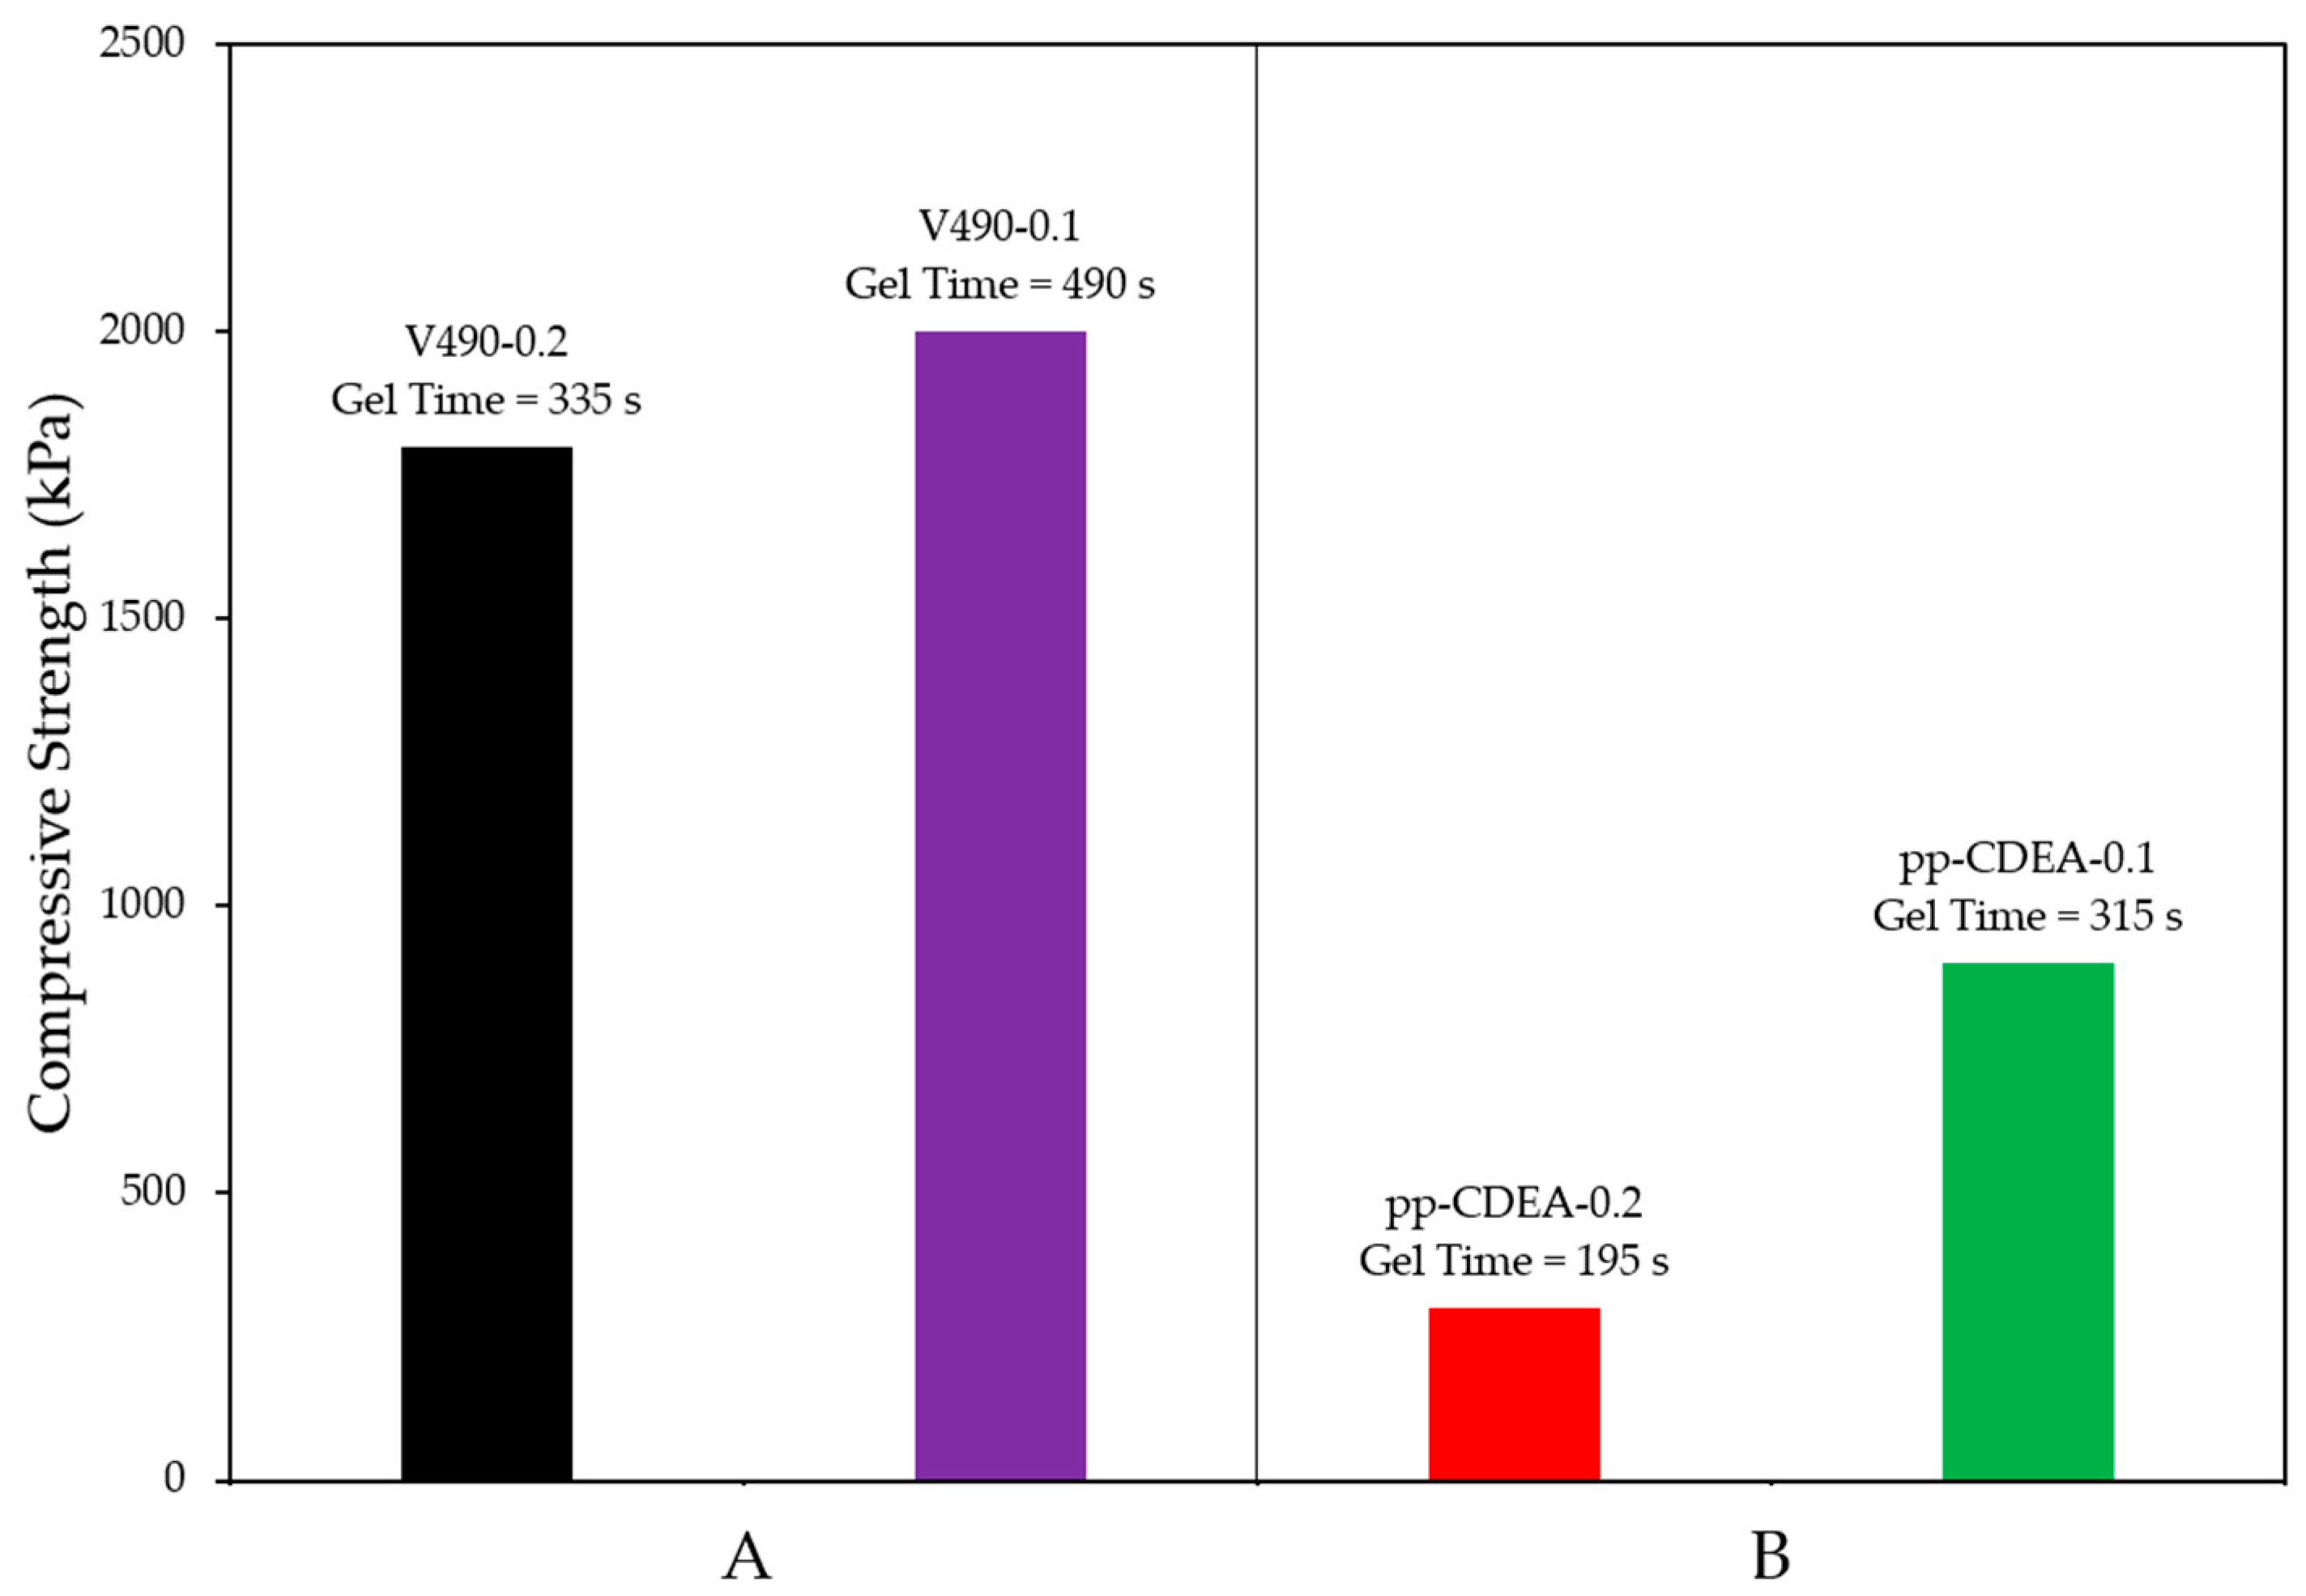
| Sample | Exp. Gel Time [s] | Specific Volume after 30 Min. of Curing [cm3/g] | Specific Volume after 3 Days of Curing [cm3/g] | Specific Volume after 5 Days of Curing [cm3/g] | Change in Specific Volume after 3 Days [%] | Change in Specific Volume after 5 Days [%] | Compressive Strength [kPa] |
|---|---|---|---|---|---|---|---|
| V490-0.2 | 335 | 7.61 | 7.37 | 7.23 | −3.2 | −5.1 | 1800 |
| V490-0.1 | 490 | 8.27 | 7.95 | 7.87 | −3.9 | −4.9 | 2000 |
| pp-CDEA-0.2 | 195 | 12.66 | 11.34 | 10.78 | −10.4 | −14.8 | 300 |
| pp-CDEA-0.1 | 315 | 10.73 | 10.64 | 10.23 | −0.8 | −4.6 | 900 |
| Sample | Catalyst Loading [g] | Experimental Gel Time [s] | Change in Specific Volume after 3 Days [%] | Change in Specific Volume after 5 Days [%] | Compressive Strength [kPa] |
|---|---|---|---|---|---|
| V490-0.2 (control) | 0.2 | 335 | −3.2 | −5.1 | 1800 |
| V490-0.1 (control) | 0.1 | 490 | −3.9 | −4.9 | 2000 |
| pp-CDEA-0.2 | 0.2 | 195 | −10.4 | −14.8 | 300 |
| pp-CDEA-0.1 | 0.1 | 315 | −0.8 | −4.6 | 900 |
Disclaimer/Publisher’s Note: The statements, opinions and data contained in all publications are solely those of the individual author(s) and contributor(s) and not of MDPI and/or the editor(s). MDPI and/or the editor(s) disclaim responsibility for any injury to people or property resulting from any ideas, methods, instructions or products referred to in the content. |
© 2023 by the authors. Licensee MDPI, Basel, Switzerland. This article is an open access article distributed under the terms and conditions of the Creative Commons Attribution (CC BY) license (https://creativecommons.org/licenses/by/4.0/).
Share and Cite
Alfeche, F.L.A.M.; Dingcong, R.G., Jr.; Mendija, L.C.C.; Al-Moameri, H.H.; Dumancas, G.G.; Lubguban, A.A.; Malaluan, R.M.; Alguno, A.A.; Lubguban, A.A. In Silico Investigation of the Impact of Reaction Kinetics on the Physico-Mechanical Properties of Coconut-Oil-Based Rigid Polyurethane Foam. Sustainability 2023, 15, 7148. https://doi.org/10.3390/su15097148
Alfeche FLAM, Dingcong RG Jr., Mendija LCC, Al-Moameri HH, Dumancas GG, Lubguban AA, Malaluan RM, Alguno AA, Lubguban AA. In Silico Investigation of the Impact of Reaction Kinetics on the Physico-Mechanical Properties of Coconut-Oil-Based Rigid Polyurethane Foam. Sustainability. 2023; 15(9):7148. https://doi.org/10.3390/su15097148
Chicago/Turabian StyleAlfeche, Fortia Louise Adeliene M., Roger G. Dingcong, Jr., Leanne Christie C. Mendija, Harith H. Al-Moameri, Gerard G. Dumancas, Alona A. Lubguban, Roberto M. Malaluan, Arnold A. Alguno, and Arnold A. Lubguban. 2023. "In Silico Investigation of the Impact of Reaction Kinetics on the Physico-Mechanical Properties of Coconut-Oil-Based Rigid Polyurethane Foam" Sustainability 15, no. 9: 7148. https://doi.org/10.3390/su15097148
APA StyleAlfeche, F. L. A. M., Dingcong, R. G., Jr., Mendija, L. C. C., Al-Moameri, H. H., Dumancas, G. G., Lubguban, A. A., Malaluan, R. M., Alguno, A. A., & Lubguban, A. A. (2023). In Silico Investigation of the Impact of Reaction Kinetics on the Physico-Mechanical Properties of Coconut-Oil-Based Rigid Polyurethane Foam. Sustainability, 15(9), 7148. https://doi.org/10.3390/su15097148