Article

Remote Sensing Application in Pure Premium Rate-Making of Winter Wheat Crop Insurance

1
Center for Spatial Information, School of Environment and Natural Resources, Renmin University of China, Beijing 100872, China
2
School of Statistics, Renmin University of China, Beijing 100872, China
*
Author to whom correspondence should be addressed.
Sustainability 2023, 15(9), 7133; https://doi.org/10.3390/su15097133
Submission received: 18 March 2023 / Revised: 19 April 2023 / Accepted: 20 April 2023 / Published: 24 April 2023

Abstract

:
Crop insurance is a crucial way to avoid disaster losses and to guarantee farmers’ basic production income in China and abroad. Securing agricultural production is a critical way to eradicate hunger and reduce poverty and an essential means to achieve the UN Sustainable Development Goals. How to pay out more quickly and fairly after a disaster has become an urgent issue for agricultural insurance. The standard domestic crop insurance rate is determined based on the statistical data of the entire administrative unit and ignores the spatial risk difference of disasters inside the administrative unit. Therefore, obtaining a pure premium based on crops inside the administrative unit is a key problem. Based on remote sensing data and insurance actuarial models, we studied and determined the fair premium rates to insure winter wheat at the farmer level in Heze, Shandong, China. Our study shows that remote sensing data can provide data security for determining a pure premium rate at the level of individual farms, and provide the primary reference for determining farmer-level crop insurance premium rates. The use of remote sensing for determining those rates can improve the customization of crop insurance and reduce farmers’ lower incomes due to exposure to natural disasters, improve farmers’ resilience to risk, and prevent a return to poverty due to disasters, ultimately reaching the UN Sustainable Development goals of eradicating hunger and reducing poverty.

1. Introduction

Agricultural production, especially crop production, relies on environmental factors such as climate, soil, and biotic factors [1]. Crop production losses caused by natural disasters can seriously limit rural development and make crop raising a vulnerable industry [2]. Post-disaster reconstruction and recovery are a financial burden for farmers [3]. These contradict the UN Sustainable Development Goals of eradicating hunger and reducing poverty, as shown in Figure 1 [4,5]. Interventions in the land and agri-food sectors have a positive impact on the UN Sustainable Development Goals, and agricultural insurance is one of the key instruments [6]. Crop insurance has become an important tool for China to achieve its sustainable development goals [7]. Some scholars have suggested the significance of agricultural insurance for sustainable development from the perspective of crop insurance demand [8]. The R4 Rural Resilience Initiative in Ethiopia is a widely cited example of a program that serves the most vulnerable and includes aspects of resource management, and access by the poor to financial services, including insurance and savings [9]. Crop insurance is an essential way for farmers to reduce the risk of disasters and unaffordable recovery by sharing the risk of production loss with the insurance industry. In crop insurance, the pure premium, the main component of crop insurance premiums, determines the rationality of premium prices [10]. Therefore, fairness and accuracy of pure premium rate-making are fundamental and essential for a good crop insurance contract, increasing farmers’ resilience and reducing their risk and vulnerability to climate-related extreme events and other environmental shocks and disasters.
Some research on pure premium rate-making has been carried out on crop insurance, and several rate-making models, such as yield-based crop insurance, index-based crop insurance, and weather insurance, have been explored [11]. However, traditional methods cannot acquire a pure premium rate at a fine scale, ignoring the risk distribution’s spatial heterogeneity [12]. As an example, the area–yield crop insurance model [13] has overcome the moral hazard problems, but its rate-making unit is often at the county level, which ignores heterogeneity within each county unit [14] and disregards the actual yields of various farmers’ lands. It is common to use administrative divisions as premium rate units [15]. In other words, the same insurance premiums are applied to all farms in a county, which does not consider the risk differences among the farms [16]. Therefore, crop insurance requires a method to determine fine-scale pure premium insurance rates to improve the deficiency mentioned above.
On the other hand, research has been conducted on remote sensing applied to the agriculture field, especially in mapping vegetation worldwide [17]. Many remote sensing products, such as the enhanced vegetation index, the normalized difference vegetation index, and gross primary production (GPP) sensing can determine crop growth status and yield levels [18]. It has been proven that the remote sensing data used to estimate agricultural biomass are highly correlated with statistically derived estimates of the actual biomass [19]. Moderate resolution imaging spectroradiometer (MODIS) products generate many vegetation indices that are widely used for crop yield estimation due to those products’ high quality and cost-effectiveness [20]. Although many studies have been published concerning crop yield estimation and monitoring crop growth via remote sensing [21], few studies have examined agricultural insurance from the perspective of building the resilience of the poor and those in vulnerable situations [22].
In order to accomplish the UN Sustainable Development Goal of eradicating hunger and reducing poverty, more refined insurance rates are obtained to achieve quick and precise payouts to farmers. Our study developed a pure premium rate-making method using satellite remote sensing data to explore the possibility of applying remote sensing technology in the insurance industry. First, this study used MOD17A2 data to generate GPP data for the winter wheat growing season from 2007 to 2017. Second, Heze City administrative boundary data and Landsat 5/7/8 TM/ETM data were used to calculate winter wheat area ratios from 2007 to 2017 at a 1 km spatial resolution. Third, the pure premium rate of winter wheat in 2018 was obtained via the Bühlmann–Straub model and the empirical rates method. Finally, the difference between traditional statistical methods and the remote sensing method are compared, and in this paper, the advantages to the crop insurance industry of using remote sensing are pointed out.

2. Methods

2.1. Study Area

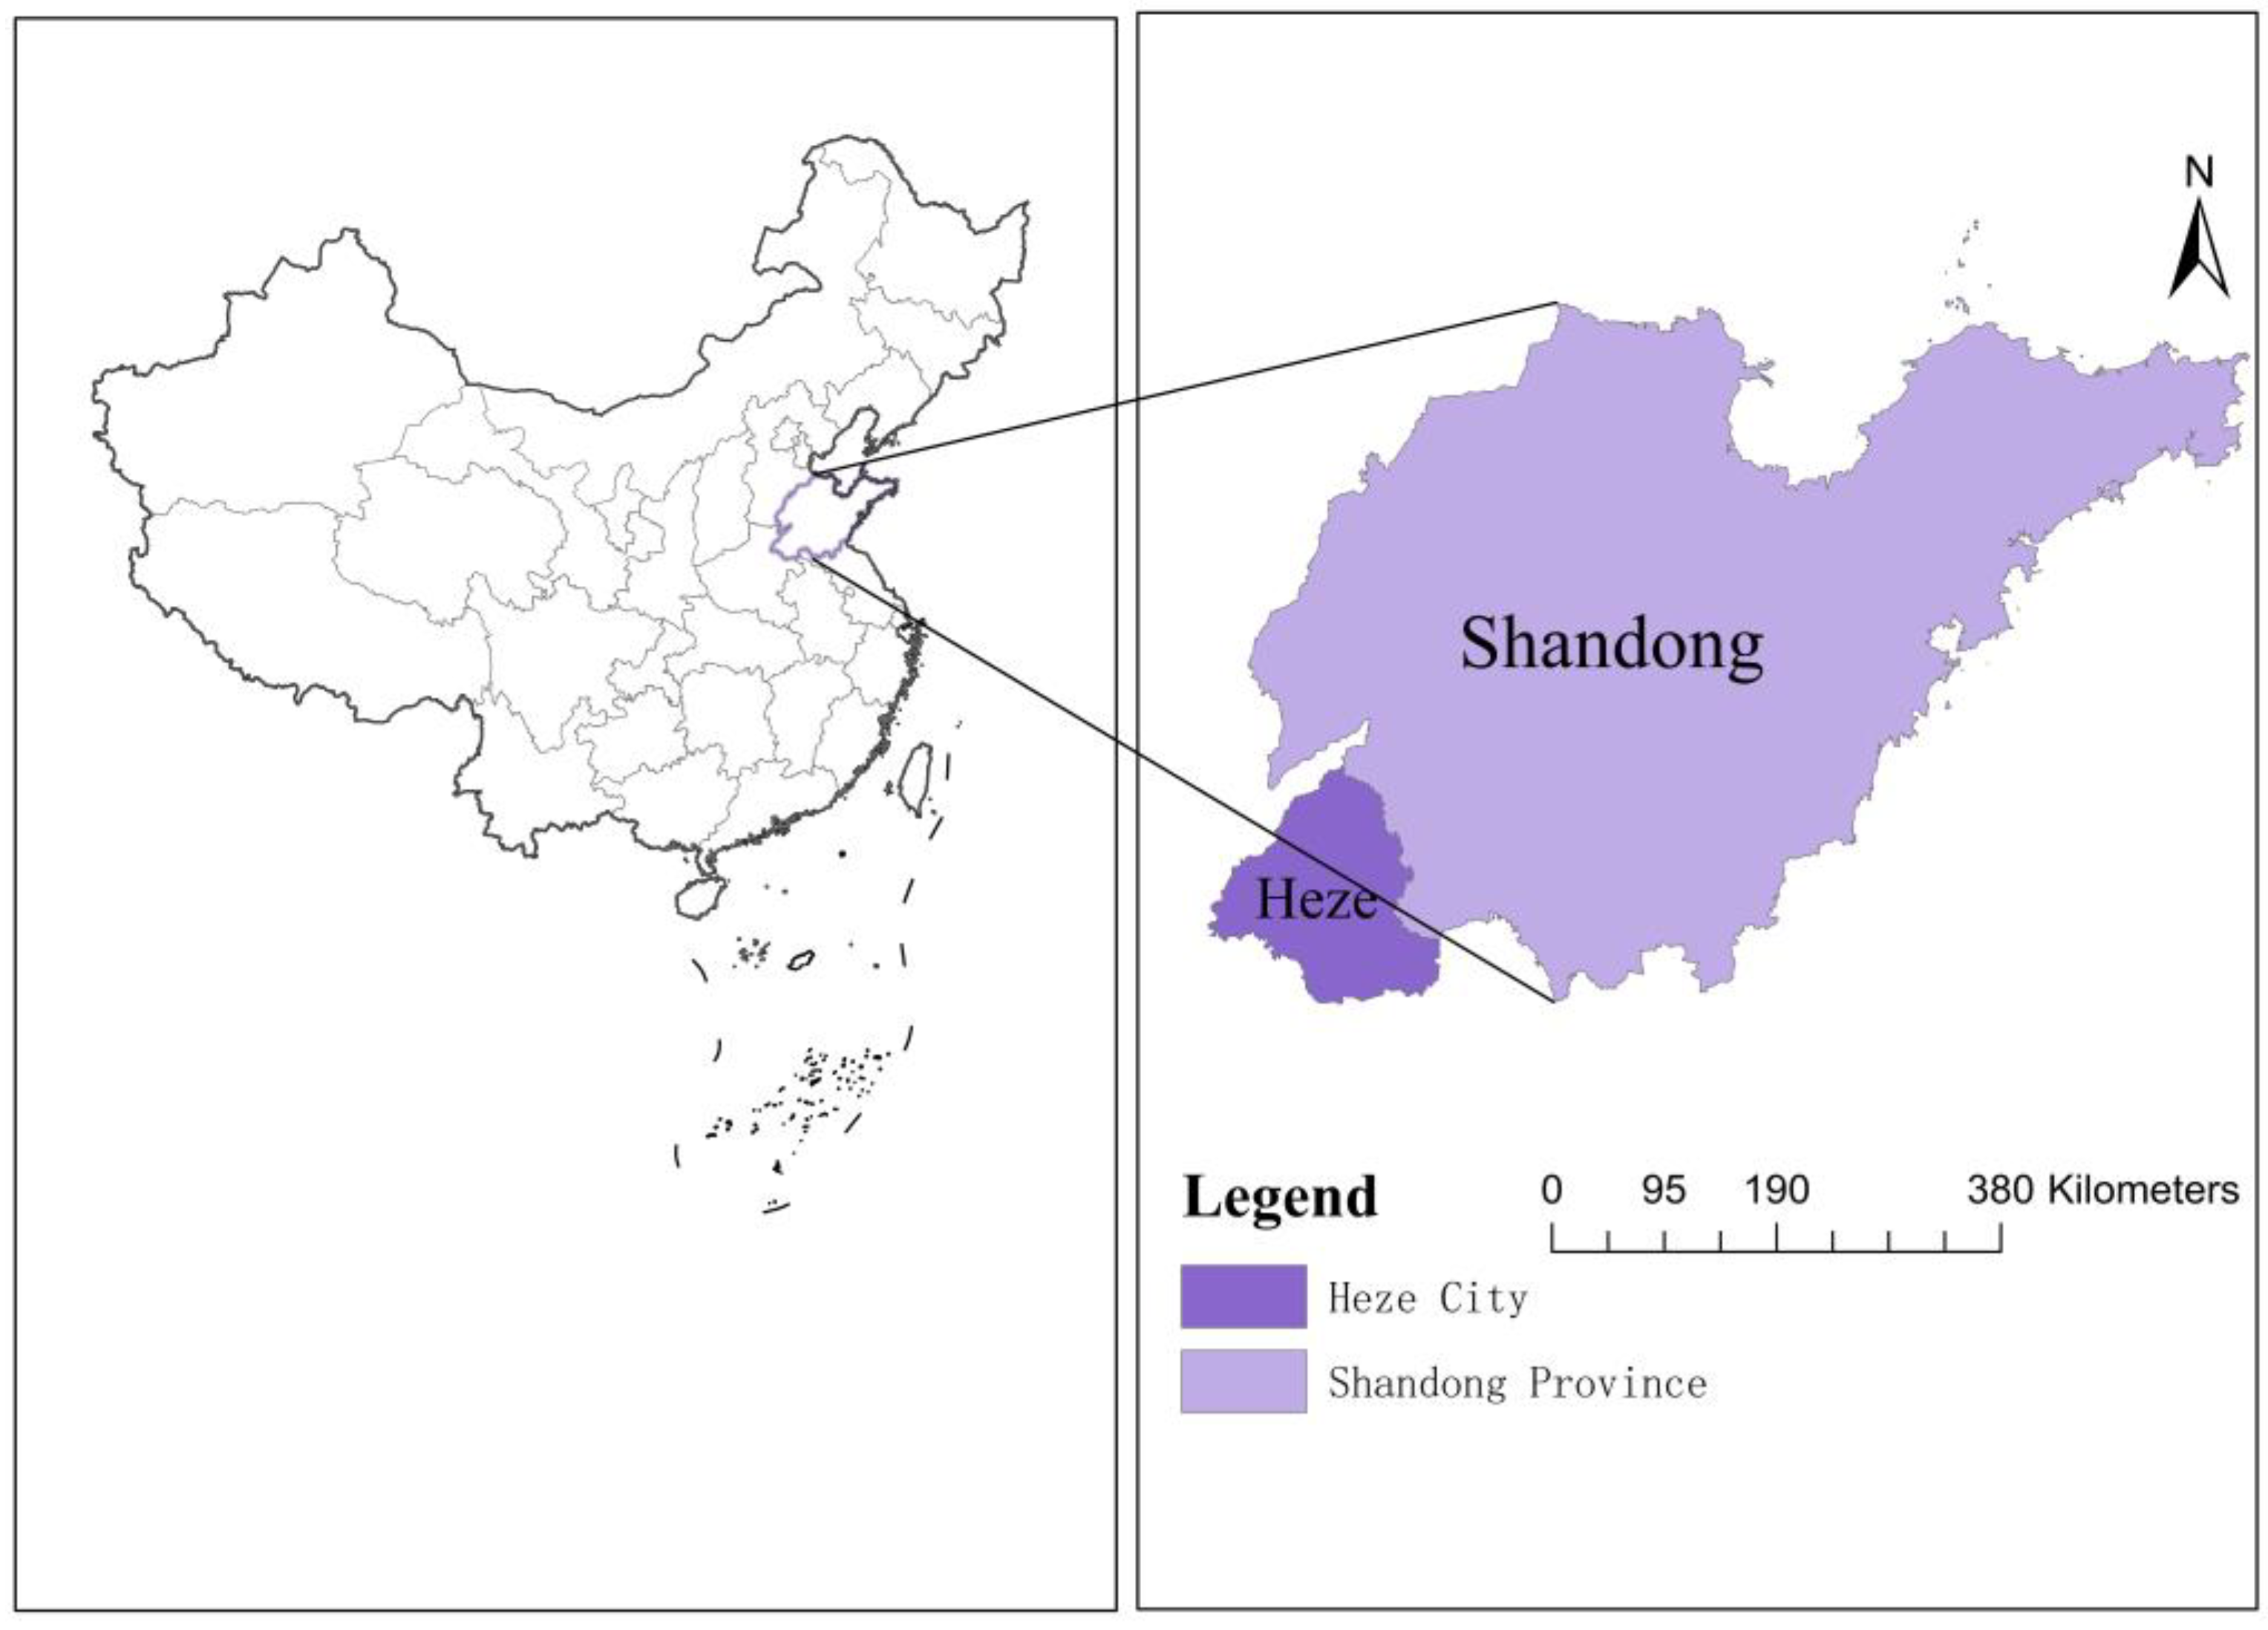
Heze (34°48′ N, 116°04′ E) is in the southwestern Shandong Province, China (Figure 2). Winter wheat is the main crop in this region. The local rural farming industry comprises small-scale scattered agricultural units operated by individual farmers. They are usually unable to bear alone the losses caused by natural disasters, and crop insurance must share the risks of crop production. However, the current crop insurance policy in Heze is based on a county-level crop insurance premium rate, and it does not provide a farmer-level differential insurance rate based on land parcels.
The winter wheat in the Heze area has the following four major growth stages: (1) seeding, from early October to early March, (2) stem extension from early March to mid-April, (3) heading from late April to late May, and (4) ripening in early June. Temperature and precipitation are the two main climatic factors affecting winter wheat production. Although the climate in Heze is suitable for winter wheat, unfavorable climatic conditions frequently occur and cause loss of crop production. A spring drought occurs once every two years during the stem extension growth stage of the wheat when water is critical for the growth of the plant; secondly, frostbite is often caused by low temperatures in winter wheat during the heading period, leading to yield reduction and crop failure [23].

2.2. Data

In this research, the study of winter wheat insurance rates in Heze, Shandong required remote sensing data and statistical data.

2.2.1. Remote Sensing Data

Yield Data: GPP is the gross chemical energy converted and stored as biomass from luminous energy by vegetation [24]. It is used as an indicator of vegetation growth status. MODIS GPP data are collected daily, and 8 d GPP data are available to the public. It is possible to calculate the sum of the GPP over a certain period [25]. Reeves et al. have successfully used MODIS GPP products to estimate wheat yield [26]. Thus, we chose MODIS GPP product data as the analog yield data to calculate a winter wheat insurance pure premium. MOD17A2 (MODIS GPP dataset) 8 d GPP data products for Heze, covering the period from early March to mid-June between 2007 and 2017, were chosen for building a pure premium insurance rate-making model based on winter wheat cumulative GPP loss (https://modis.gsfc.nasa.gov/ accessed on 18 July 2019). The data can be downloaded from the Numerical Terradynamic Simulation Group. Photosynthesis of winter wheat in Heze minimally contributes to its GPP value at its early growth stage, and the GPP data in Heze experience a sharp rise during the reviving period and peak in mid-April. Therefore, the primary growing season, from early March to mid-June, is chosen to calculate the winter wheat cumulative GPP.
Cultivated Land Area Data: To accommodate the model, this study used cultivated land area data from 2007 to 2017. In addition, in November in the Shandong province, only winter wheat has a solid biological prominence. Other biological entities such as trees and grass are less prominent, so extracting areas planted with winter wheat is easy. Therefore, we chose Landsat-7 TM/ETM images from 2006 to 2016 for each November as the basis for judging the cultivated area of winter wheat harvested from 2007 to 2017 (https://earthexplorer.usgs.gov/ accessed on 19 July 2019). The 8 m resolution multispectral image of GF-1 was used to verify the accuracy of winter wheat planting area in the experimental area (http://www.cnsa.gov.cn/ accessed on 25 February 2020).

2.2.2. Statistical Data

Statistical data were needed to calculate the traditional result using the same actuarial method to compare the traditional method with the remote sensing method. We used winter wheat yield data and the planted areas of each county in Heze from 2007 to 2017. All the data were from the Heze statistical yearbook [27].

2.2.3. Administrative Border Data

The administrative border data used in this research included the administrative map of Heze at the county level and a Chinese boundary map. All the border data were from China’s State Bureau of Surveying and Mapping.

2.3. Models

In this study, first, the proportion of winter wheat cultivated land area is calculated, and the theoretical GPP is calculated based on the Bühlmann–Straub confidence model using the actual GPP and the proportion of the winter wheat cultivated land area. The actual GPP is the accumulated GPP of the crop for the current year. The theoretical GPP is the GPP value set for the individual plot payout calculated from historical multi-year actual GPP data and the proportion of winter wheat cultivated land area. The payout is triggered if the current year GPP value is lower than the theoretical GPP value. Second, the GPP loss rate is obtained using both the theoretical GPP data and the actual GPP data. In traditional insurance, the loss rate of a product is the ratio of the payout expense of that product to the premium income, and the average of the loss ratios over many years is the pure rate of insurance. In this paper, the winter wheat insurance rate belongs to GPP index insurance, and the GPP loss rate is the rate of the difference between the theoretical GPP and the actual GPP to the theoretical GPP. Finally, the empirical rate method is used to calculate the crop pure insurance rate.

2.3.1. Theoretical GPP Calculation

The Bühlmann–Straub model is commonly used to calculate the theoretical GPP value [28,29]. The model considered the weights (i.e., the proportion of cultivated land) of random GPP variables. The theoretical GPP of each land block during its primary growing season was derived from the historical GPP of previous years for that land block.
First, the sum of the GPP values in the growing season (from the beginning of March to mid-June) was calculated for each land block and each year (2007 to 2017) to obtain the months of accumulated GPP for each land block per year.
Second, the proportion of cultivated land for each land block was calculated via remote sensing images (Landsat 5/7/8 TM/ETM). The method of supervised classification is used to extract cultivated land for each year [30]. Using ENVI 5.3 software, we obtained cultivated land grid-level values in the Heze area from 2006 to 2016, reflecting the winter wheat planted area from 2007 to 2017, respectively. The confusion matrix method was used to verify the classification accuracy of winter wheat acreage. Taking the classification results of winter wheat in 2017 as an example, the classification results of high-resolution GF-1 images were taken as the real results, and the confusion matrix as well as the user accuracy were calculated by comparing a random sample of Landsat image classification results with GF-1 image classification results, and the user accuracy of the winter wheat classification can reflect the accuracy of extracting winter wheat acreage in the experimental area using Landsat images. The formula for calculating the theoretical GPP is as follows:
G j n + 1 = 1 Z j G ¯ + Z j G ¯ j
where G j n + 1 is the theoretical GPP of land block j; G ¯ is the average actual GPP value of all land blocks from 2007 to 2017; G ¯ j is the theoretical GPP of land blocks j from 2007 to 2017; Z j is the Bühlmann–Straub model reliability factor.
Finally, the Bühlmann–Straub model is used to derive the theoretical GPP of the winter wheat during the growing season. As stated above, G j n + 1 was then considered as the approximate value of the theoretical GPP of j land in the predicted year 2018.

2.3.2. Loss Rate Calculation

The loss rate is generally calculated from the theoretical GPP value and the actual yield GPP value. First, we calculated the theoretical GPP value of crop production, as mentioned above. Second, the crop yield loss rate for each year was determined by calculating the difference between the actual yield and the theoretical yield. For the single land block j, the detail of the model is described by the following equation:
P i j = max G j i G i j , 0 /   G j i  
where P i j is the yield loss rate of the land block j in year i, G j i is the theoretical GPP value of land block j in year i, and G i j is the actual GPP of land block j in year i.
P i j is understood as follows: for the year i and land block j, if the theoretical GPP is greater than the actual GPP, the actual yield cannot reach the predicted yield, which results in a loss, and P i j is the loss rate. In addition, if the theoretical GPP is less than the actual GPP, the actual yield exceeds the predicted yield, in which case there is no yield loss, and P i j is set to 0.

2.3.3. Prue Insurance Rate Calculation

Pure premium rates are calculated by the empirical rate method [31]. Empirical rating is determined by the approximation of the social average loss rate of crop production over the years. Firstly, the crop yield loss rate in each year is determined and the average loss rate over the years is used as the pure crop insurance rate. This is described by the following equation:
P j = 1 n i = 1 n P i j , i = 1 ,   2 ,   ,   n
where P j is the social average loss rate of j; that is, the average yearly yield loss in the n-year period, and i and n are indicators of the time series. According to the principle of the ER method, the social average loss rate P j can be used as an approximation of the pure premium rate.

2.4. Technology Implementation

In this study, the theoretical GPP value is first calculated using the GPP data and the winter wheat area ratio data from 2007 to 2017. Next, using the actual GPP value and the theoretical GPP value, the 10 years’ actual loss rates can be calculated. We implemented this model by using the actuar package of the R language [32]. Finally, the pure rate in 2018 for each land block is calculated by the loss rate of 10 years using the model described in 2.3. The data processing flowchart is shown in Figure 3.

3. Results

According to the Bühlmann–Straub confidence model, using the Section 2.2 of the remote sensing data and the equations in Section 2.3, the following three key results were obtained: the winter wheat actual GPP, proportion of winter wheat cultivated land area and experimental winter wheat pure premium insurance rate in Heze.

3.1. Actual GPP

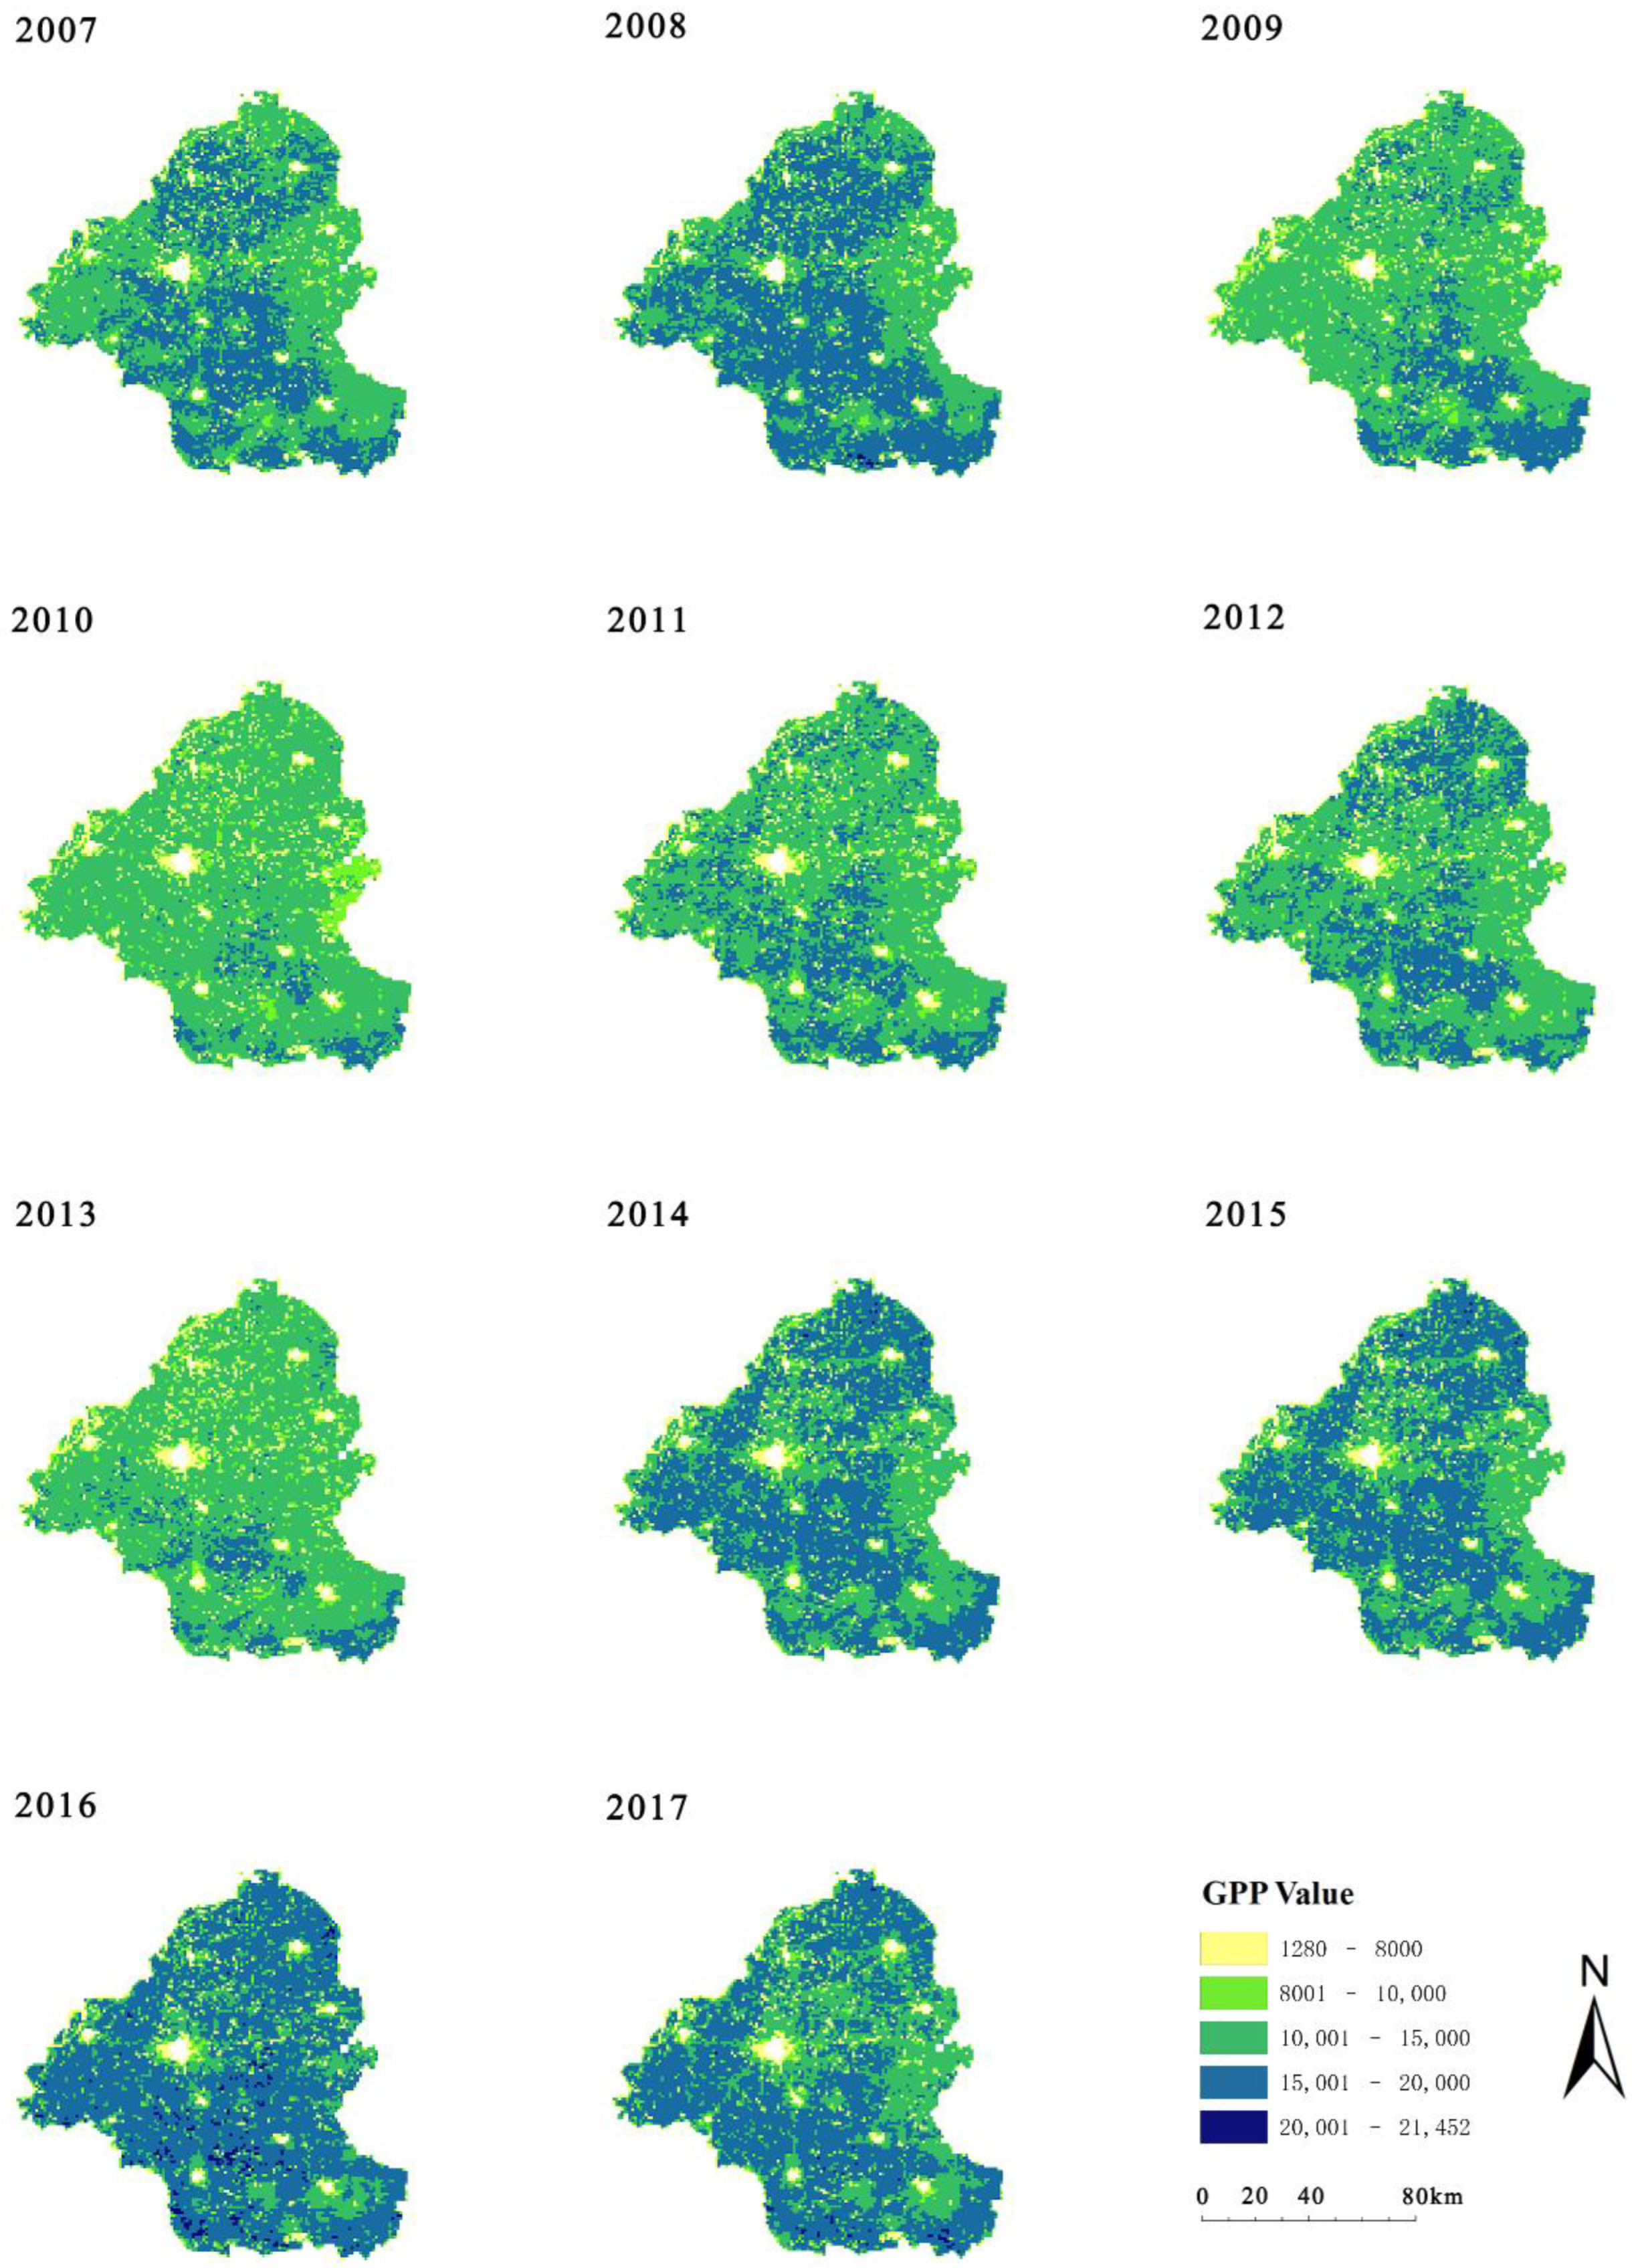
According to the method in Section 2.3., maps of the accumulated GPP analog yield data from 2007 to 2017 are shown in Figure 4. From the result, we can observe the following: (1) the maximum and minimum of the winter wheat GPP value are 1280 and 21,452, respectively, while that east of Heze was relatively lower than those of the other districts. (2) Each year had several empty districts, shown in white, and the positions of these empty districts were constant. Urban districts did not have GPP values; in the MOD17A2 product, those values were shown as the maximum value. When the accumulated GPP is calculated, those districts are found and set aside. (3) The accumulated GPP values mostly ranged from 8000 to 20,000, were relatively stable, and were suitable for base data to calculate insurance premiums. (4) The role of the GPP data in the study was to calculate the variance and mean in every district. The mean determined the base theoretical GPP value, but the weight of the base theoretical GPP value was determined by both the district variance and the cultivated land area.
The actual GPP of winter wheat allows the calculation of the variance and mean of the actual GPP of winter wheat for each kilometer grid cell. The mean of the actual GPP of winter wheat can be used to determine the theoretical GPP value, while the weight of the theoretical GPP value of winter wheat is determined by the weight of each kilometer grid cell of winter wheat. The weight of the theoretical GPP value of winter wheat is determined by the variance and mean value of the actual GPP of winter wheat in each kilometer grid cell, in addition to the variance of the actual GPP and proportion of winter wheat cultivated land area of each kilometer grid cell.

3.2. Proportion of Winter Wheat Cultivated Land Area

The area of cultivated land from 2007 to 2017 is shown in Figure 5. Several white districts are urban areas, as mentioned above. Overall, the northwestern part of Heze City and the central and western regions have less arable land due to the poor environmental conditions in the Yellow River flood area. Due to the smaller proportion of cultivated land in those areas, each weight of the GPP production at the corresponding positions decreased during the model calculation, and the weight of the average GPP yield in those areas increased.

3.3. Winter Wheat Pure Premium Insurance Rates in Heze

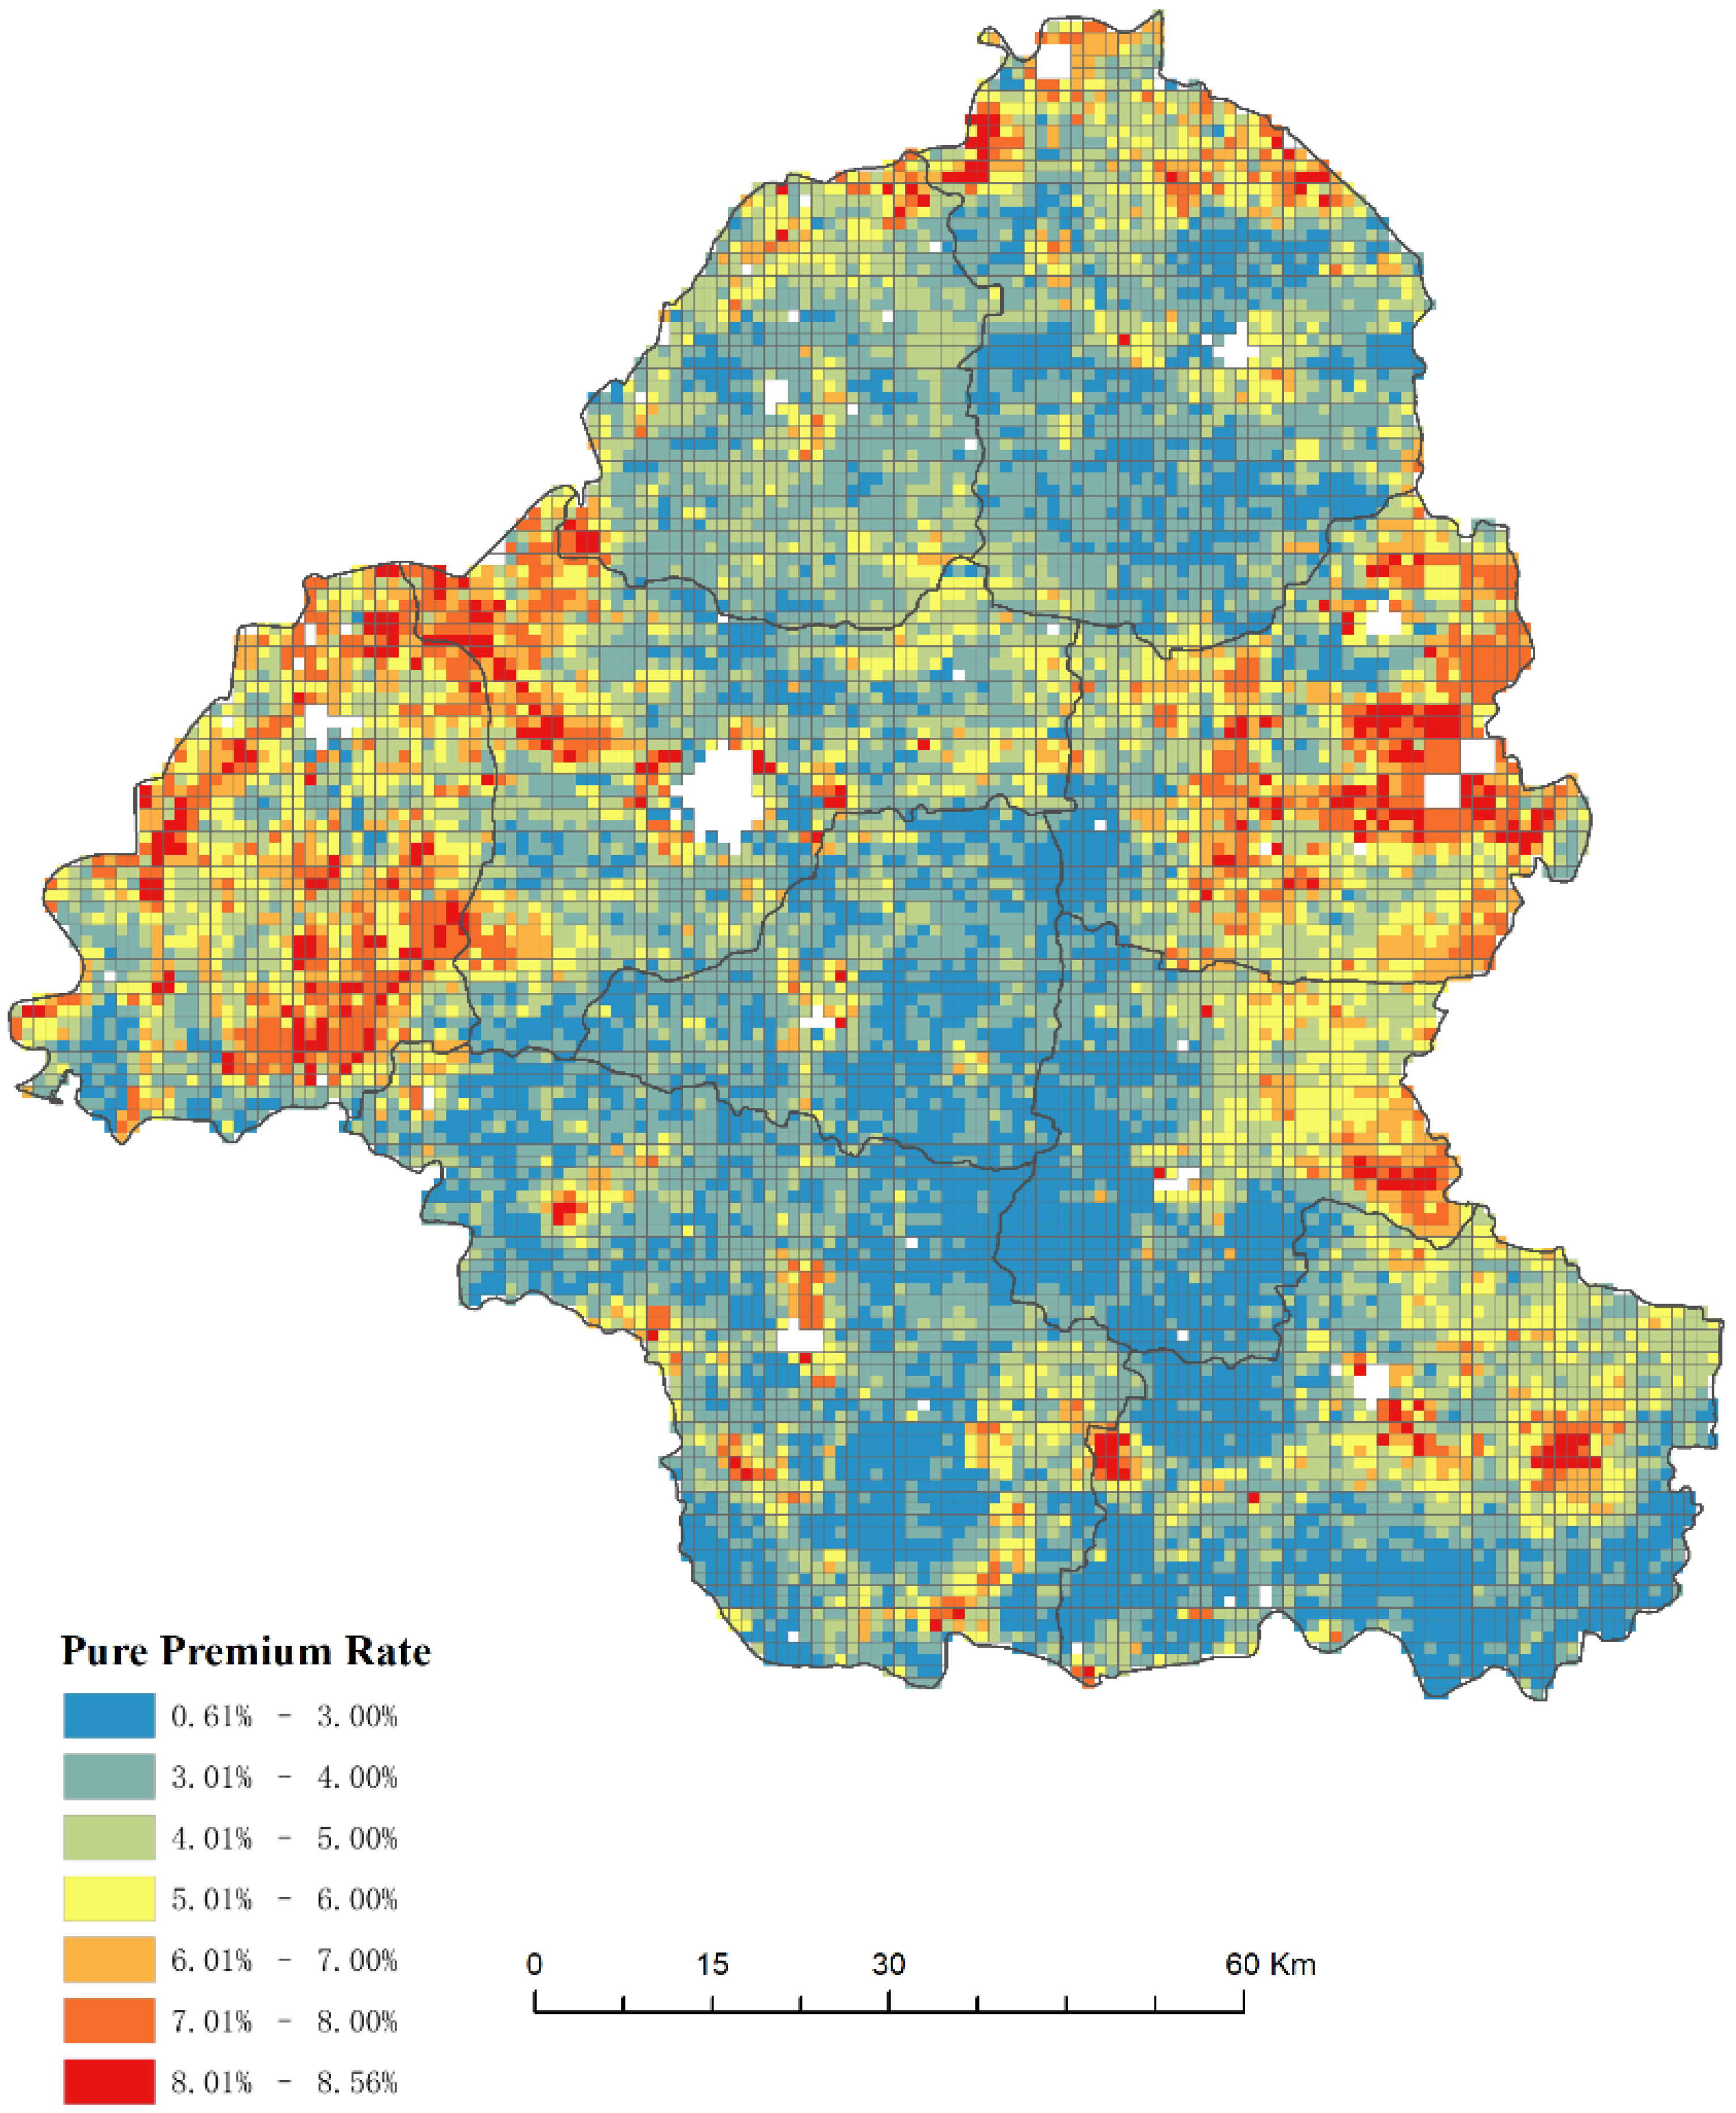
The map of the winter wheat pure premium insurance in Heze shown in Figure 6 is obtained using satellite remote sensing data based on the pure premium rate-making method. The value represents the loss rate of the winter wheat production on the land block corresponding to each pixel. Under the 100% coverage level condition, the maximum pure premium rate is 8.56%, and the minimum pure premium rate is 0.61%. The high-loss-rate areas are mainly in eastern regions and some western regions.

3.4. Accuracy Verification of Winter Wheat Cultivated Land Area

Accuracy evaluation is an important tool to test the results of winter wheat distribution extraction using remote sensing images. Random sampling of the classification results obtained from the Landsat ETM data in 2017 is shown in Figure 7. The confusion matrix of winter wheat classification results in the experimental area in 2017 was obtained by comparing these results with the classification results of GF-1 images, as shown in Table 1. The user accuracy of the winter wheat acreage classification in the experimental area in 2017 was 96.0%; therefore, there was an error of 4.0% in the extraction of winter wheat acreage in this experimental area.

4. Discussion

4.1. Spatial Refinement of Premium Rate

To visually show the spatial refinement differences, all the counties’ pure premiums in Heze were set using the same method with statistical data at the county level. We used winter wheat yield data and the planted area of each county in Heze from 2007 to 2017 and calculated the pure premium rate of winter wheat in each county in 2018.
The result is shown in Figure 8. Figure 8a shows the distribution map of the pure premium insurance rates for winter wheat in Heze that is calculated by the pure premium rate-making method using satellite remote sensing data. Figure 8b shows the pure premium insurance rates for winter wheat in Heze produced using the pure premium rate-making model with statistical data at the county level.
Compared with the statistical method, which had only one value, the rates obtained by the remote sensing method accounted for different risks in the county-level regions. From the perspective of administrative divisions, the rate distribution of the remote sensing data in each region fluctuated wildly, the rate distribution of the statistical data fluctuated less, and the variance in the remote sensing method was more significant than the variance in the statistical method. This result shows that remote sensing data can distinguish more crop production rates than county-level crop insurance and at the kilometer level.
The spatial resolution of remote sensing data ranges from meters to thousands of meters, and the data can easily be adjusted to meet actual requirements. Supported by the varied spatial resolution remote sensing data, the pure premium rate-making method using satellite remote sensing data produces refined and differential premium insurance rates that accurately reflect the risk differences at a smaller scale. It makes a map of pure premium rates on each square kilometer, which means that every earth scope of 1 square kilometer has a premium rate. This is extremely meaningful in countries with small farms in remote areas. When a disaster strikes, there is a need for timely and differentiated payouts to different farmers, as the damage to farmers in an administrative division is not exactly the same, and differentiated payouts make winter wheat insurance more equitable.

4.2. Potential of Remote Sensing Applications for Agricultural Insurance and Impact on Sustainable Development

Using the remote sensing method, this research found the potential of remote sensing applied to crop insurance mainly in the following points.

4.2.1. Farm-Level Insurance Accessibility

In China, most provinces’ cultivated area per rural household is less than 0.5 hectares [33]. The insurance applicants are the farmers, who care about the output of the crops only on their own farms. Considering the farmers’ motivation, it is better to assign the farmers rates that depend on their farms’ crop growth situations. Rates that are different for each pixel make farm-level insurance possible and fair, encouraging the farmers to buy the derived crop insurance product. The method in this study makes it possible to set more accurate and flexible pure premium insurance rates and provide a platform for more effective crop insurance contracts. Both farmers and insurers should easily accept the results of this method. This encourages the commercialization of crop insurance.

4.2.2. Data Convenience

MOD17, the data used in this study, is a near-real-time, continuous, consistent operational data set. As a result, the payouts could be made faster than those of the traditional method using statistical data. Decreasing the cost of the infrastructure and manpower is another important improvement in this method. Some remote sensing data are available at a low price or even free. This reduces the initial cost of crop insurance rate-making.

4.2.3. Moral Hazard Reduction

This study used data collected from an independent third party to calculate pure premium insurance rates; therefore, it avoided possible moral hazards caused by dishonest individuals providing false yield-loss information. At the same time, data not affected by stakeholders increase the objectivity and reliability of the rates, so stakeholders can encourage the farmers to buy related crop insurance products, which in turn encourages the commercialization of crop insurance.

4.2.4. Sustainable Agricultural Development

In this study, remote sensing image data were used for insurance rate determination to obtain more spatially refined results. The results of the rate determination can help to accurately determine and quickly settle claims after winter wheat damage, protect farmers’ basic income, prevent farmers from returning to poverty due to natural disasters, and contribute to the achievement of the UN goals of poverty eradication and hunger reduction [34].

5. Conclusions

This study applied remote sensing data to the winter wheat insurance rate in Heze, Shandong, China. The results show that the winter wheat rate determined by remote sensing data has a higher resolution than rates determined by traditional methods, and winter wheat insurance can be fairer and more reasonable. For the government, remote sensing data can produce more reasonable and practical crop insurance policies, increase farmers’ willingness to purchase crop insurance, and protect farmers’ economic interests through rapid and adequate compensation to ensure farmers’ reasonable income security. Refined crop insurance enables insurance companies to collect premiums at different crop insurance rates based on different risk levels at different locations, ensuring that insurance companies operate smoothly, increase revenue, and reduce claims costs. Refined agricultural insurance provides strong support for reducing the number of low-income farmers and for food security in the context of the UN’s sustainable development goals. Therefore, determining pure insurance premium rates based on remote sensing crops by grid units can guarantee the application of fair crop farmers’ insurance rates, ultimately reaching the UN Sustainable Development goals of eradicating hunger and reducing poverty.

Author Contributions

Conceptualization, W.W. (Weijia Wang) and W.W. (Wen Wang); methodology, W.W. (Weijia Wang) and W.W. (Wen Wang); validation, K.W. and R.Y.; formal analysis, W.W. (Weijia Wang); resources, W.W. (Wen Wang); data curation, W.W. (Weijia Wang); writing—original draft preparation, W.W. (Weijia Wang); writing—review and editing, W.W. (Weijia Wang), W.W. (Wen Wang), K.W., Y.Z. and R.Y.; visualization, W.W. (Weijia Wang) and K.W.; supervision, W.W. (Wen Wang); project administration, W.W. (Wen Wang); funding acquisition, Y.Z. and W.W. (Wen Wang). All authors have read and agreed to the published version of the manuscript.

Funding

This research was funded by Fundamental Research Funds for the Central Universities and the Research Funds of Renmin University of China, No.17XNLG09.

Institutional Review Board Statement

Not applicable.

Informed Consent Statement

Informed consent was obtained from all subjects involved in the study.

Data Availability Statement

Not applicable.

Conflicts of Interest

The authors declare no conflic of interest.

References

  1. Dalezios, N.R.; Gobin, A.; Alfonso, A.M.T.; Eslamian, S. Agricultural drought indices: Combining crop, climate, and soil factors. In Handbook of Drought and Water Scarcity; CRC Press: Boca Raton, FL, USA, 2017; pp. 73–89. [Google Scholar]
  2. Shimada, G. The Impact of Climate-Change-Related Disasters on Africa’s Economic Growth, Agriculture, and Conflicts: Can Humanitarian Aid and Food Assistance Offset the Damage? Int. J. Environ. Res. Public Health 2022, 19, 467. [Google Scholar] [CrossRef] [PubMed]
  3. Kammerbauer, M.; Wamsler, C. Social inequality and marginalization in post-disaster recovery: Challenging the consensus? Int. J. Disaster Risk Reduct. 2017, 24, 411–418. [Google Scholar] [CrossRef]
  4. Zhang, S.; Zhou, Y.; Yu, R.; Xu, X.; Xu, M.; Li, G.; Yang, Y. China’s biodiversity conservation in the process of implementing the sustainable development goals (SDGs). J. Clean. Prod. 2022, 338, 130595. [Google Scholar] [CrossRef]
  5. Hickel, J. The contradiction of the sustainable development goals: Growth versus ecology on a finite planet. Sustain. Dev. 2019, 27, 873–884. [Google Scholar] [CrossRef]
  6. McElwee, P.; Calvin, K.; Campbell, D.; Cherubini, F.; Grassi, G.; Korotkov, V.; Smith, P. The impact of interventions in the global land and agri-food sectors on Nature’s Contributions to People and the UN Sustainable Development Goals. Glob. Chang. Biol. 2020, 26, 4691–4721. [Google Scholar] [CrossRef]
  7. Zhang, S.; Yang, Y.; Wen, Z.; Peng, M.; Zhou, Y.; Hao, J. Sustainable development trial undertaking: Experience from China’s innovation demonstration zones. J. Environ. Manag. 2022, 318, 115370. [Google Scholar] [CrossRef]
  8. Hu, C.; Adams, D.C.; Feng, H.; Cheng, J. Refining the Rent Dissipation Model in Land Use: Application to Agricultural Insurance in China. Land 2023, 12, 278. [Google Scholar] [CrossRef]
  9. Osgood, D.; Powell, B.; Diro, R.; Farah, C.; Enenkel, M.; Brown, M.E.; Husak, G.; Blakeley, S.L.; Hoffman, L.; McCarty, J.L. Farmer Perception, Recollection, and Remote Sensing in Weather Index Insurance: An Ethiopia Case Study. Remote Sens. 2018, 10, 1887. [Google Scholar] [CrossRef]
  10. Du, X.; Feng, H.; Hennessy, D.A. Rationality of choices in subsidized crop insurance markets. Am. J. Agric. Econ. 2017, 99, 732–756. [Google Scholar] [CrossRef]
  11. Sinha, S.; Tripathi, N.K. Assessing the Challenges in Successful Implementation and Adoption of Crop Insurance in Thailand. Sustainability 2016, 8, 1306. [Google Scholar] [CrossRef]
  12. Gao, Y.; Shu, Y.; Cao, H.; Zhou, S.; Shi, S. Fiscal Policy Dilemma in Resolving Agricultural Risks: Evidence from China’s Agricultural Insurance Subsidy Pilot. Int. J. Environ. Res. Public Health 2021, 18, 7577. [Google Scholar] [CrossRef]
  13. Miranda, M.J. Area-yield crop insurance reconsidered. Am. J. Agric. Econ. 1991, 73, 233–242. [Google Scholar] [CrossRef]
  14. Zhou, X.H.; Pu, L.; Ke, W. Is the “One Province One Rate” premium policy reasonable for Chinese crop insurance? The case in Jilin Province. J. Integr. Agric. 2018, 17, 1900–1911. [Google Scholar] [CrossRef]
  15. Skees, J.R.; Black, J.R.; Barnett, B.J. Designing and rating an area yield crop insurance contract. Am. J. Agric. Econ. 1997, 79, 430–438. [Google Scholar] [CrossRef]
  16. Goodwin, B.K.; Ker, A.P. Nonparametric estimation of crop yield distributions: Implications for rating group-risk crop insurance contracts. Am. J. Agric. Econ. 1998, 80, 139–153. [Google Scholar] [CrossRef]
  17. Zhou, Q.B.; Yu, Q.Y.; Jia, L.I.U.; Wu, W.B.; Tang, H.J. Perspective of Chinese GF-1 high-resolution satellite data in agricultural remote sensing monitoring. J. Integr. Agric. 2017, 16, 242–251. [Google Scholar] [CrossRef]
  18. Hilker, T.; Coops, N.C.; Wulder, M.A.; Black, T.A.; Guy, R.D. The use of remote sensing in light use efficiency based models of gross primary production: A review of current status and future requirements. Sci. Total Environ. 2008, 404, 411–423. [Google Scholar] [CrossRef]
  19. Guerini Filho, M.; Kuplich, T.M.; Quadros, F.L.D. Estimating natural grassland biomass by vegetation indices using Sentinel 2 remote sensing data. Int. J. Remote Sens. 2020, 41, 2861–2876. [Google Scholar] [CrossRef]
  20. Bojanowski, J.S.; Sikora, S.; Musiał, J.P.; Woźniak, E.; Dąbrowska-Zielińska, K.; Slesiński, P.; Milewski, T.; Łączyński, A. Integration of Sentinel-3 and MODIS Vegetation Indices with ERA-5 Agro-Meteorological Indicators for Operational Crop Yield Forecasting. Remote Sens. 2022, 14, 1238. [Google Scholar] [CrossRef]
  21. Huang, J.; Gómez-Dans, J.L.; Huang, H.; Ma, H.; Wu, Q.; Lewis, P.E.; Xie, X. Assimilation of remote sensing into crop growth models: Current status and perspectives. Agric. For. Meteorol. 2019, 276, 107609. [Google Scholar] [CrossRef]
  22. Adzawla, W.; Kudadze, S.; Mohammed, A.R.; Ibrahim, I.I. Climate perceptions, farmers’ willingness-to-insure farms and resilience to climate change in Northern region, Ghana. Environ. Dev. 2019, 32, 100466. [Google Scholar] [CrossRef]
  23. Zhao, Y.; Wang, X.; Guo, Y.; Hou, X.; Dong, L. Winter Wheat Phenology Variation and Its Response to Climate Change in Shandong Province, China. Remote Sens. 2022, 14, 4482. [Google Scholar] [CrossRef]
  24. Yang, H.; Yang, X.; Zhang, Y.; Heskel, M.A.; Lu, X.; Munger, J.W.; Tang, J. Chlorophyll fluorescence tracks seasonal variations of photosynthesis from leaf to canopy in a temperate forest. Glob. Chang. Biol. 2017, 23, 2874–2886. [Google Scholar] [CrossRef] [PubMed]
  25. Guo, L.; Gao, J.; Ma, S.; Chang, Q.; Zhang, L.; Wang, S.; Xiao, X. Impact of spring phenology variation on GPP and its lag feedback for winter wheat over the North China Plain. Sci. Total Environ. 2020, 725, 138342. [Google Scholar] [CrossRef]
  26. Reeves, M.C.; Zhao, M.; Running, S.W. Usefulness and limits of MODIS GPP for estimating wheat yield. Int. J. Remote Sens. 2005, 26, 1403–1421. [Google Scholar] [CrossRef]
  27. Bureau, Henan Statistics. Henan Statistical Yearbook; China Statistics Press: Beijing, China, 2007–2017. [Google Scholar]
  28. Klugman, S.A.; Panjer, H.H.; Willmot, G.E. Loss Models: From Data to Decisions; John Wiley & Sons: Hoboken, NJ, USA, 2004; pp. 557–560. [Google Scholar]
  29. Boucher, J.-P. Multiple Bonus–Malus Scale Models for Insureds of Different Sizes. Risks 2022, 10, 152. [Google Scholar] [CrossRef]
  30. Bouslihim, Y.; Kharrou, M.H.; Miftah, A.; Attou, T.; Bouchaou, L.; Chehbouni, A. Comparing Pan-sharpened Landsat-9 and Sentinel-2 for Land-Use Classification Using Machine Learning Classifiers. J. Geovis. Spat. Anal. 2022, 6, 35. [Google Scholar] [CrossRef]
  31. Li, X.; Ren, J.; Niu, B.; Wu, H. Grain Area Yield Index Insurance Ratemaking Based on Time–Space Risk Adjustment in China. Sustainability 2020, 12, 2491. [Google Scholar] [CrossRef]
  32. Chan, S.; Nadarajah, S. Risk: An R package for financial risk measures. Comput. Econ. 2019, 53, 1337–1351. [Google Scholar] [CrossRef]
  33. Zhou, M.; Zhang, H.; Ke, N. Cultivated Land Transfer, Management Scale, and Cultivated Land Green Utilization Efficiency in China: Based on Intermediary and Threshold Models. Int. J. Environ. Res. Public Health 2022, 19, 12786. [Google Scholar] [CrossRef]
  34. Romano, S.; Hedley, N. Daylighting Past Realities: Making Historical Social Injustice Visible Again Using HGIS-Based Virtual and Mixed Reality Experiences. J. Geovis. Spat. Anal. 2021, 5, 8. [Google Scholar] [CrossRef]
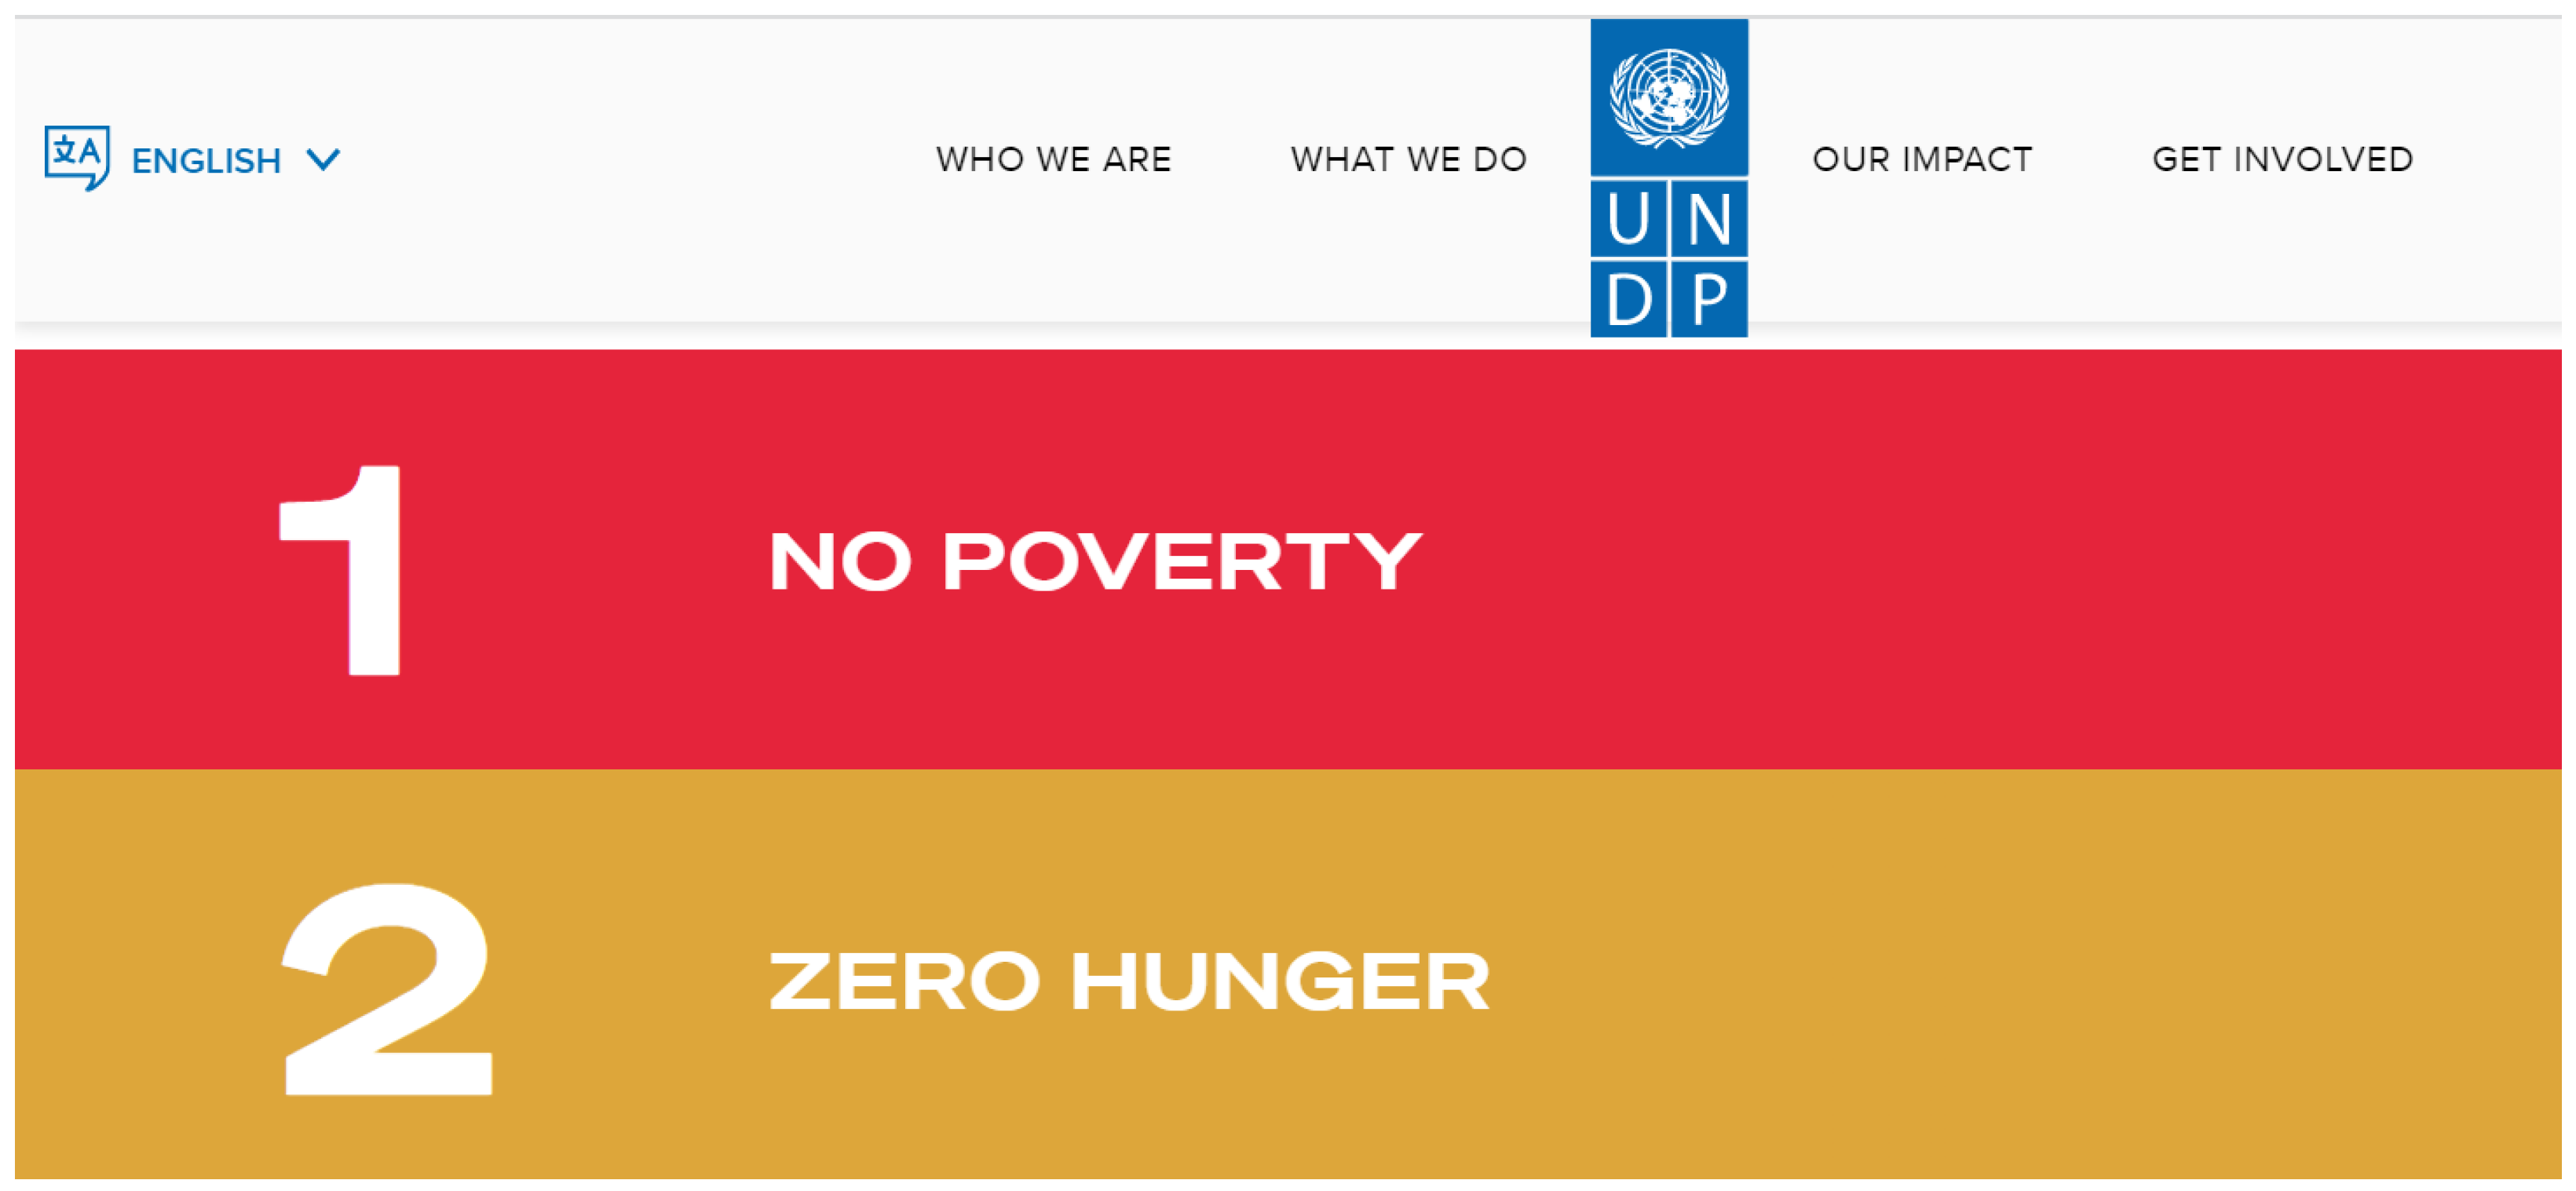
Figure 1. Official website of the Sustainable Development Goals.
Sustainability 15 07133 g001
Figure 2. Location of Heze in Shandong.
Sustainability 15 07133 g002
Figure 3. Data processing flowchart.
Sustainability 15 07133 g003
Figure 4. Accumulated GPP analog yield data in Heze from 2007 to 2017.
Sustainability 15 07133 g004
Figure 5. Map of the proportion of winter wheat cultivated land area in Heze (2007–2017).
Sustainability 15 07133 g005
Figure 6. Map of the winter wheat pure premium insurance rates in Heze.
Sustainability 15 07133 g006
Figure 7. Distribution of 2017 experimental area classification sampling point.
Sustainability 15 07133 g007
Figure 8. The 2018 distribution map of pure premium insurance rates for winter wheat in Heze: (a) remote sensing result; (b) traditional statistical result.
Sustainability 15 07133 g008
Table 1. Accuracy Verification of Winter Wheat Classification Result in 2015.
Landsat-7 ETM Classification Results/Image ElementsUser Accuracy/%
Winter WheatOthers
GF-1 classification result/image elementWinter wheat4131296.0
Others1715892.9
Disclaimer/Publisher’s Note: The statements, opinions and data contained in all publications are solely those of the individual author(s) and contributor(s) and not of MDPI and/or the editor(s). MDPI and/or the editor(s) disclaim responsibility for any injury to people or property resulting from any ideas, methods, instructions or products referred to in the content.