Review

An Evaluation of ASEAN Renewable Energy Path to Carbon Neutrality

1
Faculty of Integrated Technologies, Universiti Brunei Darussalam, Brunei Darussalam, Gadong BE1410, Brunei
2
School of Digital Science, Universiti Brunei Darussalam, Brunei Darussalam, Gadong BE1410, Brunei
3
Modeling Evolutionary Algorithms Simulation and Artificial Intelligence, Faculty of Electrical & Electronics Engineering, Ton Duc Thang University, Ho Chi Minh City 721400, Vietnam
4
Department of Electrical Engineering and Industrial Automation, Engineering Institute of Technology, Melbourne, VIC 3283, Australia
*
Authors to whom correspondence should be addressed.
Sustainability 2023, 15(8), 6961; https://doi.org/10.3390/su15086961
Submission received: 9 January 2023 / Revised: 4 March 2023 / Accepted: 19 March 2023 / Published: 20 April 2023
(This article belongs to the Special Issue Optimized Design of Hybrid Microgrid)

Abstract

:
Maintaining our standard of living and keeping the economy running smoothly is heavily reliant on a consistent supply of energy. Renewable energy systems create abundant energy by utilizing resources such as the sun, wind, earth, and plants. The demand for renewable energy is increasing, despite power scarcity, pollution, and climate change posing challenges to long-term development in the Association of Southeast Asian Nations (ASEAN), which has seen significant social and economic growth in recent years. To achieve its 23% renewable energy (RE) target, ASEAN can develop solar photovoltaic (PV) electricity. Members of the ASEAN have established regulations and incentives to encourage individuals and businesses to use renewable energy in the future. This paper explores Southeast Asian countries’ comprehensive fossil-free energy options, the region’s renewable energy potential, current capacity, goals, and energy needs. Through the ASEAN Plan of Action for Energy Cooperation (APAEC) 2016–2025 and the ASEAN Declaration on Renewable Energy, ASEAN is committed to reducing its greenhouse gas emissions and promoting sustainable development aligning with the Paris Agreement’s aim to limit global warming to well below 2 degrees Celsius above pre-industrial levels. Results show that decarbonizing the region’s energy system is possible, but current policies and actions must be altered to reach that target level. Further research is necessary to optimize the ASEAN region’s renewable resource technical potential and commercial viability with available technology.

1. Introduction

Energy demands are constantly increasing as a result of rapid industrial expansion. In 2015, fossil fuel burning accounted for 74% of worldwide anthropogenic greenhouse gas emissions. The decarbonization of power production and the electrification of end-use sectors have been highlighted as essential for decarbonizing the entire energy system in energy transition strategies to reduce the risks of global warming [1]. Governments around the world have been developing rules and policies to encourage ecologically friendly renewable energy (RE) generation, conservation practices, and technological advances [2]. Pathways to limit the global temperature rise to 1.5 degrees Celsius, following the Paris Agreement’s Long-Term Temperature Goal and achievement of the Sustainable Development Goals, entail energy system transitions with significant renewable uptake by 2050. Designing sustainable energy policies and offering end users relevant and appropriate policy suggestions is critical [3,4].
The Association of Southeast Asian Nations (ASEAN) seeks to attain the 23% renewable energy objective in total primary energy supply in the next five years since renewable energy (RE) is a fast-growing business in the region due to its declining trend in generating costs in recent years. Renewables accounted for 31.4% of total power capacity in 2020, while 166 GW must be operational by 2025 to meet the regional objective [5]. Due to COVID-19, investment in RE development has been limited to overcome national financial difficulties. Overall energy consumption may decrease due to behavioral changes such as working from home and lowering carbon emissions. The pandemic has significantly influenced RE market dynamics, affecting all stakeholders along the value chain. The disruption in the supplier value chain, compounded by the global economic downturn, puts projects in the development pipeline at risk.
Even though solar has lately been the region’s fastest growing RE source, ASEAN has remained strongly reliant on equipment manufacturers and raw materials from China since the start of the pandemic. There was a shortage of both material and PV equipment in the ASEAN market, resulting in the shutdown of solar panel facilities. The commissioning of a 135 MW solar project in the Philippines has been delayed due to the reliance on Chinese solar PV modules. After Indonesia, Malaysia is Asia’s second largest exporter of palm kernel shells (PKS) and wood pellets. The stoppage of palm oil factories jeopardizes biomass supplies as the country has been in lockdown since mid-March. To maintain the current pace and meet the Paris Agreement objectives, ASEAN governments and energy enterprises must restructure their policies as well as strategies [6]. Existing research provides no insight regarding how a feasible framework is important to supporting as well as accomplishing further RE goals. By implementing different policies as well as monitoring renewable resources, problems, concerns, and conflicts for huge sustainability, dependability, and energy security for the growth of renewable energy in ASEAN are highlighted. As a result, using a qualitative technique, this article gives an up-to-date assessment of renewable energy technology, factors impacting renewable energy, and ASEAN policies. This study constitutes a secondary research examination, utilizing the scientific method to review and analyze existing data and literature in order to determine a path towards carbon neutrality in the ASEAN region. The development and promotion of RE to meet the energy demands of future generations have been described, with a particular emphasis on post COVID-19 scenarios.

2. Renewable Energy Potential and Installed Capacity in the ASEAN

Although many untapped renewable resources exist in the ASEAN region, fossil fuels currently dominate the region’s energy systems. To tackle climate change, nine of ASEAN’s ten member states want to achieve net zero emissions by 2050 or later. A compact scenario of the country-wise energy status is depicted in Figure 1.
The following data provides an overview of the percentage of various RE sources in various ASEAN countries. The data highlights each country’s main RE sources, such as hydroelectric power, geothermal power, biomass power, solar power, and wind power. The data is presented in a table format, making it simple to compare and understand the various RE sources in each country. The data is gathered based on the percentage of RE sources generated by each country and is provided as an approximation. This information can be used to better understand the current state of RE in the ASEAN region and to identify potential opportunities for future growth (Table 1).

2.1. Solar PV

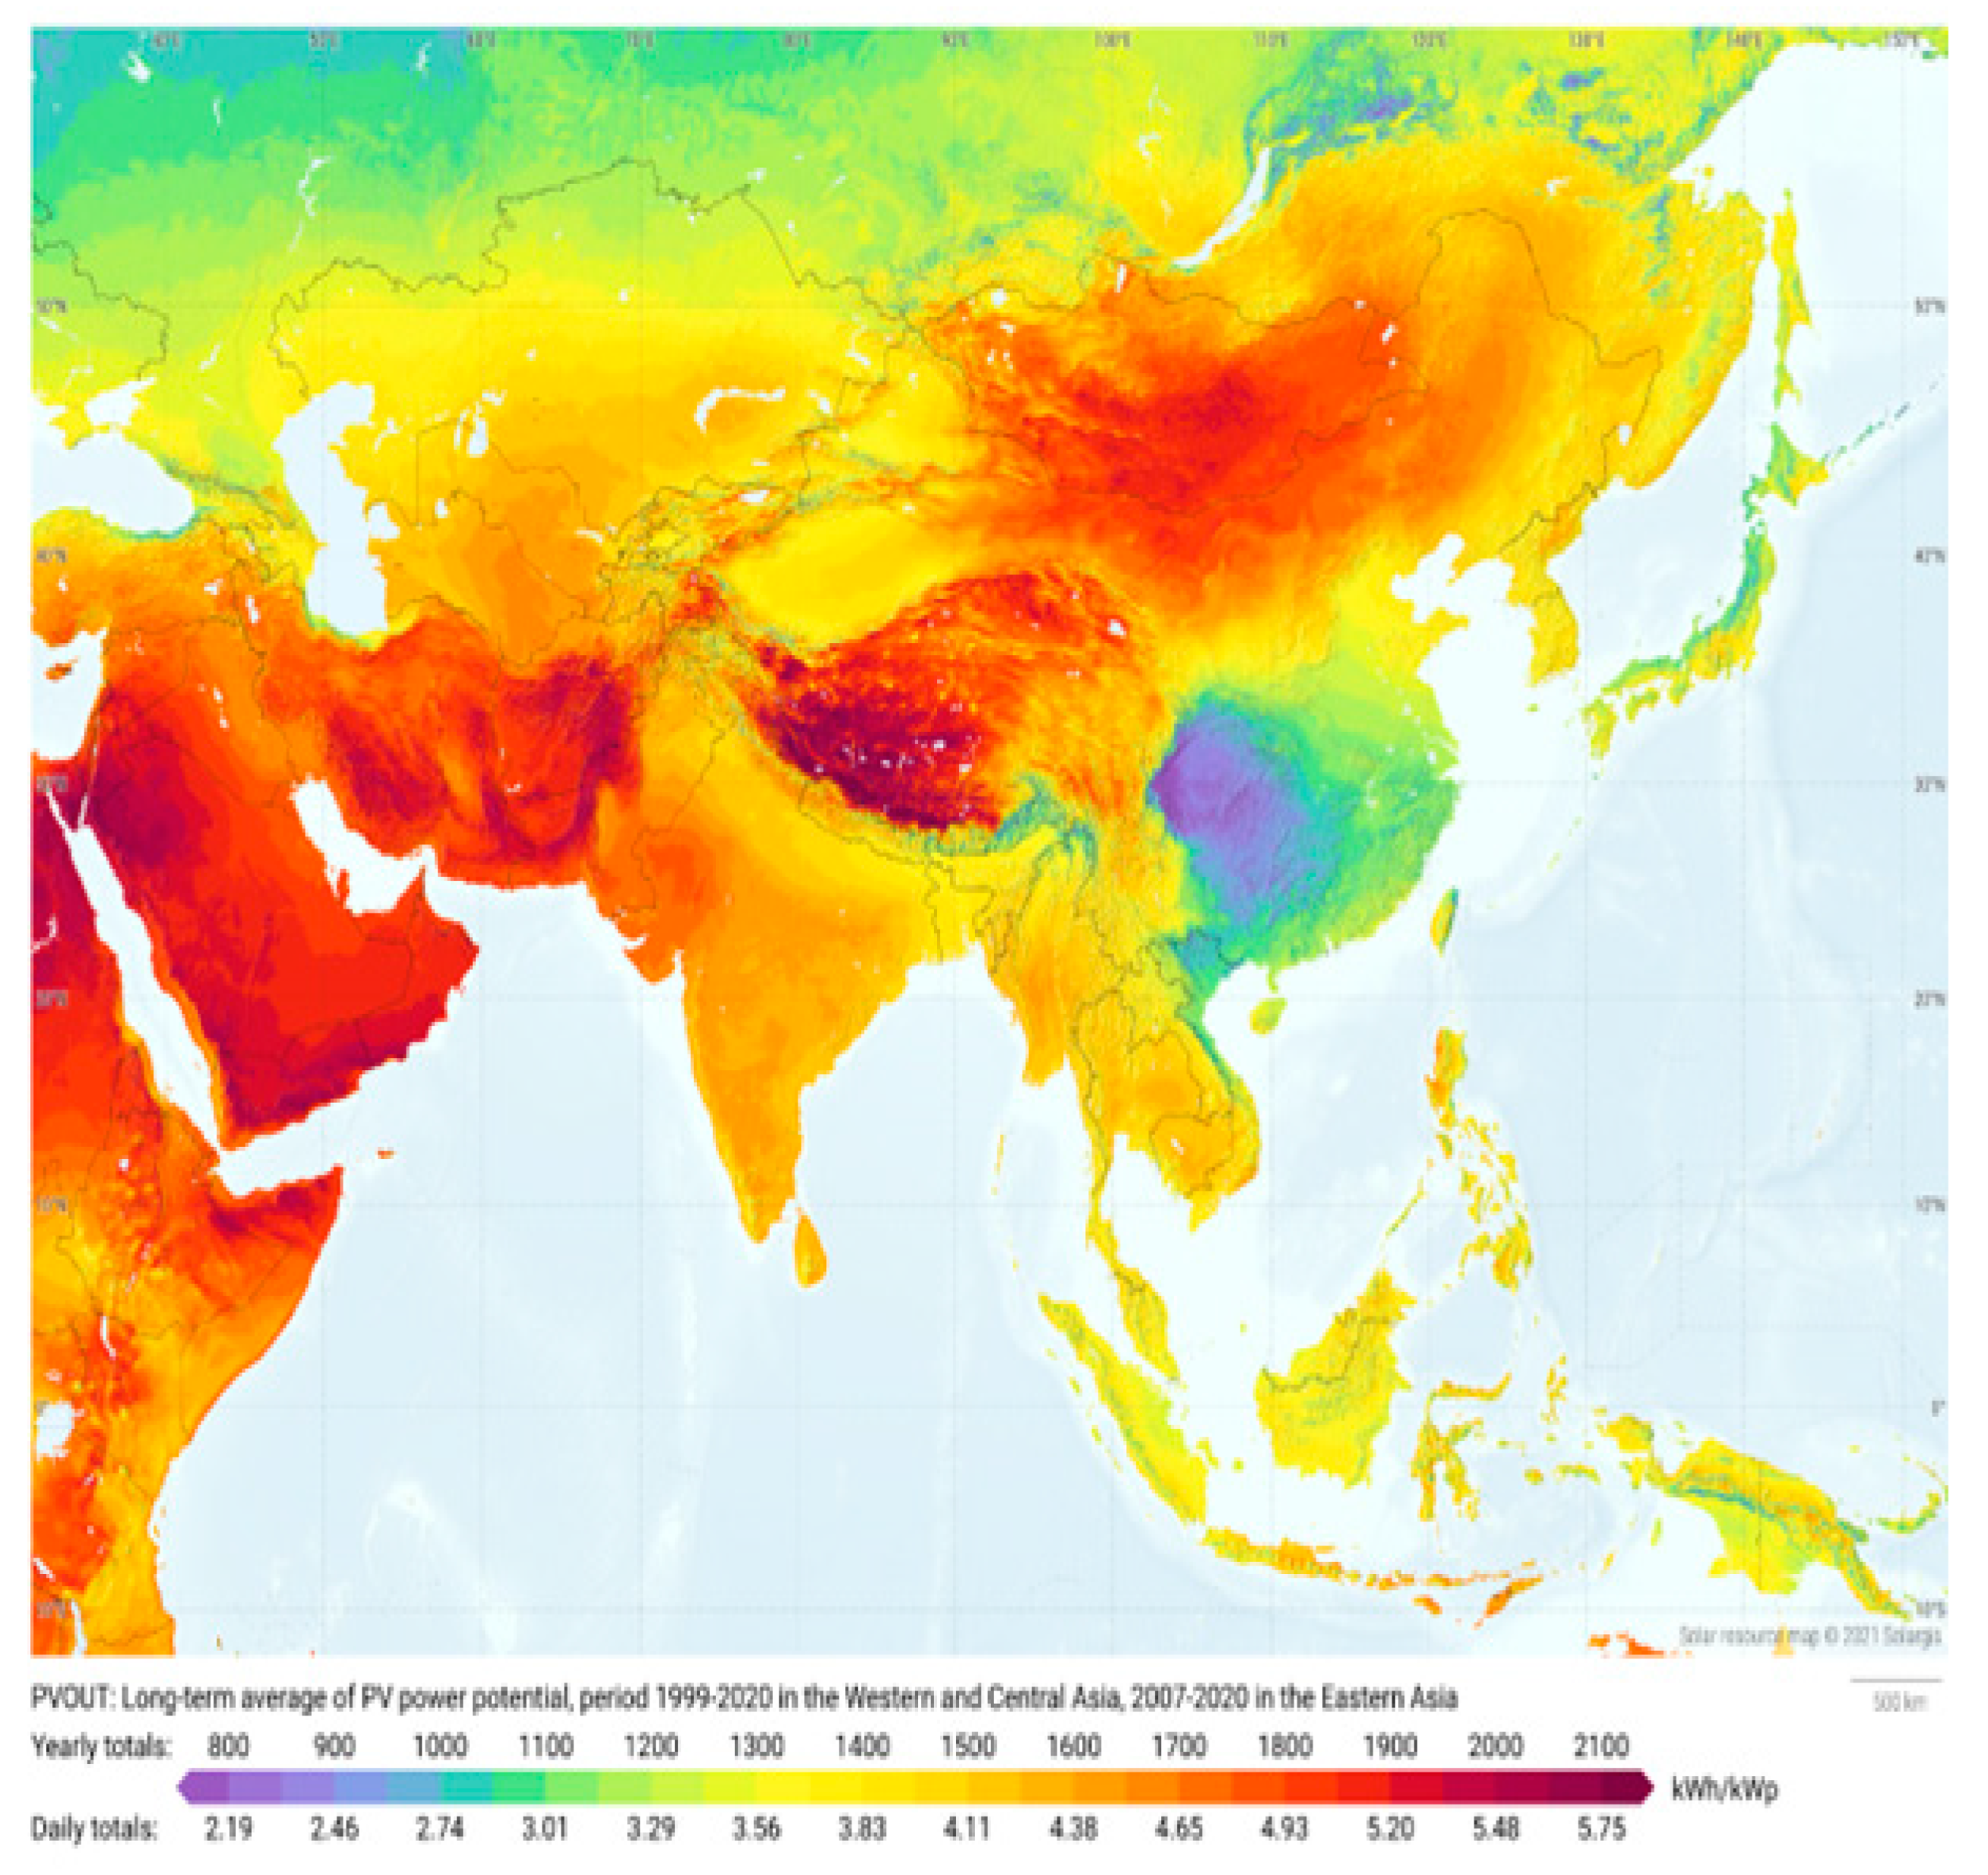
Figure 2 shows a map of Asia’s solar energy potential. It is evident that although Southeast Asia has a moderate solar potential, it lags behind other parts of Asia, such as western China. Solar PV also requires a lot of land, which is difficult in the highly populated ASEAN region. In addition, solar PV has a low-capacity factor of 10–20% due to the limited availability of sunshine at night. As a result, more installed solar PV capacity is required for the same unit of electricity generation compared to other energy sources. An analysis of Figure 2 reveals a deficiency in the potential for solar power generation in ASEAN countries. It follows, therefore, that the installation of additional power generation capacity would serve as a solution to this problem.
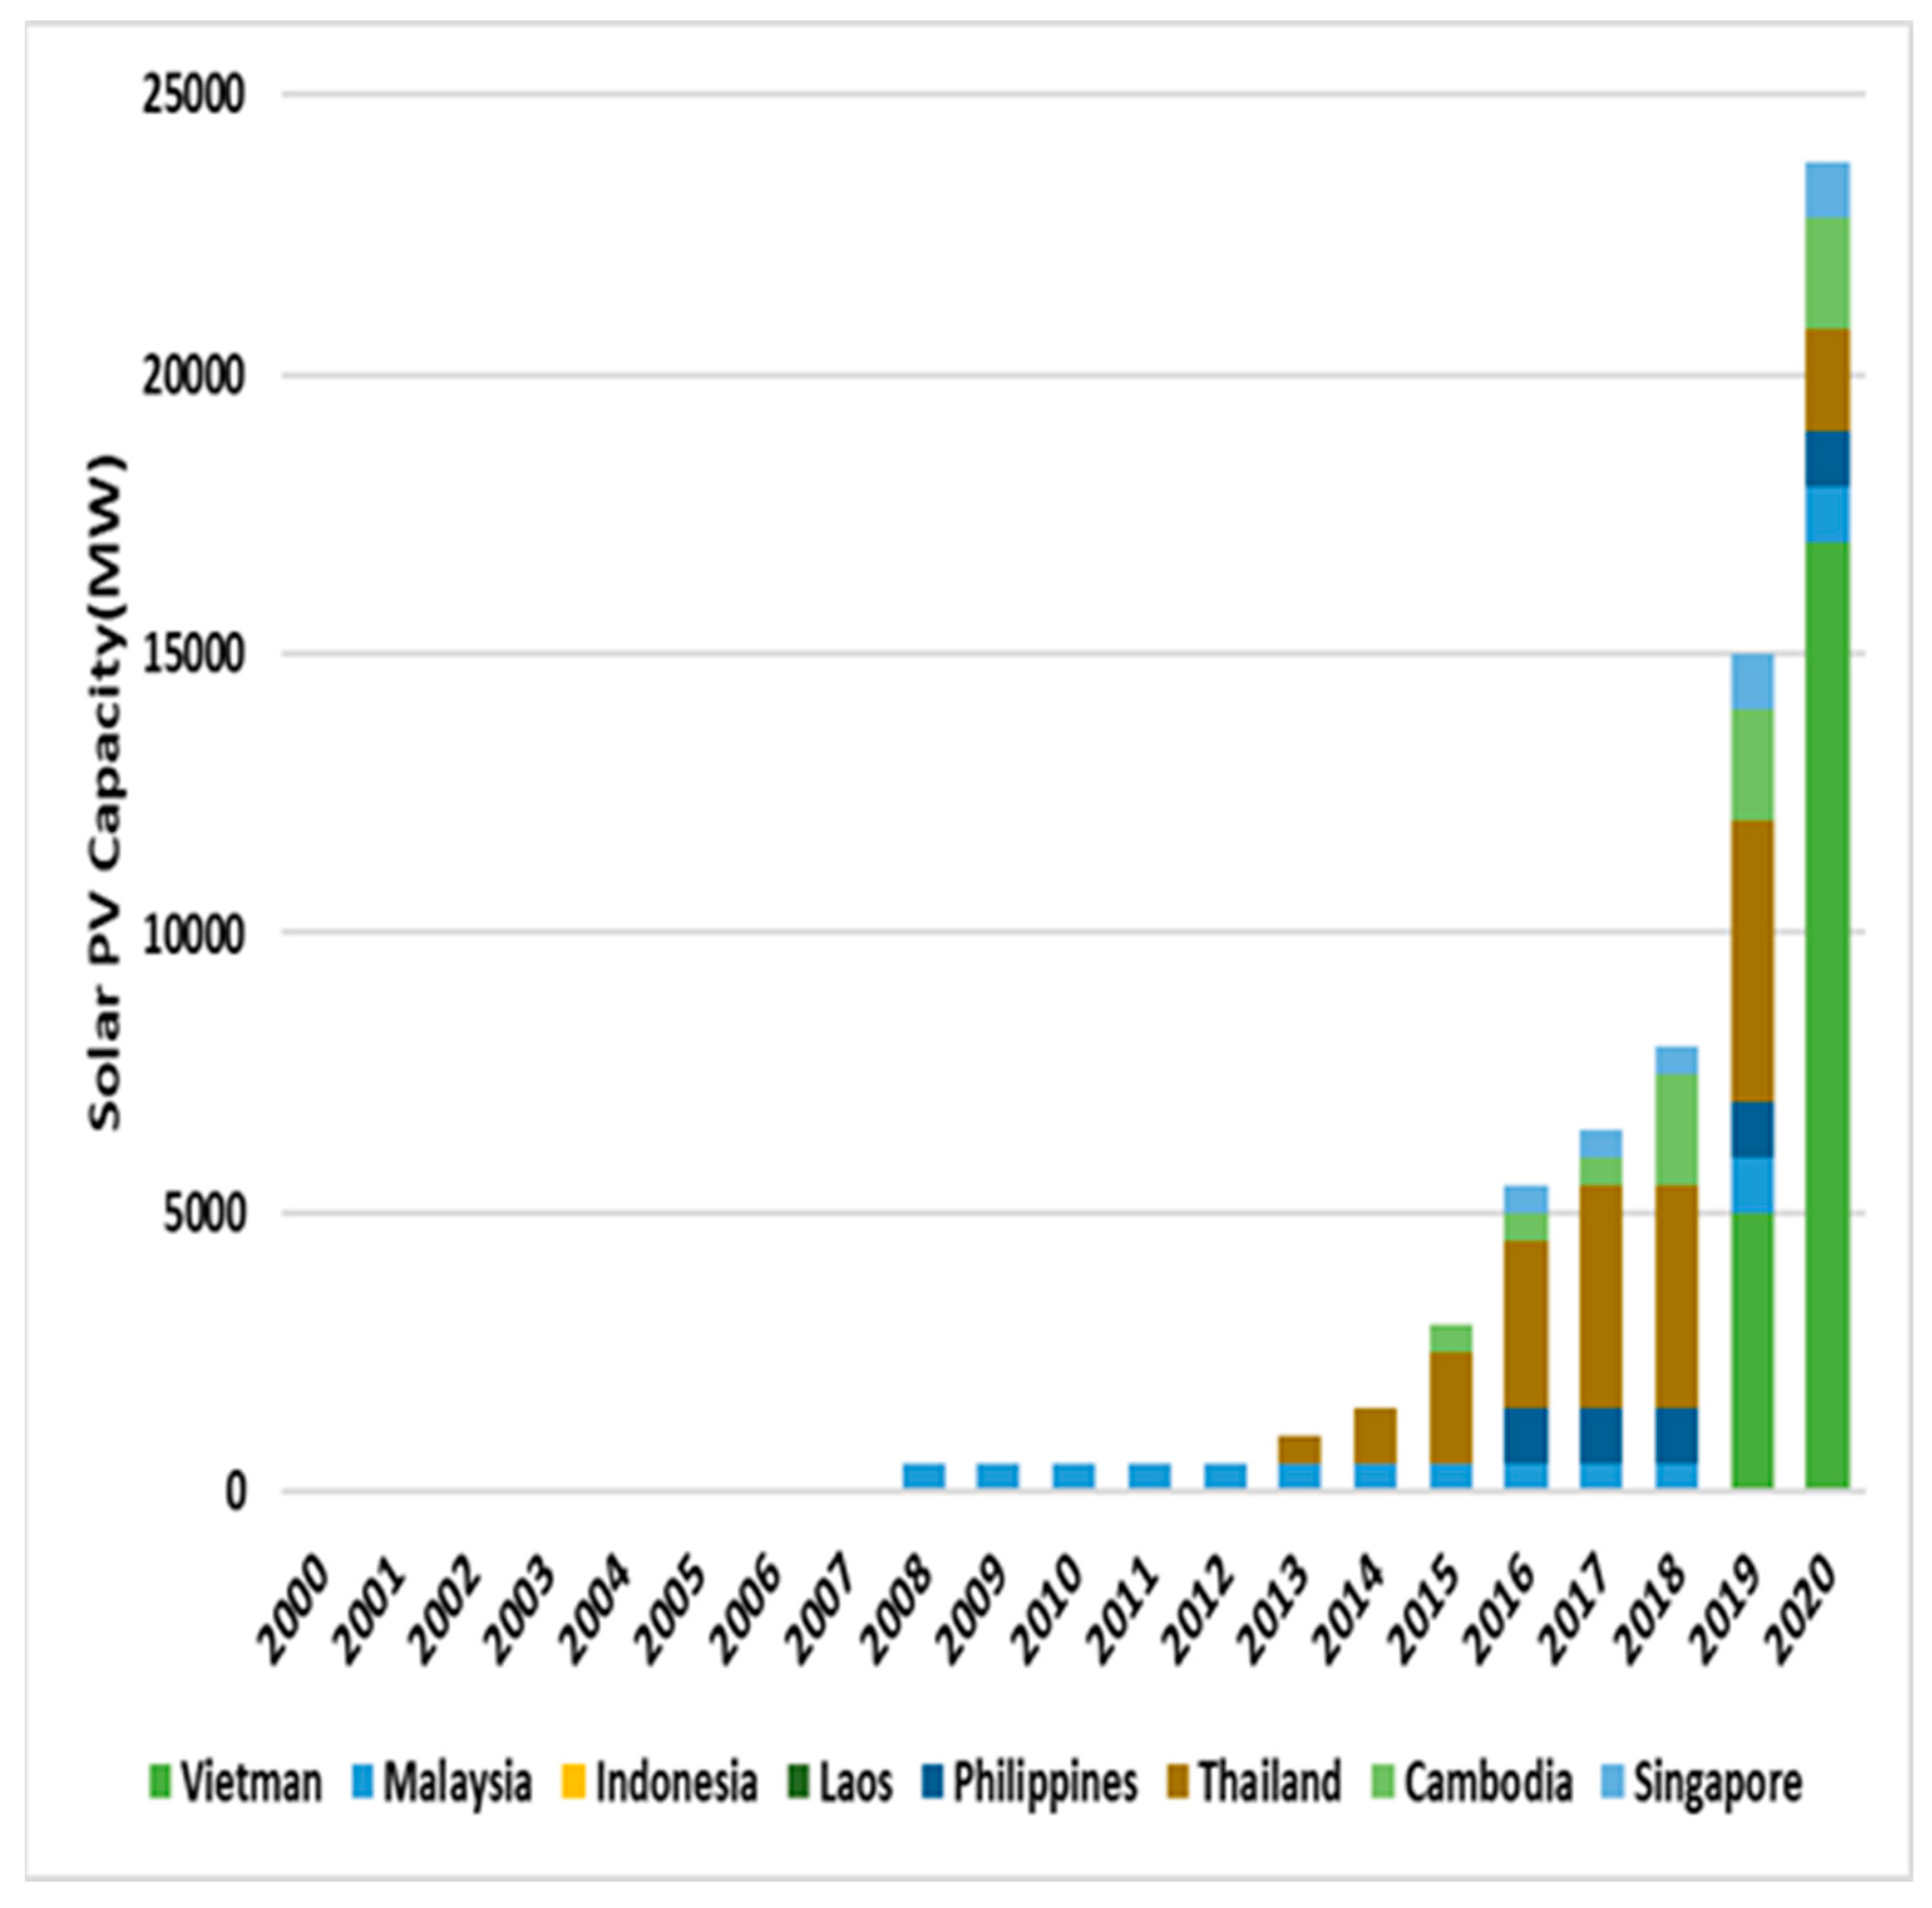
Figure 3 depicts the history of solar PV installations in ASEAN [10]. A solar PV installation refers to the process of installing a solar power system that uses photovoltaic (PV) panels to convert sunlight into electricity. Thailand and Vietnam have the largest installed solar PV capacity in ASEAN. In 2019, solar PV was installed for the first time in Vietnam. In 2020, the total installed solar PV capacity in ASEAN was 22.8 GW (Figure 3), accounting for only 47% of hydropower capacity (Figure 3).
However, the limited feasibility of utilizing solar energy in the ASEAN region is a challenge due to the lack of available space and low efficiency of solar modules [11]. However, the use of solar roofing panels, which can provide both thermal and electrical energy and can be installed on rooftops, may have significant potential for implementation in the region. With improved overall efficiency and longer service life, solar energy still holds great potential for use in the ASEAN region [12].
Figure 3. History of solar PV capacity in ASEAN [13].
Sustainability 15 06961 g003

2.2. Wind Energy

Wind energy has significant potential in the ASEAN region, as many countries in the area have strong wind resources and are looking for ways to diversify their energy mix. A location's wind speeds and the size of wind turbines that could be installed there determine its wind energy capacity. The capacity factor, which is the ratio of the actual energy produced by a wind turbine to the maximum energy it is capable of producing, is also affected by wind speed, as well as other factors such as turbine design and wind turbulence. In general, areas with higher average wind speeds have more wind energy potential and are more suitable for wind turbine installation. Figure 4 indicates the wind speed map in the ASEAN region. In recent years, there has been significant growth in wind energy capacity in the region, with countries such as Vietnam, the Philippines, and Indonesia leading the way. The future of wind energy in ASEAN looks promising, as governments continue to set ambitious renewable energy (RE) targets and invest in infrastructure to support the growth of the industry. However, there are also challenges that must be addressed, such as a lack of grid infrastructure in some areas and the need for more favorable policies to attract investment. Overall, wind energy has the potential to play a significant role in meeting the energy needs of the ASEAN region and reducing dependence on fossil fuels [14].
The growth of wind power in ASEAN has not been significant, despite ongoing efforts to develop it. As of 2019, the region only had a small amount of wind power installed, representing less than 1% of the world’s total. There are several obstacles to the expansion of wind power in ASEAN, including high costs and inadequate grid infrastructure. Additionally, building wind power projects in ASEAN is more expensive than in other parts of the world due to the lack of an established industry supply chain, resulting in higher costs of importing equipment and materials [14].

2.3. Hydropower

In South and Southeast Asia, 14.5% of all electricity is generated from hydropower and the total capacity of hydropower plants is 117 GW. To meet the growing demand for electricity and export opportunities, it is expected that the hydropower capacity will increase further. This is because it is a cost-effective and flexible low-carbon power source. However, due to climate change, it is becoming more difficult to rely on hydropower in the region due to rising temperatures, unpredictable rainfall patterns, melting glaciers, and more frequent extreme weather events [16].

2.4. Geothermal

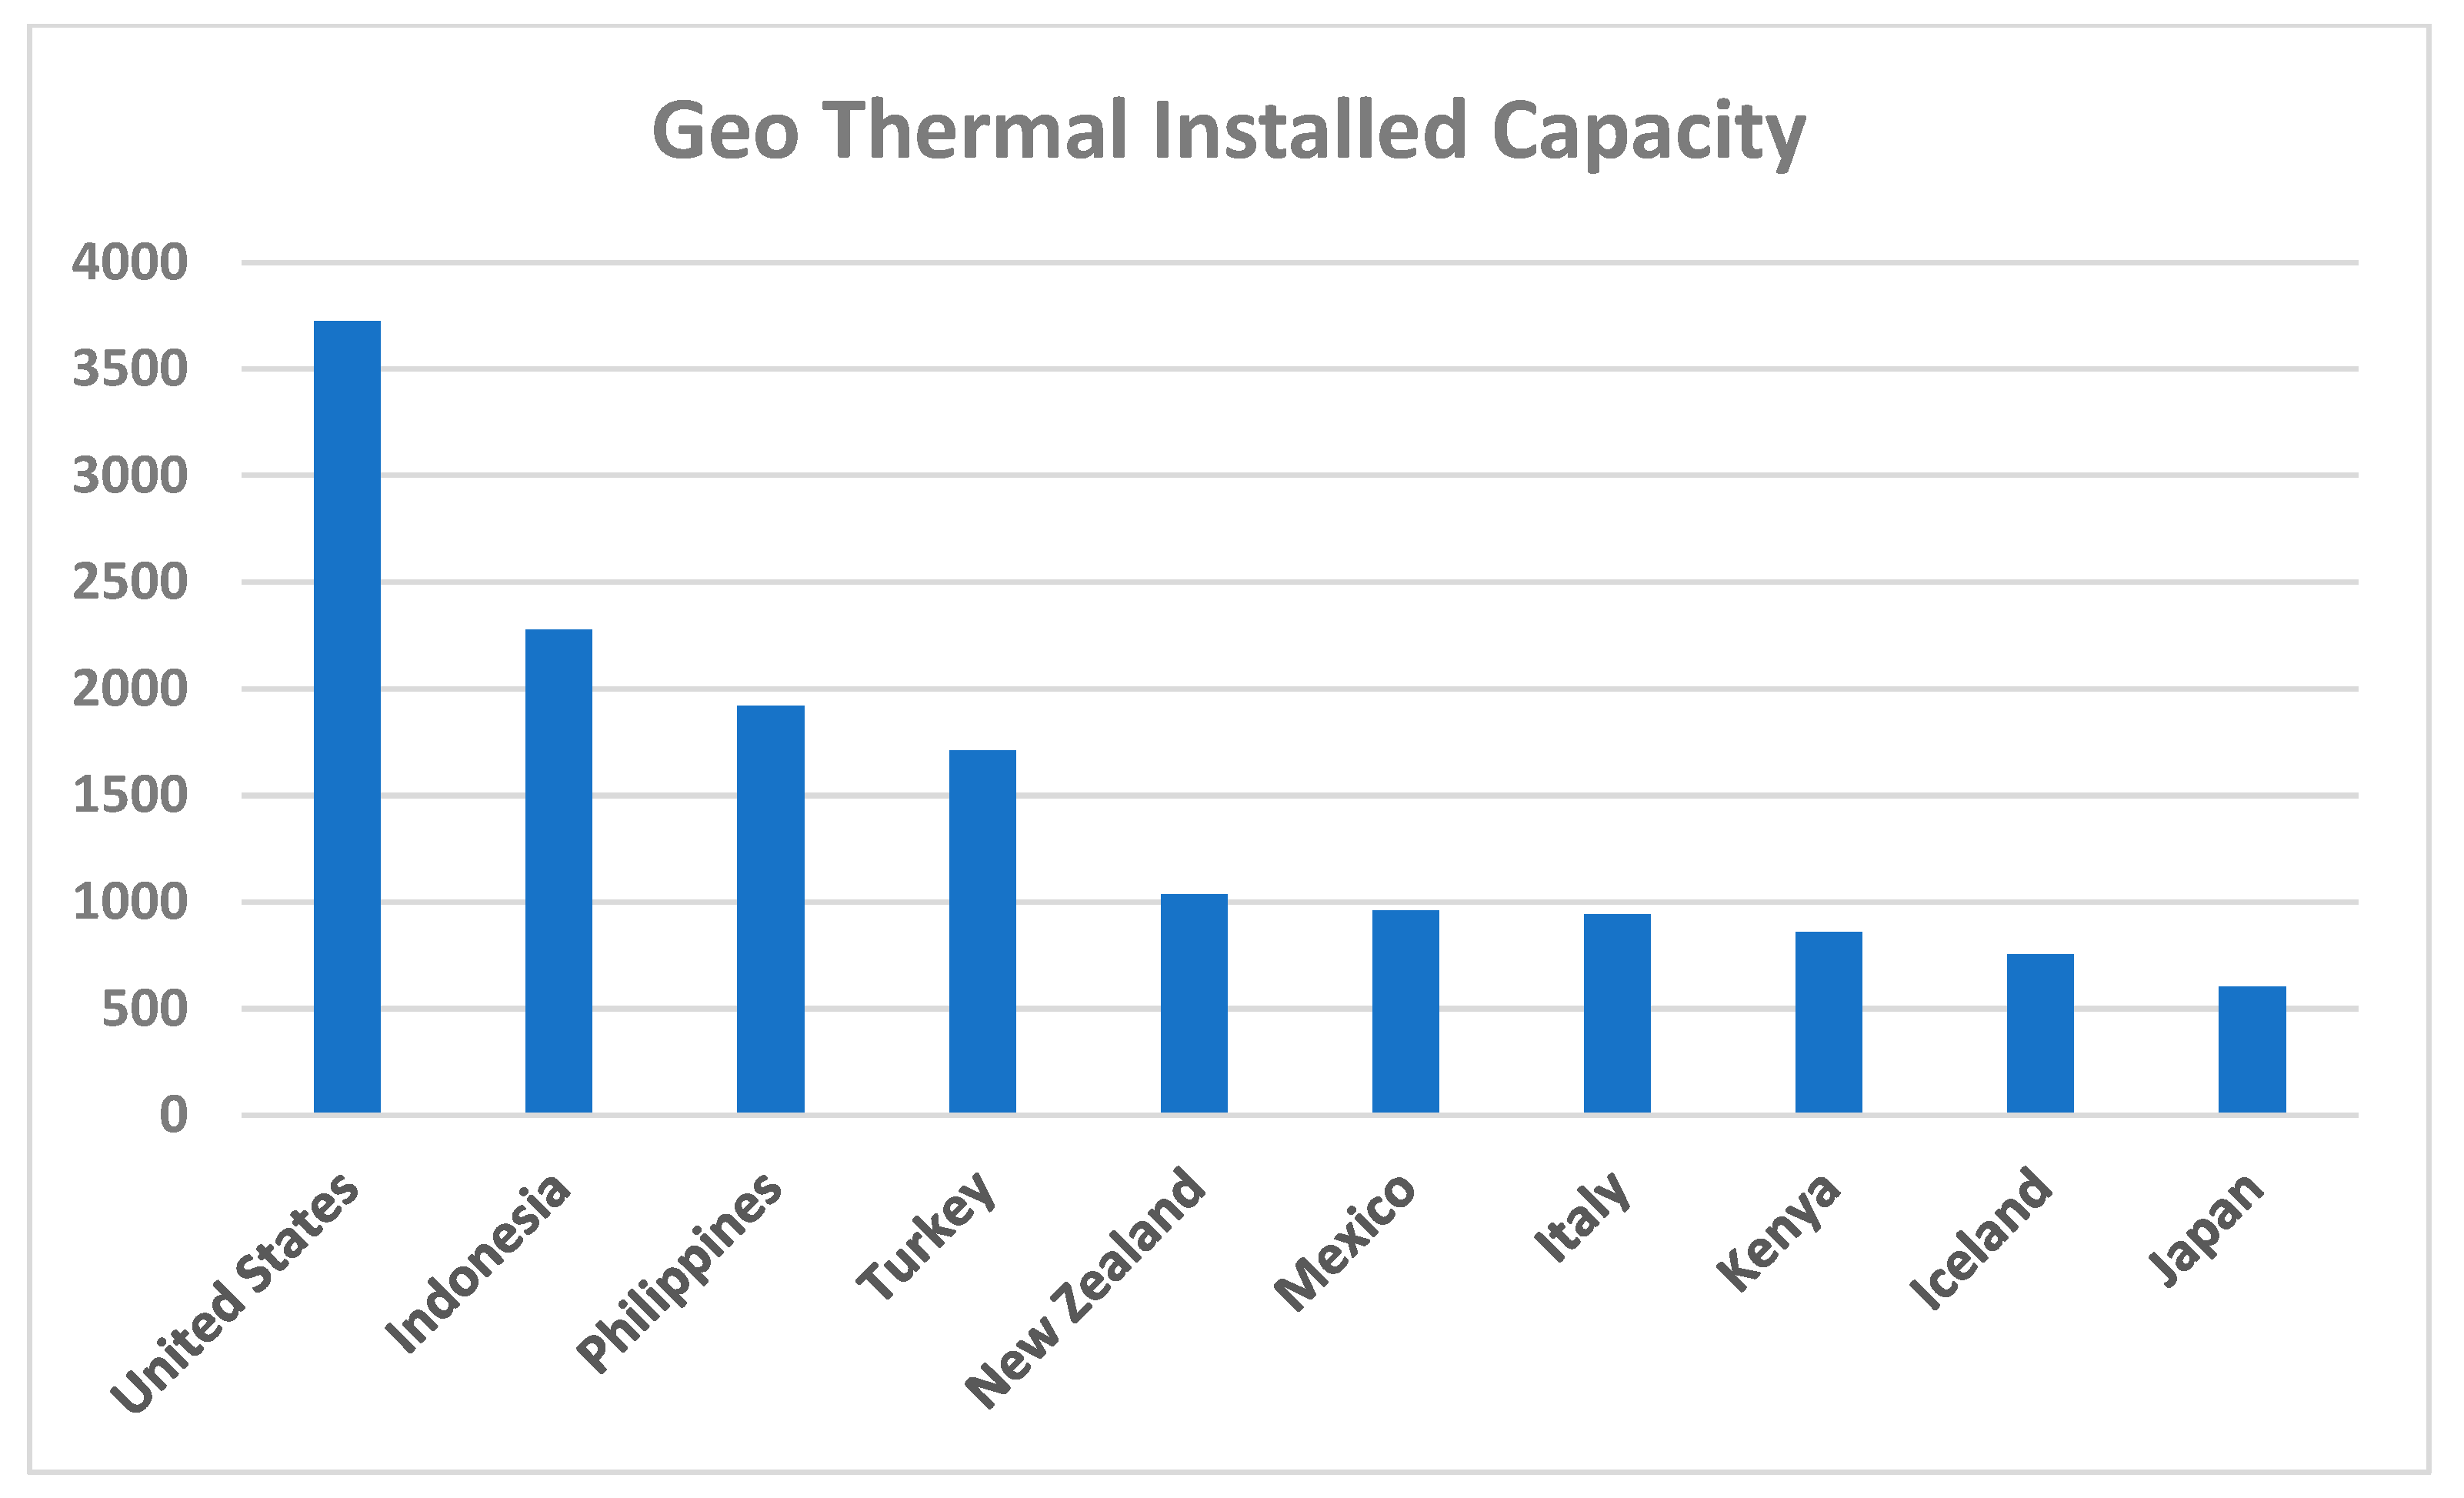
Figure 5 depicts an example of the world’s top ten geothermal countries in terms of installed capacity, which is a measure of geothermal energy potential. With the challenges of the pandemic, newcomers Colombia (small scale ORC units from co-produced oil) and Taiwan (reestablishing power generation at Qingshui with a 4.2 MW plant) joined the ranks of countries with operating geothermal power generation capacity. At the end of 2021, total installed geothermal power producing capacity was 15,854 MW, a 246 MW increase over 2020. The two ASEAN countries that have the most significant geothermal potential are Indonesia and the Philippines.
As of 2020, the global installed capacity of geothermal energy was 4.06 GW. The majority of this capacity is concentrated in a few countries, namely the United States, the Philippines, Indonesia, and Turkey, with nearly equal amounts in the Philippines and Indonesia. However, there has not been much growth in these two nations’ geothermal energy capacity in recent years even though ASEAN countries possess a significant potential for geothermal energy development, with an estimated total capacity of 29 GW. This represents a relatively small proportion of the global total, with the majority of geothermal capacity concentrated in countries such as the United States and Indonesia. Despite this, the utilization of geothermal energy in ASEAN is increasing, with several countries actively developing projects to tap into their geothermal resources. In order to fully realize the potential of geothermal energy in ASEAN, further investment and research is needed to enhance the technology and overcome the challenges faced in the exploitation of geothermal resources.

2.5. Bioenergy

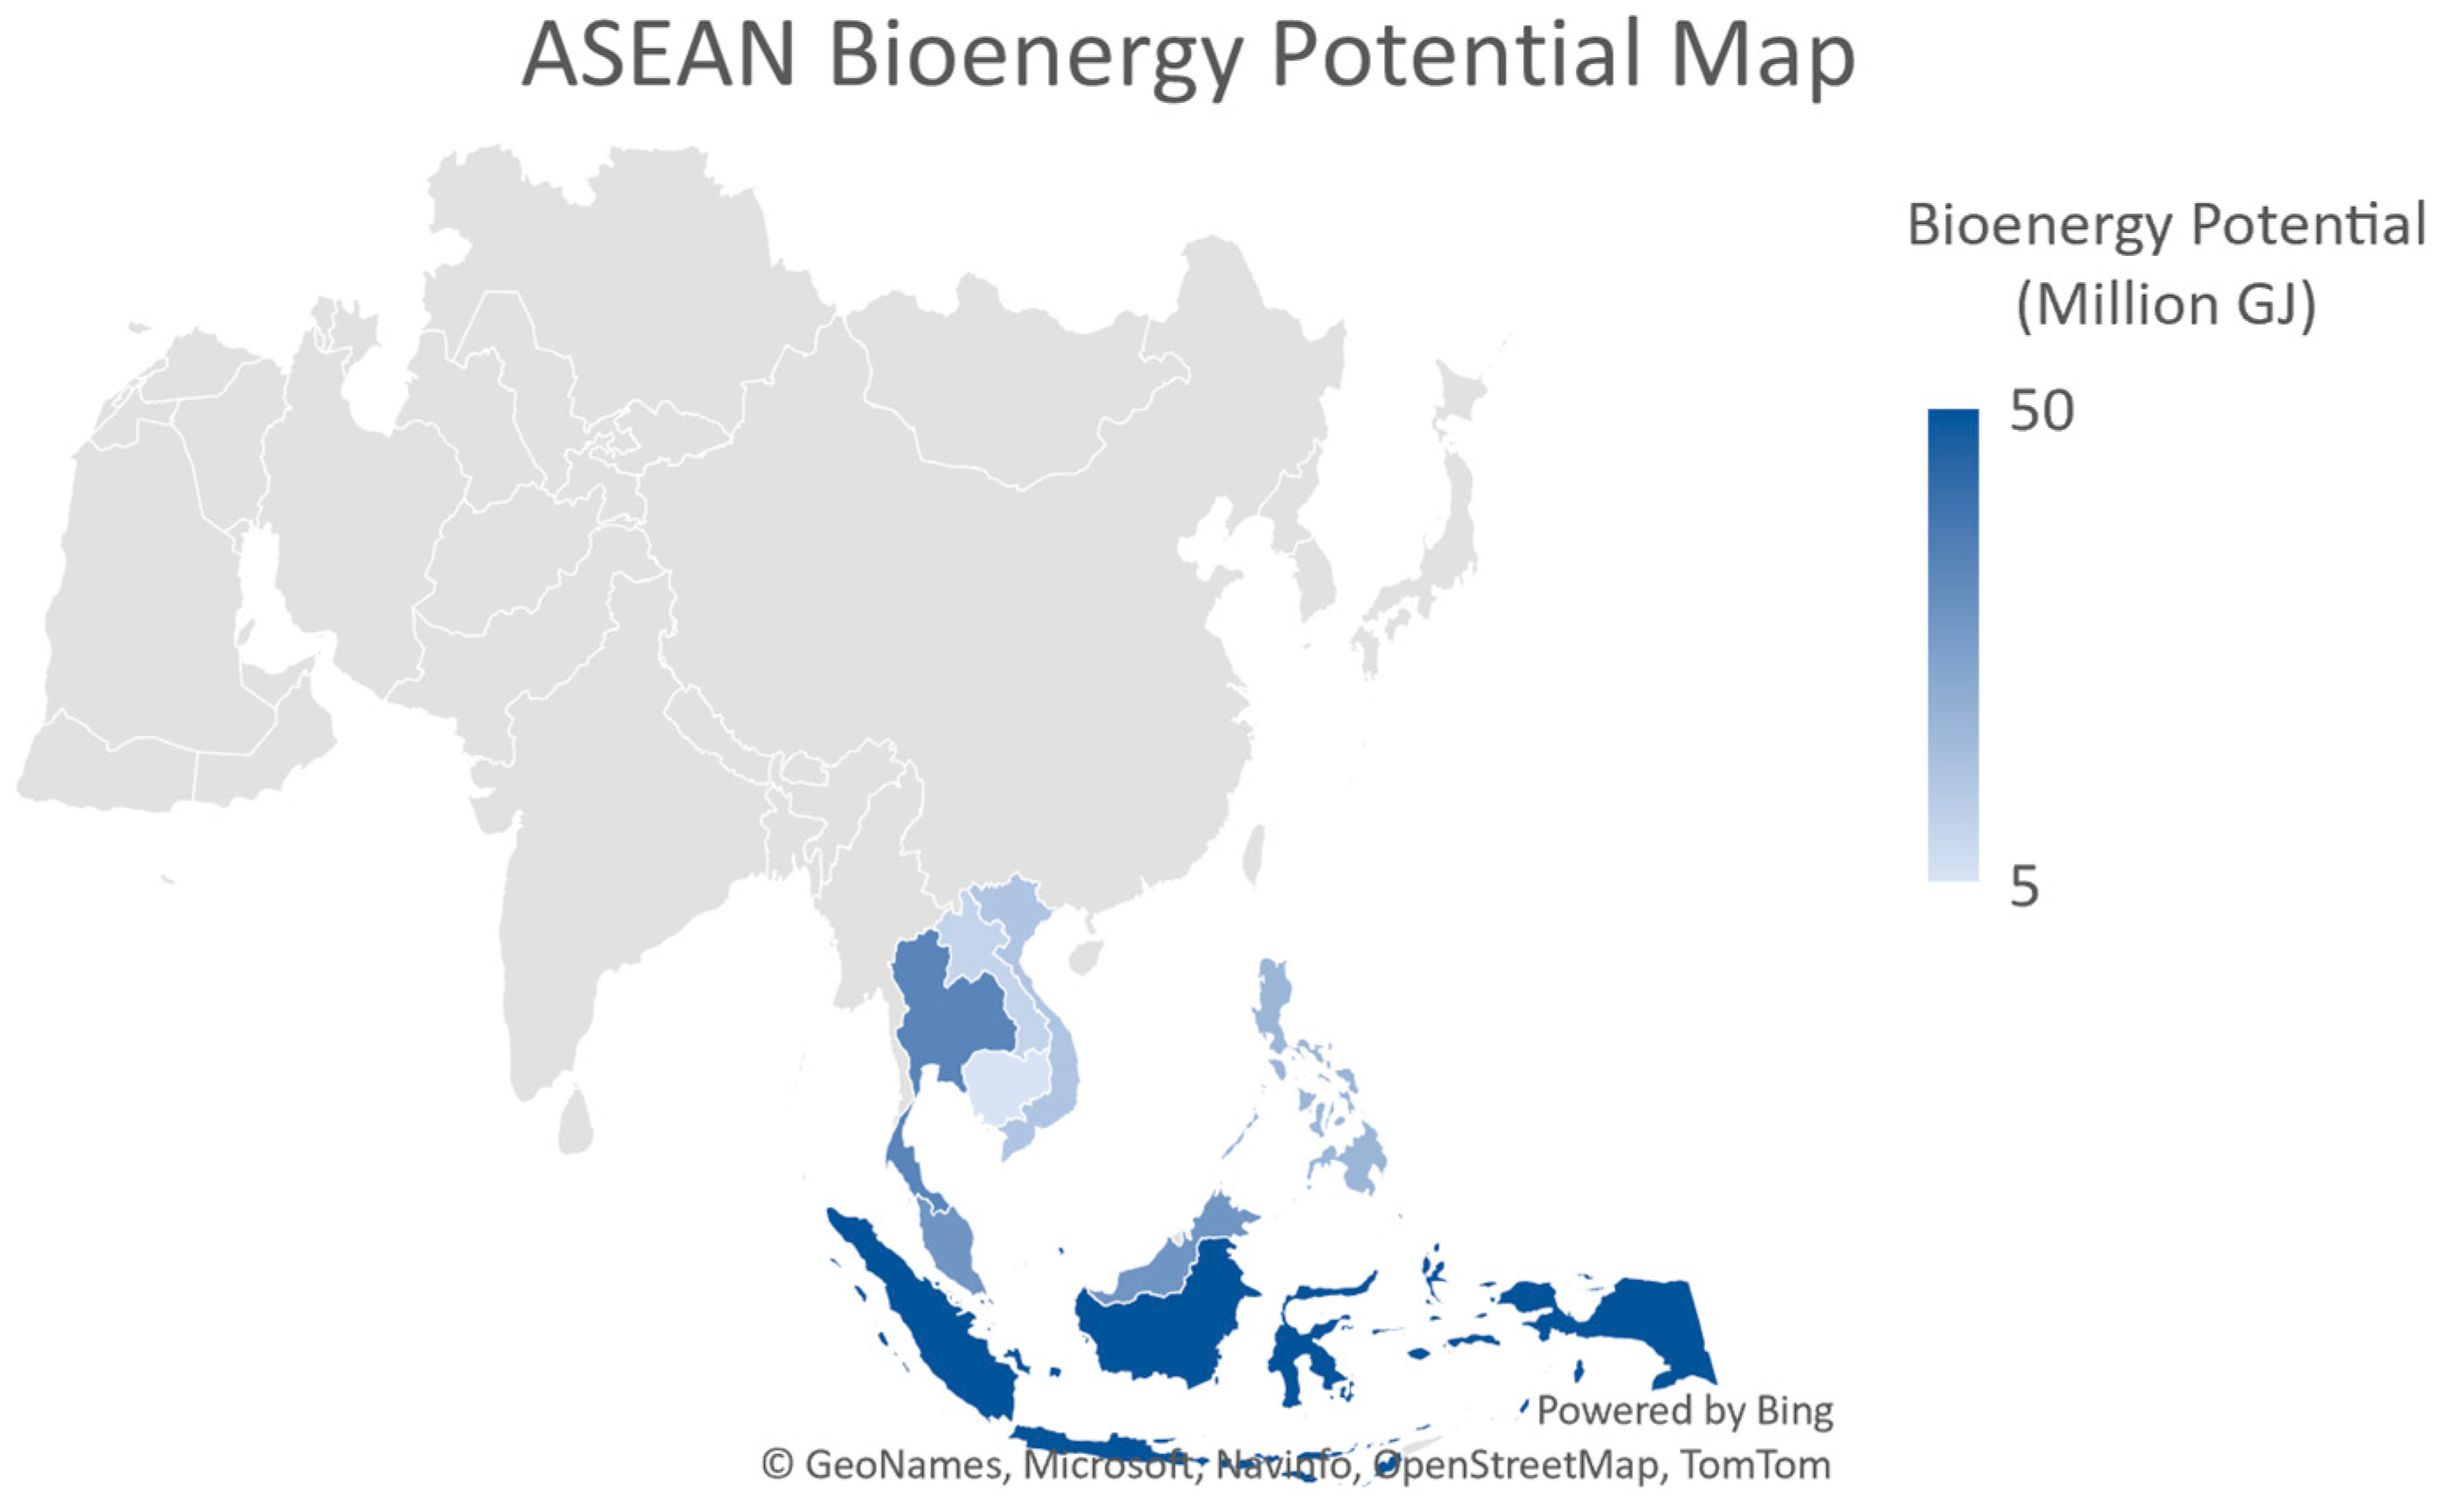
A bioenergy potential map in Figure 6 of the ASEAN countries showcases the rich natural resources and abundant land and water resources that are ideal for bioenergy production. The map indicates the countries’ varying capacities for generating electricity from biomass and biogas. The data is represented through a color-coded scale, with areas of higher potential in darker blue and lower potential in lighter blue. This map serves as a valuable resource for policymakers, investors, and researchers in the region, as it provides valuable insights into the untapped potential of bioenergy as a sustainable source of energy.
Malaysia, Indonesia, Thailand, and the Philippines have the most bioenergy potential within ASEAN [19]. In comparison to the total energy mix supply capacity, biomass energy only accounts for 8%, according to a 2012 IAE assessment. With the exception of Singapore, the majority of ASEAN members are developed agricultural nations, making this low percentage appear low in comparison to the possible sources of agricultural residue in the area. A graphical representation of the bioenergy potential across various ASEAN nations is presented in Figure 6, wherein the unit of measurement is in Million GJ.
The current biomass sources and their energy potential in Southeast Asian nations demonstrate that the region’s annual production of agricultural and forestry wastes is expected to be over 500 million tons.
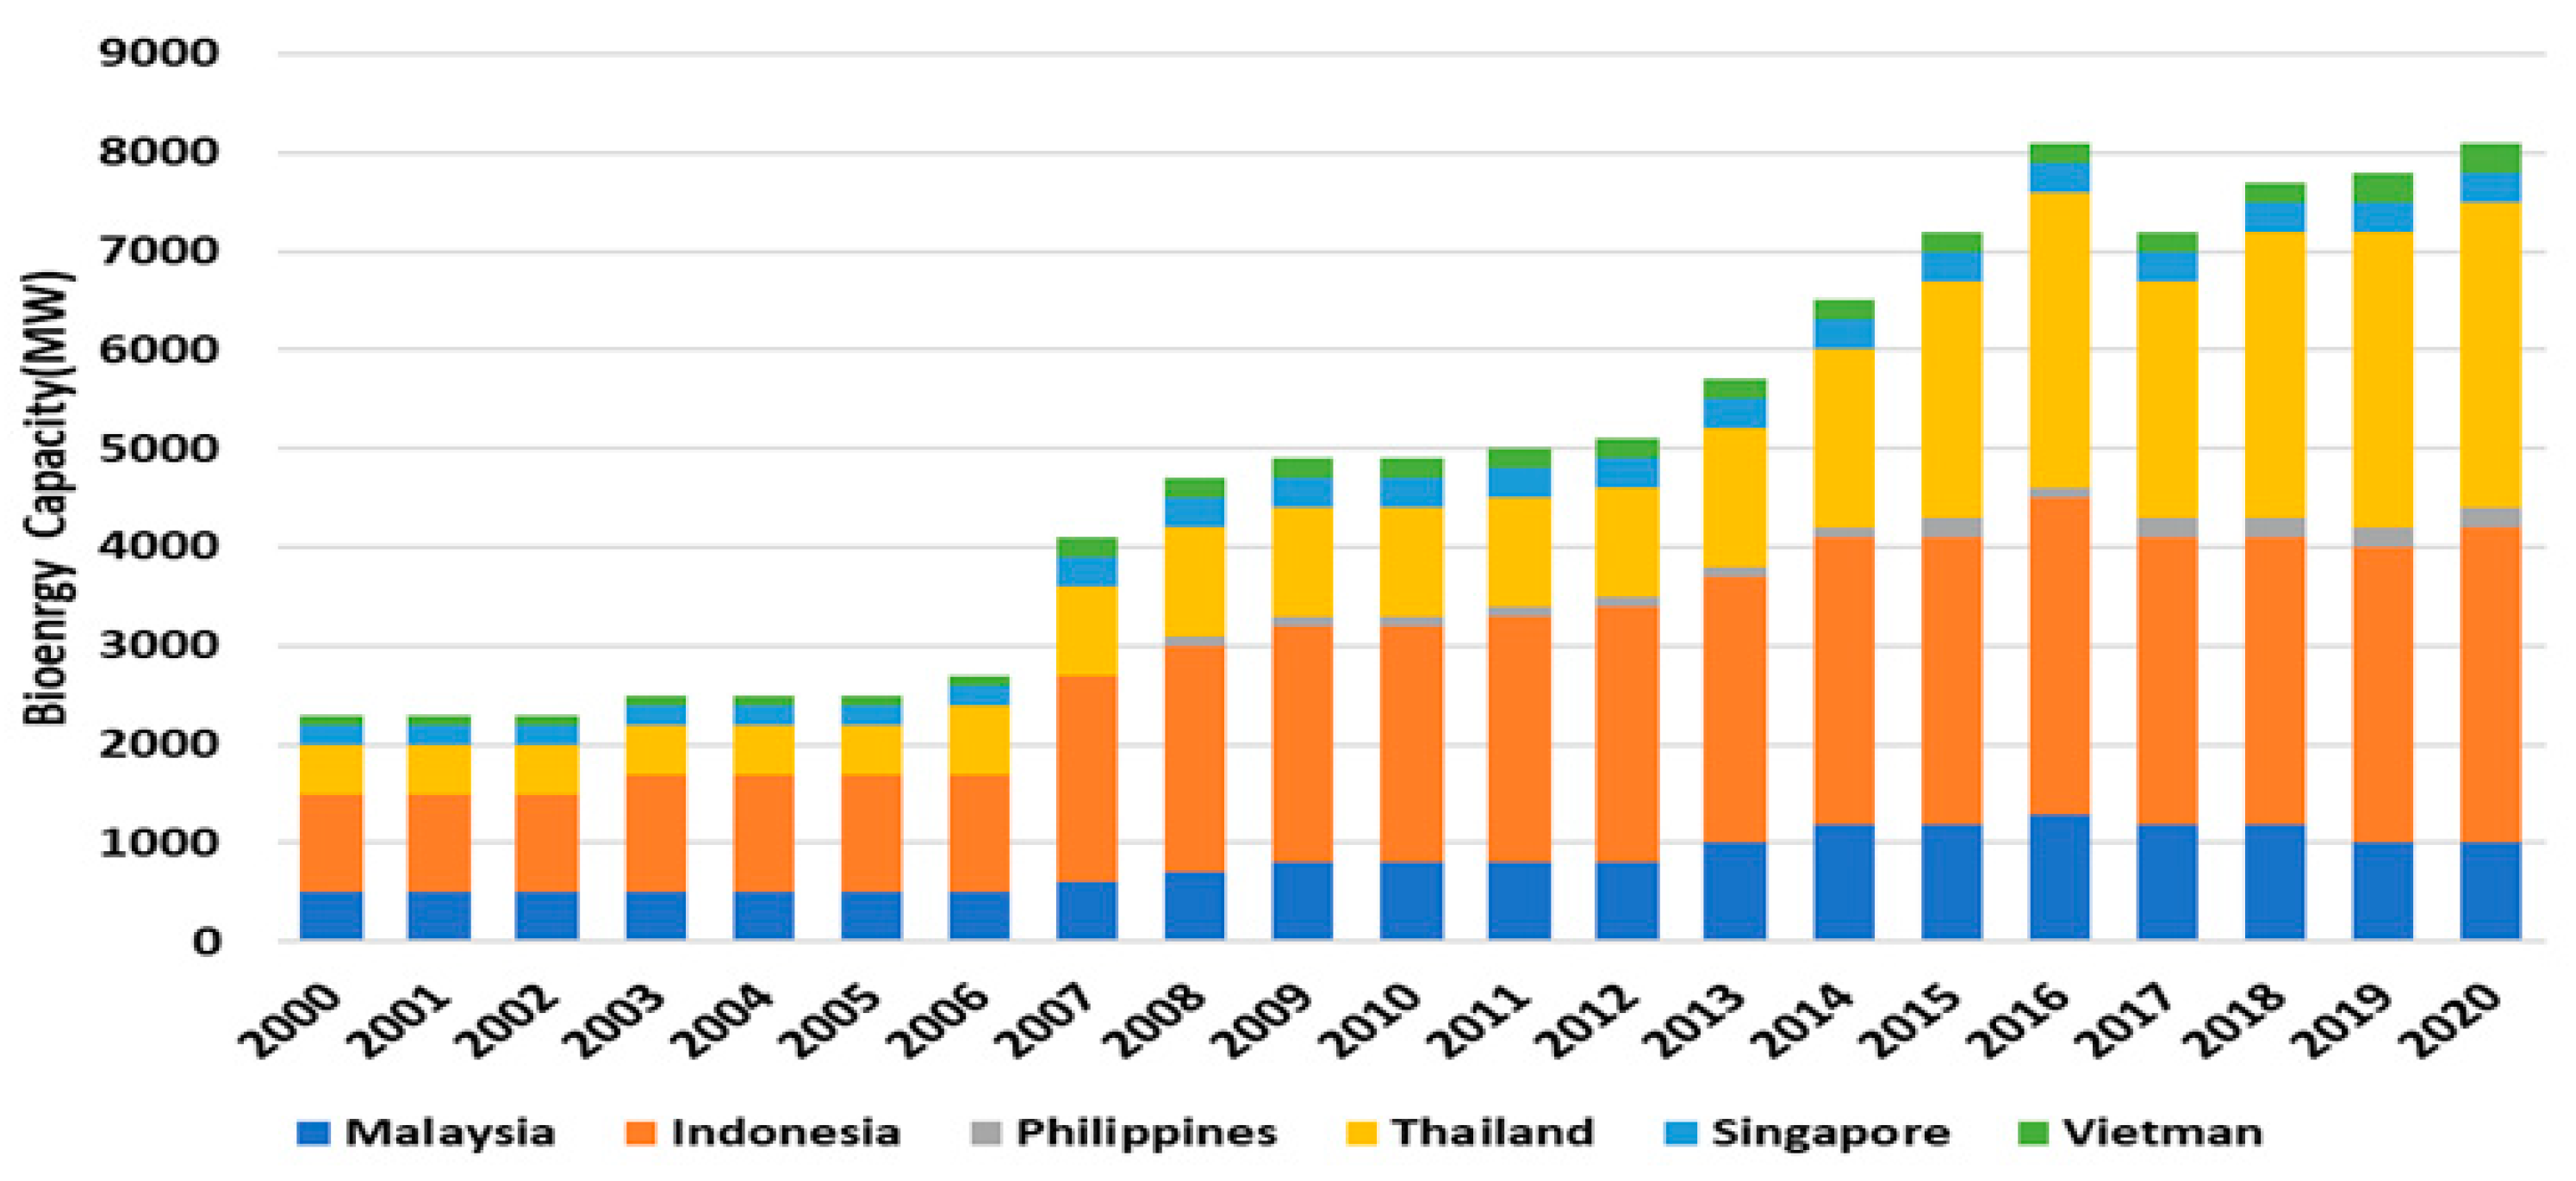
The evolution of the bioenergy capacity in ASEAN is depicted in Figure 7, which illustrates the bioenergy potential over a decade, spanning from 2010 to 2020. Bioenergy stands third in terms of the installed capacity among ASEAN RE sources as of 2016. Furthermore, by 2020, Malaysia, Indonesia, and Thailand would have contributed 11%, 23%, and 53% respectively, of ASEAN total installed bioenergy capacity [20].

3. Factors Influencing the Growth of Renewable Energy in ASEAN Countries

When evaluating renewable energy (RE) uses in a country, many factors must be considered. A combination of these characteristics enables the energy sector to overcome problems. This section discusses several critical elements that must be considered while addressing energy improvement in ASEAN countries.

3.1. Project Funding

Implementing an RE project requires a tremendous amount of investment. Ample land is necessary to generate a significant percentage of the country’s power requirements with solar power, making it an expensive project. Building a solar plant requires the appropriate amount of area and capacity due to the need for sunlight. The COVID-19 pandemic resulted in a reallocation of resources towards vaccine development and national stability, thereby limiting expenditures on renewable energy. To address this challenge, it is imperative to reevaluate and reestablish a comprehensive national strategy that prioritizes both addressing the pandemic and advancing the use of RE sources.
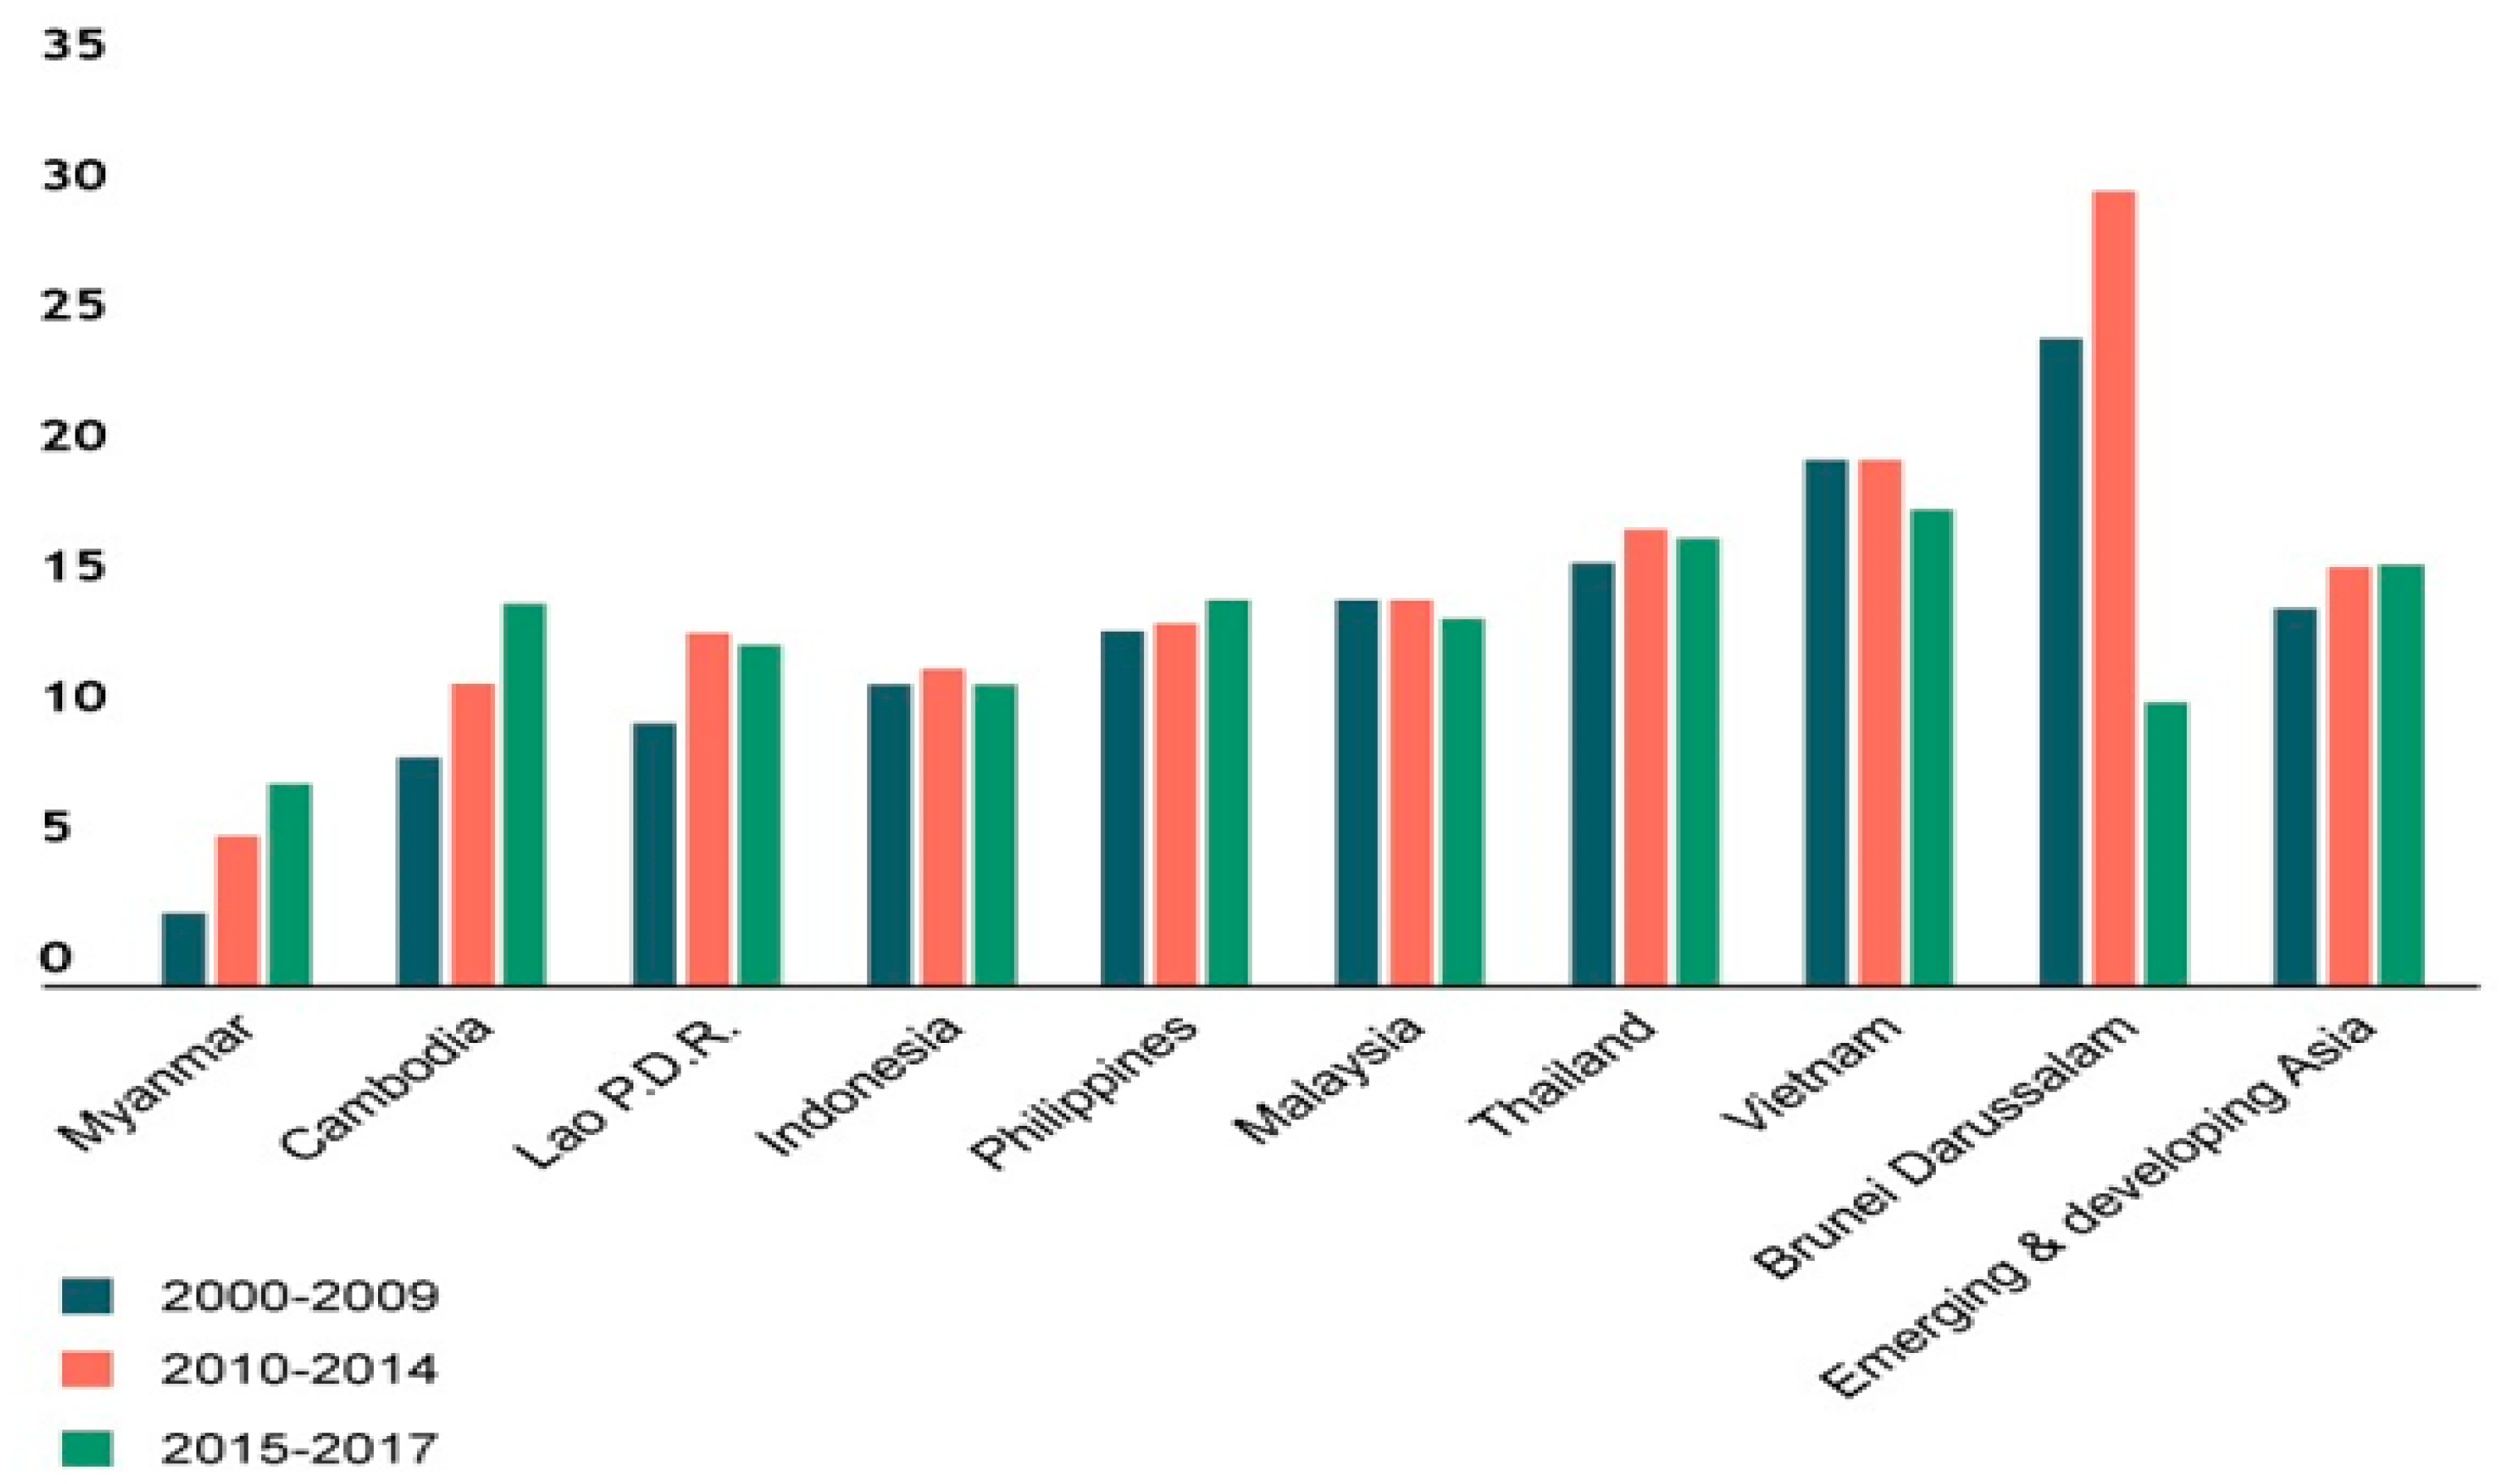
A report demonstrates that all ASEAN countries aim to achieve 23% of energy supply from RE sources in their total energy supply [22]. An estimation by the Asian Development Bank shows that USD 290 billion is needed to reach that target. This kind of investment is impossible for every country enlisted in ASEAN because of their financial condition. However, some Developed countries like Malaysia, Singapore, the Philippines, Brunei, and Thailand have enough money to invest in such cases. On the other hand, the remaining countries do not have enough financial solvency for this kind of investment. Besides affordability, one of the biggest challenges faced by all the countries in ASEAN is the high cost of upgrading the systems and integrating them accordingly to connect with the grid, have technological knowledge, quality infrastructure, and the internet of things [23,24]. Although wind module and solar panel costs have recently been reduced due to high demand, they remain expensive for developing countries. Furthermore, some financial regulations must be implemented, with some regulations requesting support from developed countries [25,26]. Figure 8 depicts the earnings from environmental taxes in different ASEAN countries. It displays three columns for each country, with outcomes for the tenures 2000–2009, 2010–2014, and 2015–2017. Yet, the tax revenue generated by environmental taxes in some ASEAN countries might be utilized to support investments and policies promoting the transition to renewable energy. However, it may not be enough to meet the anticipated cost of USD 290 billion required to achieve ASEAN countries' aim of 23% renewable energy production, and extra financing and support from wealthier countries may be required [26].

3.2. Public Investment

Investment in new RE has risen from less than USD 50 billion per year in 2004 to more than USD 300 billion in recent years, exceeding investments in new fossil fuel power by a factor of three in 2018 [27]. Renewable investments, however, continue to fall short of their potential. Scaled-up RE investment is critical to speeding the global energy transformation and reaping its myriad advantages while fulfilling climate and development goals.
Addressing important risks and obstacles, public finance, particularly climate finance, contributes significantly to closing the financing gap and luring greater private sector investment in renewables. For instance, big investments can be made by pension funds, insurance companies, endowments, and sovereign wealth funds [28].

3.3. Environmental Taxes

Figure 6 shows environmental tax revenue in some of the ASEAN countries. Environmental taxes can be used to fund programs and initiatives that promote sustainability and environmental protection. It can also be used to provide financial incentives to individuals and businesses to reduce their environmental impact. Furthermore, the revenue generated by environmental taxes can be used to invest in clean energy and other carbon-reducing technologies. Overall, environmental tax revenue can aid in the fight against climate change and the transition to a more sustainable economy.
Environmental taxes are one of the essential factors when it comes to RE investment because the renewables are exempt from this tax. Two strategies that reform the economy and lessen the detrimental effects of economic activity on the environment are green investment and environmental taxation. As the economy is based on three main sectors: agriculture, service, and industry [29], the energy sector of the ASEAN economy has become one of the large emitters of greenhouse gases, resulting in its contribution to global warming [30]. However, following the implementation of carbon taxes and emission regulations by the Malaysian government, the  C O 2  emission is now 7.26% and 6.38%, respectively [31]. One of the most vulnerable regions to climate change is ASEAN. Motivating governments and businesses can be achieved by imposing an environmental tax which will incentivize them to shift toward green energy which does not bear environmental tax. As a result, RE sources will increase and reduce CO2 emissions. Research in [32] was undertaken to analyze the effect of imposing environmental taxes in ASEAN countries, the results of which highlight that a one percent change in environmental taxes would reduce carbon dioxide gas emissions by 0.39%. Singapore was the first Southeast Asian country to introduce such a tax in the Carbon Pricing Act in 2019 [33]. The Act says that for every 1 tonne of CO2 emissions, 5 Singapore Dollars must be paid.

3.4. Risks, Challenges, and Solution to Green Investment

There are numerous obstacles to overcome in order to execute green investments. The majority of investors choose to avoid ventures with specific risk elements because they are something new to them. Investment in a distribution system has lower risks than that of renewable energy. For example, investing in solar power plants has a higher risk of not generating a profit in a country where the irradiance is not that high. Due to the climate and weather of a country, long-term conditions must be considered when investing in long-term projects. Thus, there are many variables an investor has to take into account. According to Amin et al., a private investor’s barriers or risks are policy and regulatory, market, technology, and capacity constraints [34]. The availability of finance for addressing environmental risks influences the decision of private investors to invest in sustainable or eco-friendly projects. A report that was published in 2022 found that Asia is facing a financial challenge of USD 2.7 trillion as of 2014 in order to tackle these risks. This means that the financial resources required to address environmental risks in Asia are significant and will likely impact investment decisions in the region [35].
The governments of ASEAN have the potential to foster green investments through the provision of financial incentives. As an example, Thailand has implemented a policy initiative aimed at encouraging investment in the RE sector [36]. Among the incentive types, there are economic and fiscal incentives. The Malaysian government has also provided financial incentives to support RE, such as an effective pricing policy and legalized environment [37]. In Cambodia, the government established financing from the World Bank IDA and Global Environment Facility called the “Rural Electrification Fund”. Renewable energy projects for rural electrification can obtain a financial grant of up to 25% of the total project costs from the fund [38].

3.5. Current Market Failure

Due to the low efficiency and uncertainty in RE systems, pricing of power generated by green energy is uneven throughout the ASEAN countries. On the other hand, power produced by fossil fuels maintains an even low price, attracting most consumers. We can see that the raw materials and equipment needed are not produced in ASEAN countries [39], therefore, the equipment has a price tag due to import duties. Moreover, the technological limits can cause market failure. To resolve this issue, experts from other countries needed to be brought in to oversee and train the populations of ASEAN. However, the factors influencing it are not limited to technological or financial issues. Poor governance and a lack of institutional mechanisms are some of the fundamental problems that cause market failure.

3.6. Public Awareness

Due to the global rise in oil prices and the scarcity of petroleum resources, the cost of fuel and more energy consumption had a complex effect on Malaysia’s economy. Fayaz et al. [40] focused on the potential and implementation of different renewable sources in Malaysia. People’s awareness and government initiatives have always played an essential role in implementing any long-term energy project. Accurately forecasting the energy from solar is a challenge, which can be overcome by using efficient deep learning models. According to Qazi et al. [41], the Malaysian government has proposed several initiatives to attract FDI and the general public in order to accelerate the expansion of RE programs.
As per a survey of over 300 individuals in rural regions of Malaysia, public perception and performance expectations for the acceptability of renewable energy sources are mediated by awareness. Additionally, the results show that biomass is the most suitable clean energy source, receiving the highest score value. Similar kinds of research can be conducted in other regions in ASEAN countries to determine people’s perceptions of renewable sources.

4. Energy Framework of ASEAN Countries

The role of efficient, uninterruptible power supply is prominent in promoting the growth and livelihood of the people in the ASEAN region. Keeping in mind the potential advantages, ASEAN introduced an electricity interconnection arrangement in the year 2020, however, there have been disruptions in the production in the post COVID era and governments have put forward different policies to combat those problems.

4.1. Post COVID-19 Recovery

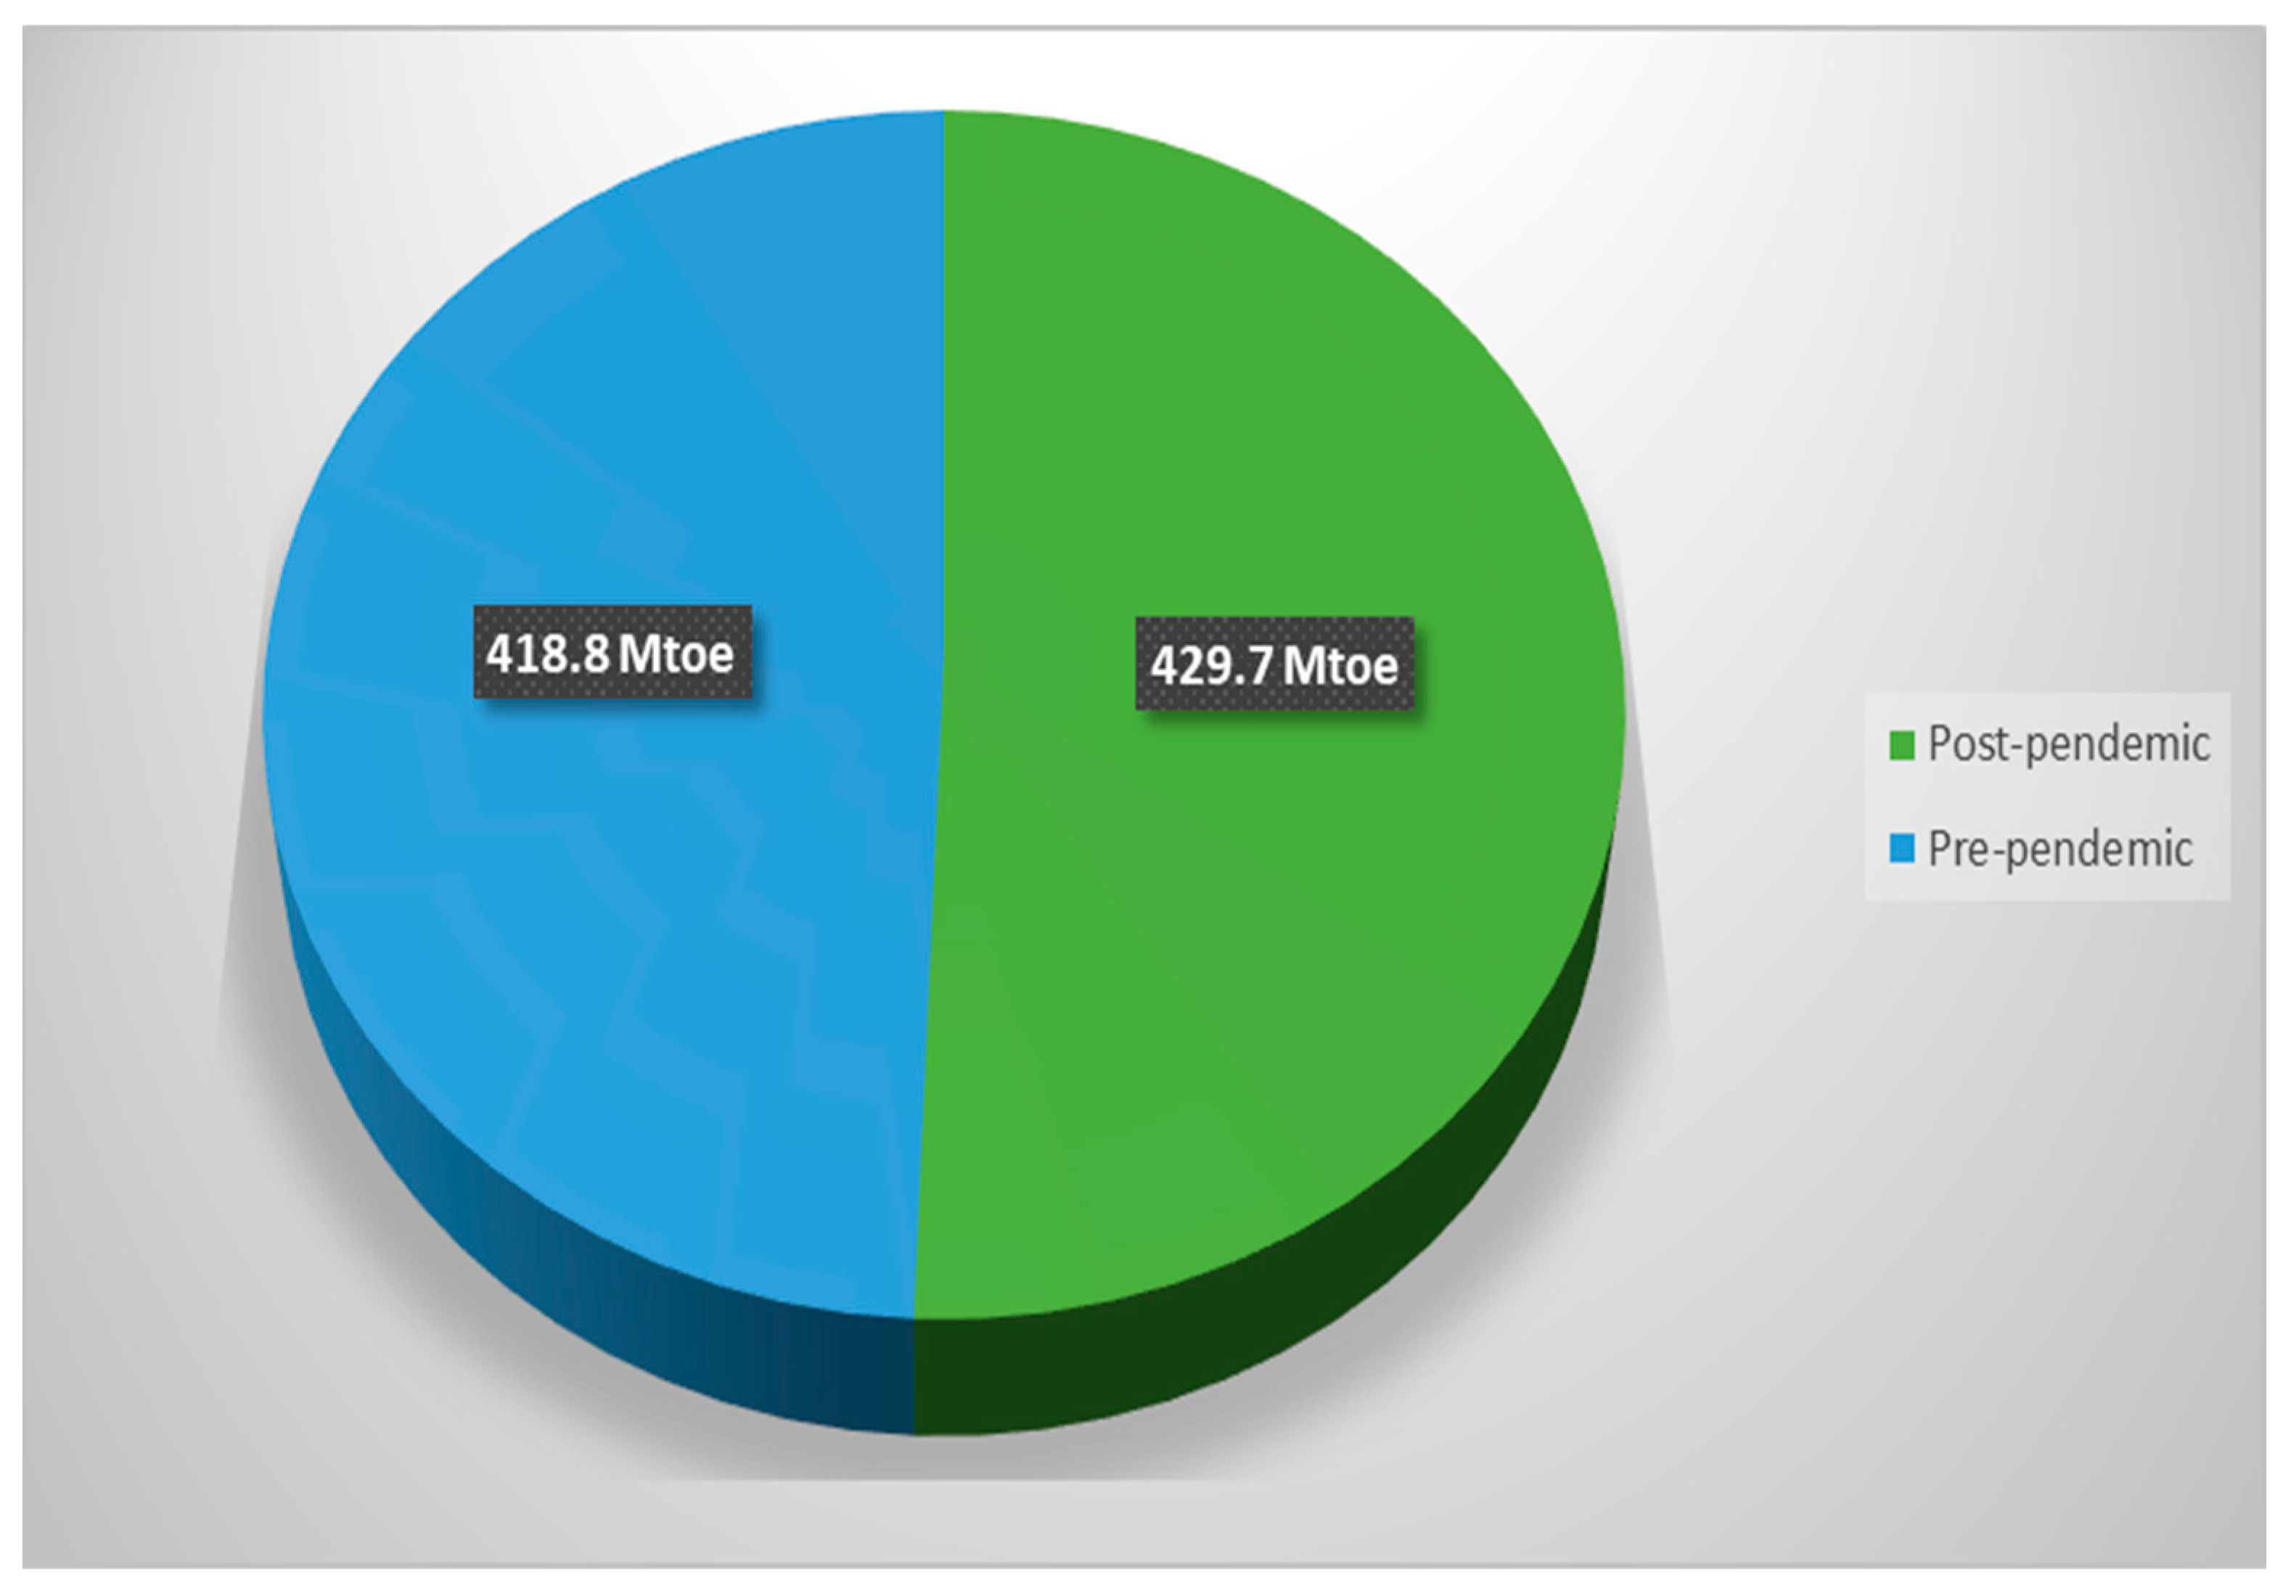
The significant decline in total energy usage in the ASEAN region in 2020 reflects the economic impact of the COVID-19 pandemic. The governments of the ten ASEAN member states (AMS) distributed various economic recovery packages to help deal with the economic issues. Figure 9 illustrates the energy consumption in various sectors, including residential, industrial, transportation, and commercial, as plotted on the x-axis. The consumption is depicted in million tons of oil equivalent on the y-axis. With the coronavirus under control, the economy will likely develop in lockstep with energy demand, surpassing pre-pandemic levels [6]. The pandemic led the economy to decline and slow in 2020. Energy demand in the transportation and industrial sectors fell by 13 Mtoe (8.8%) and 11 Mtoe (6.8%), respectively, in 2020 compared to 2019 [42]. Both industries’ massive reduction in energy use resulted mainly from mobility restrictions implemented by the ASEAN AMS governments. Energy use in the business and agricultural sectors fell, but not as dramatically. In contrast, home energy demand rose by 0.8% from 2019 to 2020 [43].
The proportion of fossil fuels in the primary energy supply mix declined from 82.6% in 2019 to 81.2% in 2020 [45]. The difficulties that fossil fuels pose to sectors, particularly the oil and gas industries, will likely increase once the plague is over. However, according to the analysis, these industries are rebounding successfully, albeit slowly. The renewable energy (RE) sector, on the other hand, was unexpectedly resilient during the pandemic. From 2019 to 2020, the share of total RE increased by over 1.4%. Because of this resiliency, renewables have become the focus of attention and the primary driver of government stimulus packages [46]. During the epidemic, the AMS governments provided several fiscal recovery programs. Tariff relief, investment stimulus, loans, liquidity support, tax exemptions, and charge waivers were among them. The ASEAN Centre for Energy noted that governments provided various sorts of energy tariff relief and changes until 2020, particularly for the most vulnerable community groups. The household sector received the most economic assistance among the many beneficiaries of these support programs [47].

4.2. The Pandemic Impact on the Energy Sector: Current Sector

The International Monetary Fund (IMF) predicted that the region’s economic growth would rebound to around 2.1% in 2022 and then rise in consecutive years [48,49]. Regional energy consumption will rise by roughly 2% from pre-pandemic levels, according to the International Energy Agency’s Global Energy Review 2021 [50]. The transportation and manufacturing industries were the hardest hit by the outbreak, and they are only just beginning to recover. However, if the AMS does not want to grow even more reliant on fossil fuels in the coming years and decades, the energy resurgence must be handled with caution. As shown in Figure 10, according to the International Energy Agency’s World Energy Assessment 2021, ASEAN’s energy demand is anticipated to climb to 429.7 Mtoe after the pandemic, and regional energy consumption is anticipated to increase by about 2% from pre-pandemic levels. However, as the region's economic growth picks up and the transportation and manufacturing sectors recover from the pandemic's effects, caution must be exercised to prevent further reliance on fossil fuels [48].

4.3. Before and after COP26

The 26th United Nations Conference of the Parties (COP26) in Glasgow in late 2021 demanded considerable efforts from governments all over the world. The meeting’s key deliverables were the revised Nationally Determined Contributions (NDCs), signatories to the Glasgow Climate Pact, and the Global Coal to Clean Power Statement, which could be essential to fulfilling climate targets [51]. The countries’ long-term strategies are intended to outline tangible activities that will strengthen the desire to go beyond the NDC targets.
Five AMS’s submitted updated NDCs before the COP26 meeting in 2020, while the remainder did so in 2021. In the most recent report, nine AMS’s established unconditional targets for lowering emissions. Only Cambodia has a conditional goal [52]. All AMSs selected the energy and agricultural industries as the main sources of the emissions reduction target when it came to sector coverage. Additionally, all AMSs, with the exception of Myanmar, listed trash and industrial processes and product usage (IPPU) as additional culprits. Only the Philippines and Thailand did not classify land use, land-use change, and forestry (LULUCF) emissions’ reduction factors. In addition to conditionality and sectoral coverage, the NDCs establish a detailed range of greenhouse gas (GHG) emissions. The majority of GHGs, such as carbon dioxide (CO2), methane (CH4), nitrous oxide (N2O), hydrofluorocarbons (HFCs), perfluorocarbons (PFCs), sulfur hexafluoride (SF6), and nitrogen trifluoride (NF3), have been included in both Malaysia and Singapore’s NDCs. However, Myanmar’s NDC only mentions CO2. Aside from CO2, which was included in all of the AMS’s NDCs, nine recorded CH2 and N2O [53]. Nationally determined contribution (NDC) of ASEAN member states are illustrated in Table 2 [51,52,53].

4.4. Global Coal to Clean Power: ASEAN Perspective

As several financial institutions have announced their intention to stop funding new coal plants due to their significant role in climate change, many countries worldwide have responded by attempting to shift away from coal consumption. Another important outcome of COP26 is the Global Coal to Clean Power Transition Statement, which outlines these actions. This statement emphasized the importance of speeding up and scaling up sustainable energy transition initiatives while completely phasing out coal-powered activities [54]. The following are the four primary commitments to which governments agreed in the statement:
-
Rapid development of clean power as well as significant increases in energy efficiency measures.
-
Scaling up the technologies and policies needed to transition away from coal in the 2030s for major economies and 2040s globally.
-
Ceasing issuance of permits and direct government support for the construction of new unabated coal-fired power plants.
-
Strengthening efforts to provide robust technical and financial frameworks and social support to make a just and inclusive transition away from coal.
Brunei Darussalam, Indonesia, the Philippines, Singapore, and Vietnam are the five AMS’s that have signed the Statement. However, Indonesia and the Philippines have not agreed to all the clauses in the Statement. The third article, which prohibits issuing licenses and direct government support for and building new coal power plants, was essentially waived by Indonesia. However, as part of its promise to achieve net zero emissions by 2060, or sooner with international aid, Indonesia will investigate accelerating the coal phase-out into the 2040s, subject to further international financial and technical assistance [55].
Meanwhile, it appears that the Philippines has accepted only the first clause and portions of the second and fourth clauses. The Philippines would like to restate its appeal for climate justice, highlighting that while not being a large producer of greenhouse gases, the Philippines is suffering greatly due to climate change’s worsening effects. It emphasizes the importance of energy security and how the energy transition will help Filipinos live better lives and contribute to the country’s economic progress [56].
Under the conditionality agreement of the clause, the AMS signatories to the Statement have taken a bold step toward transitioning away from coal [57]. Despite being the world’s largest single coal market, the ASEAN region is “talking its talk” by phasing down coal power units per the Paris Agreement.

4.5. Beyond NDCS: The AMS’ Long-Term Strategies

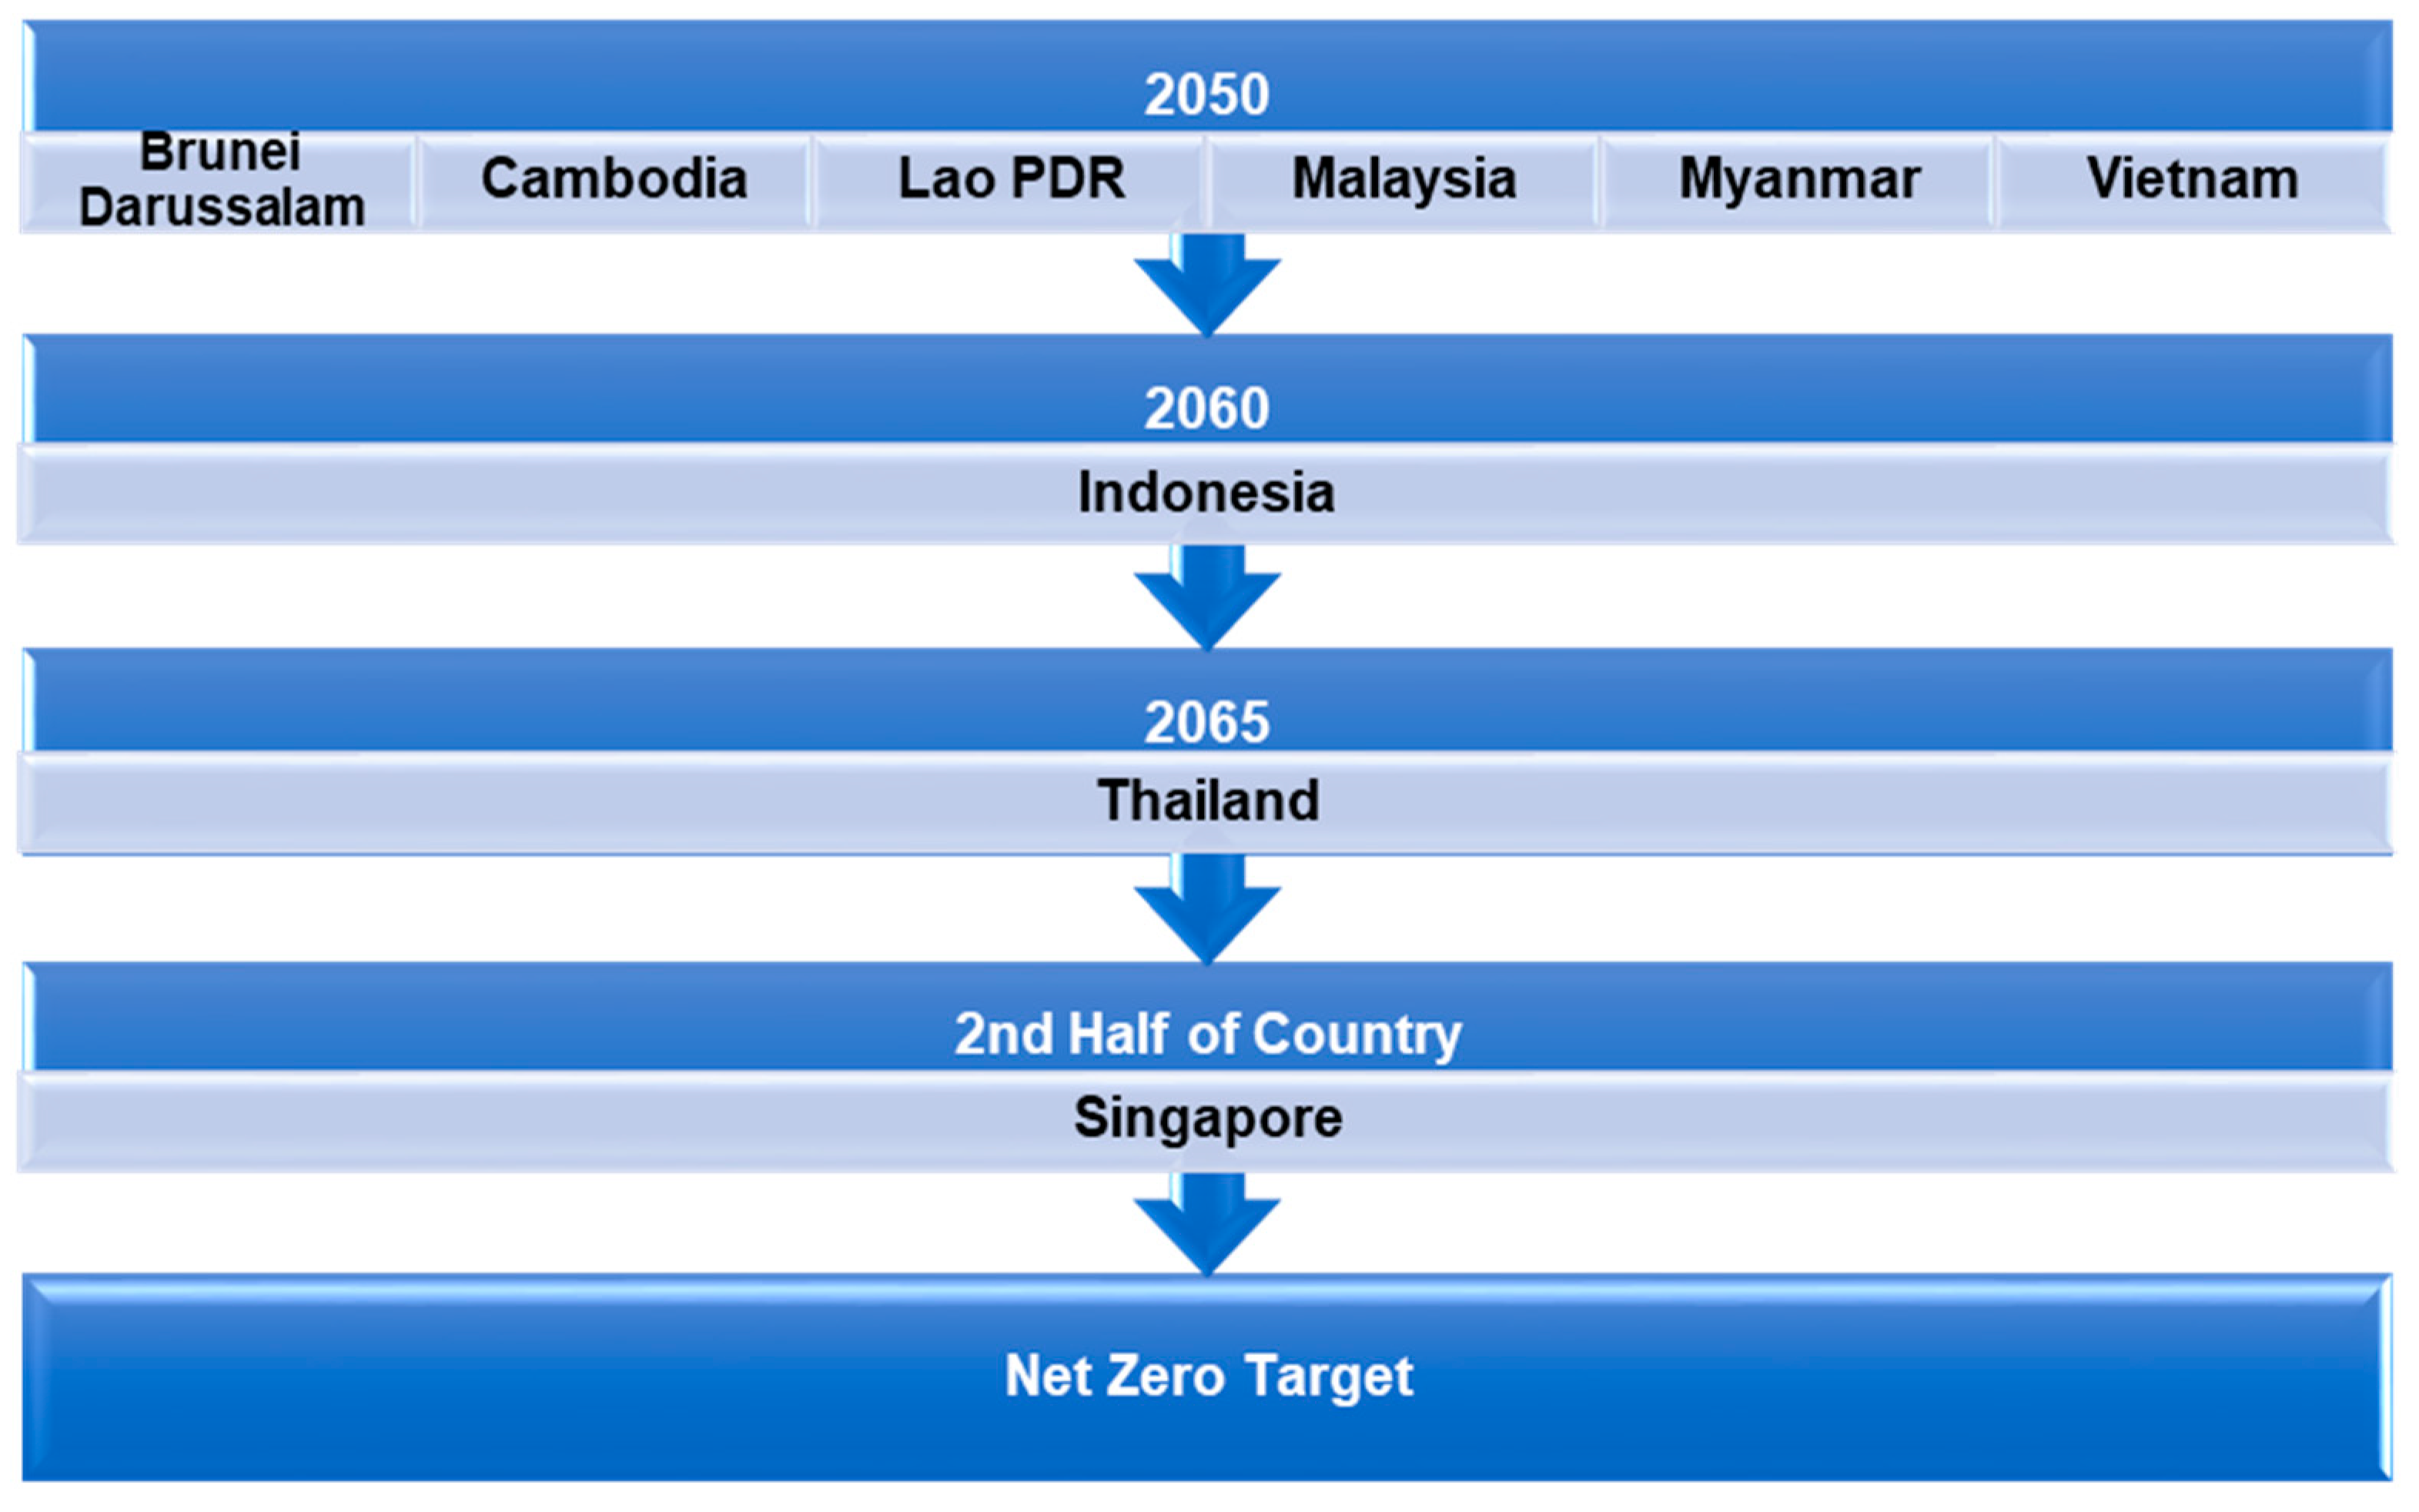
Because the AMS’s NDC targets are only valid for a limited time, planning beyond them is crucial in proving the region’s commitment to global climate goals. Nine of the ten AMS have promised to achieve the net zero goal established in several long-term policy documents presented to the UNFCCC [58]. Rapid technological innovation is expected as governments strive for ever-higher long-term goals. These breakthroughs will demand substantial future investments. As a result, the participation of numerous stakeholders will most probably accelerate the achievement of these long-term objectives. According to Figure 11, various ASEAN’s members have set different target years for achieving net zero emissions. Six countries within the ASEAN are projected to reach net zero emissions by 2050, while Singapore aims to achieve this goal in the latter half of the century.

4.6. Accelerating toward Energy Transition

The stage that follows planning is implementation. It will take coordinated efforts from all AMS’s to speed up the energy transition. In fact, a large number of nations are creating new power development plans (PDPs) to clear the way for more significant renewables to begin in 2022 [59].The power sector must significantly contribute if ASEAN is to achieve its regional objectives of adding RE to total primary energy supply (TPES) and reducing energy intensity. The ASEAN has a short window of time—three years, starting in 2022. Anticipated to be finished in 2022 are also the regulations of the Regional Comprehensive Economic Partnership (RCEP), the largest free trade deal in history [60]. In the era of energy transformation, the power industry is anticipated to be crucial.
Table 3 displays the total installed power capacity in the ASEAN region for different energy sources including coal, oil, gas, hydro, geothermal, solar, wind, bioenergy and others in 2020 [59,60].
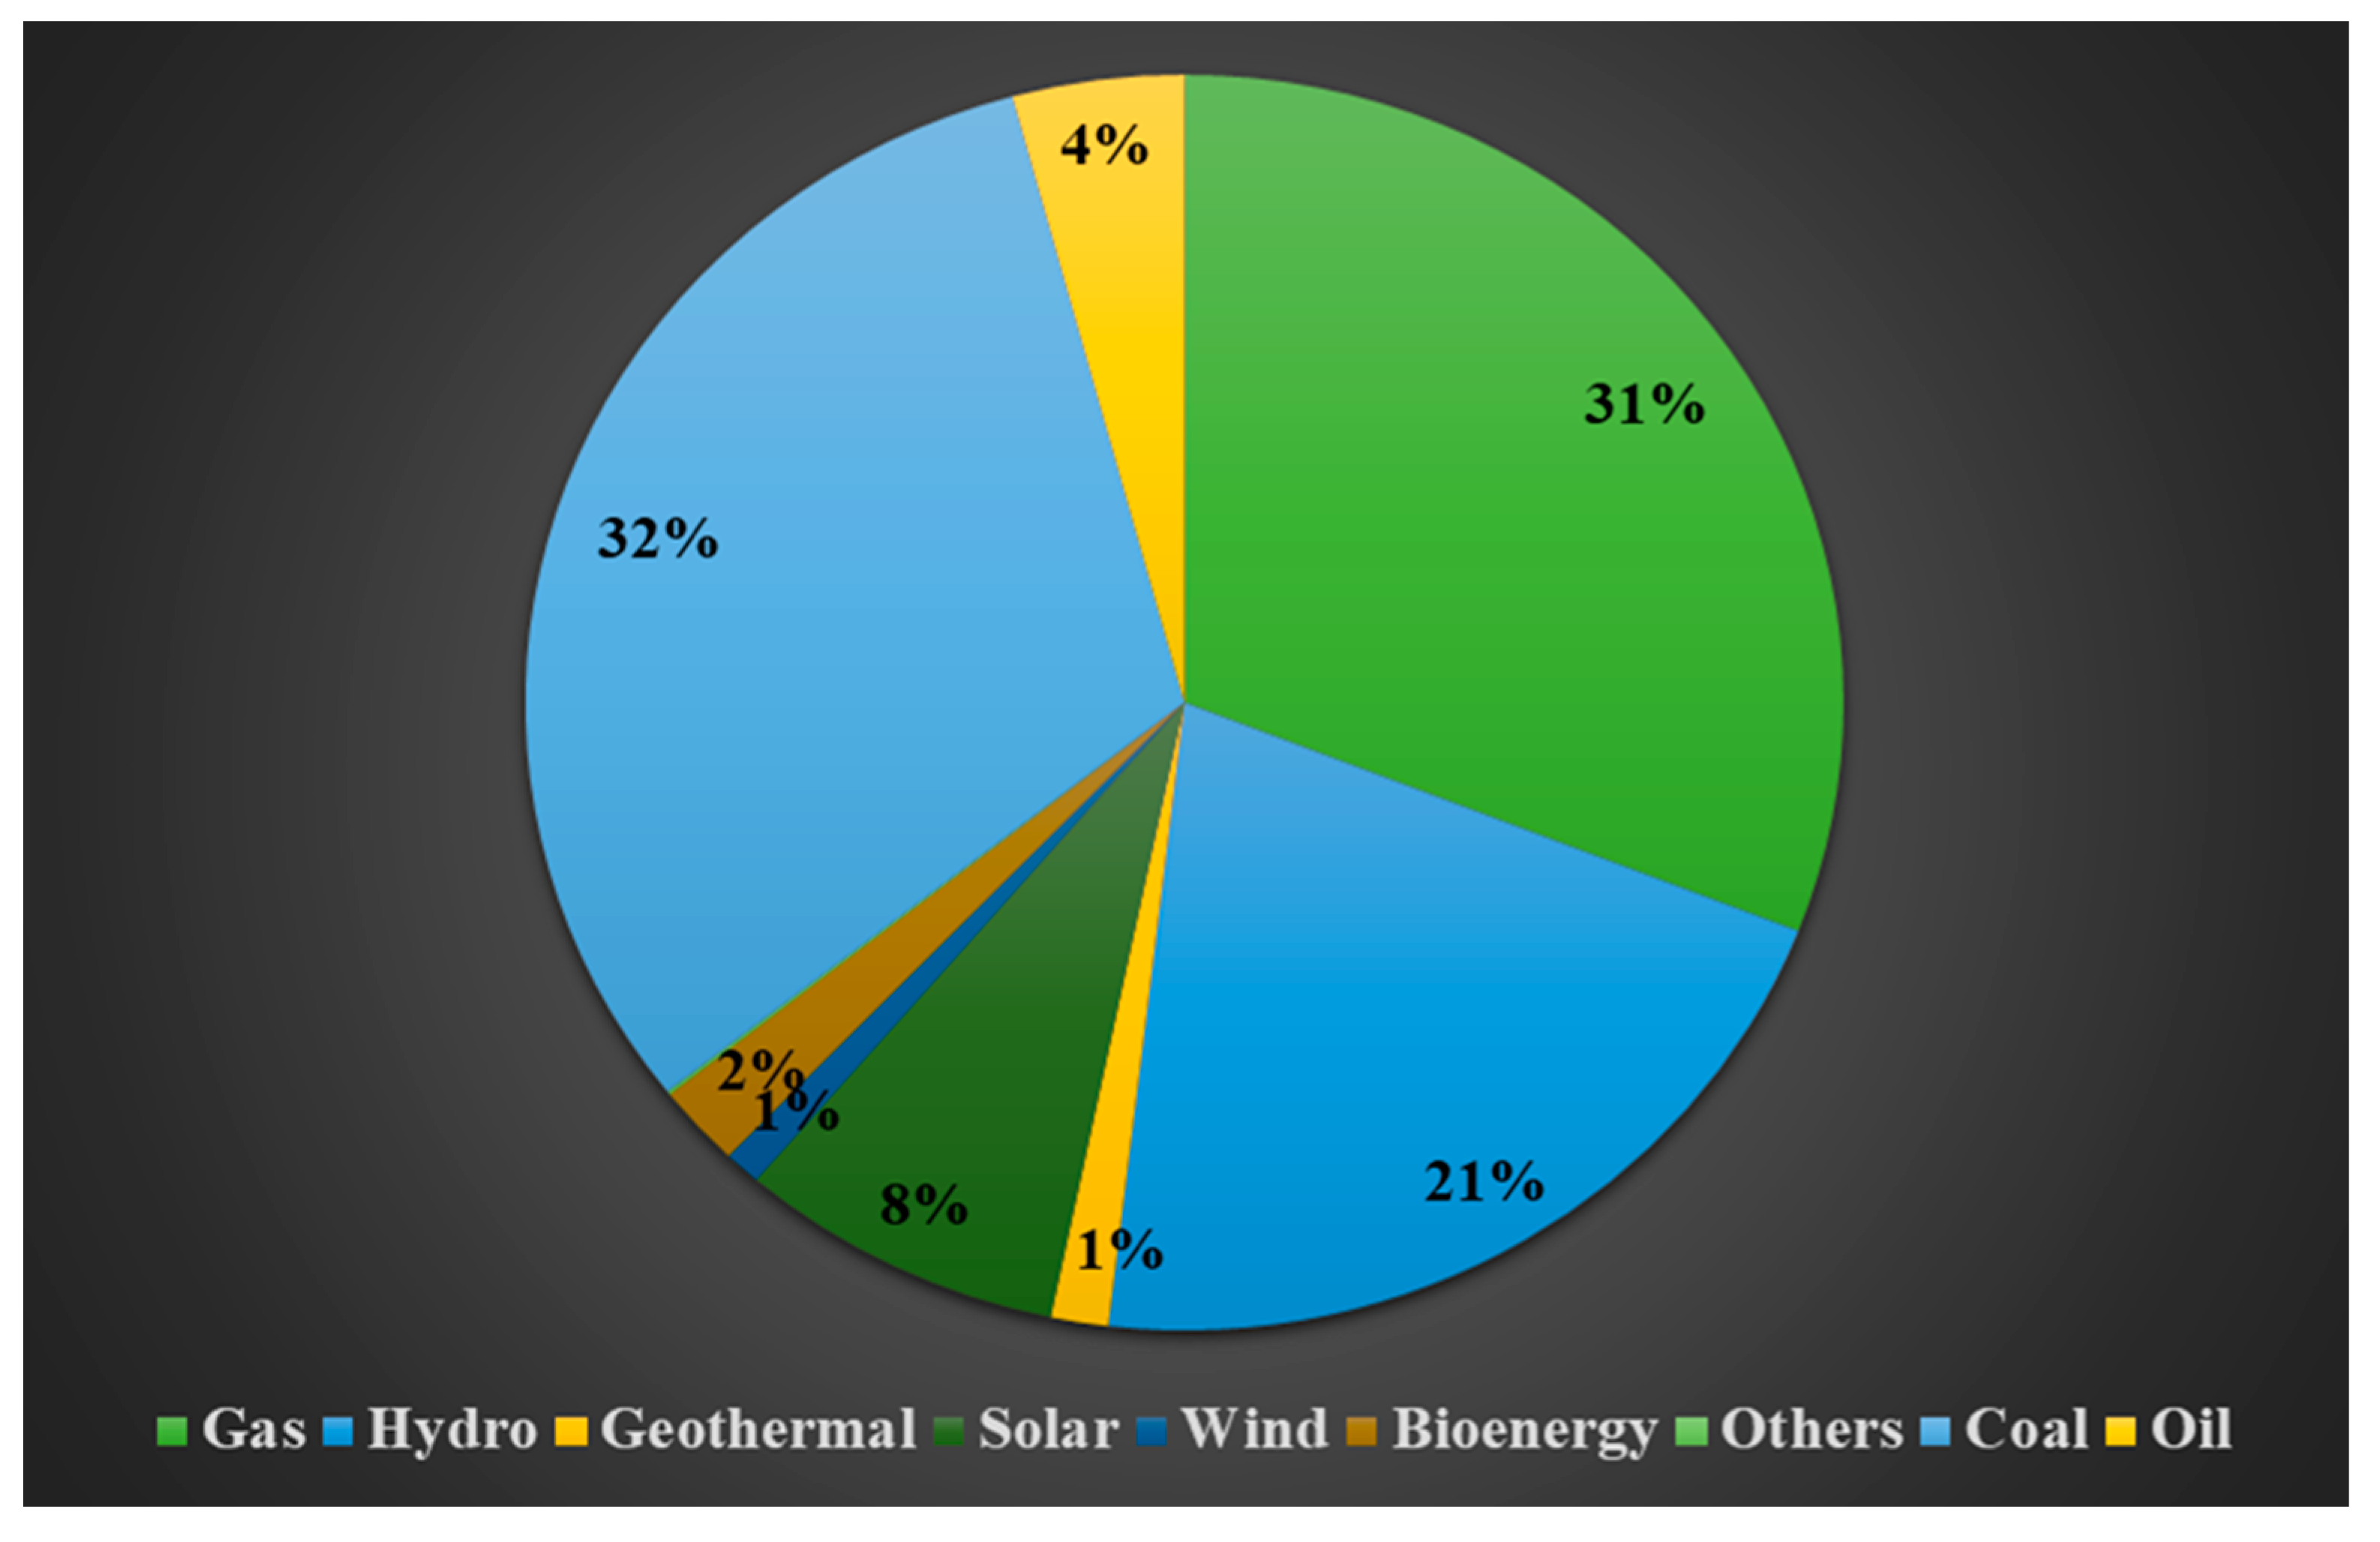
Figure 12 depicts the shares of different renewable installed power capacity in ASEAN. Coal and gas made up 31.4% and 30.9% of the total energy in the ASEAN region, respectively, while oil made up 4.2%. Hydropower became the most popular RE category, accounting for about 21% of total power capacity, followed by geothermal, solar, wind, bioenergy, and other RE sources, which accounted for 12.5% [61].

4.7. Long-Awaited Rules and the Largest Free Trade Pact in History

Some of the ASEAN member states have recently published policies and agreements. Long-awaited rules, such as Indonesia’s renewable energy bill, were scheduled to be passed in 2022. The law is a top priority for the national legislation program, which was set to be finalized in 2022 [63]. Indonesia may at least give commercial certainty in terms of legal stability for RE investors with the enactment of the New and Renewable Energy Law [64]. Furthermore, the government’s commitment to the energy transition will be demonstrated through the approval of the RE law.
Vietnam’s new PDP rule, like Indonesia’s RE law, was planned to be released in 2022. A draft of the PDP8 rule was released by Vietnam’s Ministry of Industry and Trade (MOIT) in February 2021 in order to receive public feedback and comments [65]. A number of different energy growth scenarios are included in the plan, including a higher reliance on renewables. The year 2022 is especially notable since it marked the start of the Regional Comprehensive Economic Partnership (RCEP), the world’s largest free trade deal. Deals between member countries were anticipated to attract investment to help with the energy transition.

5. Comparing the Growth of Renewable Energy in ASEAN

Energy transition was in the mind of the legislators and investors of the ASEAN countries in the pre-pandemic world. To reduce carbon emissions as well minimize costs, legislators have been trying to encourage investment on renewables. Construction in the renewable sector was halted as respective governments diverted their budgets on social expenditure spending. It is likely that the ASEAN member states will see a peak in renewable energy (RE) investment which, it is believed, will help the growth of RE in the ASEAN region.

5.1. Contribution of Each Nation to Raising RE through Various Methods

The demand for RE fluctuates substantially and is influenced by a number of factors, such as population, economics, and energy consumption. In 2014, modern RE supplied 9.4% of ASEAN total primary energy supply, a proportion that is predicted to climb to 17% in the reference case by 2025. However, according to the RE maps, it is still 6% short of the intended target of 23%, and ASEAN’s commitment to renewables is urgently needed to close the gap. To achieve this 23% RE target, however, each country, distinct industries, pricing, and the benefits of various technologies must be understood [66].
Figure 13 displays each country’s predicted increase in renewable energy share contribution in 2025, from 16.9% in the reference scenario to 23.2% in the RE map. This, however, varies according to the scale of different countries’ power infrastructure. In order to achieve the 23% target, Indonesia, Vietnam, Malaysia, and Thailand, must distribute at least 80%.
To achieve the goal in less than a year will require adopting a combined strategy such as how to manage power, cooking, and other sources. Furthermore, while there are numerous techniques for increasing renewables in a country’s energy system, focusing on one industry alone against other industries may encourage rapid development while negatively impacting the economy/resource availability.

5.2. Renewable Energy in ASEAN Countries

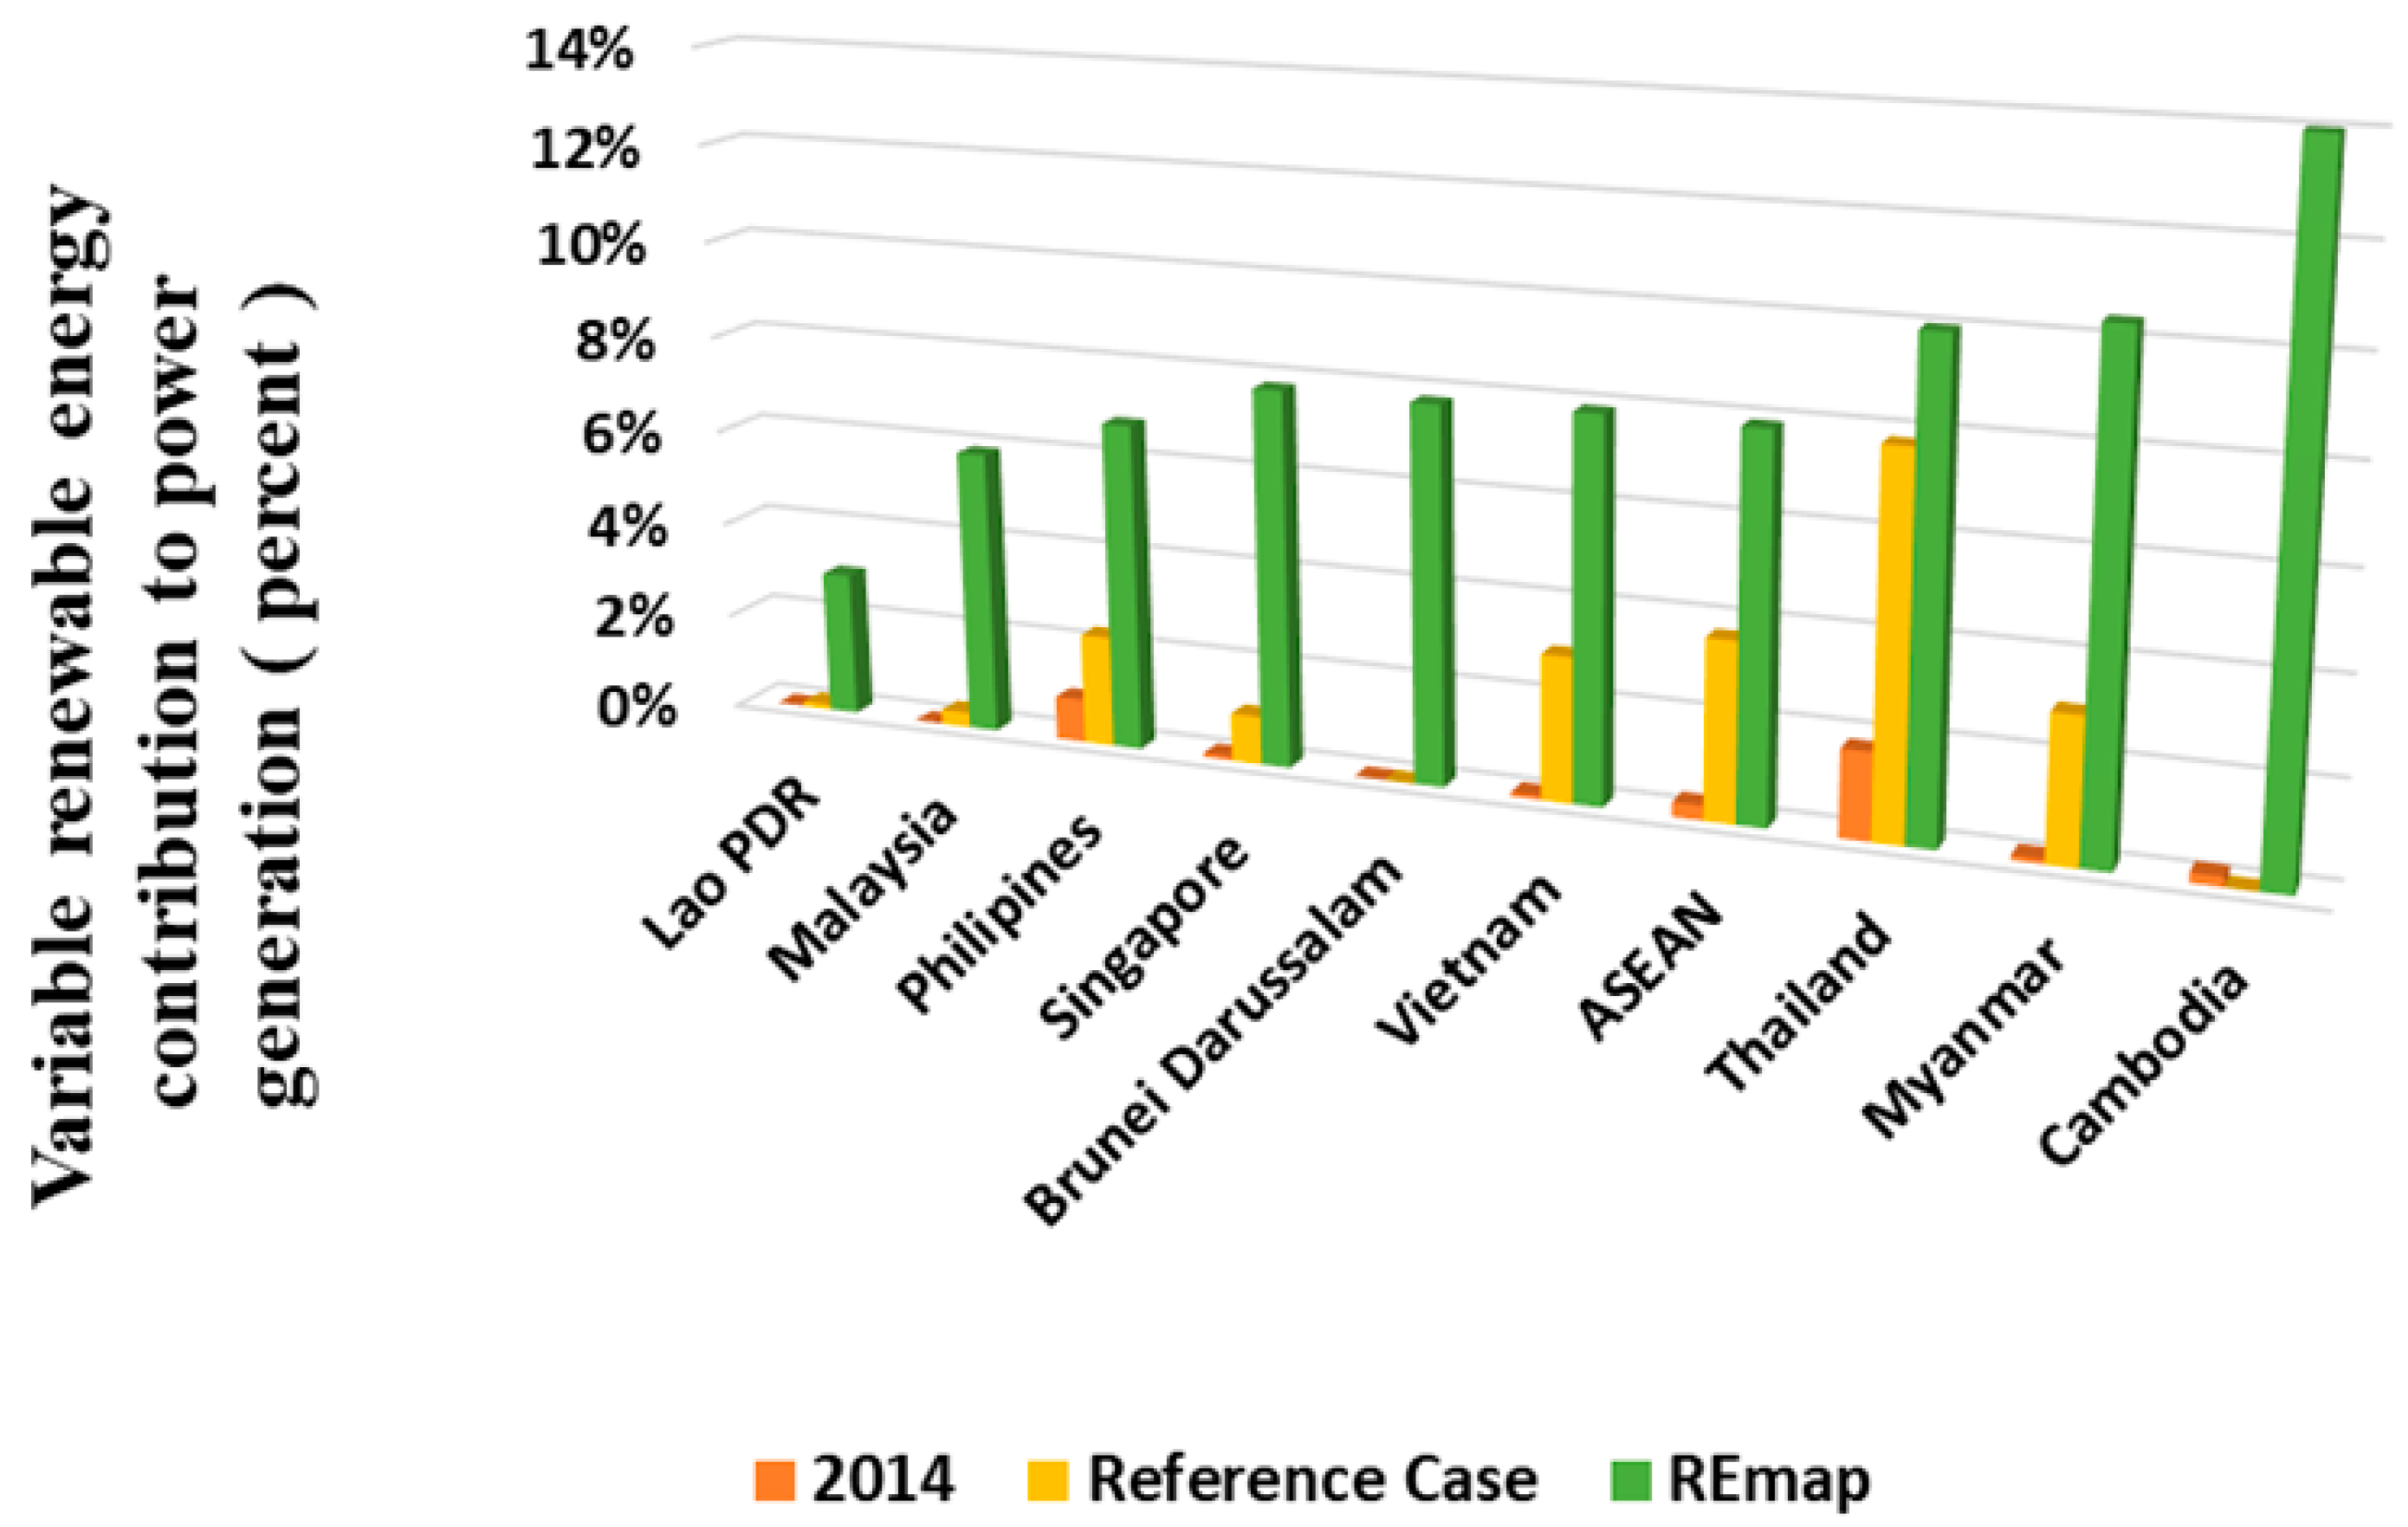
The percentage of variable renewable energy (VRE) will be lower across ASEAN than in individual nations or power systems. If all of the RE map settings are employed, however, the generation will occasionally surpass 10%.
The most plentiful source of VRE is hydropower, followed by solar photovoltaic and wind. Solar photovoltaic and wind energy are other important sources of VRE, and their output is connected to resource availability at any given moment, as well as power consumption, which varies by country, as illustrated in Figure 14.
The substantial amount of VRE in a flexible power system, however, presents a grid stability concern. The illustration of the overall electricity access rate and electrification scenario in ASEAN can be seen in Figure 15. The ASEAN power grid is among the better choices for addressing the difficulties of VRE integration into the grid (APG). The basic problem, however, is how power is distributed among the various member states and how this is done within various nations and territories. These issues may be solved more effectively by implementing grid codes, trading, electricity interconnection and maintenance and proper operational design [67]. The ASEAN countries established a goal in 2015 to increase the amount of RE in their energy mix up to 23% by the end 2025 [68]. Grid stability continues to be hampered by the unpredictable timing of power supply, even with a growing proportion of VRE sources like solar and wind [69]. Increased grid flexibility is a significant aspect in addressing concerns of stability and dependability. Grid dependability requires ensuring necessary demand and supply at all times. According to figures from 2015, Thailand controls a high grid dependability ranking by ensuring the most diversified RE sources into the grid, whereas the Philippines generates 15% of its electricity from renewable sources. This shows that the grid controls the current amount of integrated renewable energy. As a result, increasing the amount of grid integrated RE degrades grid stability; as a result, current grid resilience serves as a useful indicator of a nation’s integration of available renewable energy sources. Huang et al. [70] established and described a load profile and determined the worst-case ramp rate for each ASEAN member state as part of their inquiry regarding ASEAN grid adaptability.
Vietnam has accomplished 99% electrification [71], while other ASEAN countries including Malaysia, Singapore, Brunei Darussalam and Thailand have attained full electrification [72]. According to Figure 15, other countries including the Philippines, Indonesia, and Lao PDR should have practically complete electrification by 2030.
Figure 15. Electricity access rates across ASEAN (modified from [73]).
Sustainability 15 06961 g015
Because of Cambodia and Myanmar’s poor levels of electrification, they established many designs and models to achieve 100% electrification in Cambodia by 2030 and in Myanmar by 2040 [74].

6. ASEAN Energy Market and Energy Security

6.1. Energy Security

Energy security is a crucial aspect that must be given due consideration in the formulation of every nation’s energy plan. Ensuring energy security not only helps to secure the economy, but also paves the way for its growth and development.
A thorough research conducted by Kanchana et al. [14] investigated the consequences of energy instability on household welfare in Cambodia. The concept of energy insecurity is poorly understood in both the literature and local situations. In this study, household energy insecurity is defined as the existing condition of affairs resulting from the interaction of insufficient and inadequate energy use, which prevents households from meeting their basic energy needs. Because energy insecurity varies from place to place, it can only be fully comprehended by looking at the local context. When a family’s energy consumption is insufficient, they may miss out on other possibilities. After defining energy security in the Cambodian context, the study analyzed data from the Cambodia Socio-Economic Survey (2015) to evaluate the effects of household energy insecurity using multiple regression models. According to the study, energy instability has a considerable detrimental influence on household well-being and children’s human capital building. The findings will have an impact on economic, social, and environmental development by influencing policies aimed at boosting family energy security [75].
Indonesia’s energy security score has improved by 29.9% since 2000, rising from 0.330 to 0.428 in 2018. When the Indonesian energy security index fell below 0.5, the country’s energy security situation deteriorated. Therefore, efforts to improve energy security should be concentrated on the element with the least impact [76].
Laos has 554 million tonnes of low-calorific tertiary coal (lignite) in its reserves and possesses a substantial domestic supply [77]. It also has a hydropower potential of 26.5 GW [78]. There are no refineries or railways in this country. Traditional energy use in Laos is relatively low. The majority of primary energy consumption consists of wood, imported petroleum products, and hydropower.
Singapore’s energy security has been broadly stable over time. Further investigation has found that, while the energy supply chain and environmental sub-indices have improved, the economic sub-index has declined, outweighing the improvements. The proposed approach enables the rapid detection of defects in energy security by highlighting critical gaps in Singapore’s energy supply chain. It is particularly well suited to evaluating the energy security of countries that rely primarily on imported energy to meet their demands [79].
Malaysia serves as a great case study for analyzing the problems with energy security in Southeast Asia. The consistent and dependable availability of energy sources at a fair price is what is meant by “energy security” [80].
Energy security in ASEAN addresses the major energy sectors of oil, natural gas, and electricity and identifies the key energy security issues, such as a high level of vulnerability to natural disasters and a heavy reliance on fossil fuel imports that must pass through significant global chokepoints.

6.2. Issues Regarding Energy Security in ASEAN

Overdependence on fossil fuels, coal, and currency volatility are all factors to consider. The supply–demand balance is one of energy security’s two most important aspects. This section sheds light on some challenges being faced while achieving energy security in ASEAN.
The problem of energy security became much more difficult in 2005, when Indonesia became a net importer of oil for the first time in decades. Climate change problems have become more significant in the twenty-first century, coinciding with an increase in attention on energy challenges, because Indonesia is one of the top 3–5  C O 2  emitters in the world due to deforestation and forest degradation. In order to overcome these obstacles and achieve its goals for energy security, the Indonesian government has developed policies and programs [81].
The ASEAN Centre for Energy projects that Thailand’s energy consumption would rise by 80% over the next two decades even as its traditional energy resources are gradually depleted. With the goal of producing a sizable amount of the nation’s energy from renewable projects, Thailand’s Ministry of Energy announced a revised Power Development Plan two years ago. There are three major reasons why the development of power in Thailand is becoming a significant concern at present:
  • Environmental concerns have led to opposition to fossil fuels for power generation;
  • The need to diversify the fuels used in power generation;
  • Nuclear energy is still far off, although detailed plans could be released soon.
Thailand’s power imports are being investigated as a future alternative supply source to avoid these challenges [82].
Malaysia’s energy consumption is expected to more than double, from 96.3 TWh in 2009 to 206 TWh in 2035 Malaysia strives to reduce demand by increasing energy efficiency through programs like the Malaysia Green Living program, the Green Building Index, and greater solar power [83]. To address the country’s increasing energy needs, Malaysia must invest in the energy sector and conduct research and development. The National Energy Policy and the Four Fuel Diversification Policy were put into place by the government in 1979 and 1981, respectively, in order to produce sustainable and clean energy while simultaneously safeguarding the environment from greenhouse gas emissions; the Fifth Fuel Policy in the Eighth Malaysia Plan from 2001 to 2005, the Ninth Malaysia Plan from 2006 to 2010, and finally the Tenth Malaysia Plan in 2011–2015 [84].
  • Encourage enterprise and institute collaborations on energy planning;
  • Involve consumers in energy efficiency;
  • Ensure that the gas supply is stable;
  • Making green fuel mandatory in the transportation sector.
Improving electricity supply management through better resource allocation, more electrification in rural regions.
The Federal Government of Malaysia took the initiative to establish the National Green Technology Policy after realizing the value of green technology and the requirement for its advancement in the country. The National Green Technology Policy is underpinned by four pillars and five primary initiatives, as illustrated in Figure 16. The main focus of this policy is to achieve self-sufficiency in energy, conserve the environment, promote economic growth through technological advancements, and enhance the standard of living. The goal of this policy’s implementation is to attain zero or low greenhouse gas emissions, reduce environmental deterioration, and boost the use of renewable resources [67].
In contrast to Malaysia, the Philippines faces slightly different difficulties. In order to manage its low-carbon transition, the Philippines has encountered both possibilities and problems, as identified by Vina et al. [85] Listed below are some ideas: In order to inspire action by implementing agencies and local government officials as well as private sector investment in low-carbon energy technology, the Philippines must first develop a comprehensive, long-term, and coherent energy transition strategy. Second, when implementing the policy, it is important to consider how it will affect the economy as a whole and allow room for potential disruptive innovations in the future. Third, it is important to move as quickly as possible to take advantage of opportunities that affect the security and stability of the energy supply. Fourth, future energy sources and their potential applications for addressing capacity needs must be carefully considered. Last but not least, the energy mix needs to be varied; it cannot solely rely on one outside supply or be dominated by imported resources. The administration must give the creation of domestic energy sources top priority. Driving a transition to an energy future that addresses security, equity, and environmental issues requires a stable, sustainable energy transition policy that acknowledges the country’s economic growth in the medium and long term. This kind of initiative would aid the Philippines in reducing lock-in situations over time, so assisting them in lowering their reliance on fossil fuels.
Thailand’s energy security, however, faces a number of difficulties. As a result of increased agricultural production and rising electricity imports, Thailand is burning residue as a resource to produce electricity. Thailand implemented a policy on renewable energy (RE) to lessen the burning of sugarcane residue in response to the aforementioned problems. The following is a list of some of the major issues the nation is now facing:
  • Energy demand is a term that refers to energy intensity (energy consumption per unit of GDP), energy consumption per person, and similar concepts (it also takes into account one primary energy resource and one country-dependent sector—in Thailand, oil, and transportation);
  • The reserve-to-production ratio and resource estimation demonstrate the availability of energy supply resources (RPR);
  • The non-carbon intensive fuel portfolio (NCFP) and  C O 2  emissions are used to illustrate how energy use affects the environment;
  • Factors affecting the energy market include imports, energy import dependency, geopolitical market concentration risk, market liquidity, geopolitical energy security, and the oil vulnerability index (OVI);
  • Oil expenditure per GDP and total energy cost per GDP is also included in the statistics on energy prices and expenditures.
Thailand’s RE roadmap (a 15-year plan from 2008 to 2022) would provide insight into increasing energy security while minimizing environmental impacts [86]. It could also help with the development of alternative energy resource diversification options. These techniques, however, may not be enough to reduce overall energy consumption (on the demand side), boost energy system efficiency (on the supply side), and reduce energy expenditure. As a result, the government will have to go beyond to solve these issues. Subsidies for LPG, NGVs, and diesel would reduce energy costs. On the other hand, price subsidies have minimal impact on the RPR of these fuels or CO2 emissions. As a result, officials must analyze the causes and consequences of their policies/measures using the above indicators.

7. COVID-19 Pandemic Actions to Support the Further Growth of the Solar Industry

The solar energy market has been negatively impacted due to the rapid spread of the coronavirus worldwide. The production of the materials used in the construction of solar arrays and panels slowed down because most manufacturing companies are located in China. Additionally, other ASEAN hubs such as Malaysia, Vietnam, Singapore, and Thailand have been greatly impacted by the COVID-19 pandemic. Tax incentives present another significant challenge for environmentally conscious endeavors like solar energy production [87].
The World Health Organization (WHO) has confirmed that COVID-19 has had an impact not only on the solar industry but also on other markets that are closely tied to it, including markets for renewable power, electric vehicles (EVs), cooling, heating and the circular economy [88]. According to statistics, the demand for solar energy around the globe in 2020 has decreased.
Bloomberg New Energy Finance (BNEF) projected that the installation for solar energy worldwide would reach 200 gigawatts (GW) in 2022 [89]. However, solar capacity has shown a first annual decline from 143 to 108 GW during the past three decades [89].
During the COVID-19 pandemic, some ASEAN countries have made progress in RE implementation despite the economic challenges caused by the pandemic.
Examples include:
  • Vietnam set goals to generate 4% of its electricity from renewable sources by 2020 and 10% by 2030, and the country has made progress towards these targets. In 2020, Vietnam has added 2 GW of new renewable energy (RE) capacity, mostly from solar [90].
  • Philippines has been making progress on its target of generating 35% of its electricity from renewable sources by 2030. In 2020, Philippines added around 1 GW of new RE capacity, mostly from solar and wind [91].
However, many ASEAN countries faced challenges in terms of RE roll out and implementation. Some countries that were particularly affected include:
  • Indonesia: The pandemic and resulting economic downturn led to a decrease in demand for energy and a decline in investment in RE projects [92].
  • Malaysia: The economic downturn caused by the pandemic led to a decrease in investment in renewable energy projects [93].
  • Thailand: The pandemic led to a slowdown in the country’s RE sector, with delays in construction and implementation of projects [94].
However, both the BNEF and the International Energy Agency (IEA) have noted that the virus has affected investments in clean and safe energy, and governments’ ability to use the decline in oil prices to check subsidies for fossil fuels. However, the most significant problems are associated with rising revenue from taxes [67]. Most of the ASEAN governments are getting ready to lower gasoline taxes in order to invest in high-carbon infrastructure. In summary, the COVID-19 had an impact on society, changing the direction of decarbonization and the achievement of the sustainable development goals.

8. Conclusions

China was able to curb the spread of the first wave of COVID-19 in 2020 due to its unity and hard work. In 2023, there are reported cases of COVID-19 in China, but the numbers are lower compared to its previous peak. The Chinese government and local health authorities have implemented strategies to curb the spread of the virus. Meanwhile, other countries, including members of ASEAN, have struggled with the pandemic for a longer period of time, leading to a significant impact on the global economy. In response, the Paris Climate Agreement calls for all countries, including members of ASEAN, to prioritize renewable energy (RE) in their energy policies. However, this can be challenging due to the diverse net zero emissions targets among ASEAN countries and the need for increased investment. The International Renewable Energy Agency is collaborating with ASEAN to accelerate the deployment of renewable energy. By 2025, the region aims to generate 23% of its energy from renewable sources, up from 9.4% in 2014. Some ASEAN members are also exploring the use of floating solar technology to take advantage of the region’s abundant water bodies and coastlines.

8.1. Recommendations

The ASEAN governments could effectively advance RE development by implementing the following recommended actions:
(a)
Adequately funding private and public universities for research in RE technologies such as solar, wind, hydro, geothermal, and biomass.
(b)
Adopting a holistic approach to energy policy that considers emissions from all sectors and reduces overall emissions through policies such as carbon pricing, emissions trading, and regulations.
(c)
Offering comprehensive training programs for self-employment and startup support.
(d)
Maximizing the potential of RE sources through alternative production capacities, such as Myanmar’s hydropower.
(e)
Monitoring climate change and CO2 emissions regularly through a separate policy or framework.
(f)
Focusing on reducing transportation pollution and CO2 emissions.
(g)
Reducing plastic usage and promoting eco-friendly alternatives.
(h)
The development process must prioritize long-term benefits and cost management for maximum impact.

8.2. Future Goals

The members of ASEAN have made significant progress in RE development, particularly in solar and bioenergy. However, ASEAN countries still lag behind other regions of the world, with only 8% of their total electricity generated from renewable sources in 2020, compared to the global average of 26%. The decreasing cost of RE technologies presents significant potential for ASEAN countries to increase their use of renewable energy. While some ASEAN countries have set ambitious targets and implemented supportive policies, further efforts are needed to achieve a substantial shift towards a cleaner energy mix.
The ASEAN governments have set an ambitious five-year plan to increase RE capacity and aid economies affected by the pandemic. Under the second phase of the ASEAN Plan of Action for Energy Cooperation 2021–2025, ASEAN energy ministers have agreed to aim for 23% RE and 35% installed power capacity in ASEAN by 2025, requiring around 35 GW–40 GW of renewable energy. This plan is specific to ASEAN, but similar studies could be conducted in other renewable energy-producing regions. The findings of this study could provide insight into the future of RE generation. Future research will examine the impact of COVID-19 on RE development policies and output, both directly and indirectly. The authors will also compare the impact of different pandemic waves on RE projects.

Author Contributions

Conceptualization, K.E.F. and H.Y.; methodology, K.E.F., H.Y. and L.C.D.S. validation, K.E.F., S.A.S. and F.H.; formal analysis, K.E.F.; writing—original draft preparation, K.E.F.; writing—review and editing, K.E.F., H.Y., S.A.S. and F.H. All authors have read and agreed to the published version of the manuscript.

Funding

This research is funded by Universiti Brunei Darussalam, Faculty of Integrated Technologies: UBD/RSCH/1.3/FICBF(b)/2020/011.

Institutional Review Board Statement

Not applicable.

Informed Consent Statement

Not applicable.

Data Availability Statement

Available upon request.

Acknowledgments

The authors would like to thank the Faculty of Integrated Technologies, Universiti Brunei Darussalam for providing research support. We also thank Md. Hasnatul Amin and Priyanka Das Dewan (BRAC University) for providing energy-related information in the ASEAN region.

Conflicts of Interest

The authors have no conflict of interest.

Nomenclature

The meanings of the abbreviations and acronyms used in the writing are presented in a tabular format below.
AbbreviationMeaning
RERenewable Energy
GHGGreenhouse Gas
FDIForeign Direct Investment
IAEInternational Energy Agency
NDCSNationally Determined Contributions
AMSASEAN member states
UNFCCCUnited Nations Framework Convention on Climate Change
PDPProvisional Detention Regulation

References

  1. Pacudan, R. Feed-in tariff vs. incentivized self-consumption: Options for residential solar PV policy in Brunei Darussalam. Renew. Energy 2018, 122, 362–374. [Google Scholar] [CrossRef]
  2. Lu, Y.; Khan, Z.A.; Alvarez-Alvarado, M.S.; Zhang, Y.; Huang, Z.; Imran, M. A critical review of sustainable energy policies for the promotion of renewable energy sources. Sustainability 2020, 12, 5078. [Google Scholar] [CrossRef]
  3. Fahim, K.E.; Farabi, S.M.; Farhan, S.S.; Esha, I.J.; Muhtadi, T. Overview of Maximum Power Point Tracking Techniques for PV System. In Proceedings of the E3S Web of Conferences, Eskisehir, Turkey, 22–24 September 2021; EDP Sciences: Les Ulis, France, 2021; Volume 242, p. 01004. [Google Scholar]
  4. Khan, T.M.A.; Rahman, S.; Afgani, M.K.; Fahim, K.E. Solar Car; BRAC University: Dhaka, Bangladesh, 2014. [Google Scholar]
  5. Baviera, A.; Maramis, L. Building ASEAN Community: Political–Security and Socio-Cultural Reflections; Economic Research Institute for ASEAN and East Asia: Jakarta, Indonesia, 2017. [Google Scholar]
  6. Abdullah, I.; Warviyan, D.; Safrina, R.; Rosalia, S.; Tirta, A.; Demoral, A.; Bilqis, A. COVID-19 and the Energy Sector Development in ASEAN Countries: Assessing the Role of Fiscal Measures for Green Recovery Trajectory. In Proceedings of the IOP Conference Series: Earth and Environmental Science, Bogor, Indonesia, 14 September 2021; p. 012010. [Google Scholar]
  7. Gnanasagaran, A.J.T.A.P. Renewable Energy Cooperation in ASEAN. 2019. Available online: https://theaseanpost.com/article/renewable-energy-cooperation-asean (accessed on 1 January 2023).
  8. ASEAN Centre for Energy. Renewable Energy in ASEAN: Status, Challenges, and Opportunities. 2019. Available online: https://www.aseanenergy.org/wp-content/uploads/2019/07/RE-in-ASEAN-Report_Final_v2.0.pdf (accessed on 27 March 2023).
  9. Shuai, J.; Chen, C.F.; Cheng, J.; Leng, Z.; Wang, Z. Are China’s solar PV products competitive in the context of the Belt and Road Initiative? Energy Policy 2018, 120, 559–568. [Google Scholar] [CrossRef]
  10. Lau, H.C.; Zhang, K.; Bokka, H.K.; Ramakrishna, S. A Review of the Status of Fossil and Renewable Energies in Southeast Asia and Its Implications on the Decarbonization of ASEAN. Energies 2022, 15, 2152. [Google Scholar] [CrossRef]
  11. Mamat, R.; Sani, M.S.; Khoerunnisa, F.; Kadarohman, A. Target and demand for renewable energy across 10 ASEAN countries by 2040. Electr. J. 2019, 32, 106670. [Google Scholar]
  12. Ismail, M.I.; Yunus, N.A.; Kaassim, A.Z.M.; Hashim, H. Pathways and challenges of solar thermal utilisation in the industry: ASEAN and Malaysia scenarios. Sustain. Energy Technol. Assess. 2022, 52, 102046. [Google Scholar] [CrossRef]
  13. Atlas, G.S. 2022. Available online: https://globalsolaratlas.info/download/south-asia (accessed on 30 January 2023).
  14. Kanchana, K.; McLellan, B.C.; Unesaki, H. Energy Dependence with an Asian Twist? Examining International Energy Relations in Southeast Asia. Energy 2016, 21, 123–140. [Google Scholar] [CrossRef]
  15. Pandey, A.; Kalidasan, B.; Reji Kumar, R.; Rahman, S.; Tyagi, V.; Said, Z.; Salam, P.A.; Juanico, D.E.; Ahamed, J.U.; Sharma, K. Solar Energy Utilization Techniques, Policies, Potentials, Progresses, Challenges and Recommendations in ASEAN Countries. Sustainability 2022, 14, 11193. [Google Scholar] [CrossRef]
  16. Hasan, M.H.; Mahlia, T.M.I.; Nur, H. A review on energy scenario and sustainable energy in Indonesia. Renew. Sustain. Energy Rev. 2012, 16, 2316–2328. [Google Scholar] [CrossRef]
  17. Avci, A.C.; Kaygusuz, O.; Kaygusuz, K. Geothermal energy for sustainable development. J. Eng. Res. Appl. Sci. 2020, 9, 1414–1426. [Google Scholar]
  18. ASEAN Centre for Energy. ASEAN Centre for Energy. Available online: https://aseanenergy.org/ (accessed on 30 January 2023).
  19. Dehghani Madvar, M.; Aslani, A.; Ahmadi, M.H.; Karbalaie Ghomi, N.S. Current status and future forecasting of biofuels technology development. Int. J. Energy Res. 2019, 43, 1142–1160. [Google Scholar] [CrossRef]
  20. IEA Bioenergy ExCo. IEA Bioenergy Countries’ Report—Update 2021: Implementation of Bioenergy in the IEA Bioenergy Member Countries. November 2021. Available online: https://www.ieabioenergy.com/wp-content/uploads/2021/11/CountriesReport2021_final.pdf (accessed on 2 March 2023).
  21. Tun, M.M.; Juchelkova, D.; Win, M.M.; Thu, A.M.; Puchor, T. Biomass energy: An overview of biomass sources, energy potential, and management in Southeast Asian countries. Resources 2019, 8, 81. [Google Scholar] [CrossRef] [Green Version]
  22. Li, Q.; Cherian, J.; Shabbir, M.S.; Sial, M.S.; Li, J.; Mester, I.; Badulescu, A. Exploring the relationship between renewable energy sources and economic growth. The case of SAARC countries. Energies 2021, 14, 520. [Google Scholar] [CrossRef]
  23. Mehta, K.; Ehrenwirth, M.; Trinkl, C.; Zörner, W.; Greenough, R. The energy situation in Central Asia: A comprehensive energy review focusing on rural areas. Energies 2021, 14, 2805. [Google Scholar] [CrossRef]
  24. Nepal, R.; Phoumin, H.; Khatri, A. Green technological development and deployment in the association of southeast Asian economies (ASEAN)—At crossroads or roundabout? Sustainability 2021, 13, 758. [Google Scholar] [CrossRef]
  25. Said, R.; Bhatti, M.I.; Hunjra, A.I. Toward Understanding Renewable Energy and Sustainable Development in Developing and Developed Economies: A Review. Energies 2022, 15, 5349. [Google Scholar] [CrossRef]
  26. Haseeb, M.; Kot, S.; Hussain, H.I.; Jermsittiparsert, K. Impact of economic growth, environmental pollution, and energy consumption on health expenditure and R&D expenditure of ASEAN countries. Energies 2019, 12, 3598. [Google Scholar]
  27. Crijns-Graus, W.; Wild, P.; Amineh, M.P.; Hu, J.; Yue, H. International Comparison of Research and Investments in New Renewable Electricity Technologies: A Focus on the European Union and China. Energies 2022, 15, 6383. [Google Scholar] [CrossRef]
  28. Zaman, K.A.U.; Sarker, T. Public finance and fiscal instruments for sustainable development. De Gruyter Handb. Sustain. Dev. Financ. 2022, 153. [Google Scholar] [CrossRef]
  29. Shahzad, U. Environmental taxes, energy consumption, and environmental quality: Theoretical survey with policy implications. Environ. Sci. Pollut. Res. 2020, 27, 24848–24862. [Google Scholar] [CrossRef]
  30. Afshan, S.; Yaqoob, T. The potency of eco-innovation, natural resource and financial development on ecological footprint: A quantile-ARDL-based evidence from China. Environ. Sci. Pollut. Res. 2022, 29, 50675–50685. [Google Scholar] [CrossRef] [PubMed]
  31. Liu, X.; Chen, S. Has environmental regulation facilitated the green transformation of the marine industry? Mar. Policy 2022, 144, 105238. [Google Scholar] [CrossRef]
  32. Hieu, V.M. Influence of green investment, environmental tax and sustainable environment: Evidence from ASEAN countries. Int. J. Energy Econ. Policy 2022, 12, 227–235. [Google Scholar] [CrossRef]
  33. Tseng, S.; Appraising Singapore’s Carbon Tax through the Lens of Sustainability; NUS Law Working Paper No. 2022/002 and NUS Asia-Pacific Centre for Environment Law Working Paper 22/01. 2022. Available online: https://papers.ssrn.com/sol3/papers.cfm?abstract_id=4005891 (accessed on 2 March 2023).
  34. Taghizadeh-Hesary, F.; Yoshino, N. Sustainable solutions for green financing and investment in renewable energy projects. Energies 2020, 13, 788. [Google Scholar] [CrossRef] [Green Version]
  35. ASEAN. ASEAN Investment Report 2020–2021. 2021. Available online: https://asean.org/wp-content/uploads/2021/09/AIR-2020-2021.pdf (accessed on 8 January 2022).
  36. Marquardt, J.; Delina, L.L. Reimagining energy futures: Contributions from community sustainable energy transitions in Thailand and the Philippines. Energy Res. Soc. Sci. 2019, 49, 91–102. [Google Scholar] [CrossRef]
  37. Kılıç, U.; Kekezoğlu, B. A review of solar photovoltaic incentives and Policy: Selected countries and Turkey. Ain Shams Eng. J. 2022, 13, 101669. [Google Scholar] [CrossRef]
  38. Mika, K.; Minna, M.; Noora, V.; Jyrki, L.; Jari, K.O.; Anna, A.; Eliyan, C.; Dany, V.; Maarit, K. Situation analysis of energy use and consumption in Cambodia: Household access to energy. Environ. Dev. Sustain. 2021, 23, 18631–18655. [Google Scholar] [CrossRef]
  39. Qaqaya, H. Sustainability of ASEAN integration, competition policy, and the challenges of COVID-19. J. Antitrust Enforc. 2020, 8, 305–308. [Google Scholar] [CrossRef]
  40. Fayaz, H.; Khan, S.A.; Saleel, C.A.; Shaik, S.; Yusuf, A.A.; Veza, I.; Fattah, I.; Rawi, N.F.M.; Asyraf, M.; Alarifi, I.M. Developments in Nanoparticles Enhanced Biofuels and Solar Energy in Malaysian Perspective: A Review of State of the Art. J. Nanomater. 2022, 2022, 8091576. [Google Scholar] [CrossRef]
  41. Qazi, A.; Bhowmik, C.; Hussain, F.; Yang, S.; Naseem, U.; Adebayo, A.A.; Gumaei, A.; Al-Rakhami, M. Analyzing the public opinion as a guide for renewable-energy status in Malaysia: A case study. IEEE Trans. Eng. Manag. 2021, 70, 371–385. [Google Scholar] [CrossRef]
  42. Phoumin, H.; Kimura, F.; Arima, J. ASEAN’s energy transition towards cleaner energy system: Energy modelling scenarios and policy implications. Sustainability 2021, 13, 2819. [Google Scholar] [CrossRef]
  43. Barnes, M.; Bauer, L.; Edelberg, W. 11 Facts on the Economic Recovery from the COVID-19 Pandemic. 2021. Available online: https://www.hamiltonproject.org/assets/files/COVID_Facts.pdf (accessed on 2 March 2023).
  44. Nathaniel, S.; Khan, S.A. The nexus between urbanization, renewable energy, trade, and ecological footprint in ASEAN countries. J. Clean. Prod. 2020, 272, 122709. [Google Scholar] [CrossRef]
  45. BP. bp Statistical Review of World Energy. 2022. Available online: https://www.bp.com/content/dam/bp/business-sites/en/global/corporate/pdfs/energy-economics/statistical-review/bp-stats-review-2022-full-report.pdf (accessed on 30 January 2023).
  46. NUS. Resilience of Renewable Energy in Asia Pacific to the COVID-19 Pandemic. 2022. Available online: https://www.kas.de/documents/265079/265128/Resilience+of+Renewable+Energy+in+Asia+Pacific+to+the+COVID-19+Pandemic.pdf/c13b1882-d2f9-e8d4-fd14-41c4b249d6a7?version=1.1&t=1615453667153 (accessed on 9 January 2023).
  47. Sadiq, M.; Hsu, C.-C.; Zhang, Y.; Chien, F. COVID-19 fear and volatility index movements: Empirical insights from ASEAN stock markets. Environ. Sci. Pollut. Res. 2021, 28, 67167–67184. [Google Scholar] [CrossRef] [PubMed]
  48. Phoumin, H.; Kimura, F.; Arima, J. ASEAN Energy Landscape and Emissions: The Modelling Scenarios and Policy Implications. In Energy Sustainability and Climate Change in ASEAN; Springer: Berlin/Heidelberg, Germany, 2021; pp. 111–146. [Google Scholar]
  49. Cai, Y.; Qin, Z. Review and Medium-and Long-Term Prospect of Global Oil Demand. In Annual Report on China’s Petroleum, Gas and New Energy Industry (2021); Springer: Berlin/Heidelberg, Germany, 2022; pp. 115–128. [Google Scholar]
  50. Hill, A.C. The Fight for Climate after COVID-19; Oxford University Press: Oxford, UK, 2021. [Google Scholar]
  51. Wiltshire, A.; Bernie, D.; Gohar, L.; Lowe, J.; Mathison, C.; Smith, C. Post COP26: Does the 1.5 °C climate target remain alive? Weather 2022, 77, 412–417. [Google Scholar] [CrossRef]
  52. Krittasudthacheewa, C. Development and Climate Change in the Mekong Region: Case Studies; 2019; ISBN: 978-967-2165-63-7. Available online: https://www.preventionweb.net/publication/development-and-climate-change-mekong-region-case-studies. (accessed on 2 March 2023).
  53. Nguyena, M.A.; Helgenbergerb, S.; Suryadic, B. Maximizing the Co-Benefits of Climate Action by Enhancing the NDCs of Vietnam and other ASEAN Member States. Target 2020, 11, 9. [Google Scholar]
  54. van Asselt, H.; Green, F. COP26 and the dynamics of anti-fossil fuel norms. In Wiley Interdisciplinary Reviews: Climate Change; Wiley: New York, NY, USA, 2022; p. e816. [Google Scholar]
  55. Seah, S.; Energy Transitions in ASEAN COP26 Policy Report. Newcastle University. 2021. Available online: eprints.ncl.ac.uk/file_store/production/278635/05BA9894-7D52-4579-A66B-51A03C85A881.pdf (accessed on 2 March 2023).
  56. Luo, J.; Ali, S.A.; Aziz, B.; Aljarba, A.; Akeel, H.; Hanif, I. Impact of natural resource rents and economic growth on environmental degradation in the context of COP-26: Evidence from low-income, middle-income, and high-income Asian countries. Resour. Policy 2023, 80, 103269. [Google Scholar] [CrossRef]
  57. Johnstone, I. Governance of the Energy Transition in the ASEAN: Current Status and Future Potential. 2022. Available online: papers.ssrn.com/sol3/papers.cfm?abstract_id=4291916 (accessed on 2 March 2023).
  58. Noch, N.A.; Wijayanti, P. Potensi Reduksi Gas Rumah Kaca di TPA Kawatuna melalui Proyek Pemulihan Gas Metana: Reduction of Greenhouse Gases in Kawatuna Landfill through Methane Gas Recovery Project. J. Teknol. Lingkung. 2022, 23, 100–109. [Google Scholar] [CrossRef]
  59. Handayani, K.; Anugrah, P.; Goembira, F.; Overland, I.; Suryadi, B.; Swandaru, A. Moving beyond the NDCs: ASEAN pathways to a net-zero emissions power sector in 2050. Appl. Energy 2022, 311, 118580. [Google Scholar] [CrossRef]
  60. Yeon, S.; Centrality and Community: ASEAN in the Regional Comprehensive Economic Partnership. ERIA. 2022. Available online: www.eria.org/uploads/media/discussion-papers/FY22/Centrality-and-Community-ASEAN-in-the-Regional-Comprehensive.pdf (accessed on 2 March 2023).
  61. Renewables & Sustainable Finance on Acceleration Mode. 2020. Available online: https://www.maybank.com/mibg/files/2022/05_ESG_Renewables_and_Sustainable_Finance_on_Acceleration_Mode.pdf (accessed on 9 January 2022).
  62. Jiang, H.; Gao, Y.; Xu, P.; Li, J. Study of future power interconnection scheme in ASEAN. Glob. Energy Interconnect. 2019, 2, 549–559. [Google Scholar] [CrossRef]
  63. Vakulchuk, R.; Overland, I.; Suryadi, B. ASEAN’s energy transition: How to attract more investment in renewable energy. Energy Ecol. Environ. 2022, 8, 1–16. [Google Scholar]
  64. Al Hakim, R.R.; Ariyanto, E.; Arief, Y.Z.; Sungkowo, A.; Trikolas, T. Preliminary Study of Juridical Aspects of Renewable Energy Draft Law In Indonesia: An Academic Perspectives. ADLIYA J. Huk. Dan Kemanus. 2022, 16, 59–72. [Google Scholar]
  65. Junlakarn, S.; Kittner, N.; Tongsopit, S.; Saelim, S.J.R.; Reviews, S. A cross-country comparison of compensation mechanisms for distributed photovoltaics in the Philippines, Thailand, and Vietnam. Renew. Sustain. Energy Rev. 2021, 145, 110820. [Google Scholar] [CrossRef]
  66. Abbass, K.; Qasim, M.Z.; Song, H.; Murshed, M.; Mahmood, H.; Younis, I. A review of the global climate change impacts, adaptation, and sustainable mitigation measures. Environ. Sci. Pollut. Res. 2022, 29, 42539–42559. [Google Scholar] [CrossRef]
  67. Vaka, M.; Walvekar, R.; Rasheed, A.K.; Khalid, M. A review on Malaysia’s solar energy pathway towards carbon-neutral Malaysia beyond COVID’19 pandemic. J. Clean. Prod. 2020, 273, 122834. [Google Scholar] [CrossRef]
  68. Taqwa, A. Higher Education Role in Supporting Indonesian Government Policy in Developing Renewable Energy. J. Phys. Conf. Ser. 2019, 1167, 012010. [Google Scholar] [CrossRef]
  69. Alzahrani, A.; Ramu, S.K.; Devarajan, G.; Vairavasundaram, I.; Vairavasundaram, S. A review on hydrogen-based hybrid microgrid system: Topologies for hydrogen energy storage, integration, and energy management with solar and wind energy. Energies 2022, 15, 7979. [Google Scholar] [CrossRef]
  70. Huang, Y.W.; Kittner, N.; Kammen, D.M. ASEAN grid flexibility: Preparedness for grid integration of renewable energy. Energy Policy 2019, 128, 711–726. [Google Scholar] [CrossRef]
  71. Nguyen, D.T.T. Air Quality-Related Health and Environmental Trade-off of Electrification: Evidence from Vietnam. Richard A. Harrison Symposium. May 2021. Available online: lux.lawrence.edu/harrison/8/ (accessed on 2 March 2023).
  72. Anbumozhi, V.; Phoumin, H.; Kimura, S.; Purwanto, A.; Lutfiana, D. Fostering Energy Market Synergies in the Mekong Subregion and ASEAN’. In Subregional Development Strategy in ASEAN after COVID-19: Inclusiveness and Sustainability in the Mekong Subregion (Mekong 2030); Kimura, F., Ed.; ERIA: Jakarta, Indonesia, 2020; pp. BP139–BP160. [Google Scholar]
  73. ASEANPOST. 5 Energy Companies to Look out for in ASEAN. Available online: https://theaseanpost.com/article/5-energy-companies-look-out-asean (accessed on 9 January 2023).
  74. Cravioto, J.; Ohgaki, H.; Che, H.S.; Tan, C.; Kobayashi, S.; Toe, H.; Long, B.; Oudaya, E.; Rahim, N.A.; Farzeneh, H.J. The effects of rural electrification on quality of life: A southeast Asian perspective. Energies 2020, 13, 2410. [Google Scholar] [CrossRef]
  75. Phoumin, H.; Kimura, F. The impacts of energy insecurity on household welfare in Cambodia: Empirical evidence and policy implications. Econ. Model. 2019, 82, 35–41. [Google Scholar] [CrossRef]
  76. Yulianto, B.; Maarif, S.; Wijaya, C.; Hardjomidjojo, H. Energy security scenario based on renewable resources: A case study of East Sumba, East Nusa Tenggara, Indonesia. BISNIS BIROKRASI J. Ilmu Adm. Dan Organ. 2019, 26, 2. [Google Scholar] [CrossRef]
  77. Sobok, S. The Impacts of Fossil Fuel Subsidy Reform on the Uptake of Sustainable Energy in the ASEAN Region: A Case Study of Indonesia; Murdoch University: Murdoch, Australia, 2020. [Google Scholar]
  78. Ly, K.; Metternicht, G.; Marshall, L. Transboundary river basins: Scenarios of hydropower development and operation under extreme climate conditions. Sci. Total Environ. 2022, 803, 149828. [Google Scholar] [CrossRef]
  79. Gasser, P. A review on energy security indices to compare country performances. Energy Policy 2020, 139, 111339. [Google Scholar] [CrossRef]
  80. Shadman, S.; Chin, C.; Sakundarini, N.; Yap, E. Quantifying the impact of energy shortage on Malaysia’s energy security using a system dynamics approach. In Recent Trends in Manufacturing and Materials Towards Industry 4.0; Springer: Berlin/Heidelberg, Germany, 2021; pp. 143–154. [Google Scholar]
  81. Ralph, N.; Hancock, L. Energy security, transnational politics, and renewable electricity exports in Australia and Southeast Asia. Energy Res. Soc. Sci. 2019, 49, 233–240. [Google Scholar] [CrossRef]
  82. Traivivatana, S.; Wangjiraniran, W. Thailand Integrated Energy Blueprint (TIEB): One step towards sustainable energy sector. Energy Procedia 2019, 157, 492–497. [Google Scholar] [CrossRef]
  83. Parmar, H.; Siddhpura, M.; Siddhpura, A. A Sustainability Case Study of a Biomass Power Plant Using Empty Fruit Bunch in Malaysia; EIT Australia: West Perth, WA, Australia, 2010. [Google Scholar]
  84. Sanusi, N.A.; Moosin, A.F.; Kusairi, S. Economics; Business. Neural network analysis in forecasting the Malaysian GDP. J. Asian Financ. Econ. Bus. 2020, 7, 109–114. [Google Scholar] [CrossRef]
  85. La Viña, A.G.; Gamboa, J.R. Making space for just transition in climate change legal instruments: Philippine Nationally Determined Contributions from Paris to Glasgow, and beyond. Asia Pac. J. Environ. Law 2022, 25, 77–99. [Google Scholar]
  86. Mamat, R.; Sani, M.S.M.; Sudhakar, K.J. Renewable energy in Southeast Asia: Policies and recommendations. Sci. Total Environ. 2019, 670, 1095–1102. [Google Scholar]
  87. Zulkarnaen, W.; Erfiansyah, E.; Syahril, N.N.A.; Leonandri, D.G. Comparative Study of Tax Policy Related to COVID-19 in ASEAN Countries. Int. J. TEST Eng. Manag. 2020, 83, 6519–6528. [Google Scholar]
  88. Eroğlu, H.; Erdem, C.Ü. Solar energy sector under the influence of COVID-19 pandemic: A critical review. J. Energy Syst. 2021, 5, 244–251. [Google Scholar] [CrossRef]
  89. DeWit, A. Climate ‘Code Red’ at COP26 and the Diversification of Decarbonization Narratives. 2022. Volume 75, pp. 1–45. Available online: rikkyo.repo.nii.ac.jp/?action=pages_view_main&active_action=repository_view_main_item_detail&item_id=21416&item_no=1&page_id=13&block_id=49 (accessed on 2 March 2023).
  90. Vietnam Briefing. Renewables in Vietnam: Current Opportunities and Future Outlook—Vietnam Briefing News. Vietnam Briefing News 2019. Available online: www.vietnam-briefing.com/news/vietnams-push-for-renewable-energy.html/ (accessed on 2 March 2023).
  91. Arantegui, R.L.; Jäger-Waldau, A. Photovoltaics and wind status in the European Union after the Paris Agreement. Renew. Sustain. Energy Rev. 2018, 81 Pt 2, 2460–2471. [Google Scholar] [CrossRef]
  92. Meliana, M.; Kesuma, H.; Enjelina, D.; Rijanto, A.; Saraswati, D.S. Is cash flow growth helping stock performance during the COVID-19 outbreak? Evidence from Indonesia. Invest. Manag. Financ. Innov. 2022, 19, 247–261. [Google Scholar] [CrossRef]
  93. Xia, Y.; Jiang, Q.; Yang, C.; Wang, S. Belt and Road Initiative Promote Green Development of Countries and Regions along Belt & Road. Bull. Chin. Acad. Sci. 2020, 35, 602–608. (In Chinese) [Google Scholar]
  94. Mouritz, F. Implications of the COVID-19 Pandemic on China's Belt and Road Initiative. Connections 2020, 19, 115–124. [Google Scholar] [CrossRef]
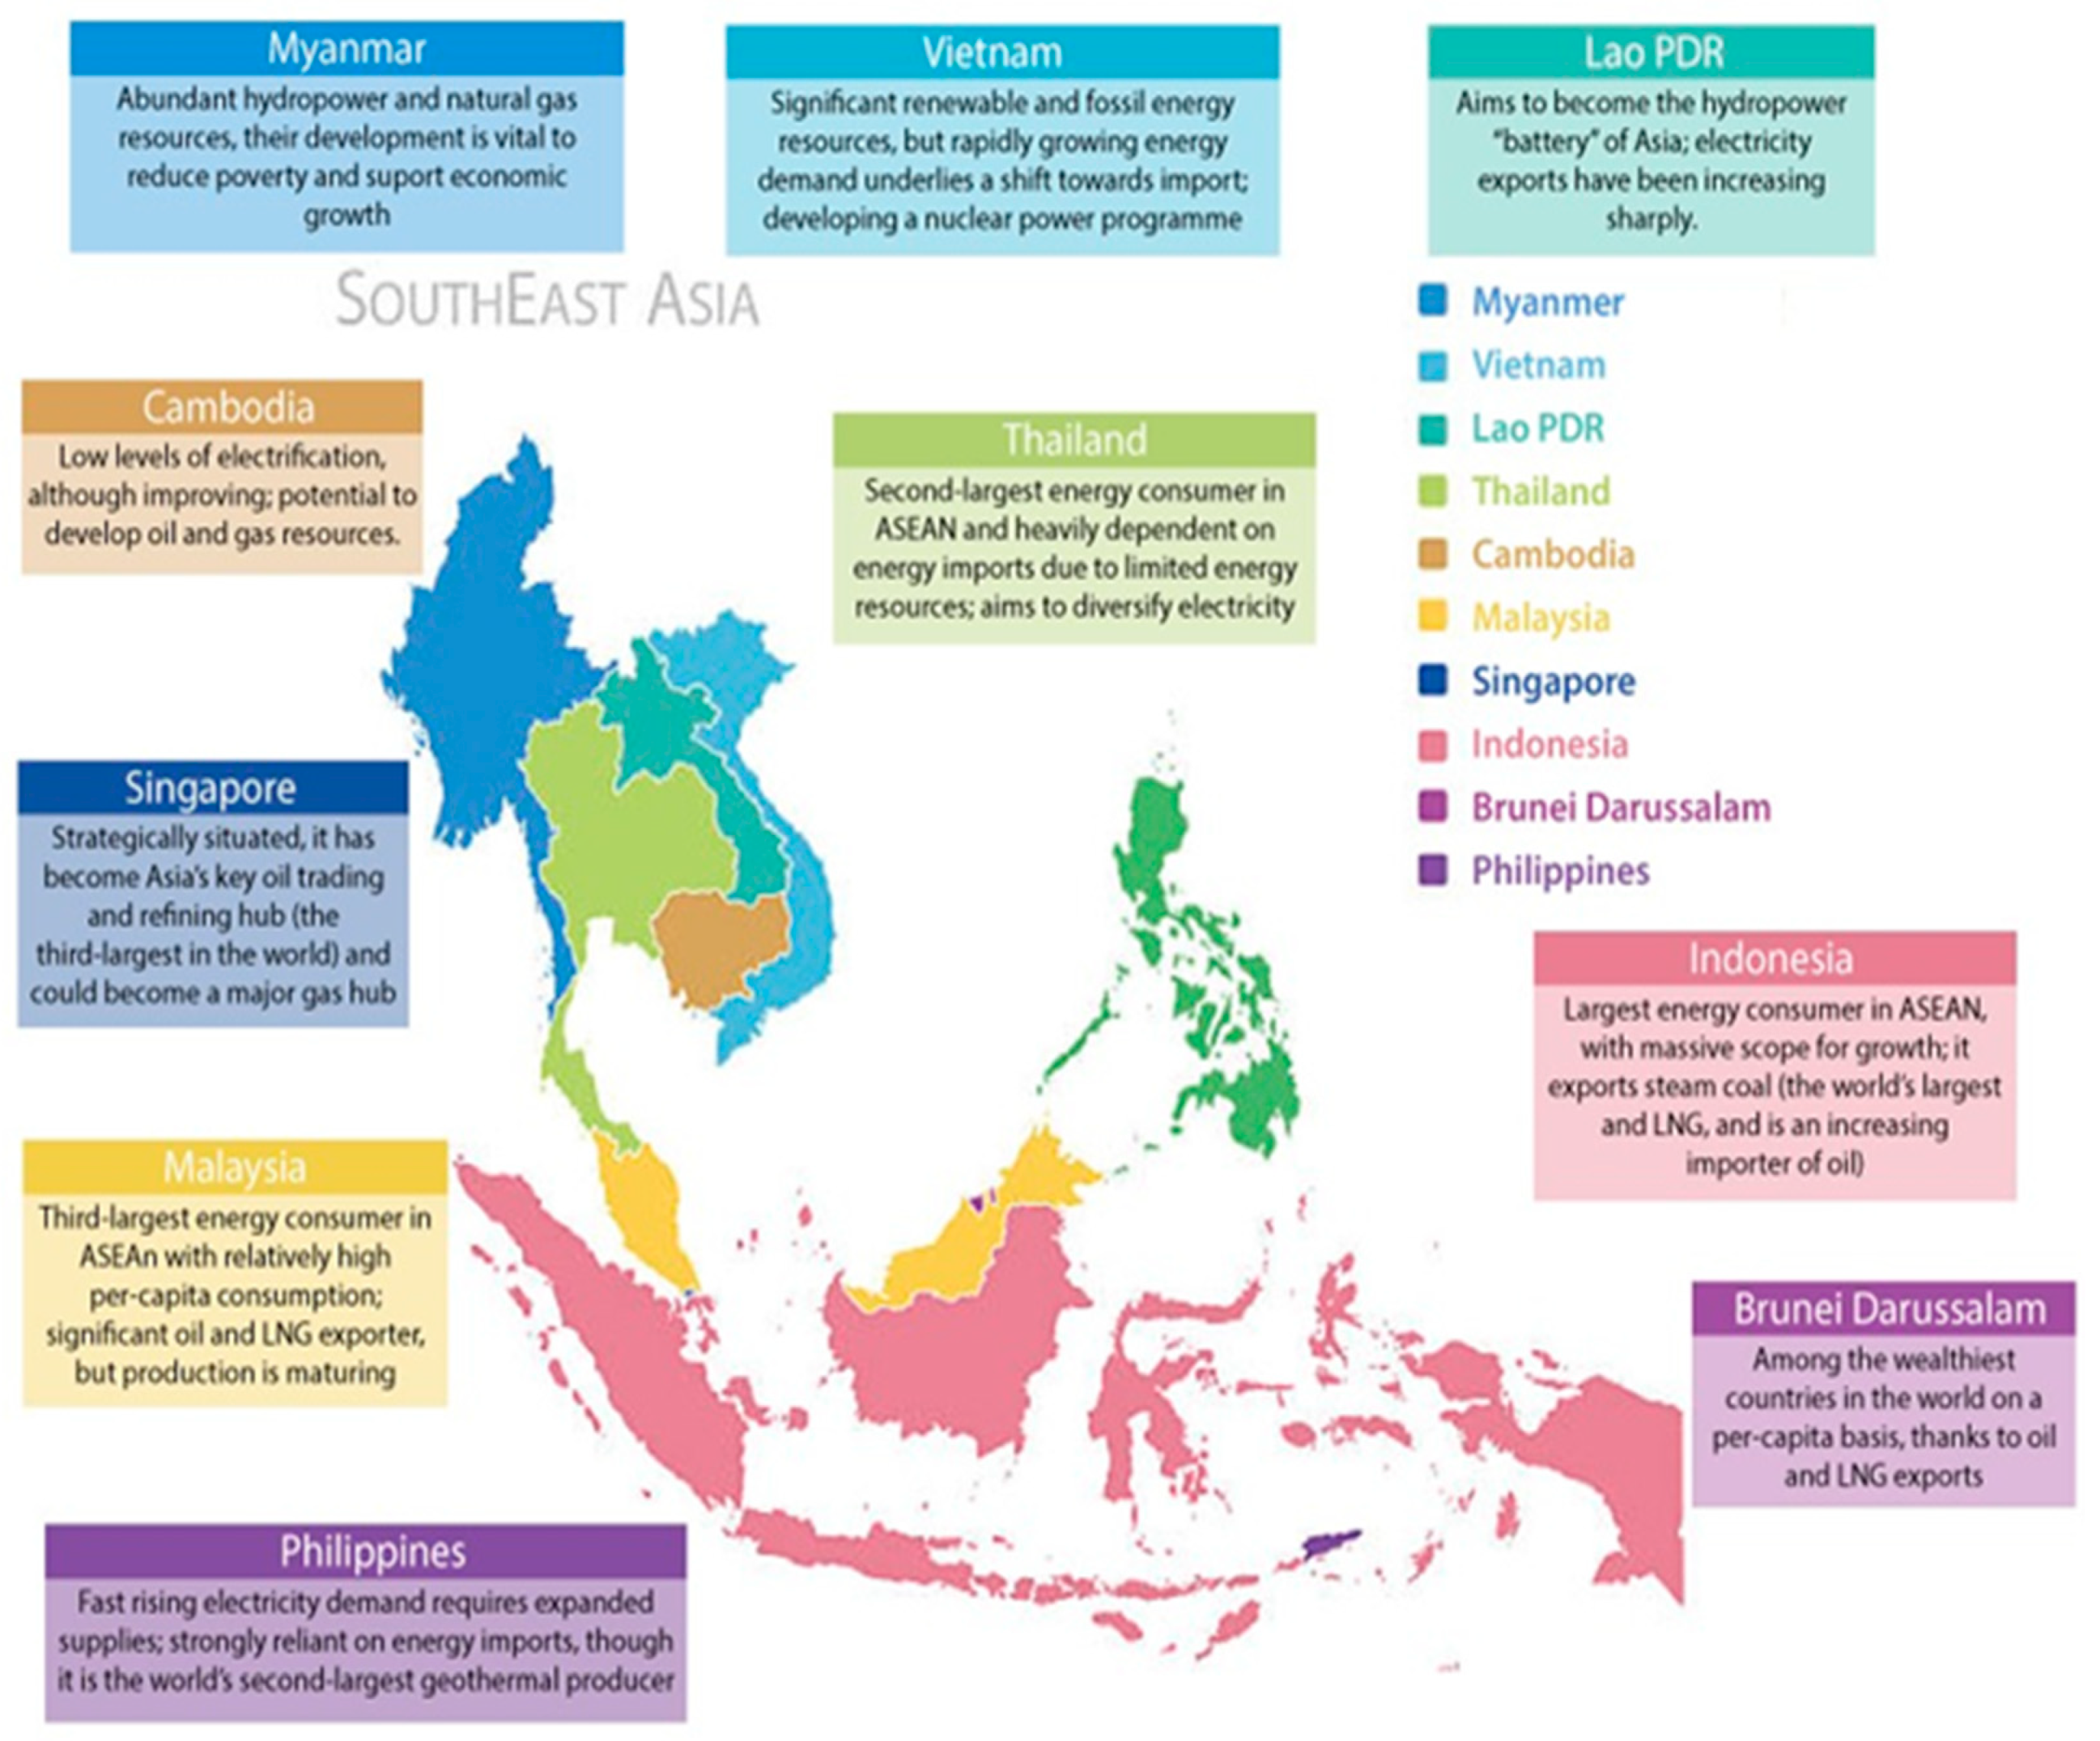
Figure 1. Energy information in the ASEAN region [7].
Sustainability 15 06961 g001
Figure 2. Solar resource map of Asia [9].
Sustainability 15 06961 g002
Figure 4. Wind speed map in the ASEAN region at 10 m above sea level [15].
Sustainability 15 06961 g004
Figure 5. Top 10 geothermal countries in the world [17].
Sustainability 15 06961 g005
Figure 6. ASEAN Bioenergy Potential Map [18].
Sustainability 15 06961 g006
Figure 7. History of installed bioenergy capacity in ASEAN [21].
Sustainability 15 06961 g007
Figure 8. Tax revenue of environmental tax in some ASEAN countries [26].
Sustainability 15 06961 g008
Figure 9. ASEAN Energy consumption by sector, 2019 vs. 2020 [44].
Sustainability 15 06961 g009
Figure 10. ASEAN forecasted energy demand pre and post pandemic [48].
Sustainability 15 06961 g010
Figure 11. AMS’ Net zero Target year [59].
Sustainability 15 06961 g011
Figure 12. Shares of installed power capacity in ASEAN in 2020 [62].
Sustainability 15 06961 g012
Figure 13. Contribution from ASEAN nations toward raising the RE share to 23% [10].
Sustainability 15 06961 g013
Figure 14. Variable renewable energy contribution to power generation (percent) from 2014 to 2025 [67].
Sustainability 15 06961 g014
Figure 16. Four factors of National Green Technology Policy.
Sustainability 15 06961 g016
Table 1. Percentage of renewable energy generation in ASEAN [8].
CountryHydroelectric PowerGeothermal PowerBiomass PowerSolar PowerWind Power
Indonesia40%15%10%--
Thailand30%-20%10%-
Philippines40%30%-10%-
Vietnam60%-20%-10%
Malaysia50%-20%10%-
Singapore--10%50%20%
Myanmar90%-5%5%-
Laos90%-5%5%-
Cambodia80%-10%10%-
Brunei90%-5%5%-
Table 2. Nationally determined contribution (NDC) of ASEAN member states.
IndonesiaMalaysiaPhilippinesSingaporeThailand
Conditional Target29% less GHG emissions by 2030 compared to BAU.By 2030, the economy’s carbon intensity (as a percentage of GDP) will be reduced by 45%.2.71% less greenhouse gas emission by 2030 compared to BAU.Peak emission at 65 Mt  C O 2 e to 2030 to achieve 36% energy intensity reduction from 2005 levels.GHG emissions will be reduced by 20% by 2030 compared to baseline.
UnconditionalTargetBy 2030, GHG emissions will be reduced by 41% compared to BAU.N/AGHG emissions will be reduced by 72.29% by 2030 compared to BAU.N/A20% cut in GHG emissions from baseline levels by 2030.
SectorsEnergy IPPU
LULUCF
Waste
Energy IPPU
Energy IPPU
LULUCF
Waste
Energy IPPU
Energy Transport
Agriculture
Waste
Energy IPPU
LULUCF
Waste
Agriculture
Energy
Transport
IPPU
Agriculture
LULUCF
Waste
GHG Coverage   C O 2
  C H 4
  N 2 0
  C O 2
  C H 4
  N 2 0
  H F C s
  P F C s
  C O 2
  C H 4
  N 2 0
  C O 2
  C H 4
  N 2 0
  C O 2
  C H 4
  N 2 0
  H F C s
  P F C s
Time Frame2020–20302021–20302020–20302021–20302021–2030
Table 3. ASEAN installed power capacity in 2020 (MW).
CoalOilGasHydroGeothermalSolarWindBioenergyOthersTotal
89,45111,92588,23459,4514058.722,94226655969393285,089
Disclaimer/Publisher’s Note: The statements, opinions and data contained in all publications are solely those of the individual author(s) and contributor(s) and not of MDPI and/or the editor(s). MDPI and/or the editor(s) disclaim responsibility for any injury to people or property resulting from any ideas, methods, instructions or products referred to in the content.