Article

Investigating the Influence of an Arduino-Based Educational Game on the Understanding of Genetics among Secondary School Students

1
Department of Software Engineering, Faculty of Engineering and Natural Sciences, Bandirma Onyedi Eylul University, Balikesir 10200, Turkey
2
Department of Information Systems, Faculty of Management, Universiti Teknologi Malaysia, Johor Bahru 81310, Malaysia
3
Erbaa Istiklal Secondary School, Tokat 60500, Turkey
*
Author to whom correspondence should be addressed.
Sustainability 2023, 15(8), 6942; https://doi.org/10.3390/su15086942
Submission received: 26 March 2023 / Revised: 12 April 2023 / Accepted: 19 April 2023 / Published: 20 April 2023

Abstract

:
This study aims to investigate the impact of an educational game created using Arduino on the learning of genetics by secondary school students. To assess the effectiveness of the game, Solomon’s four-group design was employed. A total of 72 8th-grade students, comprising 30 boys and 42 girls, were randomly selected and divided into different groups. The experimental groups were taught using the educational game, while the control groups received conventional instruction. The results of the comparison test indicated no statistically significant differences in the academic performance of students between the experimental and control groups. However, the findings suggested that the educational game had a positive impact on the students’ academic success to a considerable extent and was as effective as traditional teaching methods. Moreover, the digital game had the potential to increase student engagement by enhancing their motivation, interest, and participation in science classes. This could contribute to promoting environmentally sustainable practices in schools and ensuring that all students receive a high-quality education, thereby contributing to the sustainability of the educational system.

1. Introduction

Throughout history, human beings have always needed learning and education to survive. For this reason, many definitions of education have been developed. Although the concept of education is updated over time according to new development needs, education in its most known form is the process of intellectual, physical, and emotional evolution of an individual [1]. Science education, which is a process that triggers the desire of individuals to research and examine by arousing a high level of curiosity in the individual, provides the opportunity to recognize all the components in the near and far environment and, thereby, to understand and protect the balance of nature [2]. With science education, students begin to acquire habits related to understanding scientific developments and natural phenomena. For this reason, science education has an important place in education.
Several tools, such as blackboards, chalk, pens, and books, have been used in educational environments in the past. Today, wearable devices, smart boards, tablets, and smartphones, are often used in educational settings [3]. When this paradigm change in educational materials is examined closely, the change in education–teaching processes is also noticed. The change in understanding experienced in educational processes is also emphasized in various scientific studies [4].
Since learning begins with student engagement, it has been increasingly prominent in education as an indicator of student success [5]. Engaged and active learning activities that transform learners from passive knowledge recipients to active participants in discussing, elaborating, questioning, sharing, and problem-solving increase learning and motivation [6]. Accordingly, this study aims to develop an educational game using Arduino and evaluate the effectiveness of the game.
There are some studies investigating the effect of using materials in science courses on students’ academic success [2,7]. However, in these studies the researchers used materials that were not designed by them. In addition, no study was found that covered the genetic crossover unit in the eighth-grade science course. To fill this gap, in this study the impact of the electronic material developed by the researchers on the academic success of the students was investigated. This study aims to investigate the effect of educational games on the academic success of students. For this purpose, the educational game focused on teaching genetic crossover to secondary school eighth-grade students in a science course.

2. Conceptual Framework

Science education has been defined as an educational process that enables the individual to recognize all the components of the world ecosystem, starting from his/her immediate environment, and maintain the balance of nature [2]. Therefore, science education provides an opportunity to understand and apply everything required for the protection of the future. Societies attach importance to science education to achieve advancements in the field of science and technology, facilitate human life, adapt to the developing world conditions, and raise individuals who can use science in all areas of life [8].
Science education contributes to students’ understanding of events that occur in nature [9]. It is possible to raise scientifically literate individuals who follow scientific developments closely, adopt science and technology, and develop positive attitudes towards science and nature thanks to science education [10]. Science education is a library of knowledge that can make learning about science fun and offers an opportunity to compare scientific knowledge in every aspect of life in a concrete way. Continuing science education during academic and general life not only increases the scientific knowledge of individuals, but also contributes positively to the formation and development of their sensitivity toward the environment, nature, and other living things [11]. To raise individuals who are respectful of nature and the environment, science education should be included in education programs [12].
Learning processes that appeal to more than one sense organ of individuals strengthen learning [13]. The visual richness of education and training technologies contribute to the realization of effective and permanent learning [14]. Teaching materials that can affect learners with their features, such as color and shape, contribute to the achievement of the level of attention and readiness needed in learning environments [2]. In this context, the learning outcomes in the curriculum will be processed with materials prepared by making use of educational technologies in a way that will attract the attention of the students, activate their sensory organs, facilitate learning, and provide permanent learning. For this reason, learning environments should be arranged in a way that allows students to learn by experimenting and living. With the use of teaching materials developed using educational technologies in learning environments, learning processes are supported in different ways, students are provided with the opportunity to construct knowledge in their minds, and students’ participation in the learning process is ensured [15].
Teachers play a key role in expanding the use of technology in education and benefiting from the advantages of technology [16]. Teachers’ views on the contribution of these technologies to learning processes are important as they need to have the necessary qualifications to follow the developing technology, enrich the learning tools with technology-supported materials, and integrate the technological equipment used in schools into learning environments. With the use of developing sound, image, and animation technologies in learning environments, individually or together, the topics explained appeal to more than one sense organ of the students [17]. In this way, it becomes easier to reach the learning objectives in the curriculum.
Educational games can be an effective tool for enhancing science education [18]. Games can engage students in a more active and immersive way than traditional classroom methods, making learning fun and engaging [19]. Games can help reinforce key concepts and ideas that students have already learned in the classroom [20]. Educational games can encourage collaboration and teamwork among students, which is an essential skill in science education [18]. Educational games can be highly motivating for students, making them more likely to engage with the material and retain what they have learned [21]. Overall, the use of educational games in science education can be an effective way to engage students, reinforce key concepts, and encourage collaboration and experimentation [22].
Annetta et al. investigated the impact of video games on high school students’ learning and engagement in genetics [23]. Their results revealed no significant differences in student learning, while there was a statistically significant difference in the student’s engagement level. In 2019, Chen conducted a study on science-based digital game-based learning (DGBL) and investigated four-game settings: individual competition, peer competition, the individual no competition, and peer no competition. The study showed that when the competition was introduced, group collaboration improved and anxiety decreased. However, when individuals played alone, competition caused a distraction from the learning process by making winning and losing the main focus [24].
In a recent study, teachers and students in Spain and Sweden learned about genetics using a game and their experiences and attitudes were compared [25]. The study involved an intervention where students played the game, while questionnaires were used to measure its effectiveness. The questionnaires assessed the students’ genetics knowledge before and after playing the game, their expectations and experiences, and their satisfaction with it. The results showed that the game improved the genetics knowledge of both Spanish and Swedish participants, who found it both educational and engaging. A different study looked at how an augmented reality (AR) game affected elementary school students’ learning [26]. The study conducted a 2 × 2 experiment to determine how using AR and gaming mechanisms impacted elementary school science learning. During a field trip, four groups used different media and gaming mechanisms (AR or Non-AR and Game or Non-Game). The results showed that there was no interaction between the game and AR approaches, though both significantly increased the students’ learning motivation. In contrast, only the game approach had a significant and positive effect on the student’s flow states and learning achievements.

3. Materials and Methods

3.1. Research Design

This study aimed to measure the effect of the electronic teaching material known as “Genetic Crossover Game” on the academic success of students. The electronic game was developed by the researchers for the teaching of the subject of “Heredity” in the “DNA and Genetic Code” unit of the eighth-grade science course. In this context, Solomon’s four-group design, which is a useful quantitative research method, was applied in the research. Quantitative research is the best approach to testing a theory or explanation. It examines the relationships between variables measured numerically and deals with quantity [27]. Solomon’s four-group design can be used in both experimental and quasi-experimental studies. In this design, there were two experimental and control groups formed by unbiased assignment. The electronic teaching material was only applied to the experimental group. Although the pre-experimental measurements were performed only for one of the experimental and control groups, the post-experimental measurements were performed in all groups.

3.2. Participants

The participants were 72 students (30 boys, and 42 girls) studying in the eighth-grade school located in Turkey. Participants selected for the study group in the study were determined by randomly assigned random sampling method. There were 18 students in the First Experimental Group (a) in which pre- and post-tests were applied, and 18 students in the first Control Group (b) in which pre- and post-tests were applied. There were 18 students each in the Second Experimental Group (c), to which the post-test was applied, and the Second Control Group (d), to which the post-test was applied. Students selected from 8A, 8B, 8C, and 8D branches were distributed to the experimental and control groups as in Table 1.

3.3. Procedure

The data were obtained from the participants by using the genetic crossover game achievement test during the 2021–22 academic year. By Solomon’s four-group design, data were obtained from four groups formed by unbiased assignment. Four groups, two experimental and two control groups, were formed from the four selected groups. The achievement test, which was prepared before the start of the experimental process, was applied to two groups (the first experimental group and the first control group) and the final test was applied to all groups. After the pre-test was applied to the first experimental and control groups, the topic was taught with the electronic teaching material (educational game) prepared using the Arduino ecosystem for the acquisition of single-character crosses. The intervention lasted for two weeks for the first and second experimental groups. Afterward, the achievement test was applied to the first and second experimental groups and the final test data for the experimental group were obtained. Post-test data were obtained from the control groups by applying an achievement test to the first control group, which did not undergo experimental procedures, and the second control group, which did not undergo a pre-test. Quantitative data were collected as a result of the applications that lasted for four weeks.

3.4. Data Collection

In this study, the genetic crossover game, which is an electronic teaching material developed by the researchers, and the achievement tests were used as data collection tools. While preparing the achievement test, the eighth-grade curriculum was examined and each topic in the annual plan and the related learning outcomes, as well as the time allocated for the teaching of these learning outcomes, were defined.
To measure student achievements, a 20-item achievement test was prepared regarding the learning outcomes of the “DNA and Genetic Code” unit. An item pool of 40 questions was created for the learning outcomes. The created question pool was applied to eighth-grade students as a pilot study after an evaluation by four field experts. As a result of the analysis made after the pilot study, 20 questions were removed from the test in line with expert opinions and the final achievement test was obtained. Each multiple-choice item in the test consisted of one item root, four options, and one correct answer. Sample questions in the achievement test included: “Which of the following crosses can be made so that all pea seeds produced by crossing peas have the same phenotype?”; “What is the probability that a yellow-seeded pea will be produced by crossing a hybrid yellow-seed pea with a hybrid yellow-seed pea?”; “As a result of crossing two heterozygous peas as genotypes, 800 peas were formed. How many of these peas are expected to have recessive characteristics?”; and “500 seeds are obtained by crossing yellow-seeded peas with green-seeded peas. Which of the following is the most likely number of green and yellow seeds? (The yellow seed gene is dominant to the green seed gene).”
Kuder-Richardson (KR-20) coefficients were used to check the reliability of the test. Cronbach’s alpha reliability coefficient of the 20 questions was found to be 0.761. Each participant was given 30 mins to administer the achievement tests as a pre- and post-test. During the evaluation process of the test, students were given one point for correct answers and zero points for incorrect answers; the total number of correct questions was multiplied by five and evaluated over 100 points.

3.5. Material Development

The teaching material consists of electronic and digital components. Arduino ecosystem was used for electronic circuit installation in the material. Arduino is a development board with a programmable microprocessor that appeals to many people of all ages and is used to develop stand-alone objects by connecting various circuit elements.
RC522 RFID card reader was used in the material to read the cards with Arduino. Three sample questions were determined to be solved by playing cards in the game. These questions were as follows:
1. What is the probability that the children of a heterozygous dark-skinned person and a homozygous light-skinned person will be light-skinned?
2. What is the probability that the first child of a blond mother and a blond father will have black hair?
3. Calculate the probability that the children of a hybrid brown-eyed father and a hybrid brown-eyed mother will have blue eyes.
In the solution of the questions, it was planned to determine the genotypes for the two individuals given in the question first and then to find the result by crossing these genotypes. The letters “A” and “a” for dominant and recessive genes, respectively, were used in the solutions. For example, in the solution to the third question the genotype of the crossbred brown father was determined as “Aa” and the genotype of the brown hybrid mother was determined as “Aa”; crossover was then performed.
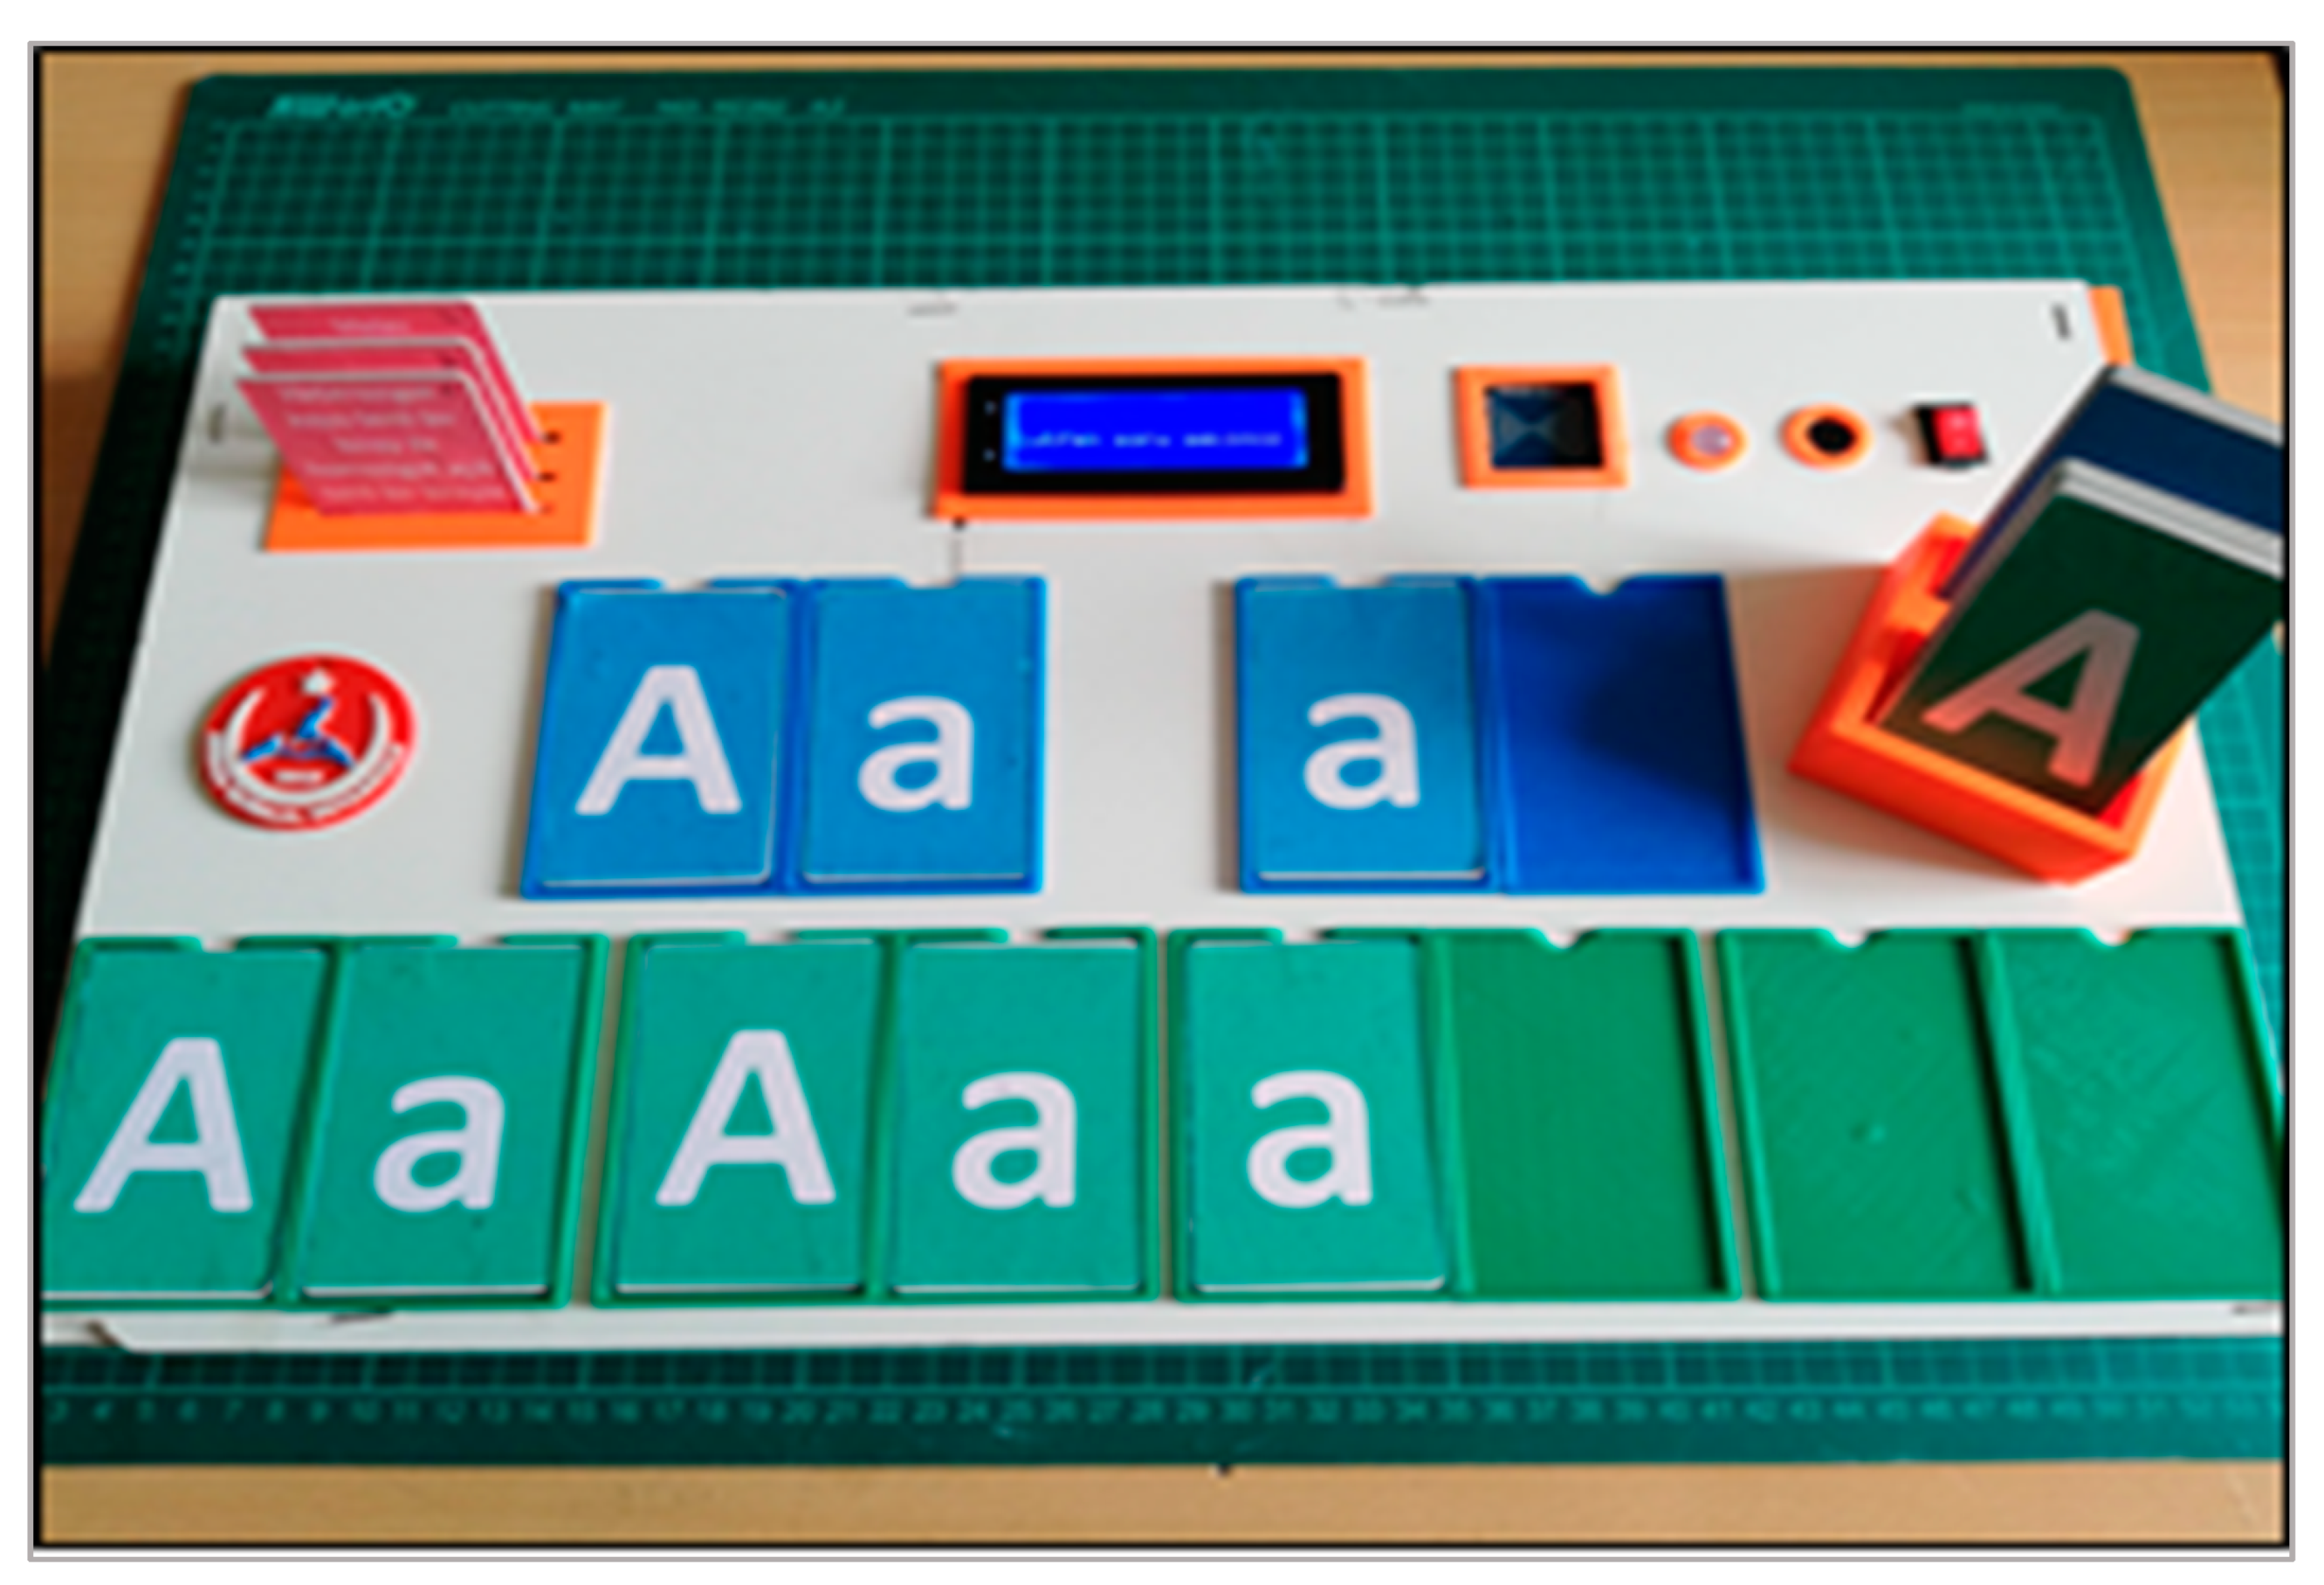
As a result of the crossing of “Aa” and “Aa” genotypes, the “aa” result came out as one of four possibilities. According to this result, the probability of having blue eyes in children born to a mixed brown-eyed father and a mixed-brown-eyed mother is 25%. In the designed game, the student will select one of the three question cards and have it read by the RFID reader. A question sentence will then be displayed on the screen and the student will find the genotypes of the first and second characters in the question and have the appropriate cards read. By crossing these genotypes, he/she will then read the appropriate cards and solve the question. When the wrong card is swiped, the program will guide the student until the correct card is swiped and make it easier to solve the question. Blue–green papers in RFID card sizes were cut and pasted on the cards and “A” and “a” were written on them. Eight blue RFID cards (four “A” and four “a” cards) were prepared to be used in the teaching of character genotypes. A total of 16 green RFID cards, 8 for both “A” and “a”, were prepared to be used in the crossover process. Question cards were prepared in red color.
At this stage, research was conducted on which electronic components from the Arduino ecosystem should be used so that the game could be played on a box. Arduino Uno development board and RC522 RFID reader were used for the material. We also used a 4 × 20 LCD screen for displaying questions, instructions, and solutions. We also decided to use a buzzer for audible notifications and an RGB LED to inform the user by flashing green on the correct cards and red on the wrong cards.
After the materials were completed, the design phase of the material box was started. The box of the game was first drawn in three dimensions on the Tinkercad site in the computer environment; 50 × 30 × 5 mm wood chipboard material in the same dimensions was then provided and assembled and the box was prepared. Necessary gaps were left on the top cover of the box for the screen, RFID reader, buzzer, RGB led, and on/off button on the cover of the game box. In Figure 1, the 3D design of the genetic crossover game that was drawn in Tinkercad is shown.
With the Tinkercad website, three-dimensional models can be constructed, real-time Arduino circuits that can work with simulation can be established, and three-dimensional models drawn with code blocks can be animated. In this study, the game box was drawn in three dimensions and wooden pieces were cut according to the drawn dimensions. As shown in Figure 2, the frames around the spaces left for the LCD screen, buzzer, RGB led, and the card slots for RFID cards to be placed on the box were drawn via the Tinkercad website and produced by 3D printing.
After the game box was assembled, the assembly of electronic components was started. Firstly, for the circuit setup of the electronic material a drawing was made in the computer environment. Fritzing is an electronic circuit drawing program where the Arduino and its components in the circuit to be established are added to the drawing board and the cable connections are created by drawing lines. In this research, the circuit was drawn on the Fritzing program and the necessary examinations were made for the stable operation of the electronic circuit. The circuit diagram drawn with Fritzing is given in Figure 2.
After the assembly of the genetic crossing game box and the electronic circuit installation processes were completed, the code of the game was written. An algorithm was designed for the code of the game as follows: (1) the user chooses one of three questions in the first stage when the game starts; (2) they will read the correct genotype profits for the first and second characters for the question they choose; and (3) they will solve the question by reading the correct cards required for the crossover operation. The ID numbers of the RFID cards used in the game will be introduced to the program in advance and the program will compare the card with the card being read.
The working logic of the program was based on three separate functions. These functions, which were activated when the user selected the question they wanted to solve, worked until the solution to the question was completed. After the logical algorithm design, to write the program with the Arduino IDE editor, the necessary libraries were added for the program to run and the IDs of the question and solution cards were recorded in the program.
After the coding phase of the game was completed, it was played by different students many times with different questions. After we confirmed that the electronic circuit and the written codes were working stably, battery connections were made to the box of the material and its final shape was given. The produced 3D printed frames and RFID card slots were fixed on the top cover of the box. Figure 3 shows the final version of the developed teaching material.
There were green and blue colored RFID cards and card slots on the upper cover of the developed teaching material, an LCD screen on the upper middle part, and a RFID reader, RGB LED, buzzer, and on/off button on the right. There were three places on the top cover of the box to place the question cards in the game and an external box was designed and produced with three-dimensional printing for the answer cards.

4. Results

To test whether the data obtained in the research show a normal distribution, the normality test was applied and the frequency and percentage distribution tables for the data were created. The numerical data obtained from the achievement tests were transferred to the computer environment and processed on the SPSS (26). Percentage, frequency, arithmetic mean, and t-tests were performed on the data with the parametric distribution. To perform parametric tests, the data should have a normal distribution; Kolmogorov–Smirnov test results shown in Table 2 indicate that the data have a normal distribution.
The t-test results shown in Table 3 show that there are no significant differences between the pre-test scores of the Experimental 1 and Control 1 Groups (t (df = 34) = −0.137, p = 0.892). Therefore, it can be said that the prior knowledge of the students in the Control 1 and 3xperimental 1 Groups was similar. Furthermore, a one-way ANOVA was conducted to compare the four groups in terms of the pre-test scores. There were no statistically significant differences in pre-test scores at the p < 0.05 level [F(1, 34) = 0.019, p = 0.892].
The t-test results shown in Table 4 indicate that there is a significant difference between the pre-test and post-test scores of the Experimental 1 Group (t (df = 17) = 16.35, p = 0.00). It was seen that the post-test averages of the Experimental 1 Group increased after the intervention. Thereby, it can be concluded that the “Genetic Crossover Game” significantly contributed to the success of the experimental 1 group.
Similarly, the t-test results for the Control 1 Group indicate that there is a statistically significant difference in the control group’s pre- and post-test scores (t = 12.48, p = 0.00). We observed that the post-test mean score (x = 56.66) of the Control Group was higher than the pre-test mean score (x = 43.06). This indicates that there is a statistically significant difference between the pre- and post-test scores for both the control and experimental groups.
As shown in Table 5, there was no significant difference between the post-test scores for Control 1 and Experimental 1 (t (df = 34) = 0.241, p = 0.811) (prior knowledge was measured in both groups), Control 2 and Experimental 2 (prior knowledge was not measured in both groups) (t (df = 34) = 0.636, p = 0.529), and Experimental 1 and Experimental 2 (t (df = 34) = −0.092, p = 0.927). This indicates that the intervention does not make a significant difference in increasing the achievements compared to the classical method. Confirming this, one-way ANOVA results indicate that there are no statistically significant differences in the post-test scores at the p < 0.05 level [F(3, 68) = 0.181, p = 0.909].

5. Discussion

This study developed an educational game using Arduino and investigated the impact of the educational game on secondary school students learning about genetics. The educational game named “Genetic Crossover Game” was developed for 8th-grade students. This study used Solomon’s four-group design to assess the effectiveness of the educational game. The findings revealed that the initial test scores of both Experimental 1 and Control 1 groups, which were assessed using pre-tests to measure their prior knowledge, were similar. However, a notable discrepancy was observed in the pre-test and post-test scores for the Experimental 1 and Control 1 groups. This means that teaching the course with the developed teaching material significantly improved the students’ success and was as effective as the traditional teaching method.
The books in the Ministry of Education curriculum increased the academic success of the Control Group students; however, the educational material developed within the scope of the study increased the academic success of the Experimental Group students at a similar rate. Accordingly, it can be argued that the teaching material developed was sufficient for delivering the targeted outcome and ensure the students’ active participation. Therefore, the memorability of the learning outcomes is expected to be higher in the experimental groups. However, this should be tested by conducting a longitudinal study.
In the literature, some studies did not find significant differences between experimental and control groups as well. For example, a master thesis investigated the effect of programming with Arduino on the achievement, attitudes, and self-efficacy of sixth-grade students toward science [28]. The post-test success scores of both the experimental and control groups were close to each other but significantly different to the pre-test scores. Similarly, a master’s thesis was conducted by following Solomon’s four-group design to test the impact of gamification on fifth-grade students’ achievement in a social studies course [29]. The results indicated no significant differences between the control and experimental groups.
On the other hand, in some studies, significant differences between control and experimental groups were reported. For example, in a master’s thesis, an experimental study was conducted using Solomon’s four-group design to determine the effect of digital games on earthquake subjects within a social studies course on academic success [30]. The results indicated that teaching with the digital game has a positive contribution to the academic success of the students. In another thesis study, the effects of robotic tools on students’ science processing skills and motivation were investigated [2]. The results indicated that teaching science education lessons with robotic tools had a positive contribution to students’ scientific process skills. Lastly, a Ph.D. dissertation compared the effectiveness of STEM applications made with simple and inexpensive materials in pre-school and STEM applications supported by robotics [7]. The results indicated that STEM applications made with both simple materials and robotics contributed to improving students’ academic self-perceptions and problem-solving skills in science education. However, robotic-assisted STEM applications were more effective in promoting students’ academic self-perceptions.

6. Conclusions

This study developed a digital educational game and assessed the effect of the developed teaching materials on students’ academic success in a science class. The digital educational game improved students’ academic success. The educational game may also improve their interest, motivation, and involvement in science learning, which in turn promotes student engagement. Engaged students are more likely to achieve improved academic results, which can improve the sustainability of the educational system. A commitment to delivering a high-quality education that satisfies the requirements of both present and future generations is necessary for educational sustainability. With the help of this study, schools will be encouraged to adopt environmentally sustainable practices and given the resources and support necessary to deliver high-quality education. Educators can contribute to the development of a better future for all students and the sustainability of education by encouraging student involvement.
There are some limitations to the study, which offer directions for further investigation. Firstly, the scope of the research can be expanded by testing some other variables, such as students’ attitudes toward science lessons, motivation, and computational thinking skills. The electronic materials developed only related to DNA and Genetic Code units in a science course. Electronic teaching materials can be developed for other units of science courses and their effects on academic success can be further examined. Secondly, the target group was secondary school students; future research should be conducted at the primary and higher education levels. Finally, electronic and digital teaching materials can be developed and other courses and their effects on students’ academic success can be examined.

Author Contributions

Conceptualization, I.A. and A.K.; methodology, I.A.; software, A.K.; validation, I.A., A.K. and M.B.; formal analysis, A.K.; investigation, I.A.; resources, A.K.; data curation, A.K.; writing—original draft preparation, I.A. and A.K.; writing—review and editing, I.A. and A.K.; visualization, A.K.; supervision, M.B.; project administration, I.A.; funding acquisition, I.A. All authors have read and agreed to the published version of the manuscript.

Funding

This research received no external funding.

Institutional Review Board Statement

The study was conducted in accordance with the Declaration of Helsinki, and approved by the Tokat Gaziosmanpasa University Institutional Review Board (protocol code 01–26 and 08/25/2022).

Informed Consent Statement

Informed consent was obtained from all subjects involved in the study.

Data Availability Statement

Data are unavailable due to privacy or ethical restrictions.

Acknowledgments

This study is a part of the MSc Thesis submitted to Tokat Gaziosmanpasa University on 30 December 2022.

Conflicts of Interest

The authors declare no conflict of interest.

References

  1. Arpaci, I. A Comparative Study of the Effects of Cultural Differences on the Adoption of Mobile Learning. Br. J. Educ. Technol. 2015, 46, 699–712. [Google Scholar] [CrossRef]
  2. Kırtay, A. The Effect of Robotic Applications on Students’ Science Process Skills and Motivation in Science Education. Master’s Thesis, Mersin University, Mersin, Turkey, 2019. [Google Scholar]
  3. Al-Emran, M.; Al-Nuaimi, M.N.; Arpaci, I.; Al-Sharafi, M.A.; Anthony Jnr., B. Towards a Wearable Education: Understanding the Determinants Affecting Students’ Adoption of Wearable Technologies Using Machine Learning Algorithms. Educ. Inf. Technol. 2023, 28, 2727–2746. [Google Scholar] [CrossRef]
  4. Arpaci, I.; Basol, G. The Impact of Preservice Teachers’ Cognitive and Technological Perceptions on Their Continuous Intention to Use Flipped Classroom. Educ. Inf. Technol. 2020, 25, 3503–3514. [Google Scholar] [CrossRef]
  5. Shulman, L.S. Making Differences: A Table of Learning. Chang. Mag. High. Learn. 2002, 34, 36–44. [Google Scholar] [CrossRef]
  6. Hake, R.R. Interactive-Engagement versus Traditional Methods: A Six-Thousand-Student Survey of Mechanics Test Data for Introductory Physics Courses. Am. J. Phys. 1998, 66, 64–74. [Google Scholar] [CrossRef]
  7. Koç, A. The Comparison of Stem Implementations with Robotic-Assisted and Simple Materials in Preschool and Basic Science Education. Ph.D. Thesis, Erciyes University, Kayseri, Turkey, 2019. [Google Scholar]
  8. Bayraklı, S. Content Analysis of Master Theses Which Were Conducted with Experimental Research in Science Education between the Years of 2008–2018. Master’s Thesis, Marmara University, Istanbul, Turkey, 2019. [Google Scholar]
  9. Vasconcelos, C.; Orion, N. Earth Science Education as a Key Component of Education for Sustainability. Sustainability 2021, 13, 1316. [Google Scholar] [CrossRef]
  10. Zhang, W.; Wang, Z. Theory and Practice of VR/AR in K-12 Science Education—A Systematic Review. Sustainability 2021, 13, 12646. [Google Scholar] [CrossRef]
  11. Trott, C.D.; Weinberg, A.E. Science Education for Sustainability: Strengthening Children’s Science Engagement through Climate Change Learning and Action. Sustainability 2020, 12, 6400. [Google Scholar] [CrossRef]
  12. Schönfelder, M.L.; Bogner, F.X. Between Science Education and Environmental Education: How Science Motivation Relates to Environmental Values. Sustainability 2020, 12, 1968. [Google Scholar] [CrossRef]
  13. Al-Emran, M.; Arpaci, I.; Salloum, S.A. An Empirical Examination of Continuous Intention to Use M-Learning: An Integrated Model. Educ. Inf. Technol. 2020, 25, 2899–2918. [Google Scholar] [CrossRef]
  14. Palomares-Ruiz, A.; Cebrián, A.; López-Parra, E.; García-Toledano, E. ICT Integration into Science Education and Its Relationship to the Digital Gender Gap. Sustainability 2020, 12, 5286. [Google Scholar] [CrossRef]
  15. Şentürk, M. The Investigation with Solomon Four-Group Design on the Effect of Using Mobile Augmented Reality (AR) Applications in the Unit Titled Solar System and beyond in the Seventh-Grade on the Students’ Academic Success, Motivation, Science and Technology Attitude. Master’s Thesis, Kocaeli University, Kocaeli, Turkey, 2018. [Google Scholar]
  16. Karataş, K.; Arpaci, I.; Yildirim, Y. Predicting the Culturally Responsive Teacher Roles with Cultural Intelligence and Self-Efficacy Using Machine Learning Classification Algorithms. Educ. Urban Soc. 2022, 001312452210879. [Google Scholar] [CrossRef]
  17. Al-Sharafi, M.A.; Al-Emran, M.; Iranmanesh, M.; Al-Qaysi, N.; Iahad, N.A.; Arpaci, I. Understanding the Impact of Knowledge Management Factors on the Sustainable Use of AI-Based Chatbots for Educational Purposes Using a Hybrid SEM-ANN Approach. Interact. Learn. Environ. 2022, 1–20. [Google Scholar] [CrossRef]
  18. Solé-Llussà, A.; Casanoves, M.; Salvadó, Z.; Garcia-Vallve, S.; Valls, C.; Novo, M. Annapurna Expedition Game: Applying Molecular Biology Tools to Learn Genetics. J. Biol. Educ. 2019, 53, 516–523. [Google Scholar] [CrossRef]
  19. Hussein, M.H.; Ow, S.H.; Elaish, M.M.; Jensen, E.O. Digital Game-Based Learning in K-12 Mathematics Education: A Systematic Literature Review. Educ. Inf. Technol. 2022, 27, 2859–2891. [Google Scholar] [CrossRef]
  20. Chen, C.-H.; Shih, C.-C.; Law, V. The Effects of Competition in Digital Game-Based Learning (DGBL): A Meta-Analysis. Educ. Technol. Res. Dev. 2020, 68, 1855–1873. [Google Scholar] [CrossRef]
  21. Bressler, D.M.; Shane Tutwiler, M.; Bodzin, A.M. Promoting Student Flow and Interest in a Science Learning Game: A Design-Based Research Study of School Scene Investigators. Educ. Technol. Res. Dev. 2021, 69, 2789–2811. [Google Scholar] [CrossRef]
  22. Chen, C.-H.; Law, V.; Chen, W.-Y. The Effects of Peer Competition-Based Science Learning Game on Secondary Students’ Performance, Achievement Goals, and Perceived Ability. Interact. Learn. Environ. 2018, 26, 235–244. [Google Scholar] [CrossRef]
  23. Annetta, L.A.; Minogue, J.; Holmes, S.Y.; Cheng, M.-T. Investigating the Impact of Video Games on High School Students’ Engagement and Learning about Genetics. Comput. Educ. 2009, 53, 74–85. [Google Scholar] [CrossRef]
  24. Chen, C.-H.; Law, V.; Huang, K. The Roles of Engagement and Competition on Learner’s Performance and Motivation in Game-Based Science Learning. Educ. Technol. Res. Dev. 2019, 67, 1003–1024. [Google Scholar] [CrossRef]
  25. Casanoves, M.; Solé-Llussà, A.; Haro, J.; Gericke, N.; Valls, C. Assessment of the Ability of Game-Based Science Learning to Enhance Genetic Understanding. Res. Sci. Technol. Educ. 2022, 1–23. [Google Scholar] [CrossRef]
  26. Chen, C.-H. Impacts of Augmented Reality and a Digital Game on Students’ Science Learning with Reflection Prompts in Multimedia Learning. Educ. Technol. Res. Dev. 2020, 68, 3057–3076. [Google Scholar] [CrossRef]
  27. Creswell, J.W.; Creswell, J.D. Research Design: Qualitative, Quantitative, and Mixed Methods Approaches; Sage Publication, Inc.: Thousand Oaks, CA, USA, 2018. [Google Scholar]
  28. Yüksel, B. The Effects of Programming with Arduino the 6th Grade Students’ Achievements, Attitudes and Self-Sufficiency Intended for Science. Master’s Thesis, Bulent Ecevit University, Zonguldak, Turkey, 2019. [Google Scholar]
  29. Yıldırım, D. Testing the Effect of Gamification on the Success of Year 5th Grade Students’ Social Science Course Learning. Master’s Thesis, Bahçeşehir University, Istanbul, Turkey, 2018. [Google Scholar]
  30. Doğan, E. The Impact of Instruction through Digital Games on Students’ Academic Achievement in Teaching Earthquakes in a Social Science Class. Master’s Thesis, Sivas University, Sivas, Turkey, 2017. [Google Scholar]
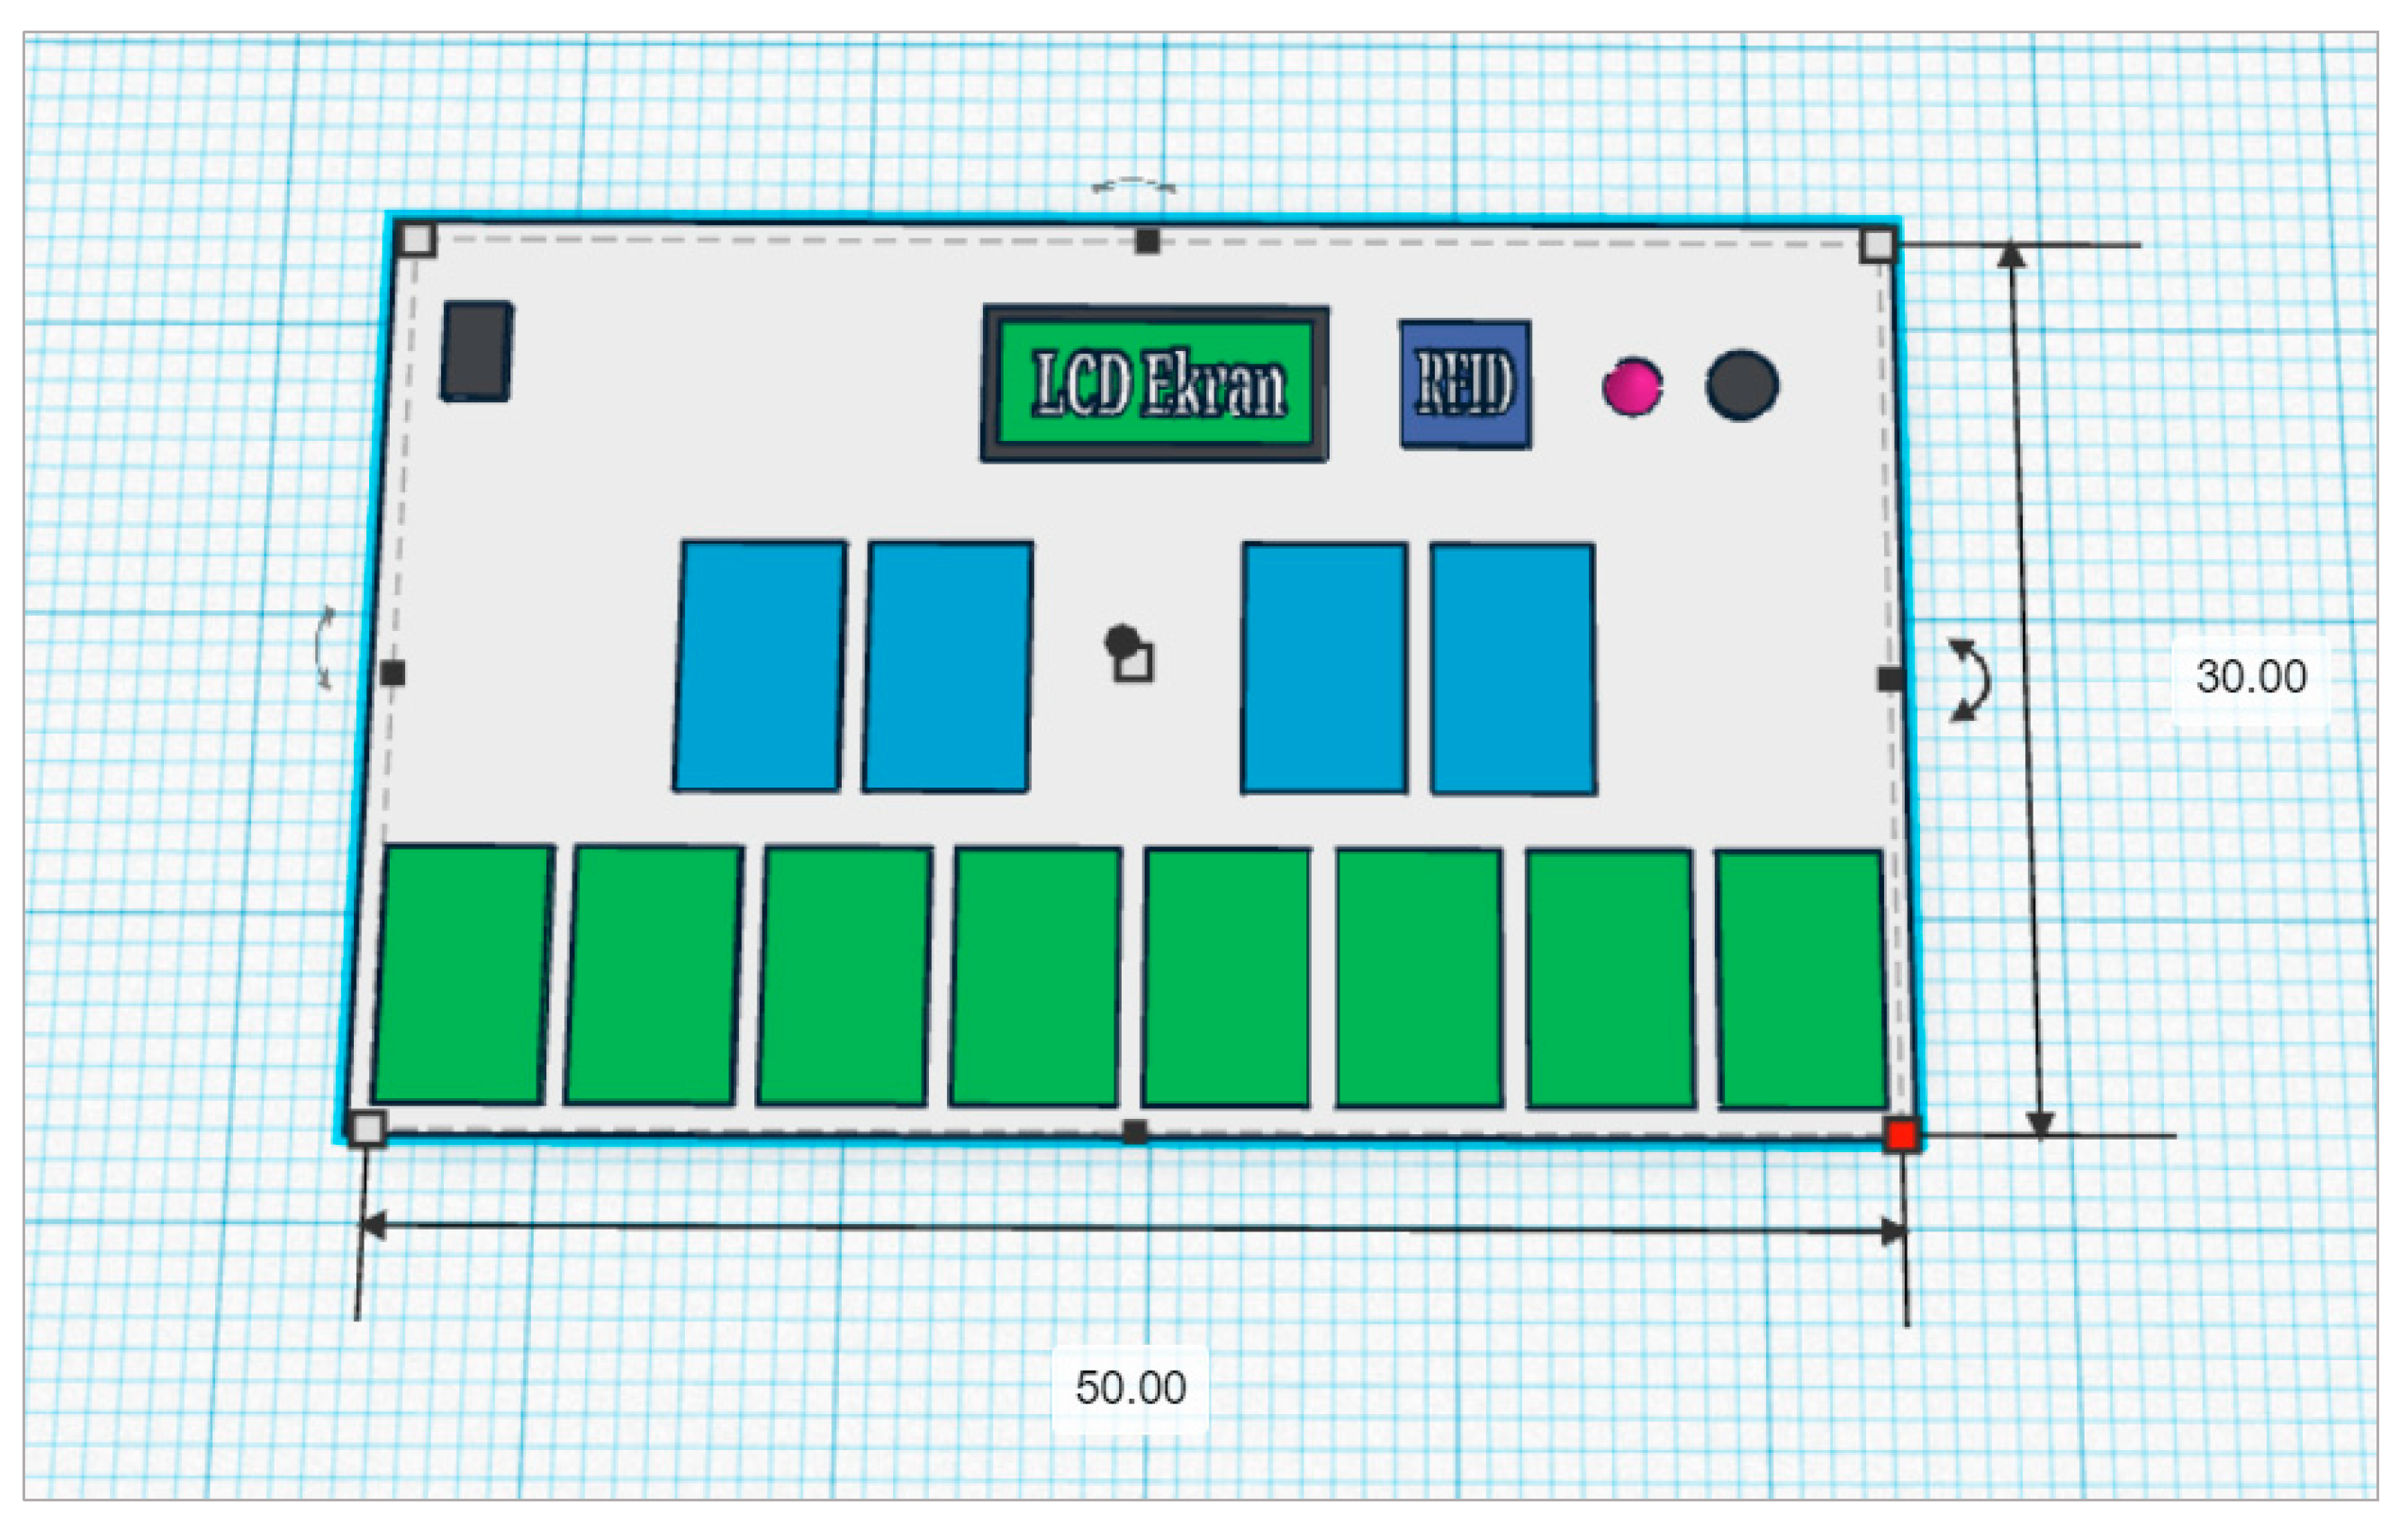
Figure 1. A 3D design of genetic crossover game.
Sustainability 15 06942 g001
Figure 2. Electronic circuit diagram.
Sustainability 15 06942 g002
Figure 3. Genetic crossover game.
Sustainability 15 06942 g003
Table 1. Demographic characteristics.
GroupNFemaleMaleTotal%
F%F%
Experimental 1181266.6633.425
Experimental 2181055.5844.525
Control 1181161.1738.925
Control 21895095025
Total7242 30 100
Table 2. Kolmogorov–Smirnov test.
StatisticD.F.Significance (p)
Pre-test0.142360.063
Post-test0.132360.116
Table 3. Pre-test results.
GroupNMeanS.D.S.E.tpCohen’s dEffect-Size r
Experimental 11842.2215.173.57−0.1370.8920.0460.023
Control 11843.0620.874.91
Table 4. Pre-test and post-test results.
Group-TestNMeanS.D.S.E.tpCohen’s dEffect-Size r
Experimental 1-pre-test1842.2215.173.5816.350.0001.0470.464
Experimental 1-post-test1858.0615.063.55
Control 1-pre-test1843.0620.874.9212.490.0000.6780.321
Control 1-post-test1856.6719.254.54
Table 5. Post-test results.
GroupNMeanS.D.S.E.tpCohen’s dEffect-Size r
Experimental 11858.0515.063.550.2410.8110.0800.040
Control 11856.6619.254.53
Experimental 21858.6120.784.890.6360.5290.2120.105
Control 21854.4418.464.35
Experimental 11858.0515.063.55−0.0920.9270.0310.015
Experimental 21858.6120.784.89
Disclaimer/Publisher’s Note: The statements, opinions and data contained in all publications are solely those of the individual author(s) and contributor(s) and not of MDPI and/or the editor(s). MDPI and/or the editor(s) disclaim responsibility for any injury to people or property resulting from any ideas, methods, instructions or products referred to in the content.