Article

Comprehensive Treatment for River Pollution in a Coastal City with a Complex River Network: A Case Study in Sanya, China

1
State Key Laboratory of Pollution Control and Resources Reuse, College of Environmental Science and Engineering, Tongji University, Shanghai 200092, China
2
Shanghai Municipal Engineering Design Institute (Group) Co., Ltd., Shanghai 200092, China
3
Shanghai Institute of Pollution Control and Ecological Security, Shanghai 200092, China
*
Authors to whom correspondence should be addressed.
Sustainability 2023, 15(8), 6830; https://doi.org/10.3390/su15086830
Submission received: 7 February 2023 / Revised: 4 April 2023 / Accepted: 13 April 2023 / Published: 18 April 2023

Abstract

:
The contamination of urban rivers substantially threatens urban ecology, public health, and general progress. Addressing this matter is complex and challenging, particularly in tidal rivers. After investigating the climate conditions, population, and distribution of rivers and pollution in Sanya, China, a hydraulic and water quality model was built for Sanya utilizing InfoWorks ICM, and a comprehensive remediation approach was proposed. The implementation of this scheme led to a substantial decrease in point and non-point sources of pollution. In particular, COD, NH3-N, and TP were reduced by 87.00%, 84.01%, and 74.24%, respectively, from point source pollution. Point source pollution was well-managed north of the bridge, with a reduction rate close to 40% for non-point source pollution. This research confirmed that pollutants are only temporarily retained in the river at high tide and are discharged as the tide recedes, thus having a limited impact on long-term pollution discharge. This research provides valuable references for applying water environment models and the comprehensive treatment of tidal river pollution. The final plan scheme is to significantly improve the water quality of Sanya’s rivers by effectively controlling the discharge of pollutants while achieving considerable cost savings of approximately CNY 1.7 billion.

1. Introduction

The global depletion of available water resources highlights the need to manage urban river pollution comprehensively. As the only tropical coastal tourist destination in the People’s Republic of China (the PRC), Sanya City faces significant challenges in maintaining water quality due to urban construction [1]. Rainwater can wash pollutants into urban rivers through the sewer system, and the increased hardening of urban land reduces surface permeability, putting additional pressure on the sewer system [2,3,4]. Additionally, internal and point source pollution contributes to urban river pollution and leads to the black-odor phenomenon in urban rivers [5,6]. Black-odorous water presents a serious threat to the urban environment, development, and the health of residents [7]. Therefore, it is imperative to control black-odorous water. According to the Action Plan for Prevention and Control of Water Pollution published by the State Council of the PRC, the proportion of black-odorous water in major urban areas should be limited to 10% by 2020 and reduced to zero by 2030 [8]. It is crucial to eliminate the black-odor phenomenon in the short term, establish a long-term mechanism to ensure that it does not reoccur, and improve the quality of the urban water environment [9].
The conventional methods of treating urban river pollution are limited in scope and effectiveness [10,11]. These methods provide temporary solutions and cannot improve the water environment as expected [12,13]. The complexity of watercourses and pollution sources, particularly in island cities, and the impact of tides on rivers make the problem even more challenging [14,15,16]. Before considering solutions to a problem, it is necessary to survey the current situation to obtain a clearer idea of how to proceed [17]. In Sanya, 10 rivers flow into the sea, each with different topographical and geomorphological features, resulting in three separate water systems. The comprehensive treatment of river pollution must consider the sources and amount of pollution, which cannot be achieved through traditional manual calculations. Therefore, new models are needed to analyze and evaluate management plans [18,19]. Nowadays, SWMM (stormwater management model), MIKE series, and InfoWorks ICM (InfoWorks Integrated Catchment Management) are the most commonly used models [20,21,22]. InfoWorks ICM emerged as a leading candidate due to its convenience and accuracy [23]. Although InfoWorks ICM is used in many types of research, there are no current investigations about the simulation of comprehensive treatment for tidal river pollution [24,25,26].
In this study, we built a model to analyze the pollution status quo using InfoWorks ICM (version 11.0). After researching the climate conditions, population, river distribution, and pollution situation in Sanya, the data regarding rainfalls, rivers, and other parameters were collected to simulate the model. Then, the model was modified with the Nash–Sutcliffe efficiency coefficient using the water quality and water level data. After the completion of model construction, a comprehensive treatment scheme was established to mitigate the emission of pollutants, regulate the number and intensity of pollution sources, and minimize the impact of pollutants on the water environment of Sanya. The proposed scheme was based on an extensive analysis of the current pollution situation. Furthermore, the effects of tide on pollutant discharge were estimated, and the pollution control strategy was adjusted accordingly. Finally, the pollution control effect of the scheme was evaluated using the model to ensure its efficacy in enhancing water self-purification capacity, preserving river ecological balance, and promoting the healthy development of water ecosystems. The final solution will significantly improve the water quality of the rivers in Sanya by effectively controlling the discharge of pollutants while reducing costs considerably.

2. Materials and Methods

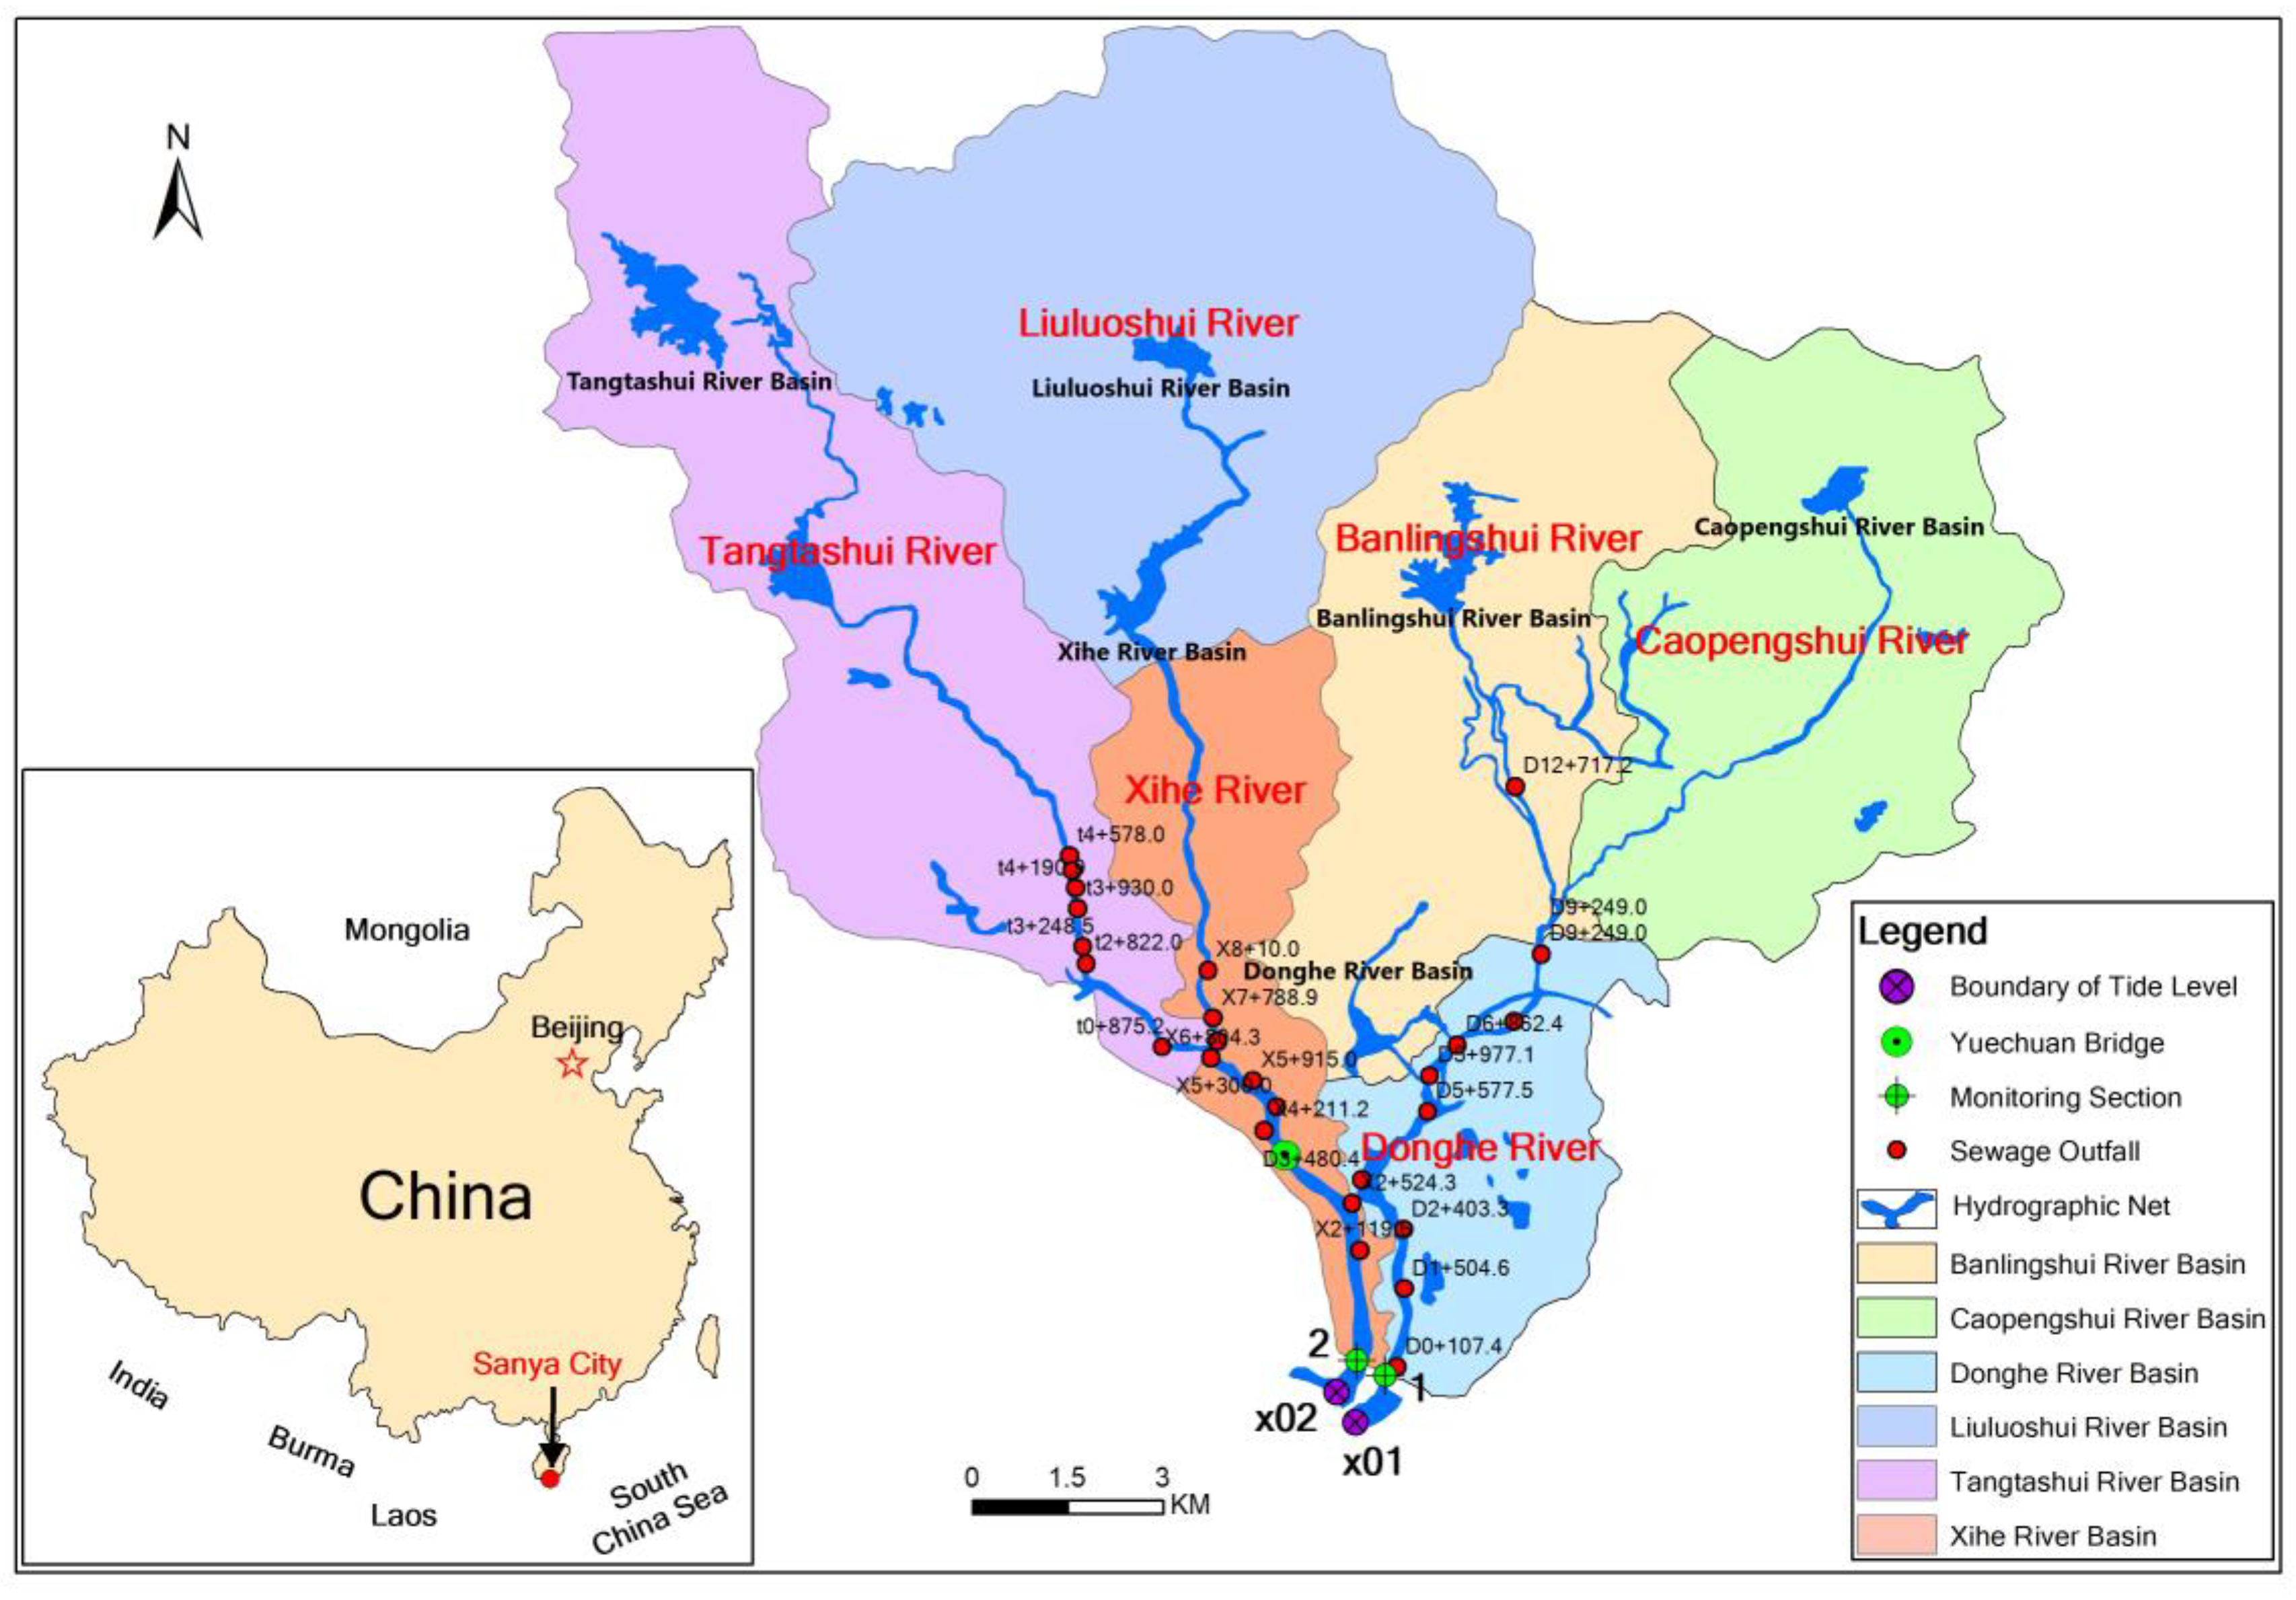
2.1. Investigation of Sanya

Sanya is situated in the tropical marine monsoon climate zone, with the rainy season spanning from June to October. Figure S1 illustrates the topography and geomorphology of Sanya. As of 2018, the permanent population of Sanya was estimated at approximately 61.46 million. Notably, the per capita water resources in Sanya were found to be significantly lower than the average for Hainan Province, measuring at approximately 2710.5 m3 per person per year based on the survey results.
The Sanya River is the main river in Sanya, China. It is made up of the Liuluoshui and Banlingshui rivers (Figure 1), with a total basin area of 337 km2. After entering the city, the Sanya River divides into two tributaries at Yuechuan Bridge: the Xihe River in the west and the Donghe River in the east. The Xihe River is located on the trunk of the Sanya River and divides into two streams near the Liaojiatian field: the Liuluoshui and Tangtashui rivers [27,28]. The Fuwan Reservoir and Shuiyuanchi Reservoir are located upstream of the Liuluoshui River, while the Tangta Reservoir is built upstream of the Tangtashui River. The Donghe River divides into the Banlingshui and Caopengshui rivers within the Lizhigou Ditch. The Banling Reservoir and Caopeng Reservoir are located upstream of the Banlingshui and Caopengshui Rivers. The highest water level of the Sanya River was found to be 15 cm above the pier of the Sanya Bridge. The basins in question are primarily employed for flood control and peak flow management while also serving as a source of drinking water. Following the “Annual Report of Environmental Quality of Sanya City in 2018”, the water quality of these basins conforms to the Class II standards as stipulated in the “Surface Water Environmental Quality Standard” (GB 3838-2002) (Table S1).
A total of 128 pollution sources characterize the Sanya River Basin, comprising 97 sewage discharge outlets, 6 pumping station overflow outlets, 7 instances of agricultural non-point source pollution, 14 instances of livestock and poultry breeding pollution, 1 case of ship pollution, 1 instance of residential sewage in shed reform areas, and 7 urban sewage sources. Of the 406 diversion rainwater outlets identified within the Sanya River Basin, 92 were observed to experience dry spells. Moreover, an overflow phenomenon has been noted in the sewage system, wherein excessive rainfall exceeding the lifting capacity of sewage pumping stations is directly discharged into the river via the overflow outlet. These issues necessitate the prompt implementation of a comprehensive treatment scheme.

2.2. Study Area and Model Data List

The basins divided the study area into six control units (Table S2). The watershed boundaries were divided by GIS according to topography, while the pollutant emission calculations were individually carried out for the six control units. According to the data provided by the Sanya Environmental Monitoring Station, the rivers south of Yuechuan Bridge are tidal. The Donghe River and Tangtashui River were selected as the typical rivers located south and north of Yuechuan Bridge, respectively. A large volume of data needed to be input for the model to be effective, such as data on rainfall, flow, water quality, etc. An exceptional description of the model data is presented in Table S3, and the sampling program is shown in Text S1. The 2D hydraulic model of Sanya is shown in Figure S2.

2.3. Hydraulic and Water Quality Models

2.3.1. Hydraulic Model

The differential equation for the water volume calculation is the Saint Venant equation based on the mass and momentum conservation law. The complete form of the Saint Venant equation considering the floodplain and side inflow is as follows (Equation (1)):
Q x + B w Z t = q Q t + 2 u Q x + g A B u 2 A x + g n 2 u Q R 4 / 3 = 0
where Q denotes the flow rate; x is the spatial coordinate along the direction of water flow; BW is the width of regulation and storage, which refers to the whole river width, including beach land; Z is the water level; t is the time coordinate; q is the side inflow flow, with inflow as positive and outflow as negative; u is the average velocity of the section; g is the acceleration due to gravity; A is the area of the main tank water passing section; B is the width of the main section; n is the roughness; and R is the hydraulic radius.

2.3.2. Water Quality Model

The basic equation of convective transport movement in the river network is as follows (Equations (2) and (3)):
AC t + QC x x AE x C x + S c S = 0
I = 1 N I Q C I , J = C Ω J d Z d t J
Equation (2) is the river channel equation, and Equation (3) is the river fork point equation, where Q is the flow rate; Z is the water level; A is the river channel area; E x is the longitudinal dispersion coefficient; C is the concentration of the material transported by the water flow; Ω is the water surface area of the river forks (nodes); J is the node number; I is the channel number connected to node J; S c is the attenuation term related to the concentration of the conveying material, for example, S c = K d   AC ; K d is the attenuation factor; and S is the external source or sink.
The forward difference scheme was adopted for the time term, the upwind scheme was adopted for the convection term, and the central difference scheme was adopted for the diffusion term.

2.4. Build the Pollution Status Quo Model

To build the model, the boundary conditions were associated with the rainfall event and event level (Figure S3). Rainfall events typically result in the generation of surface runoff that scours pollutants accumulated on the surface, thereby causing surface runoff pollution. The establishment of a sponge city in Sanya has been proposed to address this issue. Determining the rainstorm intensity formula in Sanya involved incorporating relevant parameters of rainstorm intensity from Xiamen, Shanghai, and other cities with similar climates and planned sponge cities. The resulting formula (Equation (4)) was determined through this process. To further investigate the issue of surface runoff pollution, the migration and transfer of pollutants were simulated using a water quality model. The model enabled the assessment of the extent of surface runoff pollution in the region, thereby facilitating the development of effective mitigation measures. The water quality model included the simulation of the river’s convection, diffusion, and transformation (attenuation). According to the significant slope and fast flow rate of the Sanya River, pollutants were primarily converted via convection. The transformation of pollutants included the pollutant attenuation and dissolved oxygen balance process (details shown in Text S2). The surface pollutant parameters were used in the model to calculate the build-up and wash-off of pollutants on catchment surfaces and in gully pots. More specifically, they were used to calculate dissolved concentrations and the attached mass of pollutants. The construction of the model and divisions within the catchment area are displayed in Figure S4. In order to construct the point source pollution model, 27 typical sewage outfalls were selected as the representatives to measure water flow and quality (Table S4). The non-point source pollution parameters were experience parameters provided by HR Wallingford (Text S3). The simulated results obtained using this group of parameters were compared with the calculated results of the annual runoff non-point source. The comparison results indicated that the non-point source pollution parameters used in this model were appropriate. Meanwhile, the internal pollution was calculated by measuring the pollutant release rate per unit area and the area of the riverbed (Table S5).
q = 1058 × 1 + 0.575 l o g 10 p t + 9 0.584

2.5. Calibration

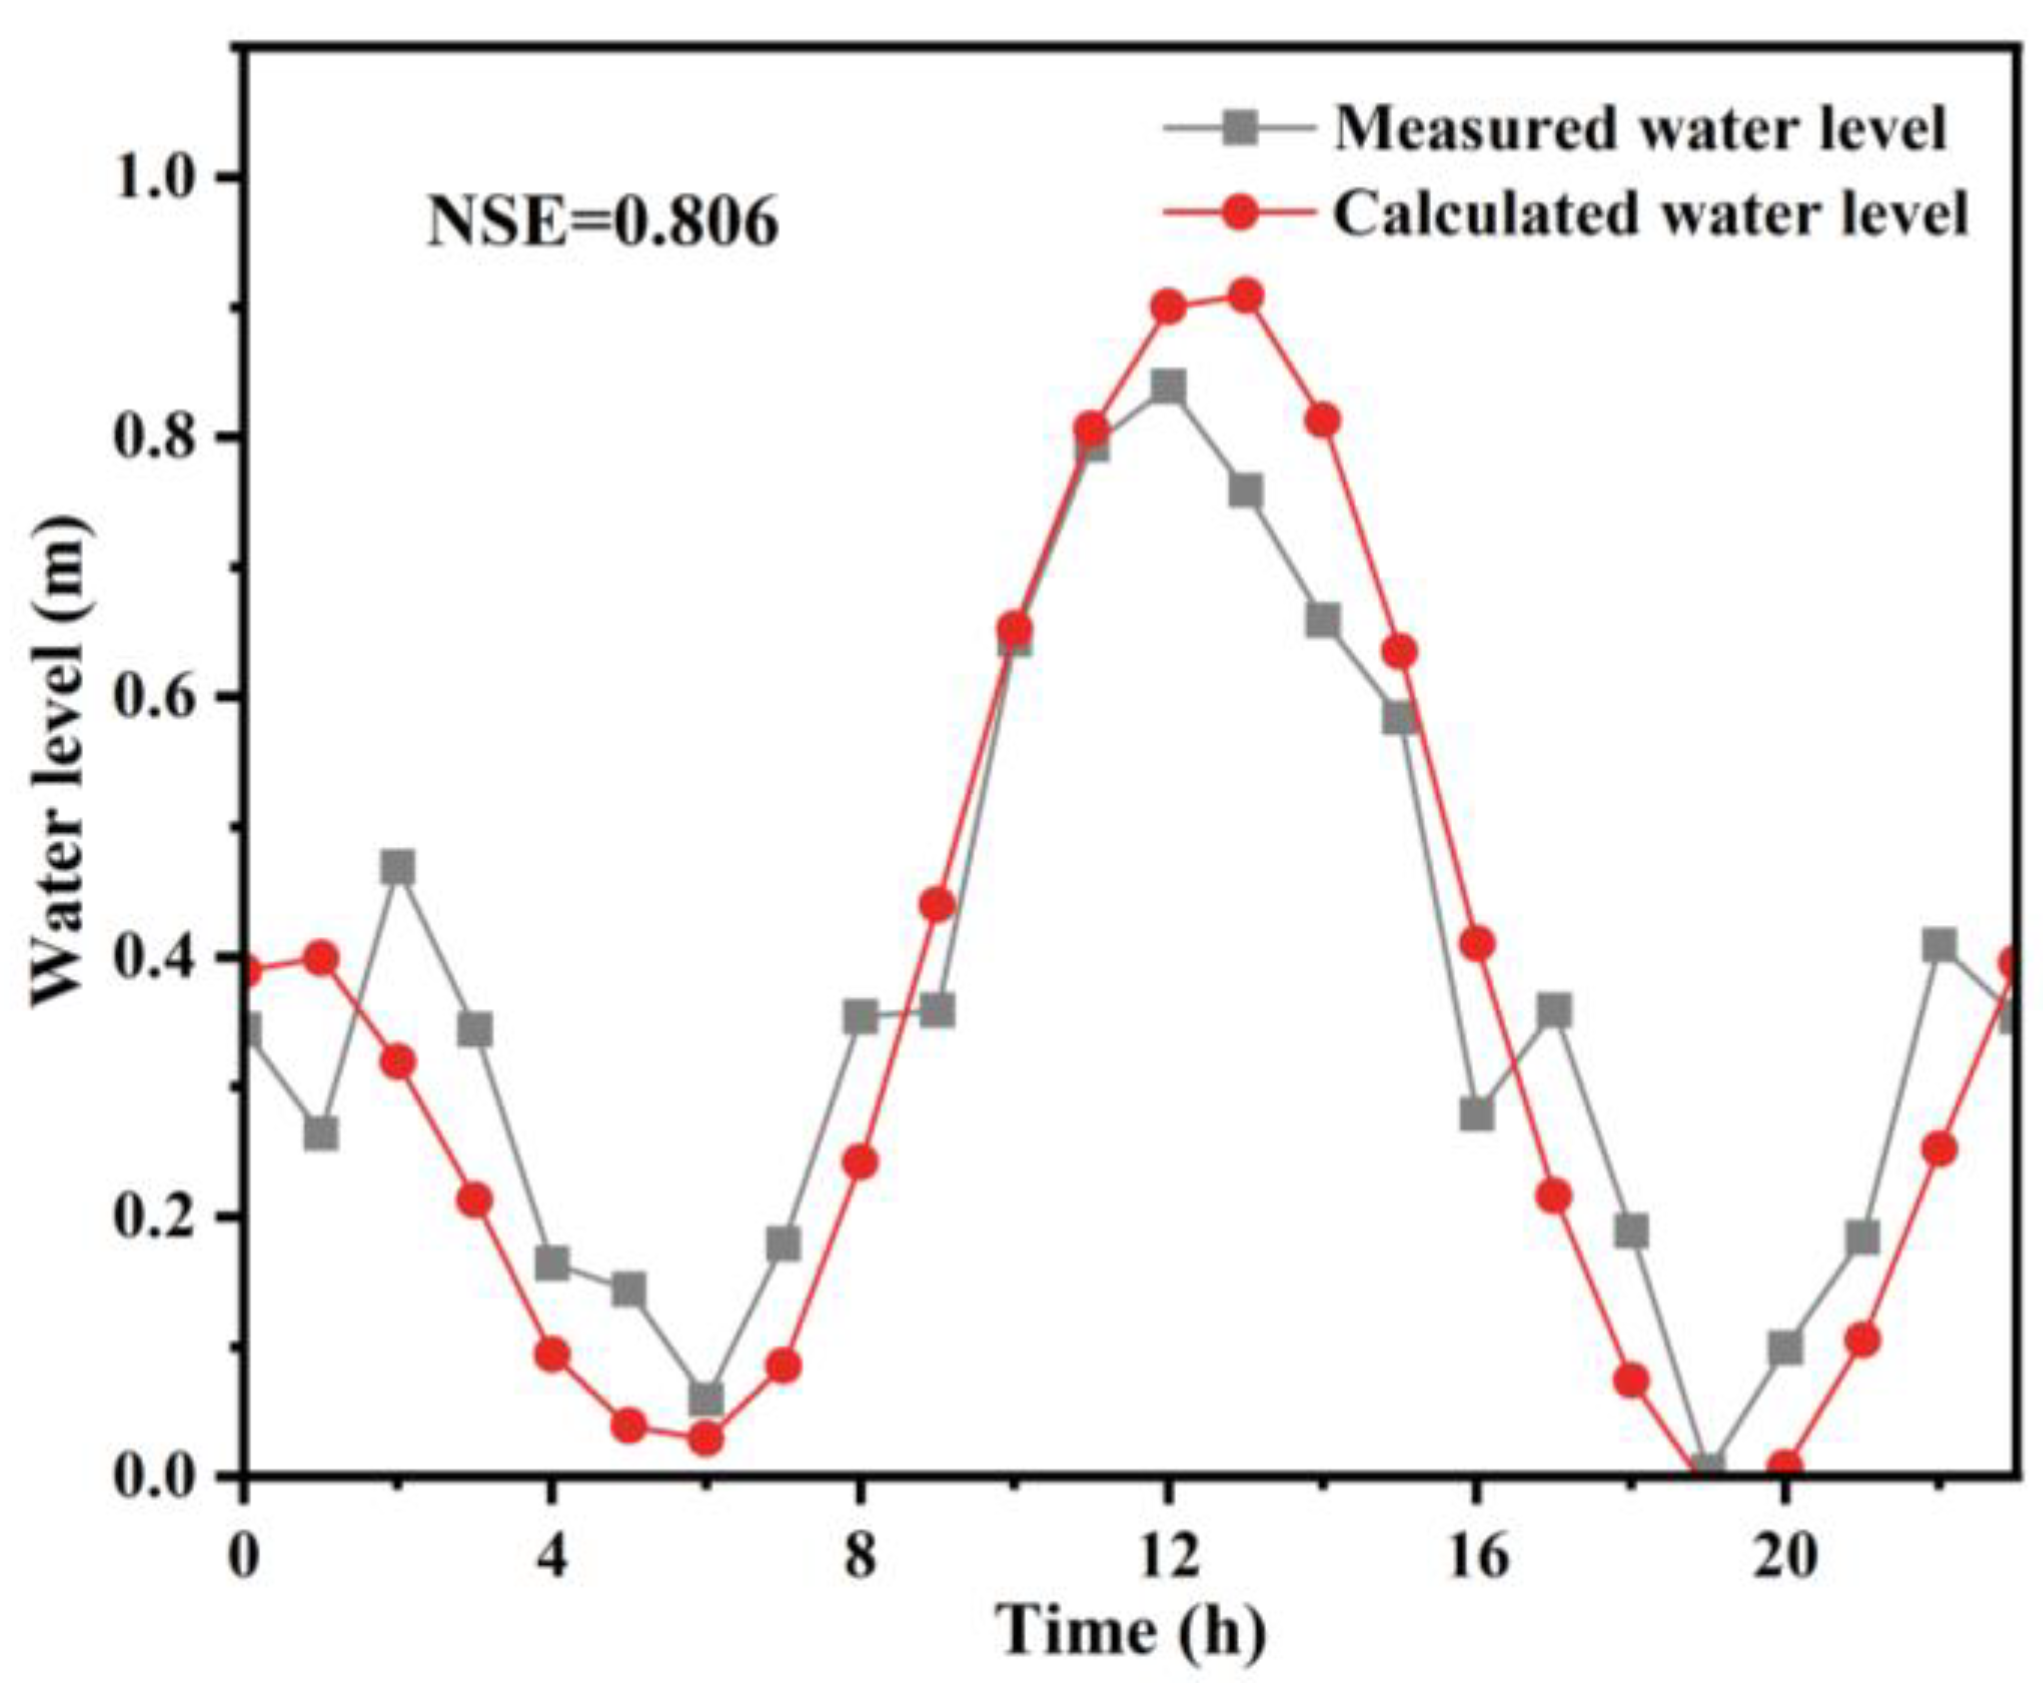
2.5.1. Hydraulic Model Calibration

The efficiency coefficient was used to evaluate the difference between the predicted and measured data. The Nash–Sutcliffe efficiency (NSE) coefficient is typically used to verify the accuracy of hydrological model results [29,30]. The specific formula is as follows (Equation (5)):
N S E = 1 t = 1 T X o t X m t 2 t = 1 T X o t X o t ¯ 2
where X o t is the measured value; X m t is the predicted value; and X o t ¯ is the total average of the measured values.
The NSE coefficient ranges from minus infinity to 1. An NSE value close to 1 indicates that the simulated value is highly consistent with the measured value, confirming that the simulation is preferable. An NSE coefficient between 0.5 and 0.6 suggests that the quality of the model is fully reliable [29,30]. If the NSE coefficient is between 0.65 and 0.86, the quality of the model is close to perfection [31,32]. In our research, the NSE coefficient was considered to evaluate the adaptation degree between the predicted and measured data on the water level. According to the NSE coefficient results, the model was optimized until the predicted value fit the measured value well. The data from Xihe River on 9 September 2018 were used for hydraulic model calibration. The NSE coefficient of the water level was 0.806, confirming that the hydraulic model can be used for further analysis (Figure 2).

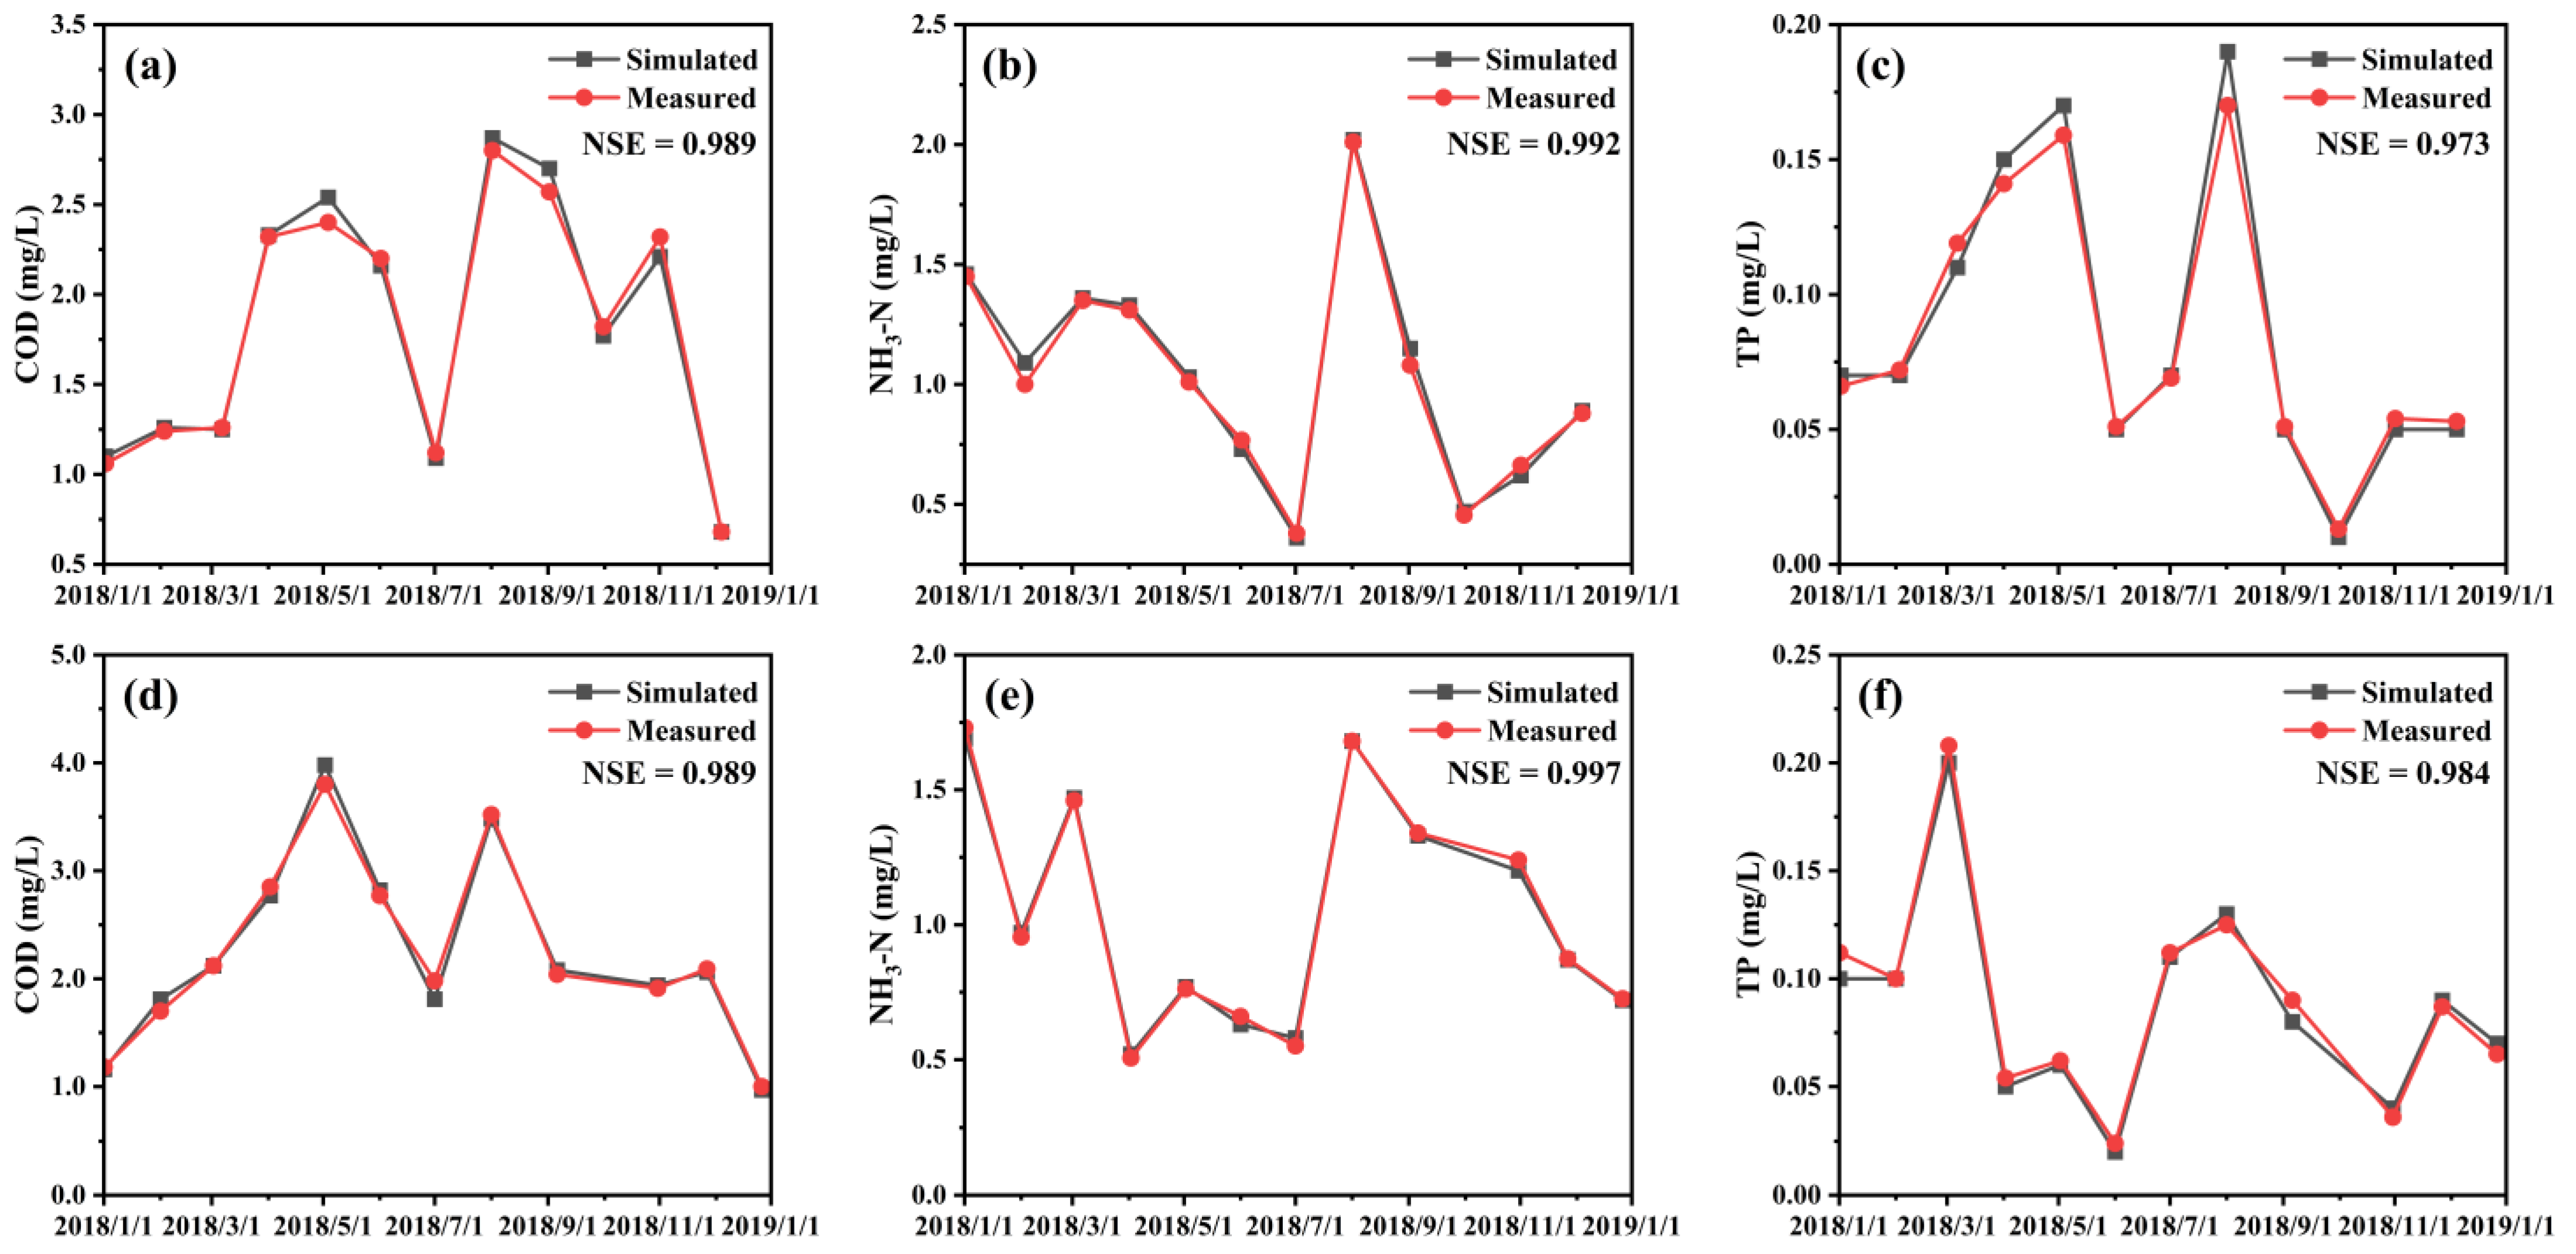
2.5.2. Water Quality Model Calibration

The Donghe River and Xihe River represent the confluence of all the rivers and estuaries in the research field. Therefore, the water quality model calibration was conducted in the above areas (1 and 2 represent the Donghe River and the Xihe River in Figure 1, respectively). The NSE coefficients of COD, NH3-N, and TP in the Donghe River and Xihe River were all more than 0.97, indicating that the performance of the water quality model fitted well (Figure 3).

3. Results and Discussion

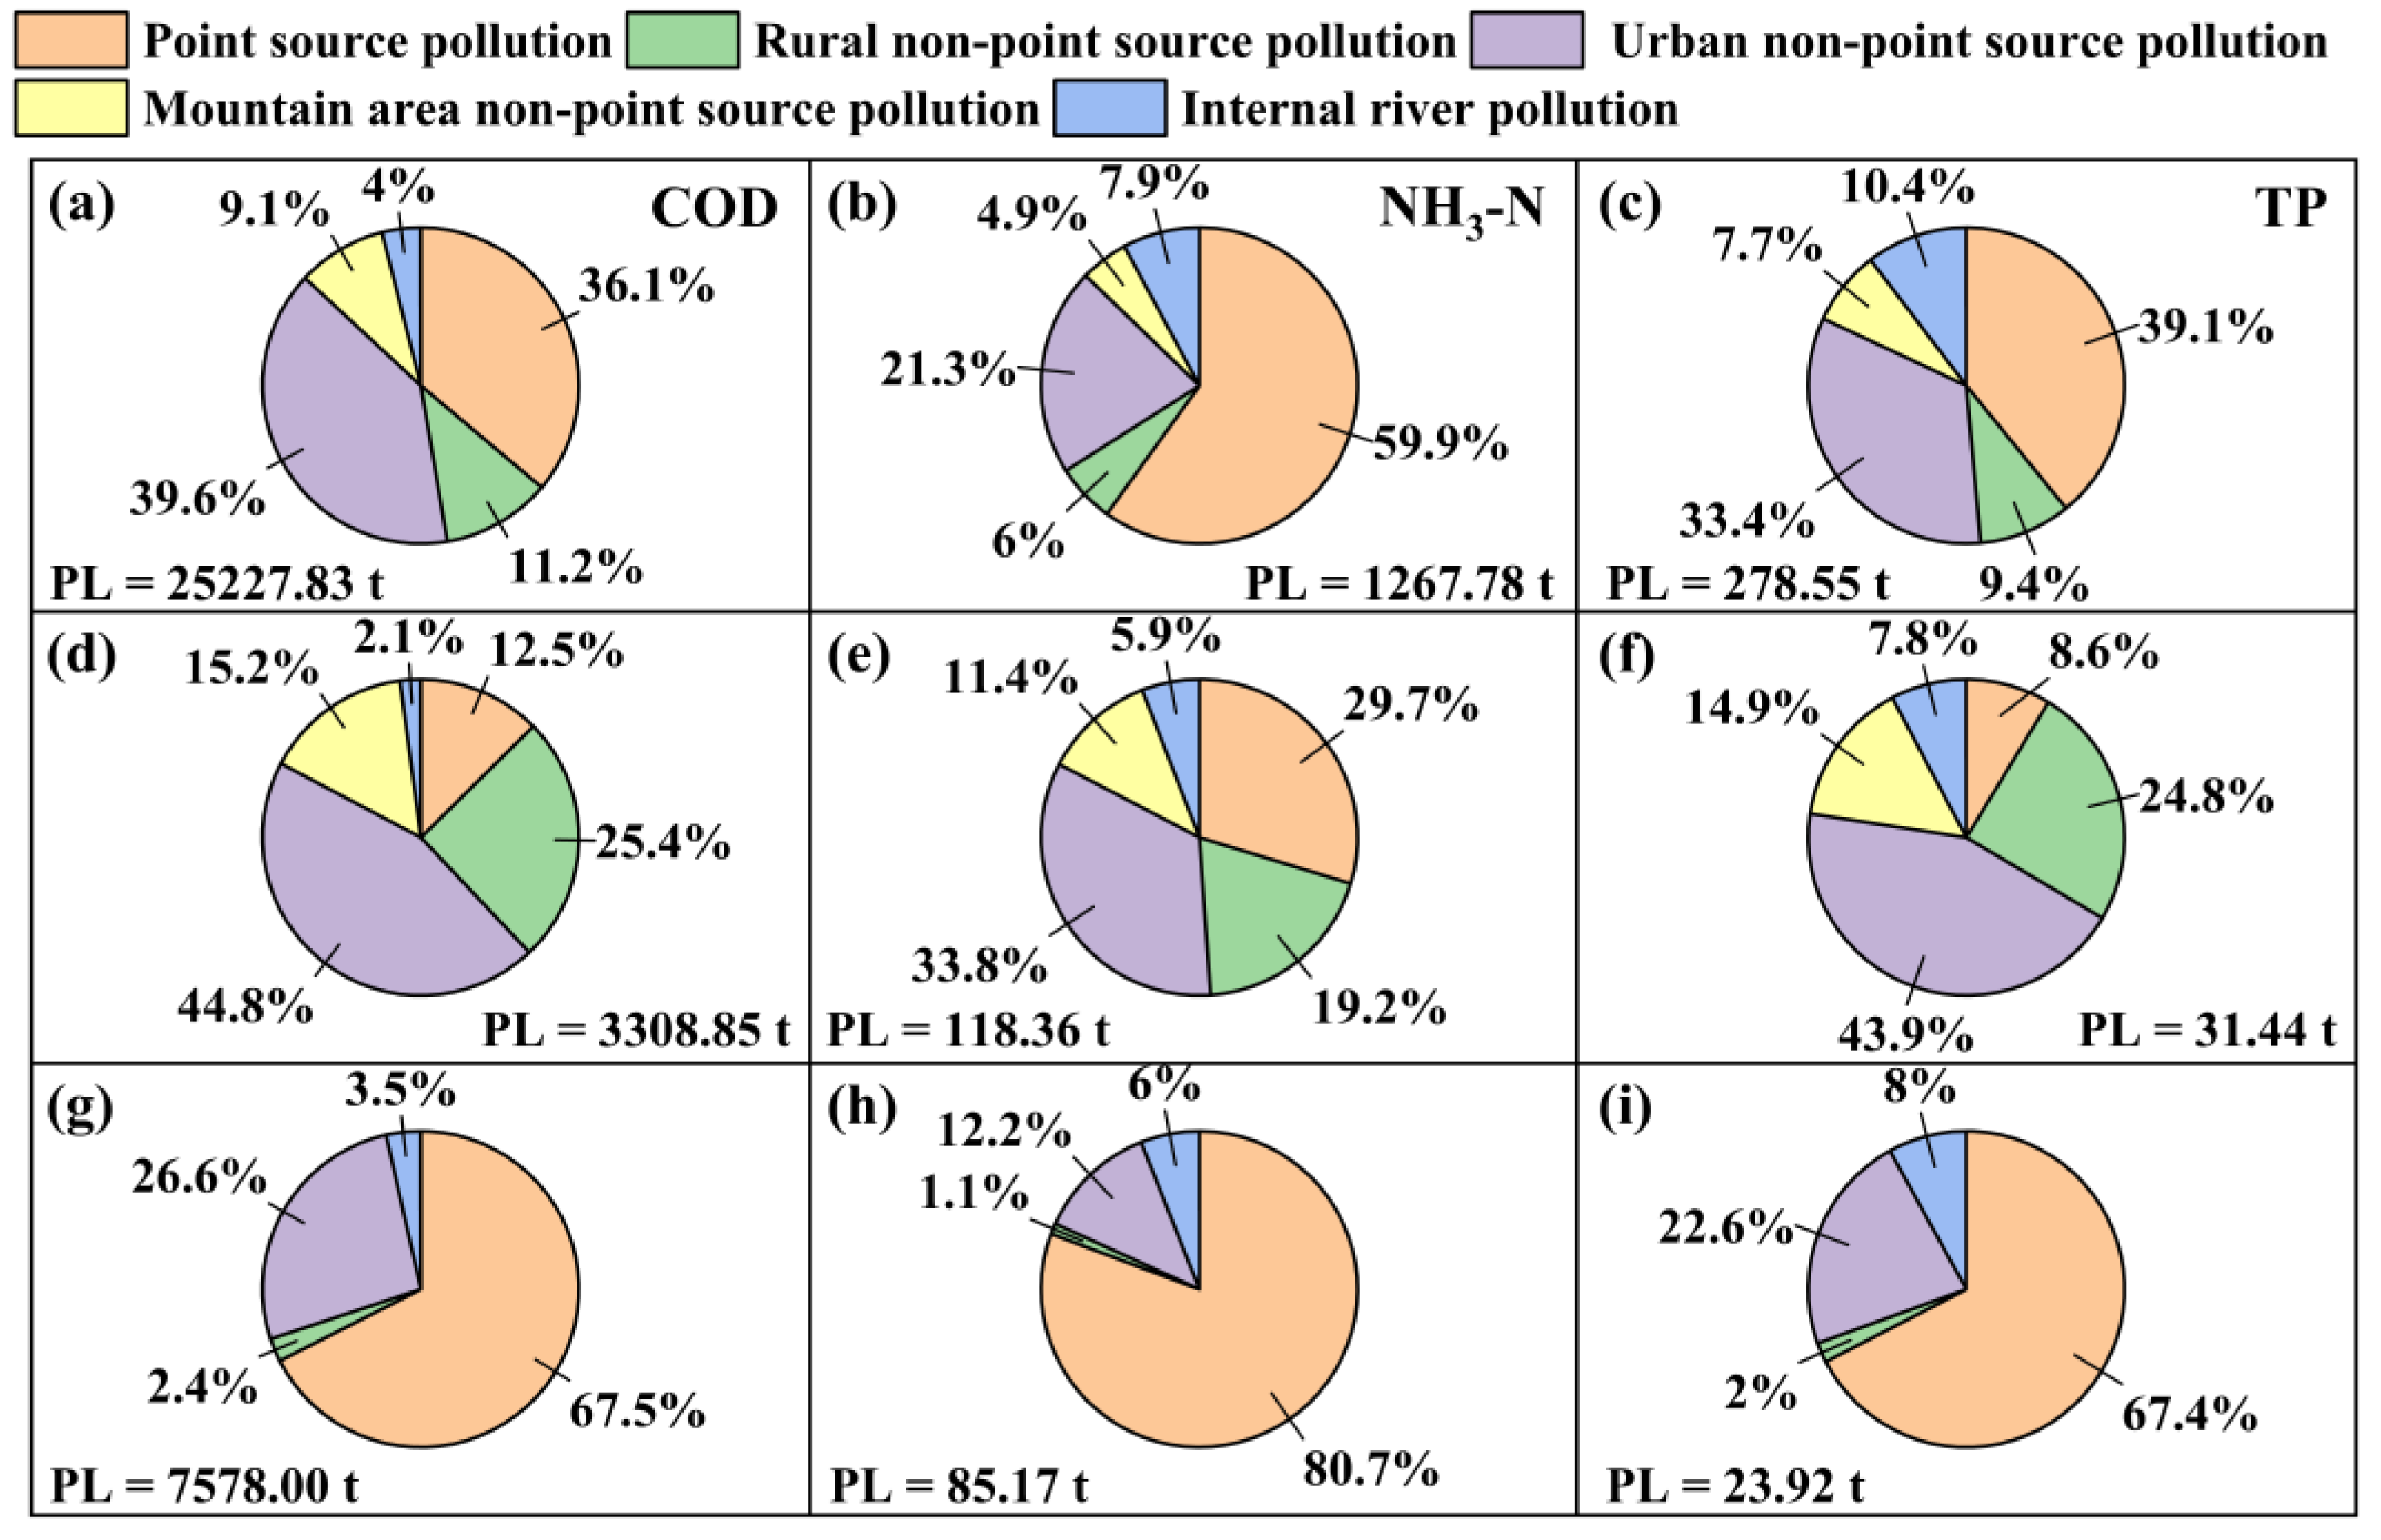
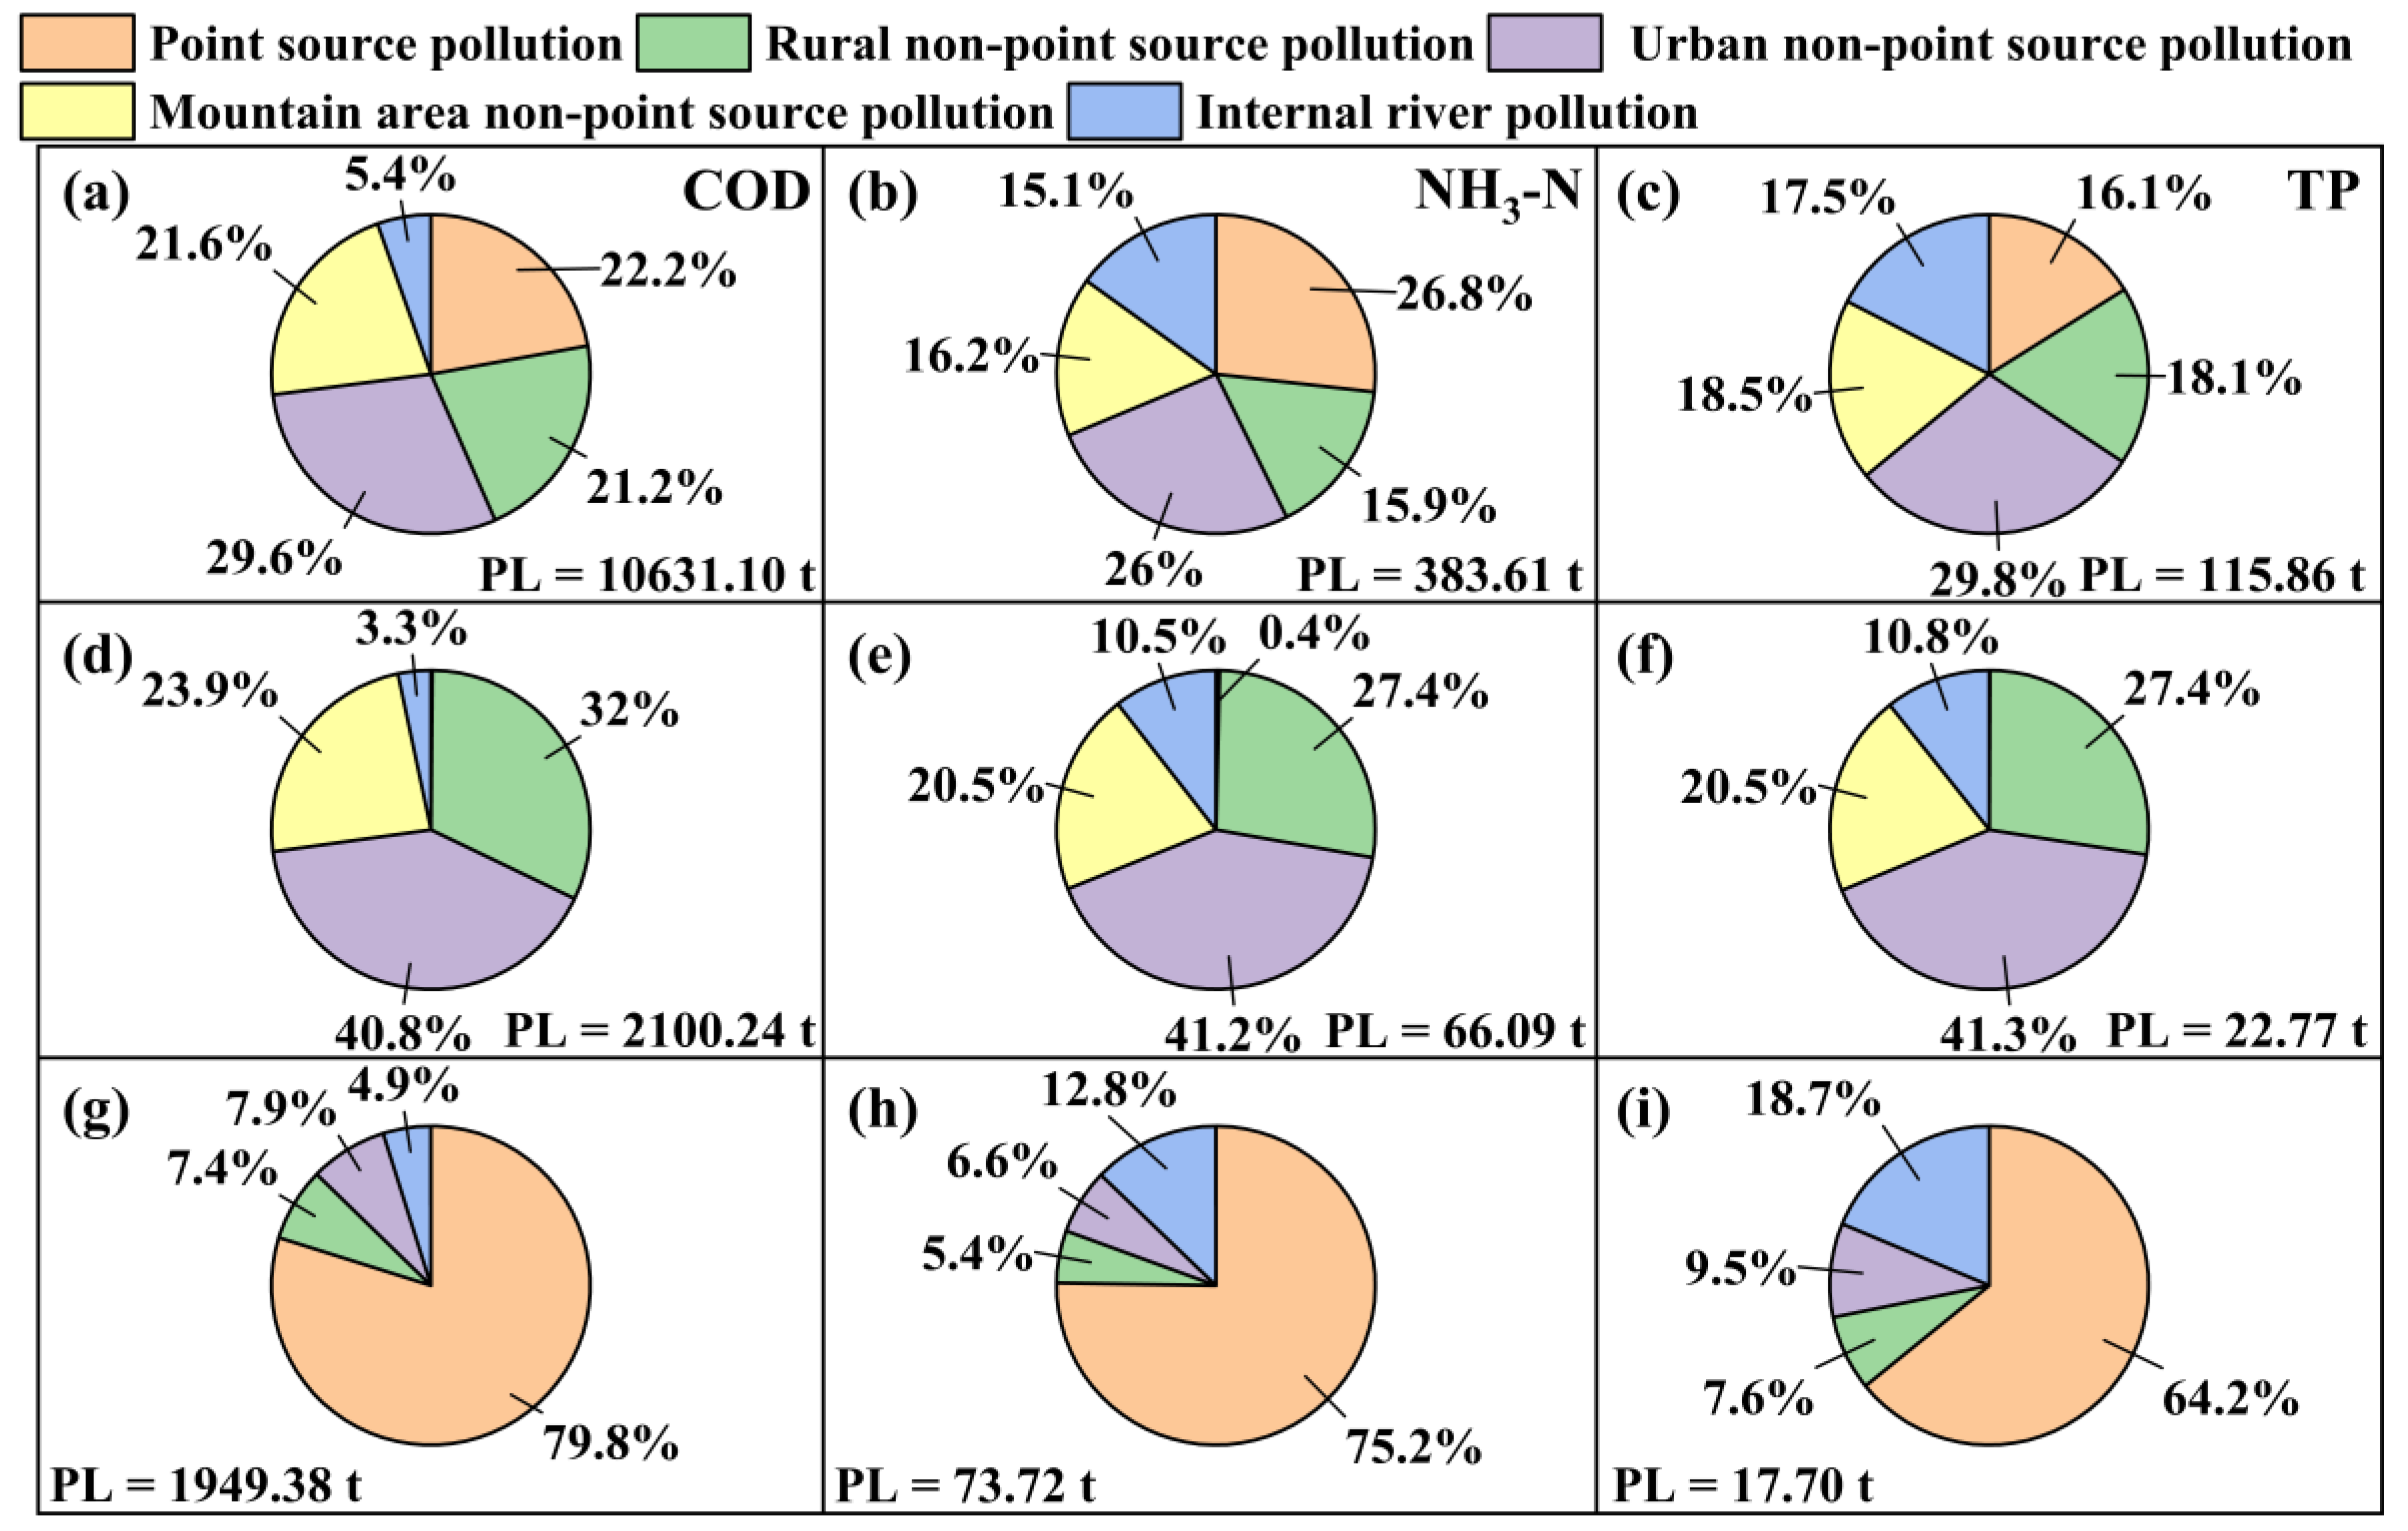
3.1. Pollution Source Discharge Status Quo

The critical pollutants explored in the six control units were COD, NH3-N, and TP. The primary pollution sources in each control unit were point source pollution, rural non-point source pollution, urban non-point source pollution, mountain area non-point source pollution, and internal river pollution. Point source pollution accounted for the most significant proportion of the total pollution among all observation samples. It could be confirmed that the Donghe River and Xihe River are the most severely polluted in contaminating the three above pollutants (Table S6). In addition, the pollution measurement values of the Banlingshui River, Tangtashui River, Caopengshui River, and Liluoshui River decreased successively. Among the total pollution, the urban non-point and the point source pollution accounted for the most significant ratio of COD and TP, with a similar proportion (Figure 4a–c). As for NH3-N, point source pollution occupied a dominant position, accounting for 59.9% of the total. This was mainly because of the low NH3-N content in the initial rainfall-runoff pollution. According to the similarity of regional rivers, the TP contaminations are almost synchronous with the change in NH3-N. Mountain non-point source pollution, rural non-point source pollution, and internal river pollution have less impact on total pollution, respectively. In other words, the total load of the above three accounts for 20~30% of the total.
The Xihe River is the mainstream of the Sanya River. Moreover, it is divided into two streams near the Liaojiatian Ocean: the Liuluo River and the Tangtashui River. Tuotangta River Basin is located north of Yuechuan Bridge, comprising the Tangta Reservoir, the upstream service area, and the Tangtashui River. By the time the exploration was carried out, the water quality of the Tangtashui River had met the Class III standard. As for the Tangtashui River, the non-point source pollution comprised the most significant proportion of COD and TP, accounting for approximately 85% of the total (Figure 4d–f). In addition, urban non-point source pollution contributed the most, followed by agricultural non-point source pollution, and the proportion of non-point source pollution in mountainous areas was the smallest. For COD and TP, the proportion of point source and internal river pollution was small, and point source pollution was more severe than internal river pollution. For NH3-N, point source and urban non-point source pollution accounted for 29.7% and 33.8% of the total, respectively (Figure 4e). The proportion of rural non-point source pollution and mountain area non-point source pollution decreased successively. The proportion of internal river pollution was the lowest, accounting for only 5.9% of the total. In general, urban non-point source pollution accounts for the largest proportion of all pollution, while internal river pollution accounts for the smallest proportion in the Tangtashui River.
The Donghe River Basin is a catchment located south of the Lizhigou River water purification plant. The Donghe River mainly flows through the urban area of Sanya. There are several sewage inlets along this river, including one sewage treatment plant, six integrated facilities, and three sewage pumping stations. Point source pollution and urban non-point source pollution are the main components of the pollution in the Donghe River. For COD, TP, and NH3-N, point source pollution accounted for 67.5%, 67.4%, and 80.7% of the total pollution load, respectively (Figure 4g–i). The proportion of urban non-point source pollution ranked second, and the allocation ratios of pollutants were quite different. As for COD and TP, urban non-point source pollution accounted for 26.6% and 22.5% of the total, respectively, while the NH3-N accounted for only 12.2%. Meanwhile, the proportion of internal river pollution and rural non-point source pollution was less than 10%. Overall, point source pollution accounts for the vast majority of the total pollution in the basin, followed by urban non-point source pollution. The contributions of other pollution sources are limited.

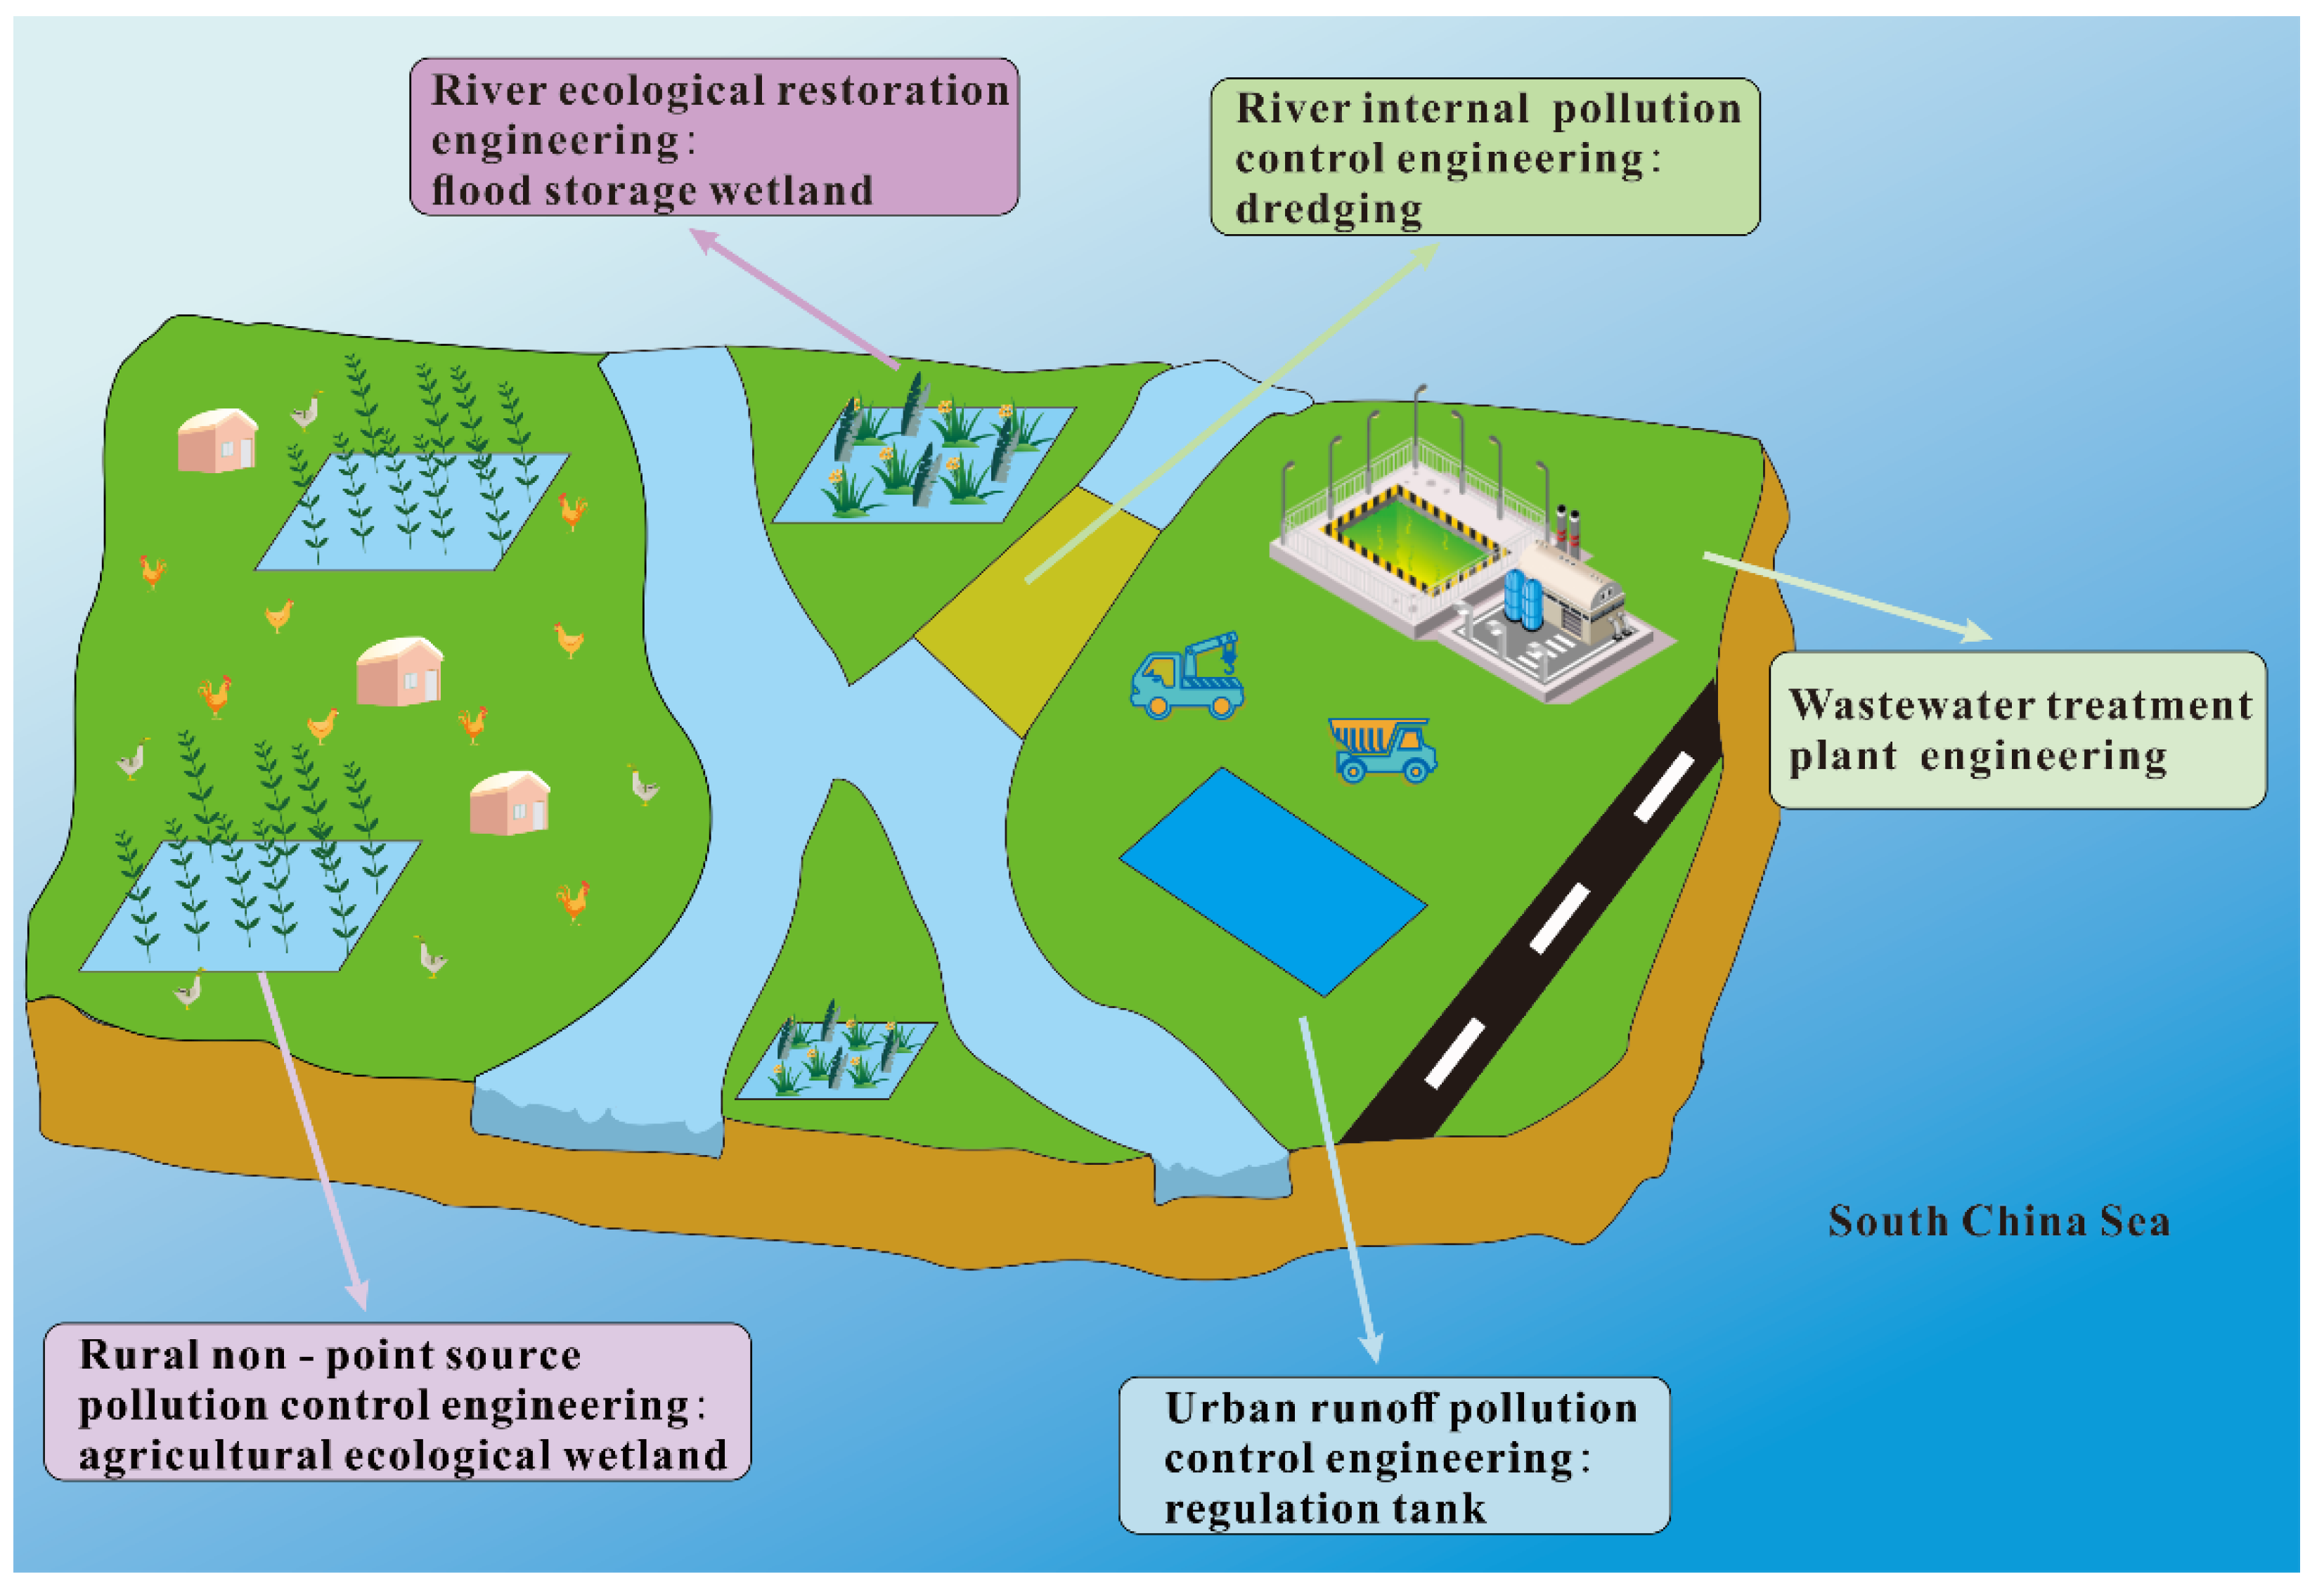
3.2. Comprehensive Treatment Scheme

In order to solve the problem of substandard water quality in the Sanya River Basin, a series of water quality improvement projects were designed, including an urban runoff pollution control project, a rural non-point source pollution control project, a sewage treatment plant project, an internal river pollution control project, and a river ecological restoration project (Figure 5). To control the initial urban rain runoff pollution and the direct discharge of sewage in the dry season, 13 regulation tanks were added (Table S7). In addition, six agricultural ecological wetlands were set up in the program to control rural non-point source pollution (Table S8). There are two sewage treatment plants in the Sanya River Basin. In order to realize source control and sewage interception, a new sewage treatment plant was added to improve the regional sewage treatment capacity. As the designed capacity is 50,000 t/d, the new sewage treatment plant collects and treats domestic sewage from the Baopo and Luobidong areas, Banlingshui Hot Spring, and the surrounding villages. The sewage treatment plant is entirely underground, and its effluent quality meets the Class IV standard for surface water (GB 3838-2002) [33]. From the pollution status quo, compared with non-point source pollution and point source pollution, the proportion of internal river pollution in the total pollution load is minimal. It can be investigated as to whether this scheme effectively controls non-point source pollution and point source pollution. If not, internal river pollution would be the primary source of pollution. Therefore, the scheme could be used to dredge the urban rivers (i.e., the downstream sections of the Xihe River and Donghe River). To solve the problem of large amounts of water coming from the upstream mountainous areas and limited central drainage capacity, flood storage wetlands were set up to alleviate drainage pressure and realize regional flood control (Table S9). This scheme was carried out in InfoWorks ICM, and the effect of the comprehensive treatment engineering in Section 3.3 refers to the simulated results.

3.3. Analysis of the Total Discharge Control Accessibility after the Scheme

3.3.1. Analysis of Discharge from Pollution Sources following the Implementation of the Scheme

All kinds of pollution were reduced after applying engineering measures from the scheme (Table S10). Meanwhile, point source and non-point source pollution was significantly reduced by more than 20% compared with before. The internal river pollution, which accounted for a small proportion of the pollution previously, contributed even less to the total pollution after dredging. The point source pollution was effectively controlled, and the pollution load of the Donghe River and the Xihe River was dramatically reduced. The total amount of COD, NH3-N, and TP from the Caopengshui River, Tangtashui River, Donghe River, Xihe River, Liuluoshui River, and Banlingshui River decreased in turn. Urban non-point and point sources were still the primary sources of pollution (Figure 6a–c). The proportions of the five types of pollution sources were generally relatively similar. In addition, due to the effective control of point source and non-point source pollution, the proportion of internal river pollution rose significantly, accounting for 5.4%, 15.1%, and 17.5% of COD, NH3-N, and TP, respectively.
The proportion of non-point source pollution to the total pollution load was approximately 90% under this scheme, which was higher than before (Figure 6d–f). Among the forms of non-point source pollution, urban non-point source pollution contributed the most, accounting for 40.7%, 41.2%, and 41.3% of COD, NH3-N, and TP, respectively. The rural non-point source pollution ranked second, and the proportion of three contaminants was 10% lower on average than the former. The proportion of non-point source pollution in mountainous areas was the smallest. It is confirmed that this scheme effectively controlled the source pollution and almost totally reduced it, accounting for only 0.4% of NH3-N. Due to the effective control of point source and non-point source pollution, the proportion of internal river pollution within the river increased compared with the current situation. This proportion was still small, accounting for only 3.3%, 10.5%, and 10.7% of COD, NH3-N, and TP, respectively.
Before applying the scheme, the pollution in the Donghe River was the most severe. Therefore, taking the Donghe River as a typical example, the pollution removal effect of the scheme was evaluated. According to the geographical location of the Donghe River, point source and urban non-point source pollution in the Donghe River Basin accounted for the vast majority before the scheme’s application. Point source pollution still accounted for most of the total pollution after the scheme was applied, contributing more than 60% of each contaminant (Figure 6g–i). By adjusting the effect of equalization watersheds, non-point source pollution and point source pollution were significantly reduced. However, the effluents treated by two sewage treatment plants were still directly discharged into the Donghe River. The proportion of point source pollution to the total pollution load was less than before (COD reduced by 5% and TP reduced by 2%). Due to the practical control effect, the proportion of non-point source pollution after implementing the scheme is decreased compared with the current situation. In addition, the proportion of non-point pollution decreased by 10%. As for non-point source pollution, NH3-N and TP substantially declined, and the decline rate of rural non-point source pollution was 30% higher than that of urban non-point source pollution. The internal river pollution also decreased, but as other types of pollution drastically fell, the proportion of internal pollution in total pollution improved by approximately 10%. This was mainly because of the appropriate control of point source and non-point source pollution, and the proportion of internal pollution load to total pollution load rose.

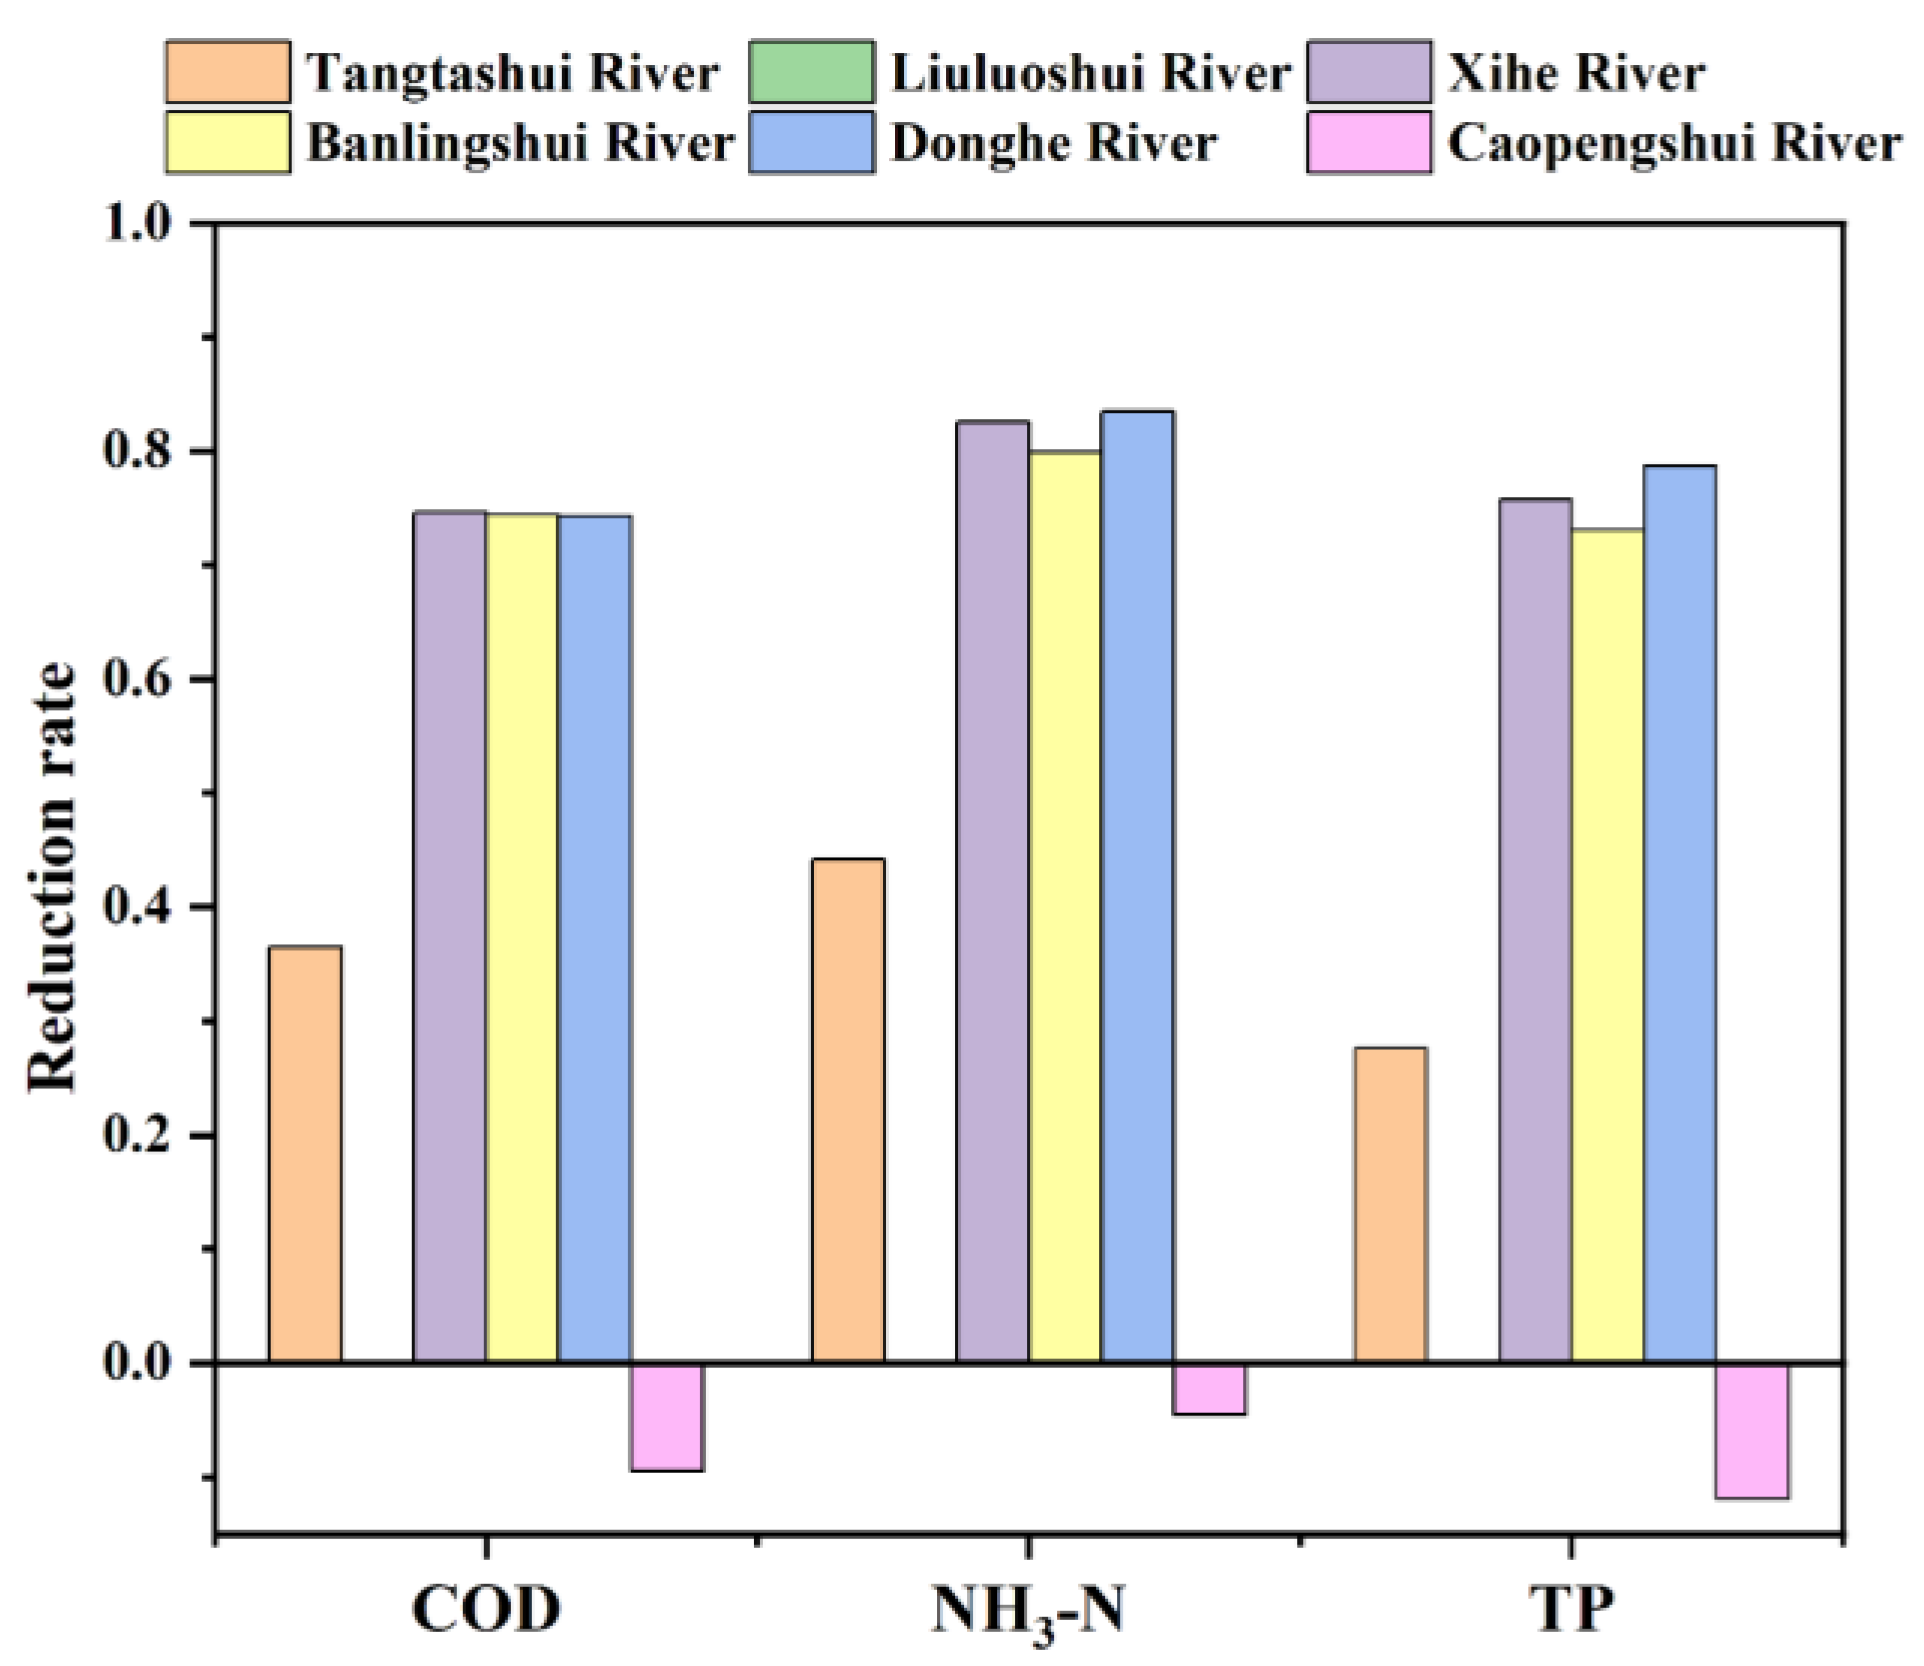
3.3.2. Calculation of Pollution Reduction after Scheme Application

The reduction rates of the three pollutants were calculated for each control unit (Figure 7 and Table S11). The Liuluo River Basin is a vital water source protection area and features a reservoir with Class I or II water quality, as defined by the GB 3838-2002. Given this favorable water quality status, no additional pollution control measures are necessary for the Liuluo River Basin. Therefore, the default pollutants remained unchanged. With the construction of a 50,000 t/d sewage treatment plant in the Caopengshui River, point source pollution was more severe than before the treatment was implemented. However, except for the Liuluoshui River and Caopengshui River, the point source pollution of other control units was effectively controlled.
Some rainwater drainage systems failed to achieve a single interception, causing surface runoff to be directly discharged into the river, resulting in the relatively poor control of non-point source pollution (except for the Liuluo River). The control influence of dredging on the internal pollution of the river is mainly reflected in the improvement of the two urban areas, the Donghe River and the Xihe River. The COD, NH3-N, and TP reduction rates in the Xihe River, Banling River, and Donghe River were all higher by 70% than before. The reduction in the amounts of each pollutant was calculated separately for the areas to the north and south of Yuechuan Bridge (connecting Donghe District and Xihe District) (Table 1). In general, the reduction in pollution, both in proportion and quantity, is more substantial in the southern region than in the region north of Yuechuan Bridge. The disparities observed can be attributed to the fact that the southern region adjacent to Yuechuan Bridge is an urban area characterized by a higher concentration of direct discharge outlets and a more pronounced issue of non-point source pollution. Furthermore, a majority of engineering projects are located in the region south of Yuechuan Bridge. To the south of Yuechuan Bridge, the reduction rates of the point source, non-point source, and internal river pollution were all more than 51%. Moreover, COD, NH3-N, and TP reduction rates were 87.00%, 84.01%, and 74.24%, respectively. It is confirmed that pollution control measures have been effectively applied in the region south of Yuechuan Bridge. However, the northern region, characterized by more mountainous and rural areas, witnessed a lack of adequate efforts to implement pollution abatement measures. Only the point source pollution was relatively well controlled, reducing contamination rates by over 70% (for COD, NH3-N, and TP of 85.45%, 80.14%, and 73.96%, respectively). The reduction rate of non-point source pollution was close to 40%. Due to the only dredging treatments of the Donghe River and the Xihe River, the internal river pollution’s decrease rate was approximately 20%.

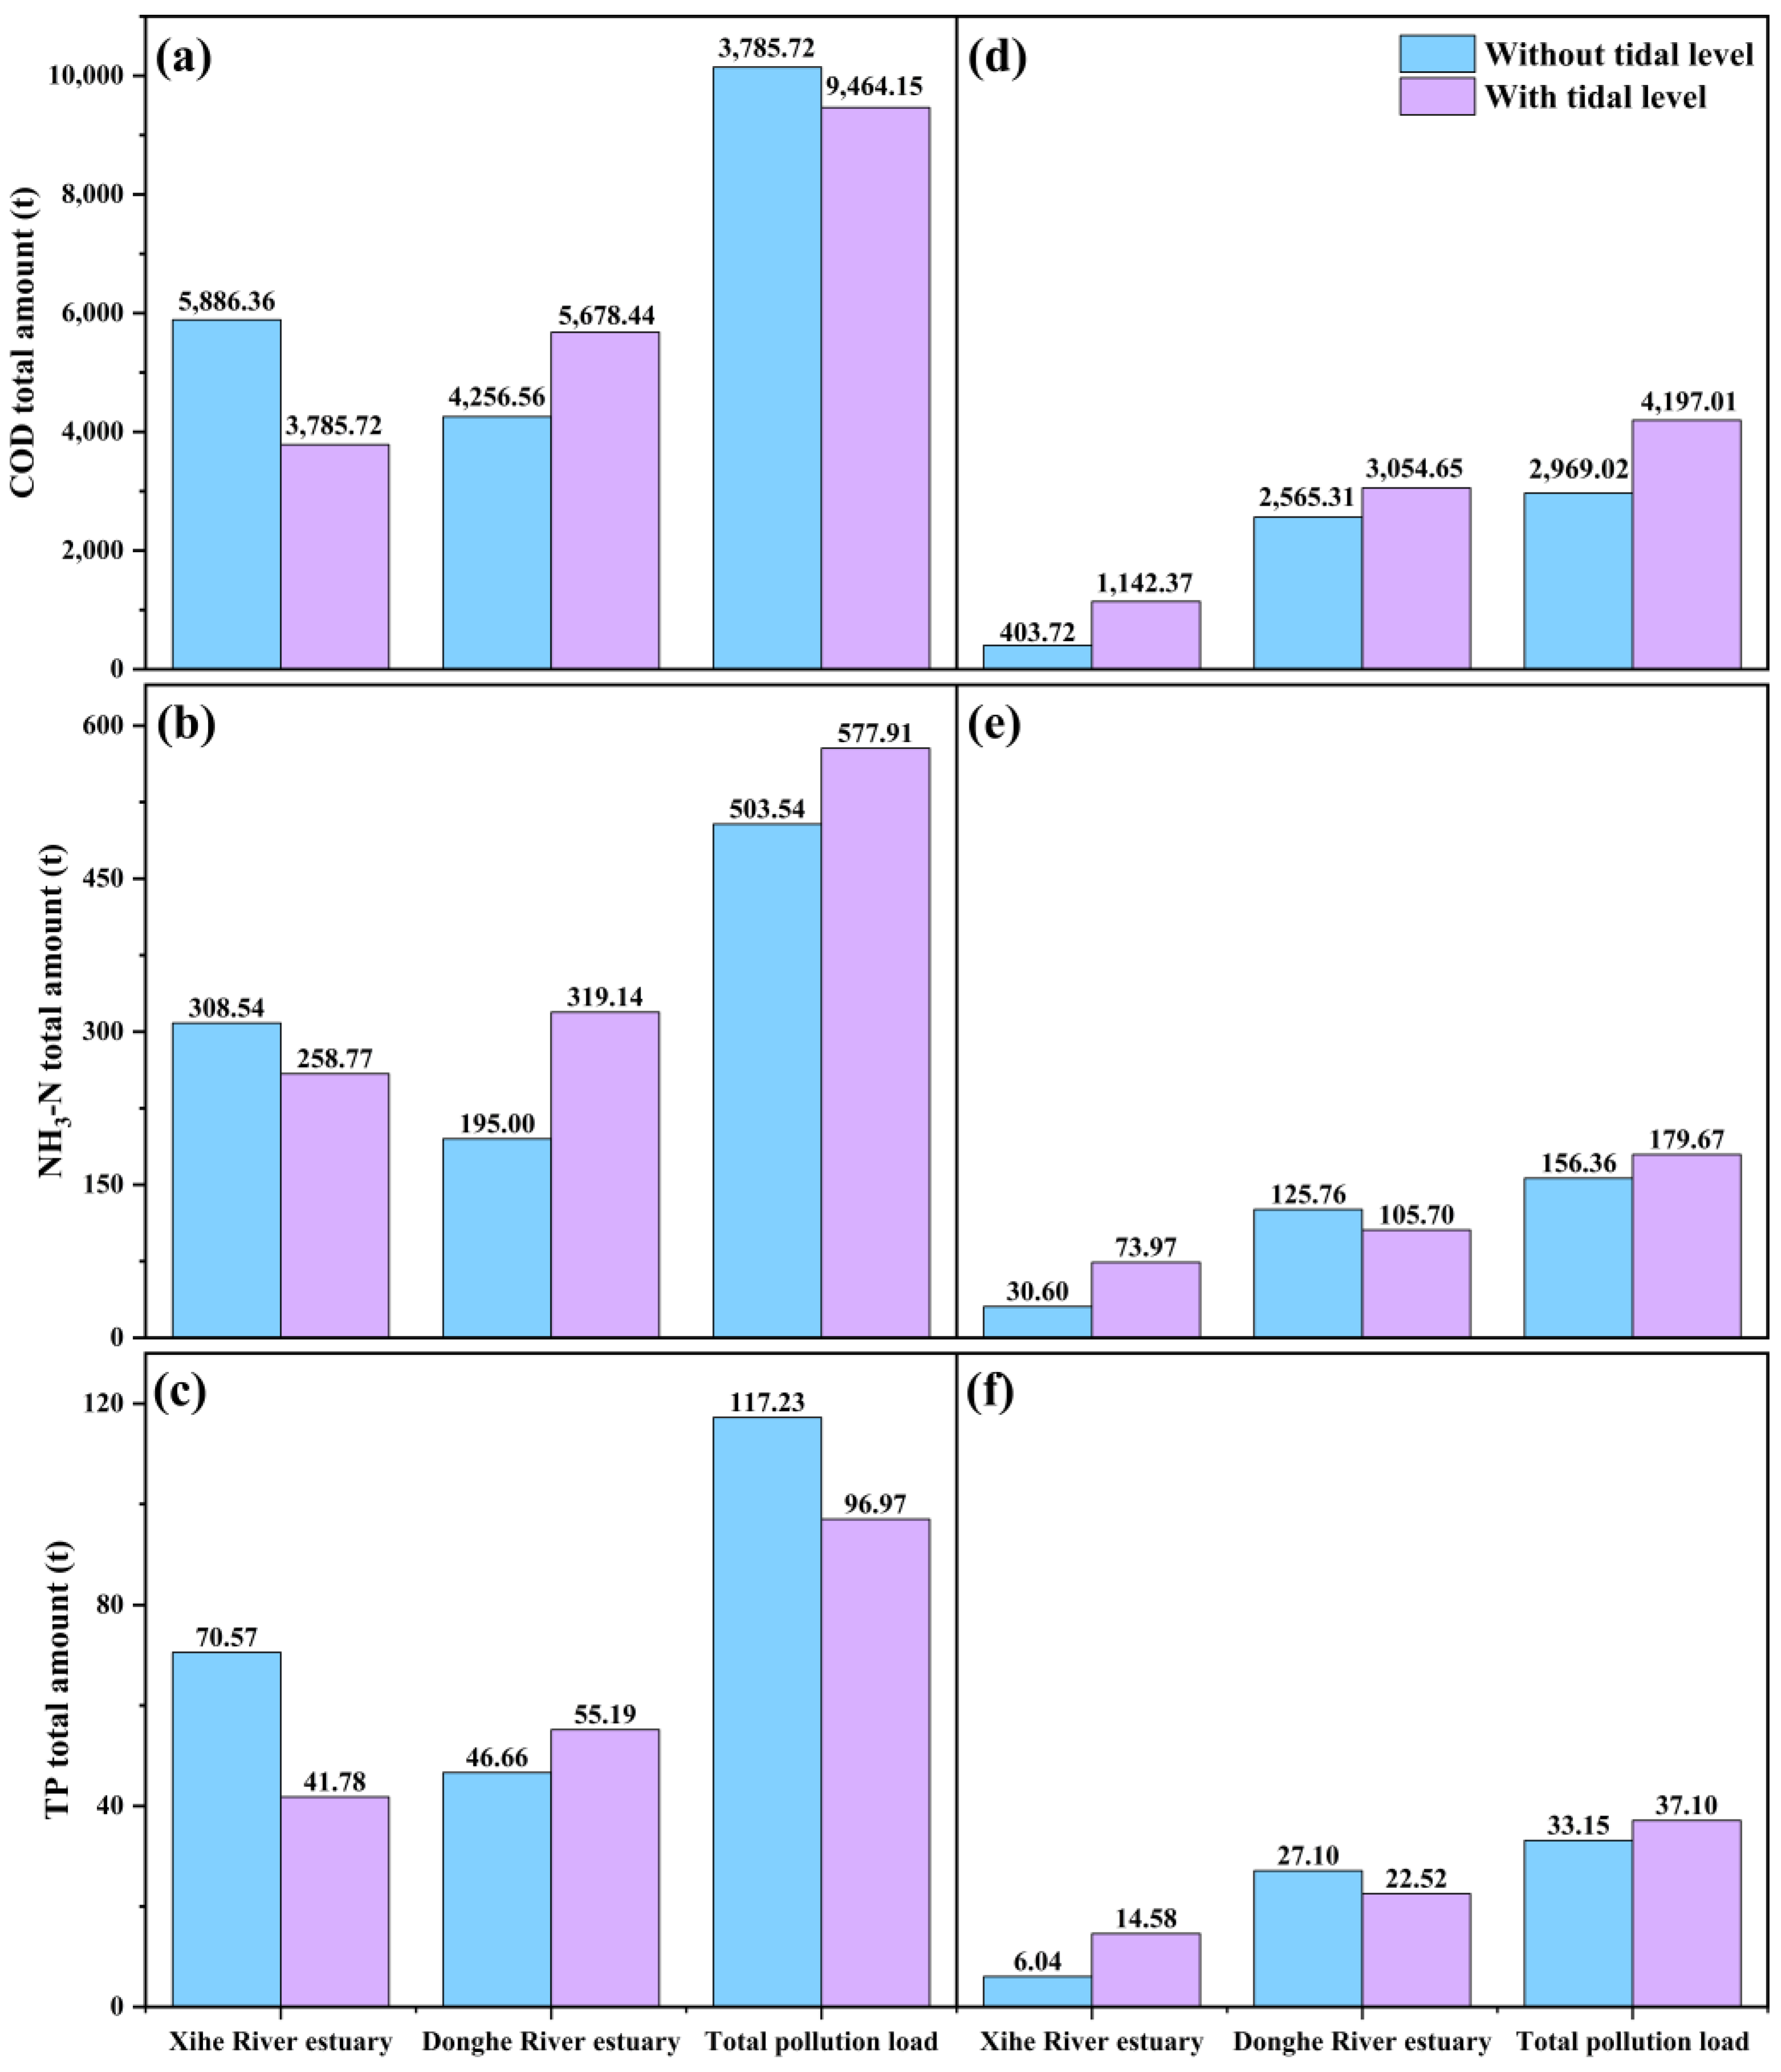
3.4. Analysis of the Influence of the Tide on Pollutant Discharge

Tides and rainfall are the primary sources of rivers in coastal cities [34]. The combination of tides and rainfall can impact flood defense design and risk management [35]. Therefore, when considering river pollution in coastal cities, it is necessary to cover the major influencing factor of the tide [36]. To investigate the impact of the tide on pollutant emission, a comparative model with and without the tide is built (Figure 8). Under tidal conditions, the measured tide data (Figure S3b) of the Donghe River and Xihe River estuaries were input into InfoWorks ICM (Figure 1). Subsequently, the aggregate quantity of pollutants generated under two operational modes was computed by the simulation model. Before the implementation, the ratios of the total COD, NH3-N, and TP at the non-tidal level to at the tidal level were 1.07, 0.87, and 1.21, respectively. It was thus found that the tide does not significantly impact the release of pollutants throughout the annual cycle. Moreover, the total amount of the three pollutants in the Donghe River with a tidal level was higher than that without a tidal level, while the results in the Xihe River were the opposite. This is because during the dry season, in the absence of tidal forces, the hydraulic conditions within the river channel are maintained in a state of stability, thereby reducing the capacity for pollutants to flow freely [37]. The tidal force improves the seawater flowing back into the Xihe River, which will eventually be expelled into the ocean via the Donghe River. At high tide, the period during which pollutants are retained within river channels is limited. As a result, over the long term, tides do not significantly impact the emission of pollutants. After the implementation of the scheme, the ratios of total COD, NH3-N, and TP at the non-tidal level to at the tidal level were 0.71, 0.87, and 0.89, respectively. Once the tide recedes, pollutants are emitted. This is consistent with the actual situation, where pollutants continue to be discharged once the tide recedes. When the flow rate is slow, pollutants tend to be deposited at the bottom of the river, hindering the emission of pollutants into the ocean.

3.5. The economic Benefits of the Improved Model Scheme

According to the conventional scheme for controlling runoff pollution, it is necessary to build a 20 km sewage interception pipe (with a diameter of DN800~2000) and a sewage treatment plant (with a scale of 200,000 m3/d). The investment for the conventional scheme is estimated to be CNY 2 billion. However, since there are already built cities on both sides of the Sanya River, the difficulty of implementing the DN2000 initial rain interception pipe in the conventional scheme is high. The conventional scheme belongs to end treatment, which does not conform to the modern concept of environmental pollution control. The control scheme proposed in this paper adopts interception and segmented storage in the urban area (south of the bypass expressway, Baopo New City, and west of Yingbin Road). A number of 13 storage tanks with a total capacity of 220,000 m3 are built at the cost of CNY 800 million. During dry periods, sewage is discharged into the municipal sewage pipe network, and during the rainy season, overflow sewage is intercepted and stored in rainwater storage tanks. After the rainwater and sewage mixing transformation is completed, it is used as an initial rainwater storage tank. During the low inflow period of the sewage treatment plant, the initial rainwater is transported to the sewage plant for treatment without the need to build a new sewage treatment plant.
In the conventional scheme, it is necessary to build two water gates in the West River and East River. Regional water body overall replacement is achieved through multiple cycles to avoid the impact of tides on pollution degradation in the Sanya River. The investment in the water gates is about CNY 500 million. To study the impact of tides on pollutant emissions, the conditions before and after the conventional scheme were compared. It was finally found that the pattern after the scheme is consistent with the current situation, and the influence of tidal uplift on pollutant emissions throughout the year is insignificant. Tides cause more seawater to flow back into the West River and then discharge into the sea from the East River, but ultimately, the pollutants are still discharged into the sea. Pollutants are only “trapped” in the river channel for a short time during the flood tide. Once the ebb tide occurs, the pollutants can still be discharged smoothly. Therefore, the construction of the water gates at the mouths of the East River and West River in Sanya can be canceled, which can save an engineering investment of CNY 500 million.
This improved model scheme can save CNY 1.7 billion in engineering investment in controlling runoff pollution.

4. Conclusions

To mitigate the issue of tidal river pollution in Sanya, After conducting research on the climate conditions, population, river distribution, and pollution situation in Sanya, a hydraulic and water quality model was established utilizing InfoWorks ICM. A comprehensive remediation strategy was devised that encompasses various interrelated projects. Analysis of the six control units in the Sanya River Basin revealed that the primary pollutants in the area are COD, NH3-N, and TP. The simulation results indicated that the Donghe River and Xihe River had the highest pollutant concentration, and the primary source of pollution was found to be point source contamination. The program, whose aim was the reduction of various types of pollution, significantly decreased pollutants in the area south of Yuechuan Bridge. This decrease was particularly pronounced in point source pollution, with a decline rate of 87.00% in COD, 84.01% in NH3-N, and 74.24% in TP. In the region of Yuechuan Bridge, which is mainly mountainous and rural, the pollution control measures were less effective, leading to a reduced rate of only 40% in non-point source pollution and 20% in internal river pollution. The construction of a new sewage treatment plant along the Caopengshui River improved the situation concerning point source pollution in the north. Despite the influx of seawater into the Xihe River and its discharge into the sea from the Donghe River, there was no significant change in annual pollutant emission levels, as the tide had only a slight impact on pollution discharge in the long term. This research provides valuable references for the water environment model and the comprehensive treatment of tidal river pollution. The final plan of this scheme can significantly improve the water quality of Sanya’s rivers by effectively controlling the discharge of pollutants while achieving considerable cost savings of approximately CNY 1.7 billion.

Supplementary Materials

The following supporting information can be downloaded at: https://www.mdpi.com/article/10.3390/su15086830/s1. Text S1. Sampling program. Text S2. Water quality model. Text S3. Non-point source pollution parameters in Info works ICM. Table S1. Environmental quality standards for surface water. Table S2. Control units of river pollution. Table S3. List of model data. Table S4. Discharge outlets and corresponding measured flow and pollutant concentration. Table S5. The annual release amount of internal pollution from each control unit. Table S6. Summary table for pollution before the scheme. Table S7. Regulation tank. Table S8. Agricultural ecological wetland. Table S9. Flood storage wetland. Table S10. Summary table for pollution after the scheme. Table S11. The pollutants reduction rate of each control unit after the scheme. Figure S1. Geomorphological thematic maps of Sanya. Figure S2. 2D hydraulic model diagram of Sanya. Figure S3. The rainfall event (a) and water level variation (b). Figure S4. The construction of the model and divisions within the catchment area.

Author Contributions

Conceptualization, W.S. and J.Z.; investigation, W.S. and S.W.; methodology, W.S. and Y.Z.; resources, X.Z., S.X. and Y.Z.; supervision, J.Z.; visualization, W.S.; writing—original draft, W.S., S.W. and J.Z.; writing—review and editing, S.W. and J.Z. All authors have read and agreed to the published version of the manuscript.

Funding

This research was supported by the Nation Key R&D Program of China (No: 2019YFD1100502-4).

Institutional Review Board Statement

Not applicable.

Informed Consent Statement

Not applicable.

Data Availability Statement

Not applicable.

Acknowledgments

We want to thank the Sanya Water Bureau for their support in the study and the HR Wallingford Hydraulic and Environmental Consulting (Shanghai) Co., Ltd. for their help in the construction of the model.

Conflicts of Interest

The authors declare no conflict of interest.

References

  1. Chang, T.-J.; Wang, C.-H.; Chen, A.S. A novel approach to model dynamic flow interactions between storm sewer system and overland surface for different land covers in urban areas. J. Hydrol. 2015, 524, 662–679. [Google Scholar] [CrossRef]
  2. He, D.; Chen, R.; Zhu, E.; Chen, N.; Yang, B.; Shi, H.; Huang, M. Toxicity bioassays for water from black-odor rivers in Wenzhou, China. Environ. Sci. Pollut. Res. 2015, 22, 1731–1741. [Google Scholar] [CrossRef]
  3. Garnier, J.; Ramarson, A.; Thieu, V.; Nemery, J.; Thery, S.; Billen, G.; Coynel, A. How can water quality be improved when the urban waste water directive has been fulfilled? A case study of the Lot river (France). Environ. Sci. Pollut. Res. 2018, 25, 11924–11939. [Google Scholar] [CrossRef] [PubMed]
  4. Madoux-Humery, A.-S.; Dorner, S.; Sauve, S.; Aboulfadl, K.; Galarneau, M.; Servais, P.; Prevost, M. The effects of combined sewer overflow events on riverine sources of drinking water. Water Res. 2016, 92, 218–227. [Google Scholar] [CrossRef]
  5. Salerno, F.; Gaetano, V.; Gianni, T. Urbanization and climate change impacts on surface water quality: Enhancing the resilience by reducing impervious surfaces. Water Res. 2018, 144, 491–502. [Google Scholar] [CrossRef]
  6. Schertzinger, G.; Ruchter, N.; Sures, B. Metal accumulation in sediments and amphipods downstream of combined sewer overflows. Sci. Total Environ. 2018, 616, 1199–1207. [Google Scholar] [CrossRef]
  7. Wang, L.; Yu, L.; Xiong, Y.; Li, Z.; Geng, J. Study on the governance of black-odor water in Chinese cities. J. Clean. Prod. 2021, 308, 127290. [Google Scholar] [CrossRef]
  8. Zhou, Z.; Liu, J.; Zhou, N.; Zhang, T.; Zeng, H. Does the “10-Point Water Plan” reduce the intensity of industrial water pollution? Quasi-experimental evidence from China. J. Environ. Manag. 2021, 295, 113048. [Google Scholar] [CrossRef]
  9. Xu, R.-R.; Pei, Z.-T.; Wang, W.-Q.; Zhang, M.; Zhang, L.-L.; Zhang, J.; Wang, W.-Q.; Sun, L.-W.; Zhang, Y.-M. Assessment of Biological Toxicity and Ecological Safety for Urban Black-Odor River Remediation. Int. J. Environ. Res. Public Health 2020, 17, 1025. [Google Scholar] [CrossRef]
  10. Bai, X.; Zhu, X.; Jiang, H.; Wang, Z.; He, C.; Sheng, L.; Zhuang, J. Purification Effect of Sequential Constructed Wetland for the Polluted Water in Urban River. Water 2020, 12, 1054. [Google Scholar] [CrossRef]
  11. Bremard, T. Monitoring Land Subsidence: The Challenges of Producing Knowledge and Groundwater Management Indicators in the Bangkok Metropolitan Region, Thailand. Sustainability 2022, 14, 10593. [Google Scholar] [CrossRef]
  12. Anawar, H.M.; Chowdhury, R. Remediation of Polluted River Water by Biological, Chemical, Ecological and Engineering Processes. Sustainability 2020, 12, 7017. [Google Scholar] [CrossRef]
  13. Deb, D.; Schneider, P.; Dudayev, Z.; Emon, A.; Areng, S.S.; Mozumder, M.M.H. Perceptions of Urban Pollution of River Dependent Rural Communities and Their Impact: A Case Study in Bangladesh. Sustainability 2021, 13, 13959. [Google Scholar] [CrossRef]
  14. Ning, Y.-F.; Zhang, J.-T.; Huang, J.-H.; Long, H.-F.; Huang, Q.-S. Systematic treatment of urban river pollution. In Proceedings of the 5th International Conference on Advances in Energy Resources and Environment Engineering (ICAESEE), Chongqing, China, 6–8 December 2019. [Google Scholar]
  15. Lin, J.; Zhu, H.; Liu, G.; Huang, M.; Xie, Z. Composite Scheme of Comprehensive Improvement for Urban Rivers. In Proceedings of the 6th International Conference on Advances in Energy, Environment and Chemical Engineering (AEECE), Electr Network, Jinan, China, 19–21 June 2020. [Google Scholar]
  16. Chen, X.; Wang, Y.; Jiang, L.; Huang, X.; Huang, D.; Dai, W.; Cai, Z.; Wang, D. Water quality status response to multiple anthropogenic activities in urban river. Environ. Sci. Pollut. Res. 2022, 30, 3440–3452. [Google Scholar] [CrossRef]
  17. Li, B.; Zhang, H.; Long, J.; Fan, J.; Wu, P.; Chen, M.; Liu, P.; Li, T. Migration mechanism of pollutants in karst groundwater system of tailings impoundment and management control effect analysis: Gold mine tailing impoundment case. J. Clean. Prod. 2022, 350, 131434. [Google Scholar] [CrossRef]
  18. Zhao, S.; Chen, J.; Jin, Q.; Liu, H.; Yang, W.; Li, W.; Jiang, J.; Sha, Y.; Tian, Z.; Wang, Y.; et al. Improved Principal Component-Fuzzy Comprehensive Assessment Coupling Model for Urban River Water Quality: A Case Study in Chongqing, China. Water 2020, 12, 1375. [Google Scholar] [CrossRef]
  19. Li, B.; Zeng, Y.-F.; Zhang, B.-B.; Wang, X.-Q. A risk evaluation model for karst groundwater pollution based on geographic information system and artificial neural network applications. Environ. Earth Sci. 2018, 77, 344. [Google Scholar] [CrossRef]
  20. Li, Q.; Wang, F.; Yu, Y.; Huang, Z.; Li, M.; Guan, Y. Comprehensive performance evaluation of LID practices for the sponge city construction: A case study in Guangxi, China. J. Environ. Manag. 2019, 231, 10–20. [Google Scholar] [CrossRef]
  21. Liu, Z.; Cai, Y.; Wang, S.; Lan, F.; Wu, X. Small and Medium-Scale River Flood Controls in Highly Urbanized Areas: A Whole Region Perspective. Water 2020, 12, 182. [Google Scholar] [CrossRef]
  22. Wu, W.; Lu, L.; Huang, X.; Shangguan, H.; Wei, Z. An automatic calibration framework based on the InfoWorks ICM model: The effect of multiple objectives during multiple water pollutant modeling. Environ. Sci. Pollut. Res. 2021, 28, 31814–31830. [Google Scholar] [CrossRef]
  23. Gong, Y.; Li, X.; Zhai, D.; Yin, D.; Song, R.; Li, J.; Fang, X.; Yuan, D. Influence of Rainfall, Model Parameters and Routing Methods on Stormwater Modelling. Water Resour. Manag. 2018, 32, 735–750. [Google Scholar] [CrossRef]
  24. Peng, H.-Q.; Liu, Y.; Wang, H.-W.; Ma, L.-M. Assessment of the service performance of drainage system and transformation of pipeline network based on urban combined sewer system model. Environ. Sci. Pollut. Res. 2015, 22, 15712–15721. [Google Scholar] [CrossRef]
  25. Cheng, T.; Xu, Z.; Hong, S.; Song, S. Flood Risk Zoning by Using 2D Hydrodynamic Modeling: A Case Study in Jinan City. Math. Probl. Eng. 2017, 2017, 5659197. [Google Scholar] [CrossRef]
  26. Sidek, L.M.; Jaafar, A.S.; Majid, W.H.A.W.A.; Basri, H.; Marufuzzaman, M.; Fared, M.M.; Moon, W.C. High-Resolution Hydrological-Hydraulic Modeling of Urban Floods Using InfoWorks ICM. Sustainability 2021, 13, 10259. [Google Scholar] [CrossRef]
  27. Wang, S.; Jiang, J.; Gu, M.; Song, Y.; Zhao, J.; Shen, Z.; Zhou, X.; Zhang, Y. Glucose Hydrogenolysis into 1,2-Propanediol Using a Pt/deAl@Mg(OH)2 Catalyst: Expanding the Application of a Core-Shell Structured Catalyst. Nanomaterials 2022, 12, 3771. [Google Scholar] [CrossRef]
  28. Wang, S.; Jiang, J.; Gu, M.; Gao, F.; Shen, Z. Catalytic production of 1,2-propanediol from sucrose over a functionalized Pt/deAl-beta zeolite catalyst. RSC Adv. 2022, 13, 734–741. [Google Scholar] [CrossRef]
  29. Moriasi, D.N.; Arnold, J.G.; Van Liew, M.W.; Bingner, R.L.; Harmel, R.D.; Veith, T.L. Model evaluation guidelines for systematic quantification of accuracy in watershed simulations. Trans. Asabe 2007, 50, 885–900. [Google Scholar] [CrossRef]
  30. Ritter, A.; Munoz-Carpena, R. Performance evaluation of hydrological models: Statistical significance for reducing subjectivity in goodness-of-fit assessments. J. Hydrol. 2013, 480, 33–45. [Google Scholar] [CrossRef]
  31. van Griensven, A.; Bauwens, W. Multiobjective autocalibration for semidistributed water quality models. Water Resour. Res. 2003, 39. [Google Scholar] [CrossRef]
  32. Eckhardt, K.; Arnold, J.G. Automatic calibration of a distributed catchment model. J. Hydrol. 2001, 251, 103–109. [Google Scholar] [CrossRef]
  33. GB 3838–2002; Environmental Quality Standards for Surface Water. Ministry of Ecology and Enviromrnt of the People’s Republic of China: Beijing, China, 2002.
  34. Lian, J.J.; Xu, K.; Ma, C. Joint impact of rainfall and tidal level on flood risk in a coastal city with a complex river network: A case study of Fuzhou City, China. Hydrol. Earth Syst. Sci. 2013, 17, 679–689. [Google Scholar] [CrossRef]
  35. Lian, J.; Xu, H.; Xu, K.; Ma, C. Optimal management of the flooding risk caused by the joint occurrence of extreme rainfall and high tide level in a coastal city. Nat. Hazards 2017, 89, 183–200. [Google Scholar] [CrossRef]
  36. Qiang, Y.; Zhang, L.; He, J.; Xiao, T.; Huang, H.; Wang, H. Urban flood analysis for Pearl River Delta cities using an equivalent drainage method upon combined rainfall-high tide-storm surge events. J. Hydrol. 2021, 597, 126293. [Google Scholar] [CrossRef]
  37. Fan, C.; Ko, C.-H.; Wang, W.-S. An innovative modeling approach using Qual2K and HEC-RAS integration to assess the impact of tidal effect on River Water quality simulation. J. Environ. Manag. 2009, 90, 1824–1832. [Google Scholar] [CrossRef]
Figure 1. The geographic layout of Sanya River and its tributaries and control units.
Sustainability 15 06830 g001
Figure 2. Comparison of simulated and measured data on the water level.
Sustainability 15 06830 g002
Figure 3. Comparison of simulated and measured data on COD, NH3-N, and TP in the Donghe River (ac) and Xihe River (df), respectively.
Sustainability 15 06830 g003
Figure 4. The proportion of each pollution source of the total pollution (ac), Tangtashui River (df), and Donghe River (gi) corresponding to different pollutants before the scheme (PL means pollution load).
Sustainability 15 06830 g004
Figure 5. Schematic of comprehensive treatment engineering.
Sustainability 15 06830 g005
Figure 6. The contribution proportion of each pollution source in the total pollution (ac), Tangtashui River (df), and Donghe River (gi) corresponding to different pollutants after the scheme was applied (PL means pollution load).
Sustainability 15 06830 g006
Figure 7. The total reduction rate of pollutants in each control unit.
Sustainability 15 06830 g007
Figure 8. The total amount of pollutants at the estuary of the Xihe River and Donghe River (with or without tidal level) before (ac) and after (df) the scheme’s implementation.
Sustainability 15 06830 g008
Table 1. After the scheme, the pollutant reduction ratio of the regions south and north of Yuechuan Bridge.
CategoryPollution TypeNorth of Yuechuan BridgeSouth of Yuechuan Bridge
NH3-NTPCODNH3-NTPCOD
Status quoPoint source pollution (t)257.4832.312592.31502.4076.726525.05
Non-point source pollution (t)302.23104.1711,190.02105.9736.533923.50
Internal pollution (t)53.9217.19539.1845.7811.67457.79
After the schemePoint source pollution (t)37.466.42675.1165.3112.271681.03
Non-point source pollution (t)194.3167.066744.8028.659.91951.68
Internal pollution (t)41.6414.58416.4116.215.68162.09
Pollutants reduction ratePoint source pollution85.45%80.14%73.96%87.00%84.01%74.24%
Non-point source pollution35.71%35.63%39.72%72.96%72.89%75.74%
Internal pollution22.78%15.19%22.77%64.60%51.35%64.59%
Disclaimer/Publisher’s Note: The statements, opinions and data contained in all publications are solely those of the individual author(s) and contributor(s) and not of MDPI and/or the editor(s). MDPI and/or the editor(s) disclaim responsibility for any injury to people or property resulting from any ideas, methods, instructions or products referred to in the content.

