Abstract
Hydrogen-based multi-microgrid systems (HBMMSs) are beneficial for energy saving and emission reductions. However, the optimal sizing of HBMMSs lacks a practical configuration optimization model and a reasonable solution method. To address these problems, we designed a novel structure of HBMMSs that combines conventional energy, renewable energy, and a hydrogen energy subsystem. Then, we established a bi-level multi-objective capacity optimization model while considering electricity market trading and different hydrogen production strategies. The objective of the inner model, which is the minimum annual operation cost, and the three objectives of the outer model, which are the minimum total annual cost (TAC); the annual carbon emission (ACE); and the maximum self-sufficiency rate (SSR), are researched simultaneously. To solve the above optimization model, a two-stage solution method, which considers the conflicts between objectives and the objectivity of objective weights, is proposed. Finally, a case study is performed. The results show that when green hydrogen production strategies are adopted, the three objectives of the best configuration optimization scheme are USD 404.987 million, 1.106 million tons, and 0.486, respectively.
1. Introduction
1.1. Background
Hydrogen energy is non-toxic and pollution-free, which has great development potential in the future. In China, the development of hydrogen energy has made some progress but there is still some room for improvement and innovation in business models, transportation technology, storage technology, safety supervision systems, etc. Nowadays, there are some hydrogen-based off-grid energy systems (such as an off-grid zero-energy building with hydrogen energy storage [1], and an isolated wind/diesel/battery/hydrogen microgrid (MG) [2]), as well as hydrogen-based grid-connected energy systems, including a hybrid grid-connected tidal-wind-hydrogen energy system [3] and a grid-connected photovoltaic (PV)-hydrogen-natural gas integrated energy system [4]. It should be noted that electrolyzers (ELs) and fuel cells (FCs) can be used together to realize the conversion between electricity and hydrogen, and hydrogen tanks (HTs) can be utilized to enhance the flexibility of power-to-hydrogen and hydrogen-to-power conversion by storing the excessive hydrogen and supplying hydrogen to FCs.
In view of this, how to integrated ELs, FCs, and HTs into the conventional hybrid electricity system to construct an electricity–hydrogen coupling system is significant for energy transition. Moreover, compared with a single hydrogen-based energy system, hydrogen-based multi-microgrid systems (HBMMSs) can create economic benefits and enhance energy efficiency. In terms of the configuration optimization of HBMMSs, three critical problems should be considered: (1) how to optimize the capacity configuration of coal-fired power units (CFPUs), wind turbines (WTs), PV panels, ELs, FCs, and HTs in each MG according to regional supply and demand conditions; (2) how to achieve good interactions between each MG and utility power grid (UPG), and between MGs; (3) to obtain a scientific and reasonable configuration scheme, a tri-dimensional equilibrium problem about economic cost, carbon emission, and the capability of self-sufficiency should be well addressed.
1.2. Innovations and Contributions
Based on the above analysis, this paper establishes a bi-level multi-objective optimization model to configure the HBMMSs, including conventional energy, renewable energy, and hydrogen energy subsystems from the perspectives of the economy, the environment, and independence. To solve this model, a two-stage solution method is proposed. The main innovations and contributions of this paper are concluded below:
- (1)
- This paper develops a bi-level multi-objective optimization model consisting of an outer multi-objective optimization model and an inner single-objective optimization model to determine the optimal sizing of the HBMMSs. The objectives of the outer model—which are the minimum total annual cost (TAC), the minimum annual carbon emission (ACE), and the maximum self-sufficiency rate (SSR)—and the objective of the inner model, which is the minimum annual operation cost, are researched simultaneously.
- (2)
- Different hydrogen production strategies, electricity trading between the HBMMSs and UPG, and electricity trading between the MGs are considered simultaneously for the first time in the optimal configuration of the HBMMSs.
- (3)
- This paper proposes a two-stage optimization method to solve the established configuration optimization model while considering the conflicts between objectives and the objectivity of objective weights. In the first stage, the CPLEX solver is used to solve the established configuration optimization model and a Pareto solution set is obtained. In the second stage, the weights of the three objectives of the outer model are calculated using Criteria Importance Through Intercriteria Correlation (CRITIC), and the outer multi-objective optimization model is converted to a weighted single-objective optimization model.
1.3. Paper Organization
The rest of this paper is organized as follows: Section 2 provides a literature review; Section 3 displays the structure description and mathematical modeling; Section 4 proposes a bi-level multi-objective optimization model for the HBMMSs; Section 5 introduces a two-stage solution method for the proposed model; Section 6 performs a case study to verify the developed model and method; Section 7 summarizes the main contributions of this paper.
2. Literature Review
2.1. Optimization Objects, Objectives and Methods
Nowadays there are many studies on the capacity-configuration of hybrid energy systems, including single-objective optimization research, multi-objective optimization research, and bi-level optimization research.
Single-objective optimization models and algorithms have been used in some studies. The grey wolf optimizer and a genetic algorithm were used to configure a PV/WT/ biomass hybrid energy system with the minimum total net present cost (TNPC), respectively [5,6]. Hou et al. [7] used the cat swarm optimization (CSO) method to determine the capacity-configuration of a wind/photovoltaic/storage hybrid power system based on the minimum total cost. Zhang et al. [8] used the CPLEX solver to obtain the optimal sizing of a hydro/wind/solar/storage bundling system while considering the minimum total cost. To minimize the system annual cost (SAC), Hou et al. [9] proposed three modified harmony search (MHS) algorithms for the capacity configuration of a standalone solar-hydrogen system. Tebibel and Labed [10] solved the design and the sizing of a standalone PV/hydrogen system with the minimum system cost. Using the horse herd optimization (HHO) algorithm, Alanazi et al. [11] obtained the optimal capacity of an autonomous photovoltaic/hydrokinetic/hydrogen energy system. Its optimization goal was to minimize the cost of energy (COE). Coulibaly et al. [12] optimized the design of a solar-to-hydrogen system to minimize the levelized cost of electricity (LCOE). Pu et al. [13] configured an integrated energy system with hydrogen storage to minimize the life cycle costs (LCC) using an improved random–trigonometric grey wolf optimizer (RT-GWO). To minimize the total life cycle cost (TLCC), an improved harmony search and a geographic information system (GIS) were combined by Zhang et al. [14] to find the best location and sizing for an off-grid solar/hydrogen energy system. Ayodele et al. [15] used HOMER Pro to optimize the sizing of a wind-powered hydrogen refueling station based on the minimum net present cost. Jiang et al. [16] used CPLEX to obtain the optimal sizing of a coupled wind-hydrogen system with the objective of maximizing the return on equity (ROE). A robust optimization model was used by Lv et al. [17] to determine the optimal sizing of a PV/battery/hydrogen system. Its objective was to maximize the system revenue. To maximize net income, Deng and Jiang [18] optimized the sizing of a wind-hydrogen system.
Some studies focused on two or more objectives in the capacity configuration of hybrid energy systems. Guo et al. [19] used a multi-objective particle swarm optimization (MOPSO) algorithm to solve the multi-objective capacity optimization model of a wind/photovoltaic/thermal energy storage hybrid power system while considering the minimum levelized cost of energy (LCOE) and the maximum utilization rate of transmission channels (URTC). Zhang et al. [20] used a multi-objective optimization model to determine the optimal sizing of a multi-energy system with hydrogen storage tanks, which was solved by an improved non-dominated sorting genetic algorithm-II (NSGA-II) algorithm. To minimize the annual comprehensive cost (ACC) and the ACE, Zhou et al. [21] employed YALMIP to optimize the capacity of a natural gas-wind-photovoltaic-hydrogen integrated energy system. Okundamiya [22] used HOMER to determine the sizing of a hybrid power system, including hydrogen storage based on the minimization of energy cost and carbon emissions. Using a mayfly optimization algorithm (MOA), El-Sattar et al. [23] configured an isolated hybrid system with hydrogen tank storage with the objectives of energy-production cost (EPC), loss of power supply probability (LPSP), and excess energy. HOMER was utilized by Barhoumi et al. [24] to configure PV systems-based green hydrogen refueling stations with the objectives of net profit cost (NPC), levelized hydrogen cost (LHC), and levelized electricity cost (LEC). To configure an integrated energy system with hydrogen energy storage, Wang et al. [25] combined the maximum rectangle method (MRM) and particle swarm optimization (PSO) while considering the primary energy-saving rate (PESR), the annual cost saving rate (ACSR), the pollutant equivalent reduction rate (PERR), and the grid-dependence reduction rate (GDRR). Besides this, to select the best configuration scheme from several schemes, scholars combined the multi-attribute decision-making (MADM) and multi-objective decision-making (MODM) methods. Considering the minimization of economic costs and emission performance, Hosseinnia et al. [26] used GAMS to attain Pareto solutions and the max–min fuzzy decision-making method to select the optimal scheme in the optimal configuration of the MG, including hydrogen energy. To optimize the capacity of a novel standalone renewable integrated energy system coupled with hydrogen refueling, He et al. [27] obtained Pareto solutions through an enhanced immune clone PSO and used the best worst method (BWM) and the multi-attribute border approximation area comparison (MABAC) to select the best one while considering the objectives of the lifetime cost of comprehensive loads (LCCL), the energy externality rate (EER), and the hydrogen hiatus rate (HHR). Fan et al. [28] proposed a collaborative optimization model to optimize the capacity of a renewable energy system with hydrogen energy storage based on the minimization of ACE, TAC, and the total grid interaction (TGI). The model was solved by combining NSGA-II and the technique for order preference by the similarity to an ideal solution (TOPSIS). Luo et al. [29] integrated NSGA-II, the Shannon entropy approach, and TOPSIS to configure a distributed energy system that was based on the minimum annual total cost (ATC), the annual total CO2 emission (ATE), and the maximum coefficient of energy performance (CEP).
Nevertheless, interactions between the planning stage and the operation stage are neglected in the above studies. Li et al. [30] established a bi-level capacity configuration model of a cooling-heating- electricity-gas community integrated energy system and used the chaos adaptive particle swarm optimization (CAPSO) algorithm, as well as the Gurobi solver, to solve it. The minimum TAC and AOC were considered in the upper layer and lower layer, respectively. To handle these problems, bi-level programming studies were carried out. Pan et al. [31] proposed a bi-level mixed-integer planning model to determine the optimal capacity of an electricity-hydrogen integrated energy system. The objectives in the two-layer model are obtained by the CPLEX, which were the minimization of TAC and the levelized cost of hydrogen (LCOH), respectively. Qiu et al. [32] developed a two-layer model to configure the capacity of cross-regional hydrogen energy storage systems using a modified backtracking search algorithm (MBSA) and YALMIP/CPLEX. The objectives in the two-layer model were the minimization of total cost and operation cost, respectively. A genetic algorithm was employed by Zeng et al. [33] to solve the hybrid stochastic-interval optimal configuration programming of a vehicle sharing station-based electro-hydrogen micro-energy system. The objectives in the two layers were maximum net investment income (NII) and annual operating revenue (AOR), respectively. Moreover, multi-objective problems and multi-attribute problems are involved in bi-level optimization. Therefore, some studies integrated MODM, MADM, and bi-level programming. To determine the optimal sizing of a wind-photovoltaic-hydrogen hybrid system, a hybrid algorithm that combined chaotic search (CS), PSO, and NSGA-II was used by Li et al. [34] to solve the bi-level optimization model. The objective in the upper level was TAC and the objectives in the lower level were the source output and load fluctuation rate (SOLFR), the source-load tracking coefficient (SLTC), the source-load proximity coefficient (SLPC), and the levelized cost of storage (LCOS). Shang et al. [35] combined CPLEX-NSGA-II, and the entropy method and cumulative prospect theory to determine the best capacity of a hybrid energy system while considering power to hydrogen. The objectives in the outer model were to maximize the net present benefit (NPB), and to minimize ACE and the loss of energy conversion (LOEC), while the objective in the inner model was to maximize the most profitable benefit (MPB). Table 1 summarizes the optimization objects, objectives, and methods in the above literature.

Table 1.
Summary of optimization objects, objectives, and methods of hybrid energy systems.
2.2. Electricity Trading and Different Hydrogen Production Strategies
In Refs. [7,20,26,28,31], there existed a bilateral electricity transaction between the hybrid energy system and the external electricity network. In Refs. [18,22,24,25,29,30,32,33], electricity that was purchased from the external electricity network was considered. Shang et al. [35] investigated the surplus electricity that was sold to electricity markets. Moreover, green hydrogen production was only considered in Ref. [24]. Table 2 summarizes the electricity trading and the different hydrogen production strategies in the above literature.

Table 2.
Summary of electricity trading and different hydrogen production strategies.
2.3. Gaps in Previous Research
Based on previous research, the main findings are summarized below:
- (1)
- Regarding optimization objectives, single-objective optimizations mainly focus on economic indicators. Besides economic aspects, environmental aspects and energy aspects have gotten much attention in multi-objective optimizations. In bi-level optimization, both the upper-level model and the lower-level model consider one objective or multiple objectives. However, TAC, ACE, SSR, and AOC are not simultaneously considered.
- (2)
- Although bi-level multi-objective optimization models are proposed to configure wind/PV/hydrogen hybrid systems, and a bi-level optimization model is established for the capacity-configuration of cross-regional hydrogen energy storage systems, there lacks a bi-level multi-objective optimization model to optimize the sizing of the HBMMSs.
- (3)
- Existing studies do not consider a bilateral electricity trade between the hybrid energy system and the external electricity network, a bilateral electricity trade between two hybrid energy systems, and different hydrogen production strategies at the same time. If all of these are considered simultaneously in the capacity-configuration of HBMMSs, the study will become more valuable.
- (4)
- In terms of methods, single-objective optimization algorithms, multi-objective optimization algorithms, MADM methods, and optimization software tools (such as HOMER, YALMIP, and CPLEX) are used to solve the established optimization models, but these studies cannot well consider the conflicts between objectives and the objectivity of objective weights at the same time.
In view of the above problems, this paper proposes a bi-level multi-objective optimization model and a two-stage solution method to optimize the capacity of the HBMMSs.
3. Structure Description and Mathematical Modeling
The designed HBMMSs can interact with UPG bi-directionally and its basic structure is displayed in Figure 1.
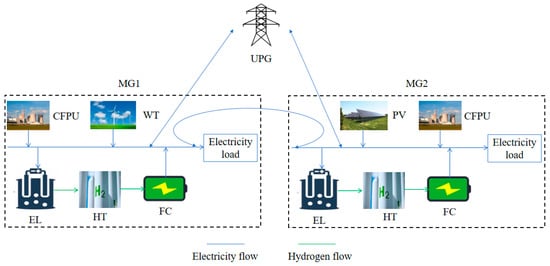
Figure 1.
Basic structure of the designed HBMMSs.
- WT
The power output of WT at time is influenced by its rated power, rated wind speed, etc. It can be calculated by the following formula [36,37]:
where presents the power output of WT at time ; denotes the rated power of WT; is the wind speed at time ; is the rated wind speed; and and are the cut-in wind speed and the cut-off wind speed.
- PV Panel
The power output of the PV panel is calculated based on its rated power output, solar radiation, temperature, etc. The calculation formula is given as follows [38,39]:
where presents the power output of the PV panel at time ; denotes the rated power of the PV panel under standard test condition (STC); and are the solar radiation at time and the STC solar radiation, respectively; is the temperature coefficient; and and are the temperatures at time and the STC temperature, respectively.
- Hydrogen Energy Subsystem
The main components of the hydrogen energy subsystem are ELs, FCs, and HTs. The hydrogen energy stored in the HT is mainly dependent on the hydrogen energy produced by the EL and the hydrogen energy consumed by the FC. It can be calculated as follows [35,40]:
where and are the remaining hydrogen of the HT at times and ; is the conversion efficiency of the EL; is the electricity input of the EL at time ; is the hydrogen produced per kWh of electricity; is the conversion efficiency of the FC; is the electricity output of the FC at time ; and is the electricity generated per m3 of hydrogen.
4. Bi-Level Multi-Objective Optimization for Optimal Configuration of HBMMSs
A bi-level multi-objective optimization model was established to achieve a two-way interaction between the investment stage and the operation stage, which includes an outer optimization model and an inner optimization model.
4.1. Outer Multi-Objective Optimization Model
In the outer multi-objective optimization model, TAC, ACE, SSR, regional resources, and space constraints, etc., were considered simultaneously. The optimization objectives and constraints of the model are given below:
- (1)
- Total Annual Cost (TAC)
The TAC of the HES consists of the annual investment cost (AIC) and the annual operation cost (AOC). The formula of TAC is displayed below:
where and are AIC and AOC of the MG .
where is the unit investment cost of the device of type ; and is the installed capacity of the device of type of the MG . The capital recovery factor of the device of type is , and it can be calculated according to the following formula [12,20]:
where is the lifetime of the device of type ; and is the interest rate.
Besides this, the calculation models of AOC are interpreted in Section 4.2.
- (2)
- Annual Carbon Emission (ACE)
The ACE of the HES is the sum of the carbon emission of the CFPUs of the HBMMSs and the carbon emission of purchased electricity from the UPG.
where and are the carbon emission factors of the CFPU and the UPG, respectively; is the electricity generated by the CFPU of MG at time ; and is the electricity that MG buys from the UPG at time .
- (3)
- Self-Sufficiency Rate (SSR).
Besides this, the energy economy and low-carbon development, energy security is also a significant issue for the HES, which is measured by SSR in this paper.
where and are the electricity output of the WTs and PV panels of MG at time , respectively; and is the electricity load demand of MG at time .
- Regional Resources and Space Constraints
Due to the limitation of regional resources, the basic structure of the MG planned in each region might be different; besides this, the installed space of each device cannot exceed its maximum space available for capacity configuration.
where and are the installed numbers and the maximum number of devices of type of MG that are available for capacity configuration.
4.2. Inner Single-Objective Optimization Model
To deal with the operation problems of the HBMMSs, a single-objective scheduling optimization model with the aim of minimizing the AOC was developed. The AOC consists of the annual operation and maintenance cost (AOMC), the annual fuel cost (AFC), and the annual transmission cost (ATC). The calculation formula of AOC is given as follows:
where , , and are the AOMC, AFC, and ATC of the MG .
where , , , , , and are the operation and maintenance costs of the WTs, PV panels, ELs, FCs, HTs, and CFPUs of MG at time .
where is the fuel cost of the unit power generation of the CFPU.
where and are the electricity purchase price and the electricity selling price of the HBMMSs while trading with UPG at time ; is the electricity that MG sells to UPG at time ; is the unit electricity transmission cost between MGs; and is the electricity that other MGs transmit to MG at time .
- Electricity Balance Constraints
- Device Output Constraints
The output of the device should be within its own rated capacity. The device output constraints are given below [21]:
where is the power of devices of type of MG at time ; and are the lower and upper limits.
- Electricity Network Constraints
The electricity network constraints are interpreted as follows:
where , , , and are the binary variables; is the upper limit of electricity trading between HBMMSs and UPG in a single slot; and is the upper limit of electricity transmitted between MGs in a single slot.
- Spinning Reserve Capacity Constraints
To reduce the impact of multiple uncertainties on the safe and stable operation of the HBMMSs, the reserve capacity is considered.
where is the maximum electricity output of the CFPU of MG in a single slot; and , , and are the spinning reserve coefficients of the WT, the PV panel, and the electricity load demand, respectively.
- Power Generation Ratio Constraints
- Remaining hydrogen energy constraints
The hydrogen energy stored in the HT must also satisfy certain constraints, which are interpreted below [35]:
where is the hydrogen energy stored in the HT of MG at time ; and and are the lower and upper limits of hydrogen energy stored in the HT of MG .
- Green Hydrogen Production Strategy Constraints
Each MG can only use its renewable energy resources to produce hydrogen.
5. Solution Method
The developed model for the configuration optimization of HBMMSs is a bi-level multi-objective optimization model. There are three conflicting objectives: the minimum TAC and ACE, and the maximum SSR. To obtain the best configuration scheme, the hybrid solution method is proposed and its flow chart is shown in Figure 2.
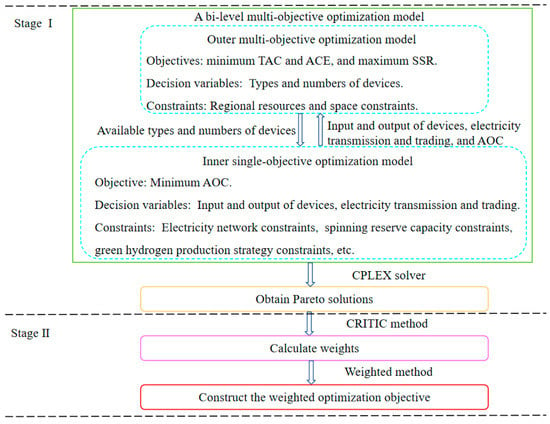
Figure 2.
Flow chart of the proposed solution method.
The concrete steps of the hybrid solution method are shown as follows:
Step 1. Obtain Pareto solutions
Setting the minimum TAC, ACE, and the maximum SSR as the unique outer optimization objectives, the proposed optimization model is solved using the CPLEX solver. Then, a Pareto solution set with Pareto solutions and objectives is obtained.
Step 2. Calculate weights
In this step, the CRITIC method is one of the objective weighting methods [41]. To date, it has been used in tidal-current power plant site selections [42], the evaluation of renewable energy heating systems [43], and blockchain platform evaluations [44].
This paper uses it to determine the weights of TAC, ACE, and SSR in the optimal configuration of HBMMSs.
- (1)
- Normalize the Pareto solution set
The normalized formula for benefit indicators is Equation (26), and the normalized formula for cost indicators is Equation (27), shown as follows:
- (2)
- Obtain the standard deviation
- (3)
- Calculate the correlation coefficients
- (4)
- Calculate the information amount
- (5)
- Obtain the weights
Step 3. Construct the weighted optimization objective
The weighted optimization objective in the outer model can simultaneously optimize TAC, ACE, and SSR, and consider the decision preferences of decision-makers, shown as follows:
6. Case Study
6.1. Basic Data
The proposed HBMMSs include two MGs, namely MG1 and MG2. The solar radiation is poor in region R1 where MG1 is located and wind speed is extremely low in region R2 where MG2 is located. Therefore, MG1 does not consider PV panels and MG2 does not consider WTs. The rated power of a single WT, PV panel, EL, and FC is 10 kW, 0.325 kW, 2 kW, and 2 kW, and the rated volume of a single HT is 6 m3 [40]. Besides this, the rated power of a single CFPU is 150 MW. Regarding the other technical parameters of the WT, PV panel, EL, FC, and HT, the , , and are 11 m/s, 3 m/s, and 25 m/s, respectively [40]; is 1 kW/m2, is 0.005, and is 25 °C [35]; is 0.75, is 0.28 m3/kWh, is 0.6, and is 1.55 kWh/m3 [40]; and = 0.001. The maximum numbers of the WT, PV panel, CFPU, EL, FC, and HT available for configuration optimization in region R1 are , 0, 10, 36,000, 23,000, and 45,000. The maximum numbers of the WT, PV panel, CFPU, EL, FC, and HT available for configuration optimization in region R2 are 0, , 10, 38,000, 15,000, and 35,000. The power output of a single WT in region R1 on a typical day is shown in Figure 3. The power output of a single PV panel in region R2 on a typical day is displayed in Figure 4. The electricity load demands of MG1 and MG2 on a typical day are presented in Figure 5.
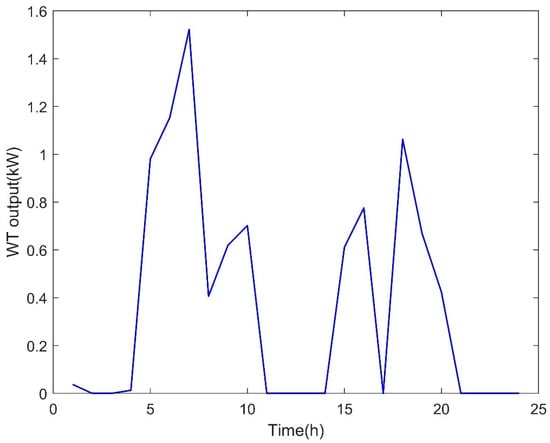
Figure 3.
The power output of a single WT in region R1 on a typical day.
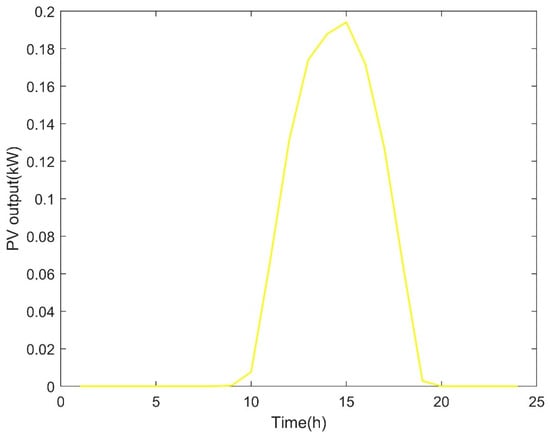
Figure 4.
The power output of a single PV panel in region R2 on a typical day.
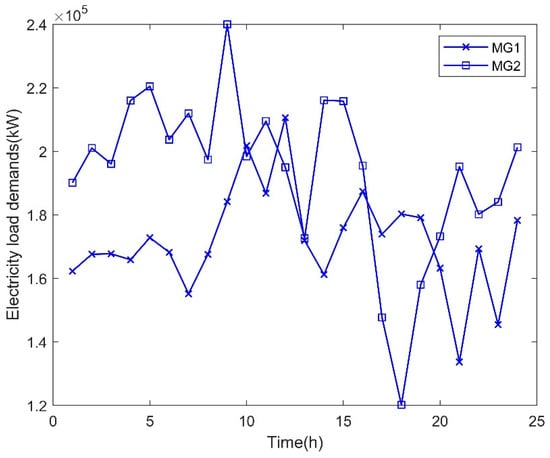
Figure 5.
Electricity load demands of MG1 and MG2 on a typical day.
According to different hydrogen production methods, two cases are set below:
Case 1: Green hydrogen production strategies are adopted.
Case 2: There is no special requirement for hydrogen production and green hydrogen production strategy constraints are not considered.
6.2. Results and Discussion
- (1)
- Configuration Results in Case 1
Regarding the optimal configuration scheme in Case 1, the TAC was USD 404.987 million, the ACE was 1.106 million tons, and the SSR was 0.486. The electricity input and output of the main devices of each MG on a typical day in Case 1 are shown in Figure 6 and Figure 7, the electricity trading between each MG and UPG on a typical day in Case 1 is displayed in Figure 8 and Figure 9, and the electricity transmission between MG1 and MG2 on a typical day in Case 1 is displayed in Figure 10.
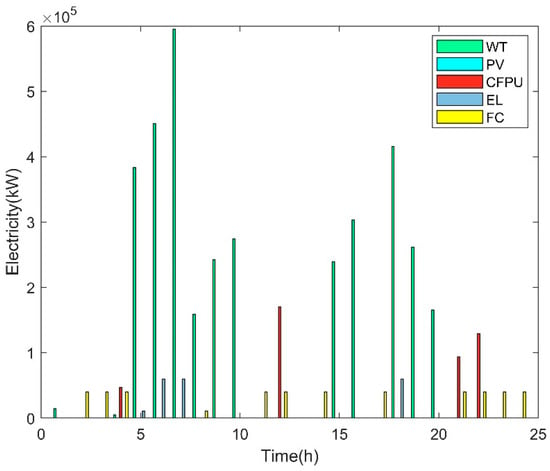
Figure 6.
Electricity input and output of the main devices of MG1 in Case 1.
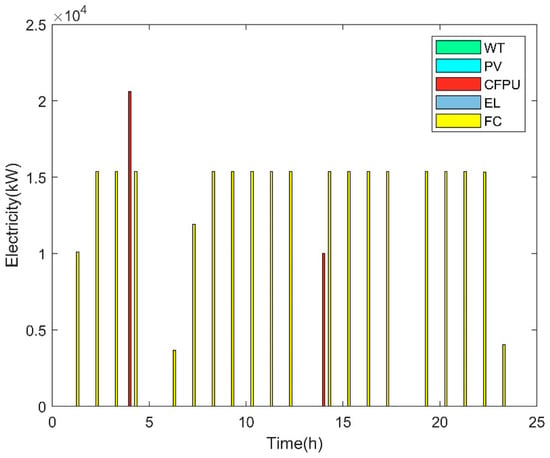
Figure 7.
Electricity input and output of the main devices of MG2 in Case 1.
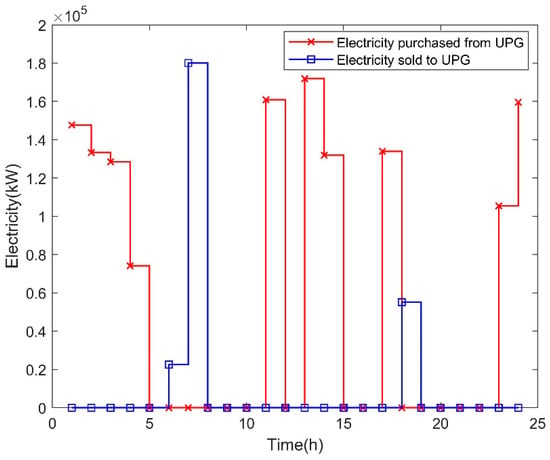
Figure 8.
Electricity trading between MG1 and UPG in Case 1.
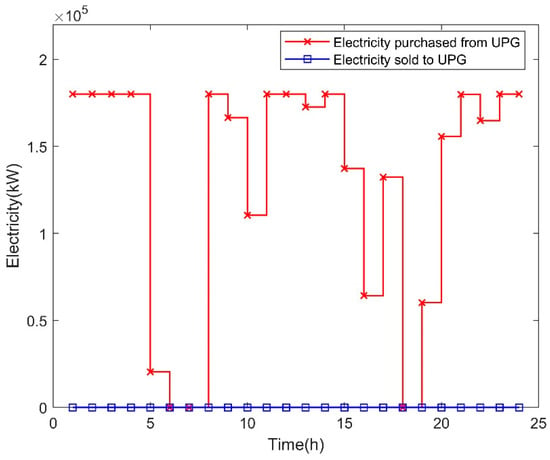
Figure 9.
Electricity trading between MG2 and UPG in Case 1.
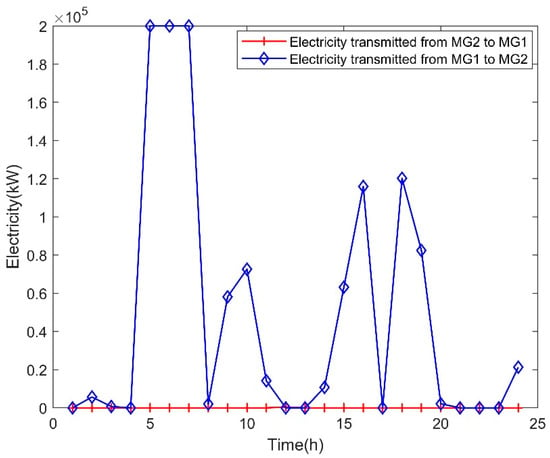
Figure 10.
Electricity transmission between MG1 and MG2 in Case 1.
According to Figure 6, the electricity output of WTs in slot 7 reached 595.142 MW, which was the maximum electricity output during a whole day. The CFPUs worked in slots 4, 12, and 21–22. ELs had the same electricity input in slots 6–7 and 18, while FCs produced the same electricity in slots 2–4, 11–12, 14, 17, and 21–24.
According to Figure 7, there was no WT, PV panel, and EL. The total electricity output of one CFPU was 30.627 MW and the maximum electricity output of the CFPU occurred in slot 4 on a typical day. The FC did not operate in slots 5, 13, 18, and 24, and the total electricity output of FCs was 275.644 MW during the whole day.
According to Figure 8, MG1 bought electricity from UPG in slots 1–4, 11, 13–14, 17, and 23–24, and the total purchased electricity was 1347.058 MW on a typical day, which was larger than the total electricity that MG1 sold to UPG. Besides this, there was no electricity trading between MG1 and UPG in slots 5, 8–10, 12, 15–16, and 19–22.
According to Figure 9, there was no electricity that MG2 sold to UPG and the total purchased electricity was equal to 3164.340 MW on a typical day. Besides this, there was no electricity trading between MG2 and UPG in slots 6–7 and 18.
Figure 10 shows that there was no electricity transmitted from MG2 to MG1. The maximum electricity that MG1 supplied to MG2 in a single slot was 200 MW and the total transmitted electricity from MG1 to MG2 exceeded 1168 MW on a typical day.
- (2)
- Configuration Results in Case 2
Regarding the optimal configuration scheme in Case 2, the TAC reached USD 399.917 million, the ACE was 2.090 million tons, and the SSR was 0.658. The electricity input and output of the main devices of each MG on a typical day in Case 2 are shown in Figure 11 and Figure 12, the electricity trading between each MG and UPG on a typical day in Case 2 is displayed in Figure 13 and Figure 14 and the electricity transmission between MG1 and MG2 on a typical day in Case 2 is displayed in Figure 15.
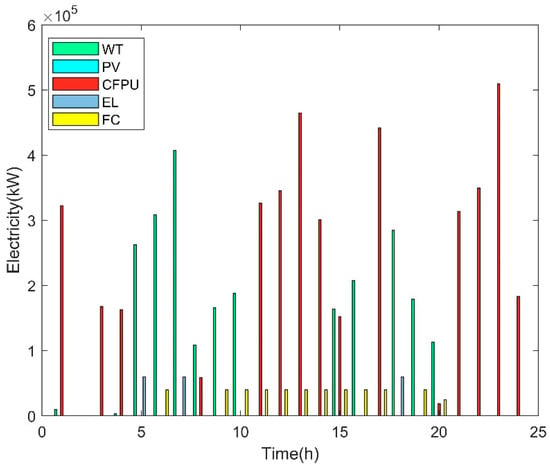
Figure 11.
Electricity input and output of the main devices of MG1 in Case 2.
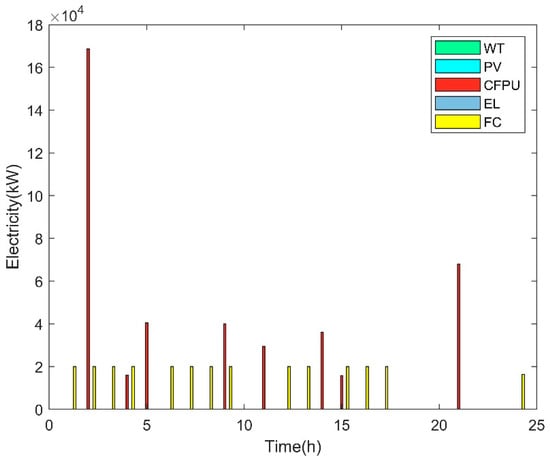
Figure 12.
Electricity input and output of the main devices of MG2 in Case 2.
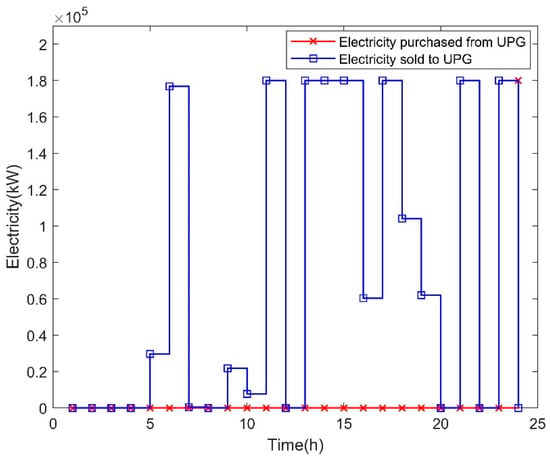
Figure 13.
Electricity trading between MG1 and UPG in Case 2.
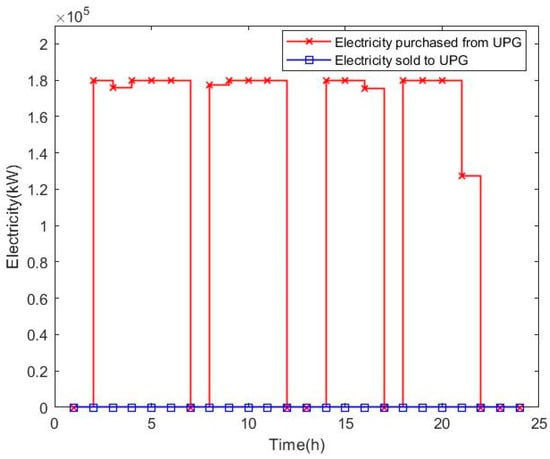
Figure 14.
Electricity trading between MG2 and UPG in Case 2.
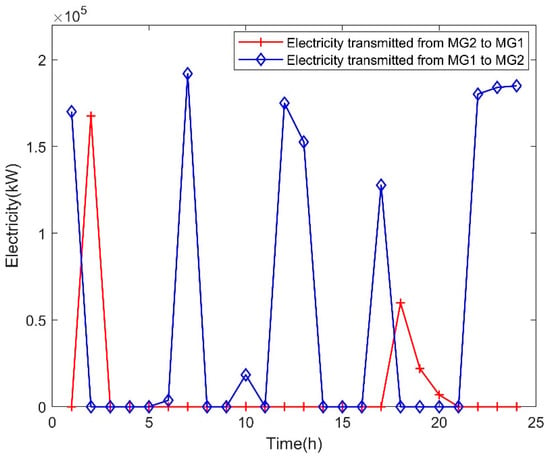
Figure 15.
Electricity transmission between MG1 and MG2 in Case 2.
Figure 11 shows that the maximum electricity output of WTs occurred in slot 7, that CFPUs operated in several slots on a typical day, and that the maximum power generation of CFPUs in a single slot was more than 500 MW. Moreover, ELs operated in slots 5, 7, and 18 and FCs operated in 6, 9–17 and 19–20.
According to Figure 12, there were only CFPUs and FCs working on a typical day. The total electricity output of CFPUs exceeded the total electricity output of FCs on a typical day. Besides this, CFPUs had the maximum electricity output in slot 2.
According to Figure 13, MG1 bought electricity from UPG only in slot 24. In slots 11, 13–15, 17, 21, and 23, MG1 sold the same amount of electricity to UPG. The total electricity sold to UPG reached 1722.752 MW on a typical day.
Figure 14 shows that MG2 bought electricity from UPG in several slots on a typical day and there was no electricity sold to UPG.
According to Figure 15, the total electricity that MG1 transmitted to MG2 was much larger than the total electricity that MG2 transmitted to MG1. MG2 supplied electricity to MG1 only in slots 2 and 18-20. Besides this, there was no electricity transmission between MG1 and MG2 in slots 3–5, 8–9, 11, 14–16, and 21.
- (3)
- Comparison of the Two Cases
The three objectives of the best configuration schemes in the two scenarios are shown in Table 3.

Table 3.
The best configuration results of the HBMMSs.
According to Table 3, when considering the green hydrogen production strategies, the TAC becomes larger while the ACE and SSR decrease. It means that when hydrogen is produced only using renewable energy, the carbon emission is reduced obviously, but the HBMMS costs much more money and its external dependence on the electricity supply becomes stronger.
7. Conclusions
Under the background of electricity–hydrogen coupling, this study investigated the configuration-optimization of HBMMSs connected with the UPG, which integrates coal-fired power generation, renewable energy, and hydrogen energy subsystems. The main conclusions can be summarized below:
- (1)
- A bi-level multi-objective optimization mode was proposed. In the model, the objective of the inner model was minimum AOC and the objectives of the outer model were minimum TAC, ACE, and maximum SSR. Moreover, electricity market trading and different hydrogen production strategies were considered simultaneously.
- (2)
- A two-stage solution method that combined CPLEX solver and CRITIC was developed to attain the optimal installed numbers and operation situation of each device, and the values of the three objectives under the different scenarios. In the first stage, Pareto solutions with respect to three objectives were obtained using the CPLEX solver; in the second stage, the CRITIC method was used to determine the weights of the TAC, ACE, and SSR, and the weighted optimization model was constructed.
- (3)
- In the case study, when considering the green hydrogen production strategies, the best HBMMSs with the TAC of USD 404.987 million, the ACE of 1.106 million tons, and the SSR of 0.486 was determined. The results of the comparative analysis indicate that adopting the green hydrogen production strategies was very conductive to reducing carbon emissions, while the independence of the electricity supply of the HBMMS was affected.
- (4)
- When electricity market trading was involved in the configuration optimization of HBMMSs, the electricity trading principles between the HBMMSs and the UPG, and between MGs should be clearly discriminated. Besides this, as the core of electricity trading principles, the setting of an electricity trading price should be highly valued.
- (5)
- The proposed model has some limitations. On the one hand, it is very difficult to be solved due to the complex structure of the bi-level optimization model; on the other hand, it only considers electricity trading, and does not consider carbon trading and hydrogen trading. Therefore, an electricity-carbon-hydrogen real-time trading optimization model could be established to promote the collaborative construction of the electricity market, carbon markets, and the hydrogen market in the future.
Author Contributions
Conceptualization, Z.L.; methodology, Z.L.; software, Y.L.; validation, Z.L. and G.Z.; formal analysis, Y.L.; investigation, G.Z.; resources, C.X.; data curation, Y.L. and G.Z.; writing—original draft preparation, Z.L.; writing—review and editing, Z.L., Y.L. and C.X.; visualization, G.Z.; supervision, C.X.; project administration, Z.L. All authors have read and agreed to the published version of the manuscript.
Funding
This research is supported by the State Key Laboratory of Power System Operation and Control (Grant No. SKLD22KM16), and the Social Science Foundation of Beijing (Grant No. 22JCC092).
Institutional Review Board Statement
Not applicable.
Informed Consent Statement
Not applicable.
Data Availability Statement
Not applicable.
Conflicts of Interest
The authors declare that they have no known competing financial interests or personal relationships that could have appeared to influence the work reported in this paper.
Nomenclature
| MG | Microgrid | Electricity output of the FC at time | |
| PV | Photovoltaic | Electricity generated per m3 of hydrogen | |
| EL | Electrolyzer | Lifetime of the device of type | |
| FC | Fuel cell | Interest rate | |
| HBMMS | Hydrogen-based multi-microgrid system | Unit investment cost of the device of type | |
| HT | Hydrogen tank | Installed capacity of the device of type of the MG | |
| TAC | Total annual cost | Carbon emission factor of the CFPU | |
| ACE | Annual carbon emission | Carbon emission factor of the UPG | |
| SSR | Self-sufficiency rate | Electricity generated by the CFPU of MG at time | |
| AOC | Annual operating cost | Electricity that MG buys from UPG at time | |
| CRITIC | Criteria Importance Through Intercriteria Correlation | Electricity output of the WTs of MG at time | |
| MADM | Multi-attribute decision-making | Electricity output of the PV panels of MG at time | |
| MODM | Multi-objective decision-making | Electricity load demand of MG at time | |
| WT | Wind turbine | Installed number of devices of type of MG | |
| STC | Standard test condition | Maximum number of devices of type of MG available for capacity configuration | |
| AIC | Annual investment cost | Electricity purchase price of the HBMMSs while trading with UPG at time | |
| CFPU | Coal-fired power units | Electricity selling price of the HBMMSs while trading with UPG at time | |
| UPG | Utility power grid | Electricity that MG sells to UPG at time | |
| AOMC | Annual operation and maintenance cost | Unit electricity transmission cost between MGs at time | |
| AFC | Annual fuel cost | Electricity that other MGs transmit to MG at time | |
| ATC | Annual transmission cost | Electricity output of the FC of MG at time | |
| Power output of WT at time | Electricity input of the EL of MG at time | ||
| Rated power of WT | Electricity that MG transmits to other MGs at time | ||
| Wind speed at time | Power of devices of type of MG at time | ||
| Rated wind speed | Lower limit of power of devices of type of MG in a single slot | ||
| Cut-in wind speed | Upper limit of power of devices of type of MG in a single slot | ||
| Cut-off wind speed | Upper limit of electricity trading between HBMMSs and UPG in a single slot | ||
| Power output of the PV panel at time | Upper limit of electricity transmitted between MGs in a single slot | ||
| Rated power of the PV panel under STC | Maximum electricity output of the CFPU of MG in a single slot | ||
| Solar radiation at time | Spinning reserve coefficient of the WT | ||
| STC solar radiation | Spinning reserve coefficient of the PV panel | ||
| Temperature coefficient | Spinning reserve coefficient of electricity load demand | ||
| Temperature at time | Lower limit of the power generation ratio of CFPUs of MG | ||
| STC temperature | Upper limit of the power generation ratio of CFPUs of MG | ||
| Remaining hydrogen of the HT at time | Hydrogen energy stored in the HT of MG at time | ||
| Remaining hydrogen of the HT at time | Lower limit of hydrogen energy stored in the HT of MG | ||
| Conversion efficiency of the EL | Upper limit of hydrogen energy stored in the HT of MG | ||
| Electricity input of the EL at time | Standard deviation | ||
| Hydrogen produced per kWh of electricity | Correlation coefficient between indicator and indicator | ||
| Conversion efficiency of the FC |
References
- Guo, P.; Musharavati, F.; Dastjerdi, S.M. Design and transient-based analysis of a power to hydrogen (P2H2) system for an off-grid zero energy building with hydrogen energy storage. Int. J. Hydrogen Energy 2022, 47, 26515–26536. [Google Scholar] [CrossRef]
- Dong, W.; Sun, H.; Mei, C.; Li, Z.; Zhang, J.; Yang, H. Forecast-driven stochastic optimization scheduling of an energy management system for an isolated hydrogen microgrid. Energy Convers. Manag. 2023, 277, 116640. [Google Scholar] [CrossRef]
- Alex, A.; Petrone, R.; Tala-Ighil, B.; Bozalakov, D.; Vandevelde, L.; Gualous, H. Optimal techno-enviro-economic analysis of a hybrid grid connected tidal-wind-hydrogen energy system. Int. J. Hydrogen Energy 2022, 47, 36448–36464. [Google Scholar] [CrossRef]
- Song, Y.; Mu, H.; Li, N.; Wang, H. Multi-objective optimization of large-scale grid-connected photovoltaic-hydrogen-natural gas integrated energy power station based on carbon emission priority. Int. J. Hydrogen Energy 2023, 48, 4087–4103. [Google Scholar] [CrossRef]
- Tabak, A.; Kayabasi, E.; Guneser, M.T.; Ozkaymak, M. Grey wolf optimization for optimum sizing and controlling of a PV/WT/BM hybrid energy system considering TNPC, LPSP, and LCOE concepts. Energy Sources Part A Recover. Util. Environ. Eff. 2019, 44, 1508–1528. [Google Scholar] [CrossRef]
- Tabak, A.; Özkaymak, M.; Tahir, M.; Oktay, H. Optimization and evaluation of hybrid PV/WT/BM system in different initial costs and LPSP conditions. Int. J. Adv. Comput. Sci. Appl. 2017, 8, 123–131. [Google Scholar] [CrossRef]
- Hou, H.; Xu, T.; Wu, X.; Wang, H.; Tang, A.; Chen, Y. Optimal capacity configuration of the wind-photovoltaic-storage hybrid power system based on gravity energy storage system. Appl. Energy 2020, 271, 115052. [Google Scholar] [CrossRef]
- Zhang, X.; Campana, P.E.; Bi, X.; Egusquiza, M.; Xu, B.; Wang, C.; Guo, H.; Chen, D.; Egusquiza, E. Capacity configuration of a hydro-wind-solar-storage bundling system with transmission constraints of the receiving-end power grid and its techno-economic evaluation. Energy Convers. Manag. 2022, 270, 116177. [Google Scholar] [CrossRef]
- Hou, R.; Maleki, A.; Li, P. Design optimization and optimal power management of standalone solar-hydrogen system using a new metaheuristic algorithm. J. Energy Storage 2022, 55, 105521. [Google Scholar] [CrossRef]
- Tebibel, H.; Labed, S. Design and sizing of stand-alone photovoltaic hydrogen system for HCNG production. Int. J. Hydrogen Energy 2014, 39, 3625–3636. [Google Scholar] [CrossRef]
- Alanazi, A.; Alanazi, M.; Nowdeh, S.A.; Abdelaziz, A.Y.; El-Shahat, A. An optimal sizing framework for autonomous photovoltaic/hydrokinetic/hydrogen energy system considering cost, reliability and forced outage rate using horse herd optimization. Energy Rep. 2022, 8, 7154–7175. [Google Scholar] [CrossRef]
- Coulibaly, S.; Zhao, J.; Li, W. Design and performance assessment of a solar-to-hydrogen system thermally assisted by recovered heat from a molten carbonate fuel cell. Clean. Energy Syst. 2022, 1, 100003. [Google Scholar] [CrossRef]
- Pu, Y.; Li, Q.; Zou, X.; Li, R.; Li, L.; Chen, W.; Liu, H. Optimal sizing for an integrated energy system considering degradation and seasonal hydrogen storage. Appl. Energy 2021, 302, 117542. [Google Scholar] [CrossRef]
- Zhang, G.; Shi, Y.; Maleki, A.; Rosen, M.A. Optimal location and size of a grid-independent solar/hydrogen system for rural areas using an efficient heuristic approach. Renew. Energy 2020, 156, 1203–1214. [Google Scholar] [CrossRef]
- Ayodele, T.; Mosetlhe, T.; Yusuff, A.; Ntombela, M. Optimal design of wind-powered hydrogen refuelling station for some selected cities of South Africa. Int. J. Hydrogen Energy 2021, 46, 24919–24930. [Google Scholar] [CrossRef]
- Jiang, Y.; Deng, Z.; You, S. Size optimization and economic analysis of a coupled wind-hydrogen system with curtailment decisions. Int. J. Hydrogen Energy 2019, 44, 19658–19666. [Google Scholar] [CrossRef]
- Lv, X.; Li, X.; Xu, C. A robust optimization model for capacity configuration of PV/battery/hydrogen system considering multiple uncertainties. Int. J. Hydrogen Energy 2023, 48, 7533–7548. [Google Scholar] [CrossRef]
- Deng, Z.; Jiang, Y. Optimal sizing of wind-hydrogen system considering hydrogen demand and trading modes. Int. J. Hydrogen Energy 2020, 45, 11527–11537. [Google Scholar] [CrossRef]
- Guo, S.; He, Y.; Pei, H.; Wu, S. The multi-objective capacity optimization of wind-photovoltaic-thermal energy storage hybrid power system with electric heater. Sol. Energy 2020, 195, 138–149. [Google Scholar] [CrossRef]
- Zhang, Y.; Sun, H.; Tan, J.; Li, Z.; Hou, W.; Guo, Y. Capacity configuration optimization of multi-energy system integrating wind turbine/photovoltaic/hydrogen/battery. Energy 2022, 252, 124046. [Google Scholar] [CrossRef]
- Zhou, J.; Wu, Y.; Zhong, Z.; Xu, C.; Ke, Y.; Gao, J. Modeling and configuration optimization of the natural gas-wind-photovoltaic-hydrogen integrated energy system: A novel deviation satisfaction strategy. Energy Convers. Manag. 2021, 243, 114340. [Google Scholar] [CrossRef]
- Okundamiya, M. Size optimization of a hybrid photovoltaic/fuel cell grid connected power system including hydrogen storage. Int. J. Hydrogen Energy 2021, 46, 30539–30546. [Google Scholar] [CrossRef]
- El-Sattar, H.A.; Kamel, S.; Sultan, H.M.; Zawbaa, H.M.; Jurado, F. Optimal design of photovoltaic, biomass, fuel cell, hydrogen tank units and electrolyzer hybrid system for a remote area in Egypt. Energy Rep. 2022, 8, 9506–9527. [Google Scholar] [CrossRef]
- Barhoumi, E.M.; Okonkwo, P.C.; Ben Belgacem, I.; Zghaibeh, M.; Tlili, I. Optimal sizing of photovoltaic systems based green hydrogen refueling stations case study Oman. Int. J. Hydrogen Energy 2022, 47, 31964–31973. [Google Scholar] [CrossRef]
- Wang, J.; Xue, K.; Guo, Y.; Ma, J.; Zhou, X.; Liu, M.; Yan, J. Multi-objective capacity programming and operation optimization of an integrated energy system considering hydrogen energy storage for collective energy communities. Energy Convers. Manag. 2022, 268, 116057. [Google Scholar] [CrossRef]
- Hosseinnia, H.; Mohammadi-Ivatloo, B.; Mohammadpourfard, M. Multi-objective configuration of an intelligent parking lot and combined hydrogen, heat and power (IPL-CHHP) based microgrid. Sustain. Cities Soc. 2021, 76, 103433. [Google Scholar] [CrossRef]
- He, J.; Wu, Y.; Wu, M.; Xu, M.; Liu, F. Two-stage configuration optimization of a novel standalone renewable integrated energy system coupled with hydrogen refueling. Energy Convers. Manag. 2022, 251, 114953. [Google Scholar] [CrossRef]
- Fan, G.; Liu, Z.; Liu, X.; Shi, Y.; Wu, D.; Guo, J.; Zhang, S.; Yang, X.; Zhang, Y. Two-layer collaborative optimization for a renewable energy system combining electricity storage, hydrogen storage, and heat storage. Energy 2022, 259, 125047. [Google Scholar] [CrossRef]
- Luo, Z.; Yang, S.; Xie, N.; Xie, W.; Liu, J.; Souley Agbodjan, Y.; Liu, Z. Multi-objective capacity optimization of a distributed energy system considering economy, environment and energy. Energy Convers. Manag. 2019, 200, 112081. [Google Scholar] [CrossRef]
- Li, P.; Wang, Z.; Liu, H.; Wang, J.; Guo, T.; Yin, Y. Bi-level optimal configuration strategy of community integrated energy system with coordinated planning and operation. Energy 2021, 236, 121539. [Google Scholar] [CrossRef]
- Pan, G.; Gu, W.; Qiu, H.; Lu, Y.; Zhou, S.; Wu, Z. Bi-level mixed-integer planning for electricity-hydrogen integrated energy system considering levelized cost of hydrogen. Appl. Energy 2020, 270, 115176. [Google Scholar] [CrossRef]
- Qiu, Y.; Li, Q.; Wang, T.; Yin, L.; Chen, W.; Liu, H. Optimal planning of cross-regional hydrogen energy storage systems considering the uncertainty. Appl. Energy 2022, 326, 119973. [Google Scholar] [CrossRef]
- Zeng, B.; Wang, W.; Zhang, W.; Wang, Y.; Tang, C.; Wang, J. Optimal configuration planning of vehicle sharing station-based electro-hydrogen micro-energy systems for transportation decarbonization. J. Clean. Prod. 2023, 387, 135906. [Google Scholar] [CrossRef]
- Li, J.; Zhao, J.; Chen, Y.; Mao, L.; Qu, K.; Li, F. Optimal sizing for a wind-photovoltaic-hydrogen hybrid system considering levelized cost of storage and source-load interaction. Int. J. Hydrogen Energy 2023, 48, 4129–4142. [Google Scholar] [CrossRef]
- Shang, J.; Gao, J.; Jiang, X.; Liu, M.; Liu, D. Optimal configuration of hybrid energy systems considering power to hydrogen and electricity-price prediction: A two-stage multi-objective bi-level framework. Energy 2023, 263, 126023. [Google Scholar] [CrossRef]
- Ju, L.; Yin, Z.; Zhou, Q.; Li, Q.; Wang, P.; Tian, W.; Li, P.; Tan, Z. Nearly-zero carbon optimal operation model and benefit allocation strategy for a novel virtual power plant using carbon capture, power-to-gas, and waste incineration power in rural areas. Appl. Energy 2022, 310, 118618. [Google Scholar] [CrossRef]
- Yang, S.; Tan, Z.; Zhou, J.; Xue, F.; Gao, H.; Lin, H.; Zhou, F. A two-level game optimal dispatching model for the park integrated energy system considering Stackelberg and cooperative games. Int. J. Electr. Power Energy Syst. 2021, 130, 106959. [Google Scholar] [CrossRef]
- Tabar, V.S.; Ghassemzadeh, S.; Tohidi, S. Energy management in hybrid microgrid with considering multiple power market and real time demand response. Energy 2019, 174, 10–23. [Google Scholar] [CrossRef]
- Chaudhary, P.; Rizwan, M. Energy management supporting high penetration of solar photovoltaic generation for smart grid using solar forecasts and pumped hydro storage system. Renew. Energy 2018, 118, 928–946. [Google Scholar] [CrossRef]
- Xu, C.; Ke, Y.; Li, Y.; Chu, H.; Wu, Y. Data-driven configuration optimization of an off-grid wind/PV/hydrogen system based on modified NSGA-II and CRITIC-TOPSIS. Energy Convers. Manag. 2020, 215, 112892. [Google Scholar] [CrossRef]
- Wu, Y.; Deng, Z.; Tao, Y.; Wang, L.; Liu, F.; Zhou, J. Site selection decision framework for photovoltaic hydrogen production project using BWM-CRITIC-MABAC: A case study in Zhangjiakou. J. Clean. Prod. 2021, 324, 129233. [Google Scholar] [CrossRef]
- Shao, M.; Zhao, Y.; Sun, J.; Han, Z.; Shao, Z. A decision framework for tidal current power plant site selection based on GIS-MCDM: A case study in China. Energy 2023, 262, 125476. [Google Scholar] [CrossRef]
- Yang, X.; Zheng, X.; Zhou, Z.; Miao, H.; Liu, H.; Wang, Y.; Zhang, H.; You, S.; Wei, S. A novel multilevel decision-making evaluation approach for the renewable energy heating systems: A case study in China. J. Clean. Prod. 2023, 390, 135934. [Google Scholar] [CrossRef]
- Lai, H.; Liao, H. A multi-criteria decision making method based on DNMA and CRITIC with linguistic D numbers for blockchain platform evaluation. Eng. Appl. Artif. Intell. 2021, 101, 104200. [Google Scholar] [CrossRef]
Disclaimer/Publisher’s Note: The statements, opinions and data contained in all publications are solely those of the individual author(s) and contributor(s) and not of MDPI and/or the editor(s). MDPI and/or the editor(s) disclaim responsibility for any injury to people or property resulting from any ideas, methods, instructions or products referred to in the content. |
© 2023 by the authors. Licensee MDPI, Basel, Switzerland. This article is an open access article distributed under the terms and conditions of the Creative Commons Attribution (CC BY) license (https://creativecommons.org/licenses/by/4.0/).