Article

Estimation of Hydraulic Parameters from the Soil Water Characteristic Curve

Laboratory of Agricultural Hydraulics, Department of Agriculture Crop Production & Rural Environment, University of Thessaly, Fytokou Street, N. Ionia, 38446 Vólos, Greece
*
Author to whom correspondence should be addressed.
Sustainability 2023, 15(8), 6714; https://doi.org/10.3390/su15086714
Submission received: 21 March 2023 / Revised: 10 April 2023 / Accepted: 13 April 2023 / Published: 15 April 2023

Abstract

:
Soil water characteristic curve (SWCC) is one of the most essential hydraulic properties that play fundamental role in various environmental issues and water management. SWCC gives important information for water movement, soil behavior, infiltration, and drainage mechanism, affecting the water circle and the aquifer recharge. Since most of the world’s freshwater withdrawals go for irrigation uses, decoding SWCC is beneficial, as it affects water saving through irrigation planning. Estimation of crucial parameters, such as field capacity (FC) and permanent wilting point (PWP) is the key solution for water saving. Modelling of the SWCC and hydraulic parameters estimation are of great importance, since the laboratory experimental procedures and the experiments in the field are often time-consuming processes. In the present study, the SWCC along with FC and PWP of two soil types were obtained via specific experimental procedures in the laboratory. In order to simulate the SWCC and estimate FC and PWP, the experimental data were approximated with van Genuchten’s model. Results showed that using SWCC to estimate FC gives excellent results, while the method rationally overestimates the PWP. Hence, the presented method leads to estimation of crucial hydraulic parameters that can be used in irrigation planning and water saving practices.

1. Introduction

The soil water characteristic curve (SWCC) is one of the most important hydraulic characteristics of the soil, required for hydrological, environmental, and agricultural research. The SWCC is defined as the curve Ψ(θ) that connects the suction of the water into the soil pores (Ψ = −h) with soil moisture θ [1,2]. It is a source of important information for the movement of water, the infiltration mechanism, but also for the transport of substances in the unsaturated zone. During drainage the negative tension (h) of the water remaining in the soil decreases, so the absolute value (Ψ) increases. During wetting, the negative pressure head (h) increases, so the absolute value (Ψ) is reducing. In practice, during the drying–wetting procedure the soil moisture varies between residual water content θr and water content at saturation θs [3]. In the unsaturated zone, the function Ψ = f(θ) between the absolute tension and the soil moisture is not a one-to-one function, which means that during the drying–wetting procedure one Ψ value corresponds to two soil moisture values (one for the drainage and a different one for wetting). Furthermore, it is observed that the sorption (or imbibition) curve shows a “downward” shift in relation to the desorption (or retention, or release) curve. This consists of the hysteresis phenomenon and is graphically captured with the hysteresis loop. Brooks and Corey [4] correlated θr with pores distribution. Gaudet [5] defined θr as the smallest value that θ can reach during drainage. Van Genuchten [6,7] and Mualem [8] defined θr as the value of θ for which dθ/dh is zero (at the θ(h) curve), in the region of low values of θ). Haverkamp [9] considered θr as an empirical parameter, corresponding to a water content, which does not participate in the flow.
The SWCC is a useful tool for the rational management of water and the optimization of irrigation that leads to water saving. It is a basic hydraulic function, which helps to decode the movement of water through the soil [10,11]. Therefore, water resources management for irrigation purposes should be enriched with the knowledge of the movement of water into the soil, as well as the parameters involved in water–soil relations. This knowledge contributes to the planning of irrigations, but also to drainage studies and hydrology of watersheds generally. Thus, the management of available water in agriculture can be achieved in the most rational way [8,12]. Crop development depends on soil water in the vadose zone [13], so SWCC gives essential and paramount hydraulic information in order to estimate the soil water availability for plant use, while it can be used to simulate water movement and solute flow in the unsaturated zone [14].
The SWCC is often obtained in the laboratory using porous media-based methods, such as sand box, soil column and pressure ceramic plate extractors, etc., [13], while in the field, watermarks and soil water tension disc infiltrometers are very common [15,16]. Laboratory and field experiments are often time consuming and depend on the conditions, thus they both have pros and cons [14].
The SWCC is related to various hydraulic parameters and soil textures, such as hydraulic conductivity, size of the soil pores, etc., [17,18], and it has been used to detect the hydrological effects of vegetation [13,19,20].
Knowledge and simulation of the SWCC is one of the most useful tools in order to dive deeply into the water movement functions and the hydraulic parameters of the soil, such as soil moisture at saturation, residual soil moisture, work required for a complete drainage, FC, and PWP [12,21,22,23,24,25]. One of the most important functions for SWCC simulation is van Genuchten’s model [6,7], which is an empirical equation given below:
Θ = θ θ r θ s θ r = 1 1 + a h n m
where:
m = 1 1 n                     0 < m < 1
θs is soil moisture at saturation, θr is the residual moisture and α, m, n are parameters. Parameter α causes a parallel shift of the characteristic curve without altering its shape, as long as the other parameters remain constant. The parameter n is responsible for the deformation of the curvature [10].
Equation (1) can also be written:
h = θ s θ r θ θ r 1 / m 1 1 n 1 α
The area below the drainage curve expresses the work required for the complete drainage of a unit of saturated soil. Relatively, the same applies for the complete wetting. The difference between the two areas is the work of hysteresis, which is expressed by the formula:
W γ w = 0 θ s h θ d θ
where γw = 1 g/cm3 is the specific weight of water.
The possession of SWCC and the hysteresis loop provides us with a deep understanding of soil water movement and its parameters, which can lead to optimum irrigation and sustainable planning [14,26]. Among many researchers, Abdallah [27], Amanabadi et al. [28], Ket et al. [14], and Lamorski et al. [29], recommended that in order to improve the usage and application of the SWCC in agriculture and engineering, more experimental data on SWCC should be obtained, encompassing new techniques and methods. Additionally, the dynamic change of soil properties should be considered in the inversion model to improve the accuracy of water flow prediction. Hence, modelling SWCC is challenging, elevating the soil water movement case and is very promising for the future [30,31]. Most recent research indicates the importance of determining SWCC from data in the field and in the laboratory [32,33,34,35]. The shape and format of SWCC depends on soil’s physical and hydraulic parameters and has an impact on water behavior and motion [36,37,38]. Moreover, some scientists have turned to new techniques, such as machine learning and artificial intelligence, with promising results [39,40,41,42]. The current study is presenting the usage of SWCC in order to achieve rational application of irrigation water and water saving, by estimating crucial hydraulic parameters.

2. Materials and Methods

Two samples of different soil types (sandy, and sandy loam) were selected in order to investigate their characteristic curves at the laboratory. The soil samples were collected from two locations of Magnesia Prefecture in Greece: (a) Anavros: latitude 39°21′01.04″ N, longitude 22°57′47.17″ E, altitude 3 m above sea level, and (b) Velestino, latitude 39°22′43″ N, longitude 22°44′30″ E, altitude 70 m above sea level (three replications). The soil samples were collected at depths 0–30 cm from the soil surface. The experimental procedure took place at the Laboratory of Agricultural Hydraulics of the Department of Agriculture, Crop Production & Rural Environment of the School of Agricultural Sciences of University of Thessaly, Volos, Greece. Each soil sample was at first dried at 105 °C and packed as uniformly as possible into a Plexiglas column of 6 cm diameter (inner). A geotextile of permeability greater than that of the soil samples was placed at the bottom of the column. The column was supported with TDR probes (TDR Trace 6050X1, Soilmoisture Equipment Corp., Goleta, CA, USA) and a ceramic capsule connected to a pressure transducer (Figure 1). In order to avoid bubbling, the soil column was wetted from the bottom, using a Marriott device, at several stages, until saturation was achieved. Starting from saturation, 1st drainage was completed when no water was drained from the column. During the 1st drainage experiment, a drainage container was used instead of the Marriott bottle. After 1st drainage, 2nd wetting was achieved at several stages until saturation, using the Marriott bottle again. Finally, a 2nd drainage was achieved following the same procedure as the 1st drainage.
Calibration of the pressure transducer has been achieved in a separate experiment, to convert the electrical voltage (mV) to tension (cm). Soil moisture and soil water tension data were collected via data loggers at various times. Extraction of the SWCC was obtained as a combination of data collected from the pressure transducer and the TDR sensor that was applied directly opposite (the ceramic capsule was 1 cm lower than the TDR sensor, as seen in Figure 1). From the experimental data, soil moisture and soil water tension curves versus time were obtained for all the wetting–drainage procedures. Finally, the experimental points that were used to design the SWCC of each soil sample were also the incoming parameters to van Genuchten’s model, so as to achieve the water movement simulation. Field capacity (FC) and permanent wilting point (PWP) of the soil samples under research were measured in the laboratory using specific experimental procedure (pressure plate extractor, Soilmoisture Equipment Corp., California), following the protocol of the experimental procedure. The soil moisture of the soil samples was measured after applying certain tensions for PWP and FC, respectively.

3. Results

The physical parameters of the soil samples were obtained in the laboratory and are shown in Table 1, where θi is the initial soil moisture, θs is the saturated soil moisture and ρb is the bulk density (average values).

3.1. First Drainage—Sand

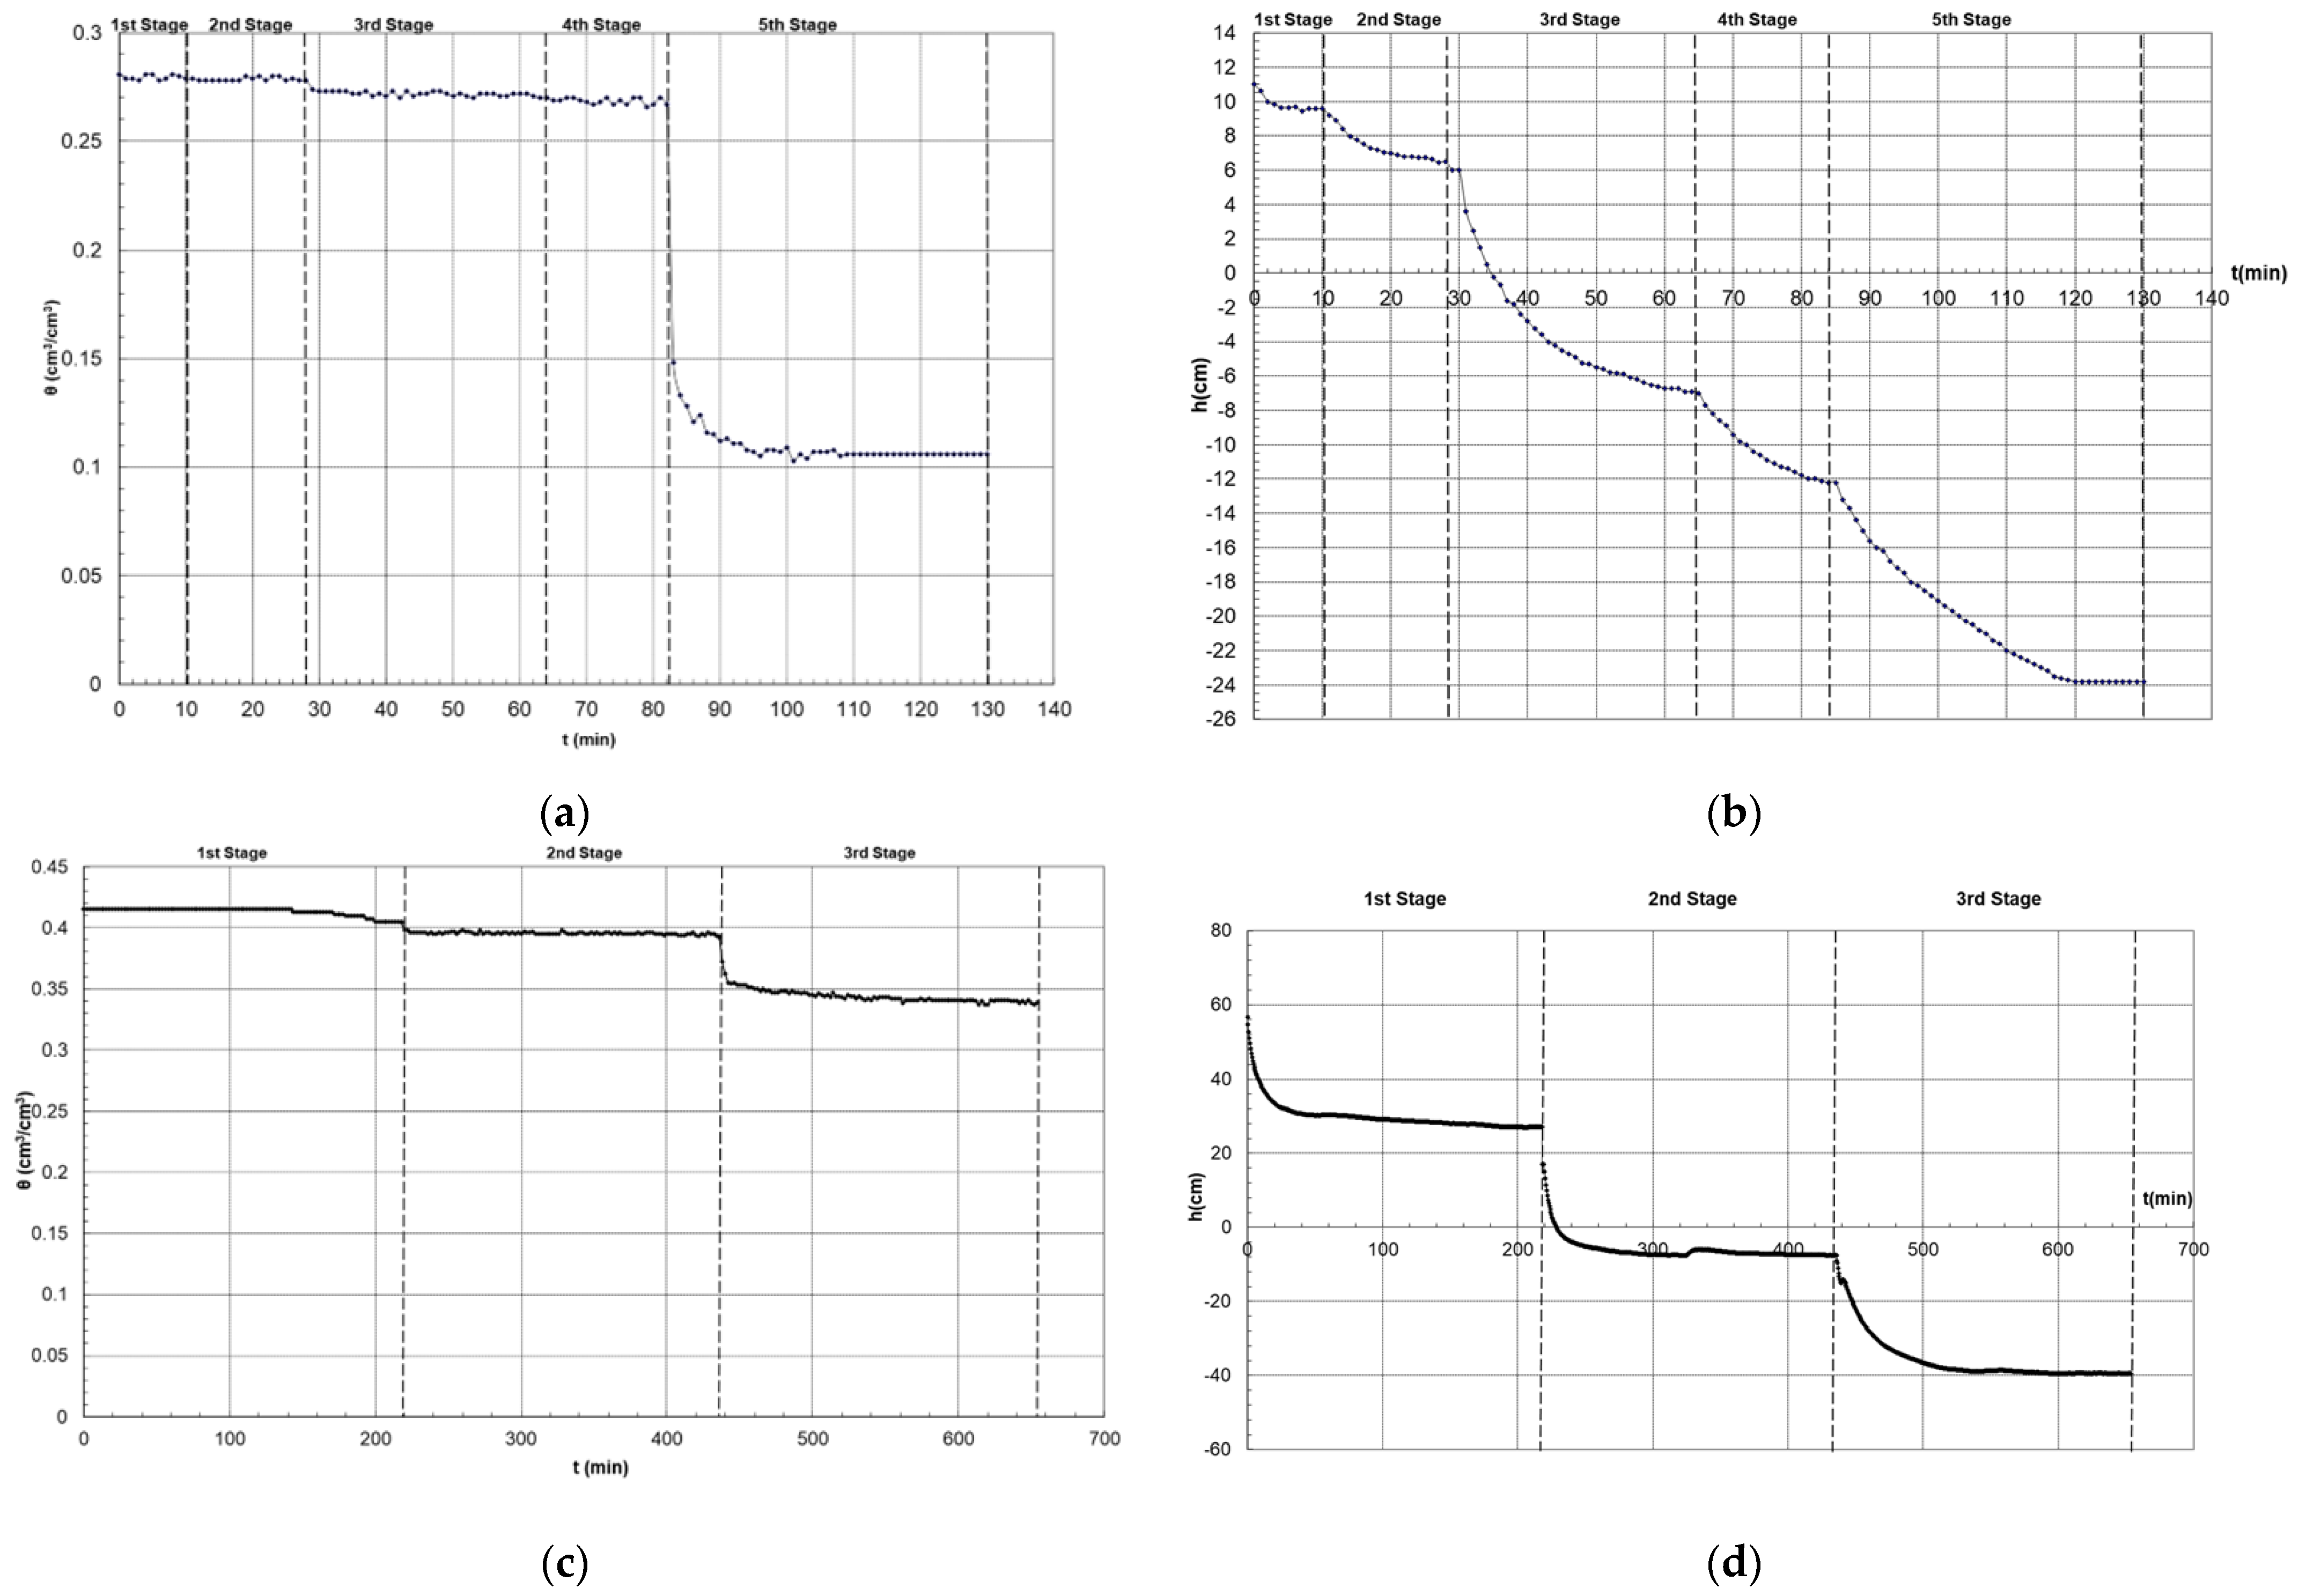
The first drainage was performed in five stages, during which the vertical distance of the surface of the drainage container from the ceramic capsule and the duration of each stage was:
  • First stage: +10 cm, Δt1 = (0–10) min = 10 min.
  • Second stage: +6 cm, Δt2 = (10–28) min = 18 min.
  • Third stage: −7 cm, Δt3 = (28–64) min = 36 min.
  • Fourth stage: −12 cm, Δt4 = (64–84) min = 20 min.
  • Fifth stage: −24 cm, Δt5 = (83–130) min = 47 min.
Using the data collected from the data loggers during the first drainage, soil moisture curve vs. time and soil water tension curve vs. time were designed (Figure 2a,b, respectively).

3.2. First Drainage—Sandy Loam

The first drainage was performed in three stages. The vertical distance of the water surface of the drainage container from the ceramic capsule, as well as the duration of each stage were:
  • First stage: +28 cm, Δt1 = (218–0) min = 218 min.
  • Second stage: −9 cm, Δt2 = (436–218) min = 218 min.
  • Third stage: −40 cm, Δt3 = (654–436) min = 218 min.
The soil moisture and the tension versus time curves were obtained from the soil moisture and the soil water tension data and are presented in Figure 2c,d.

3.3. Second Wetting—Sand

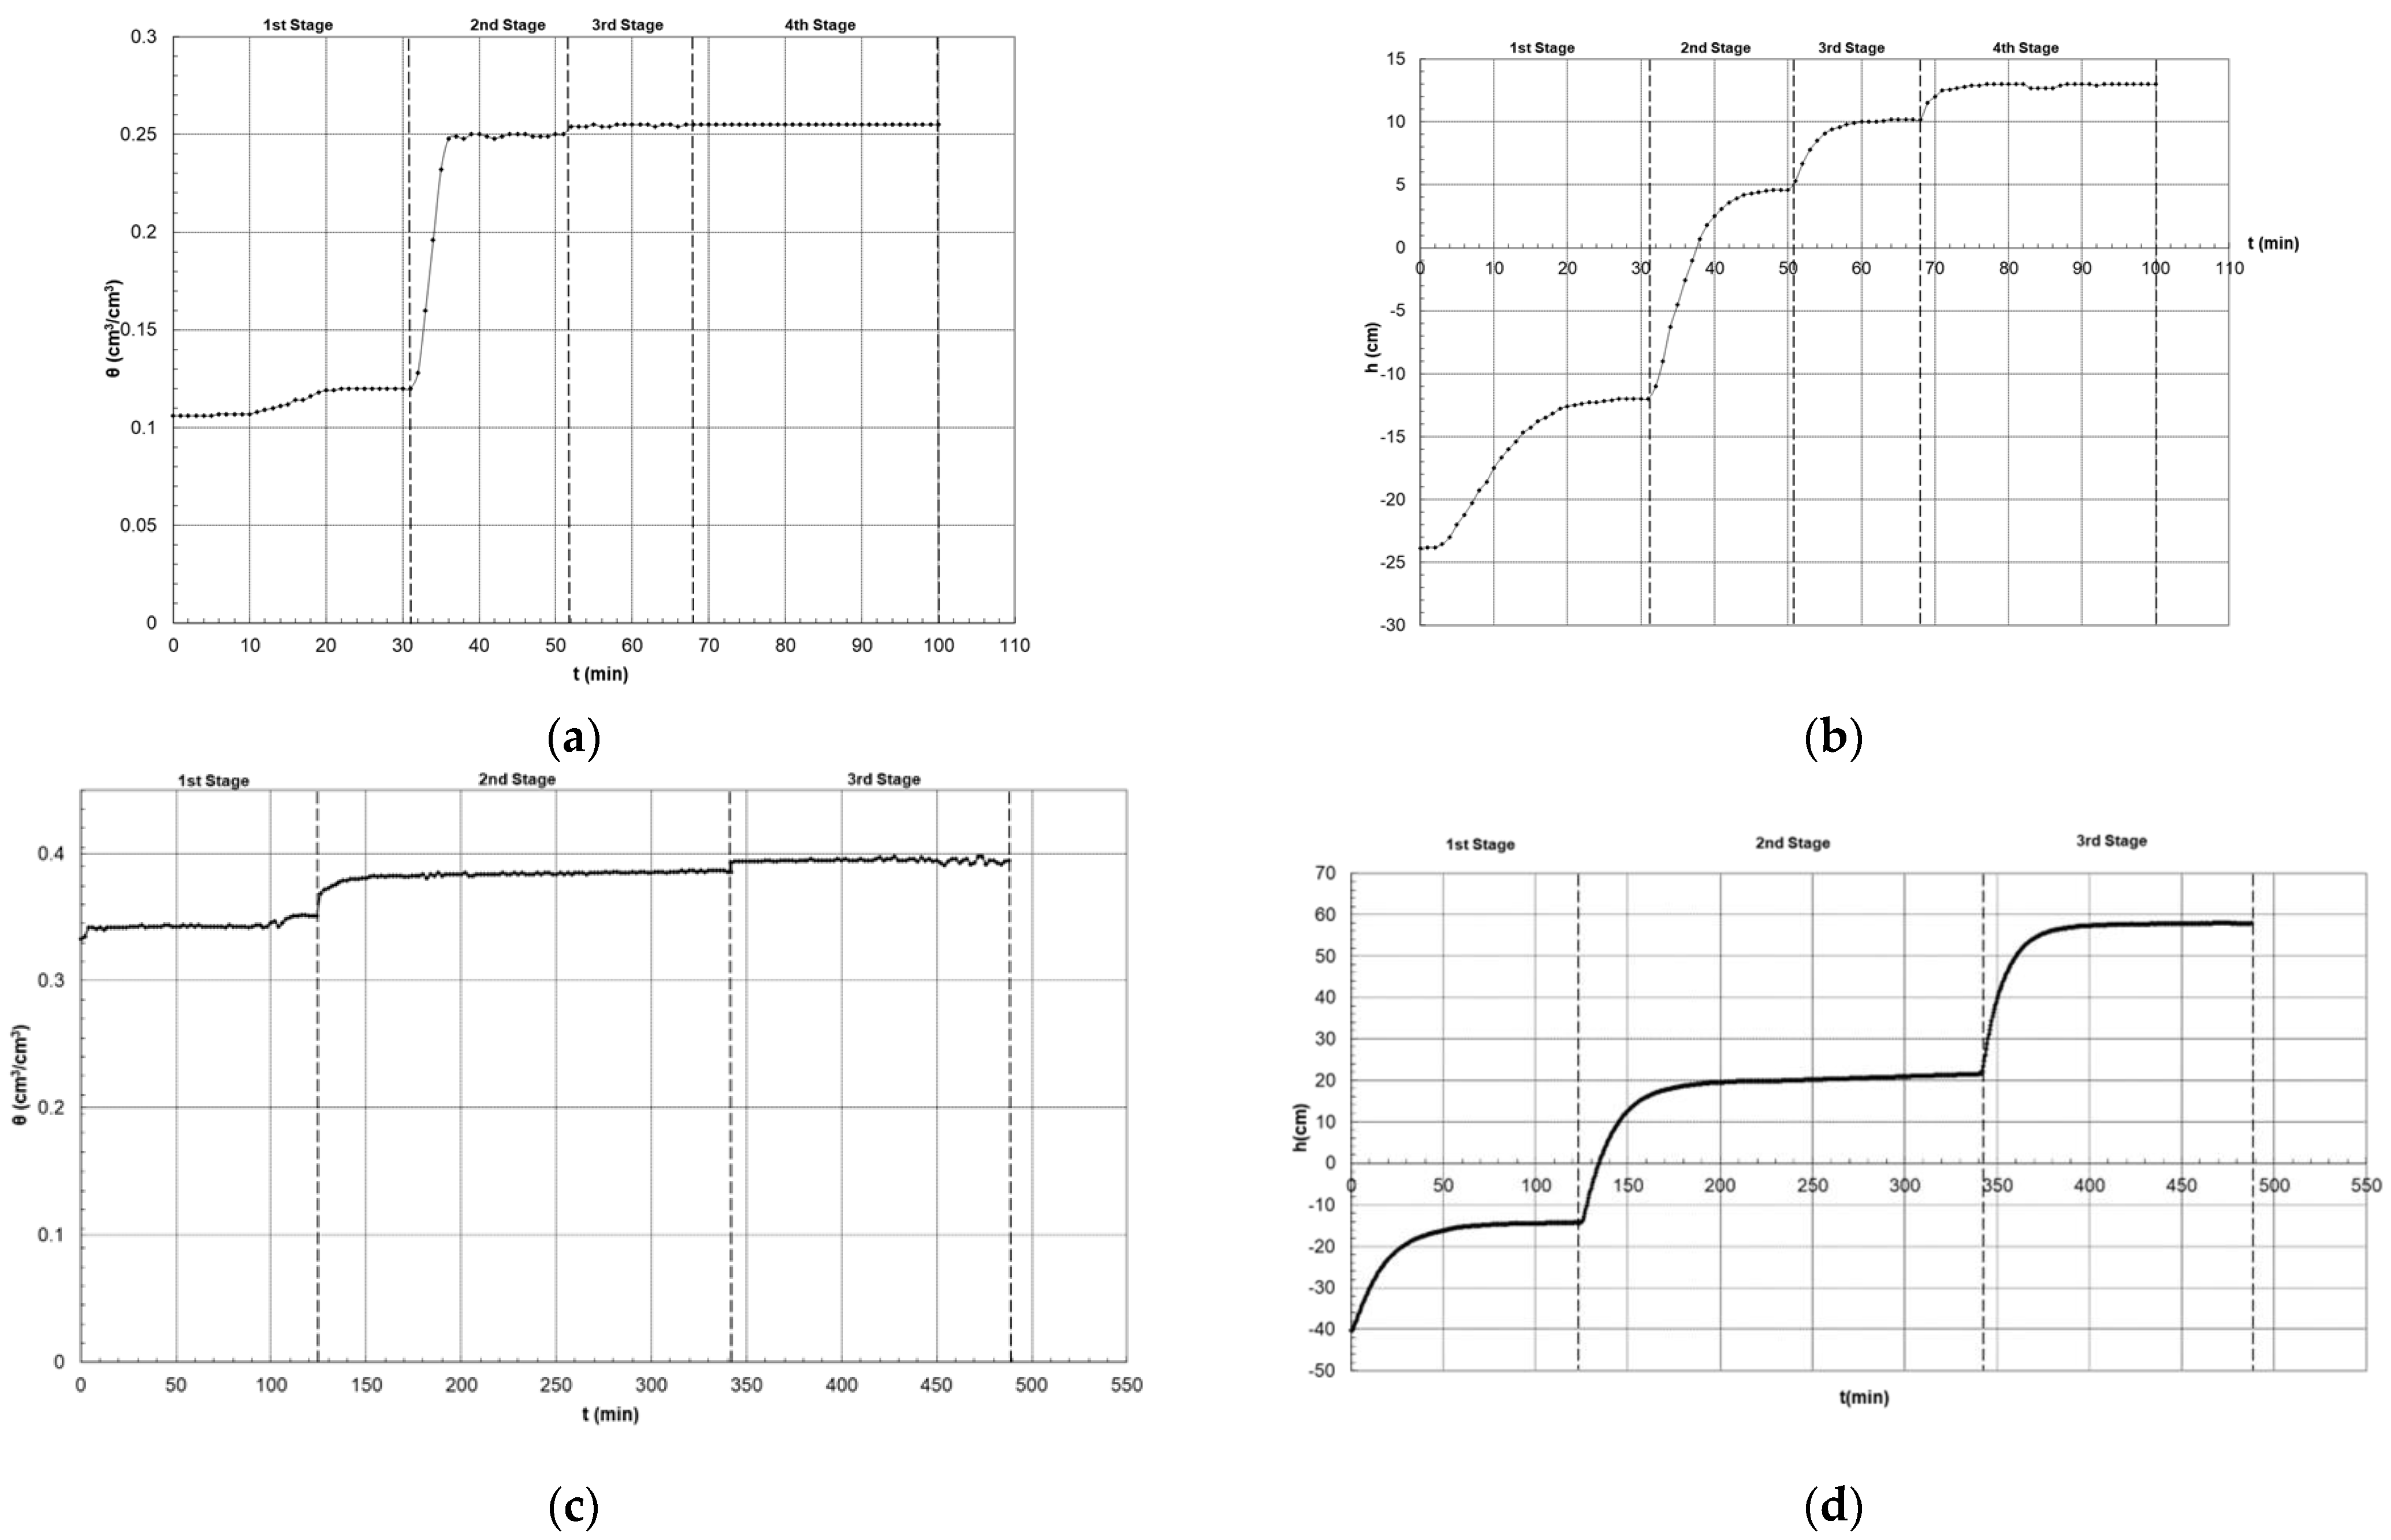
The second wetting of the soil column was obtained in four stages (until equilibrium at each stage). The vertical distances of the Mariotte bottle from the ceramic capsule as well as the time durations of the stages were:
  • First stage: −12 cm, Δt1 = (0–31) min = 31 min.
  • Second stage: +5 cm, Δt2 = (31–51) min = 20 min.
  • Third stage: +10 cm, Δt3 = (51–68) min = 17 min.
  • Fourth stage: +13 cm, Δt4 = (68–100) min = 32 min.
Figure 3a,b shows the soil moisture and the soil water tension versus time, respectively.

3.4. Second Wetting—Sandy Loam

Second wetting was performed in three stages, where the vertical distances of the Mariotte bottle from the ceramic capsule and the duration of each stage are given below:
  • First stage: −14 cm, Δt1 = (124–0) min = 124 min.
  • Second stage: + 20 cm, Δt2 = (342–124) min = 218 min.
  • Third stage: + 58 cm, Δt3 = (488–342) min = 146 min.
Soil moisture versus time and soil water tension versus time curves are given in Figure 3c,d, respectively.

3.5. Second Drainage—Sand

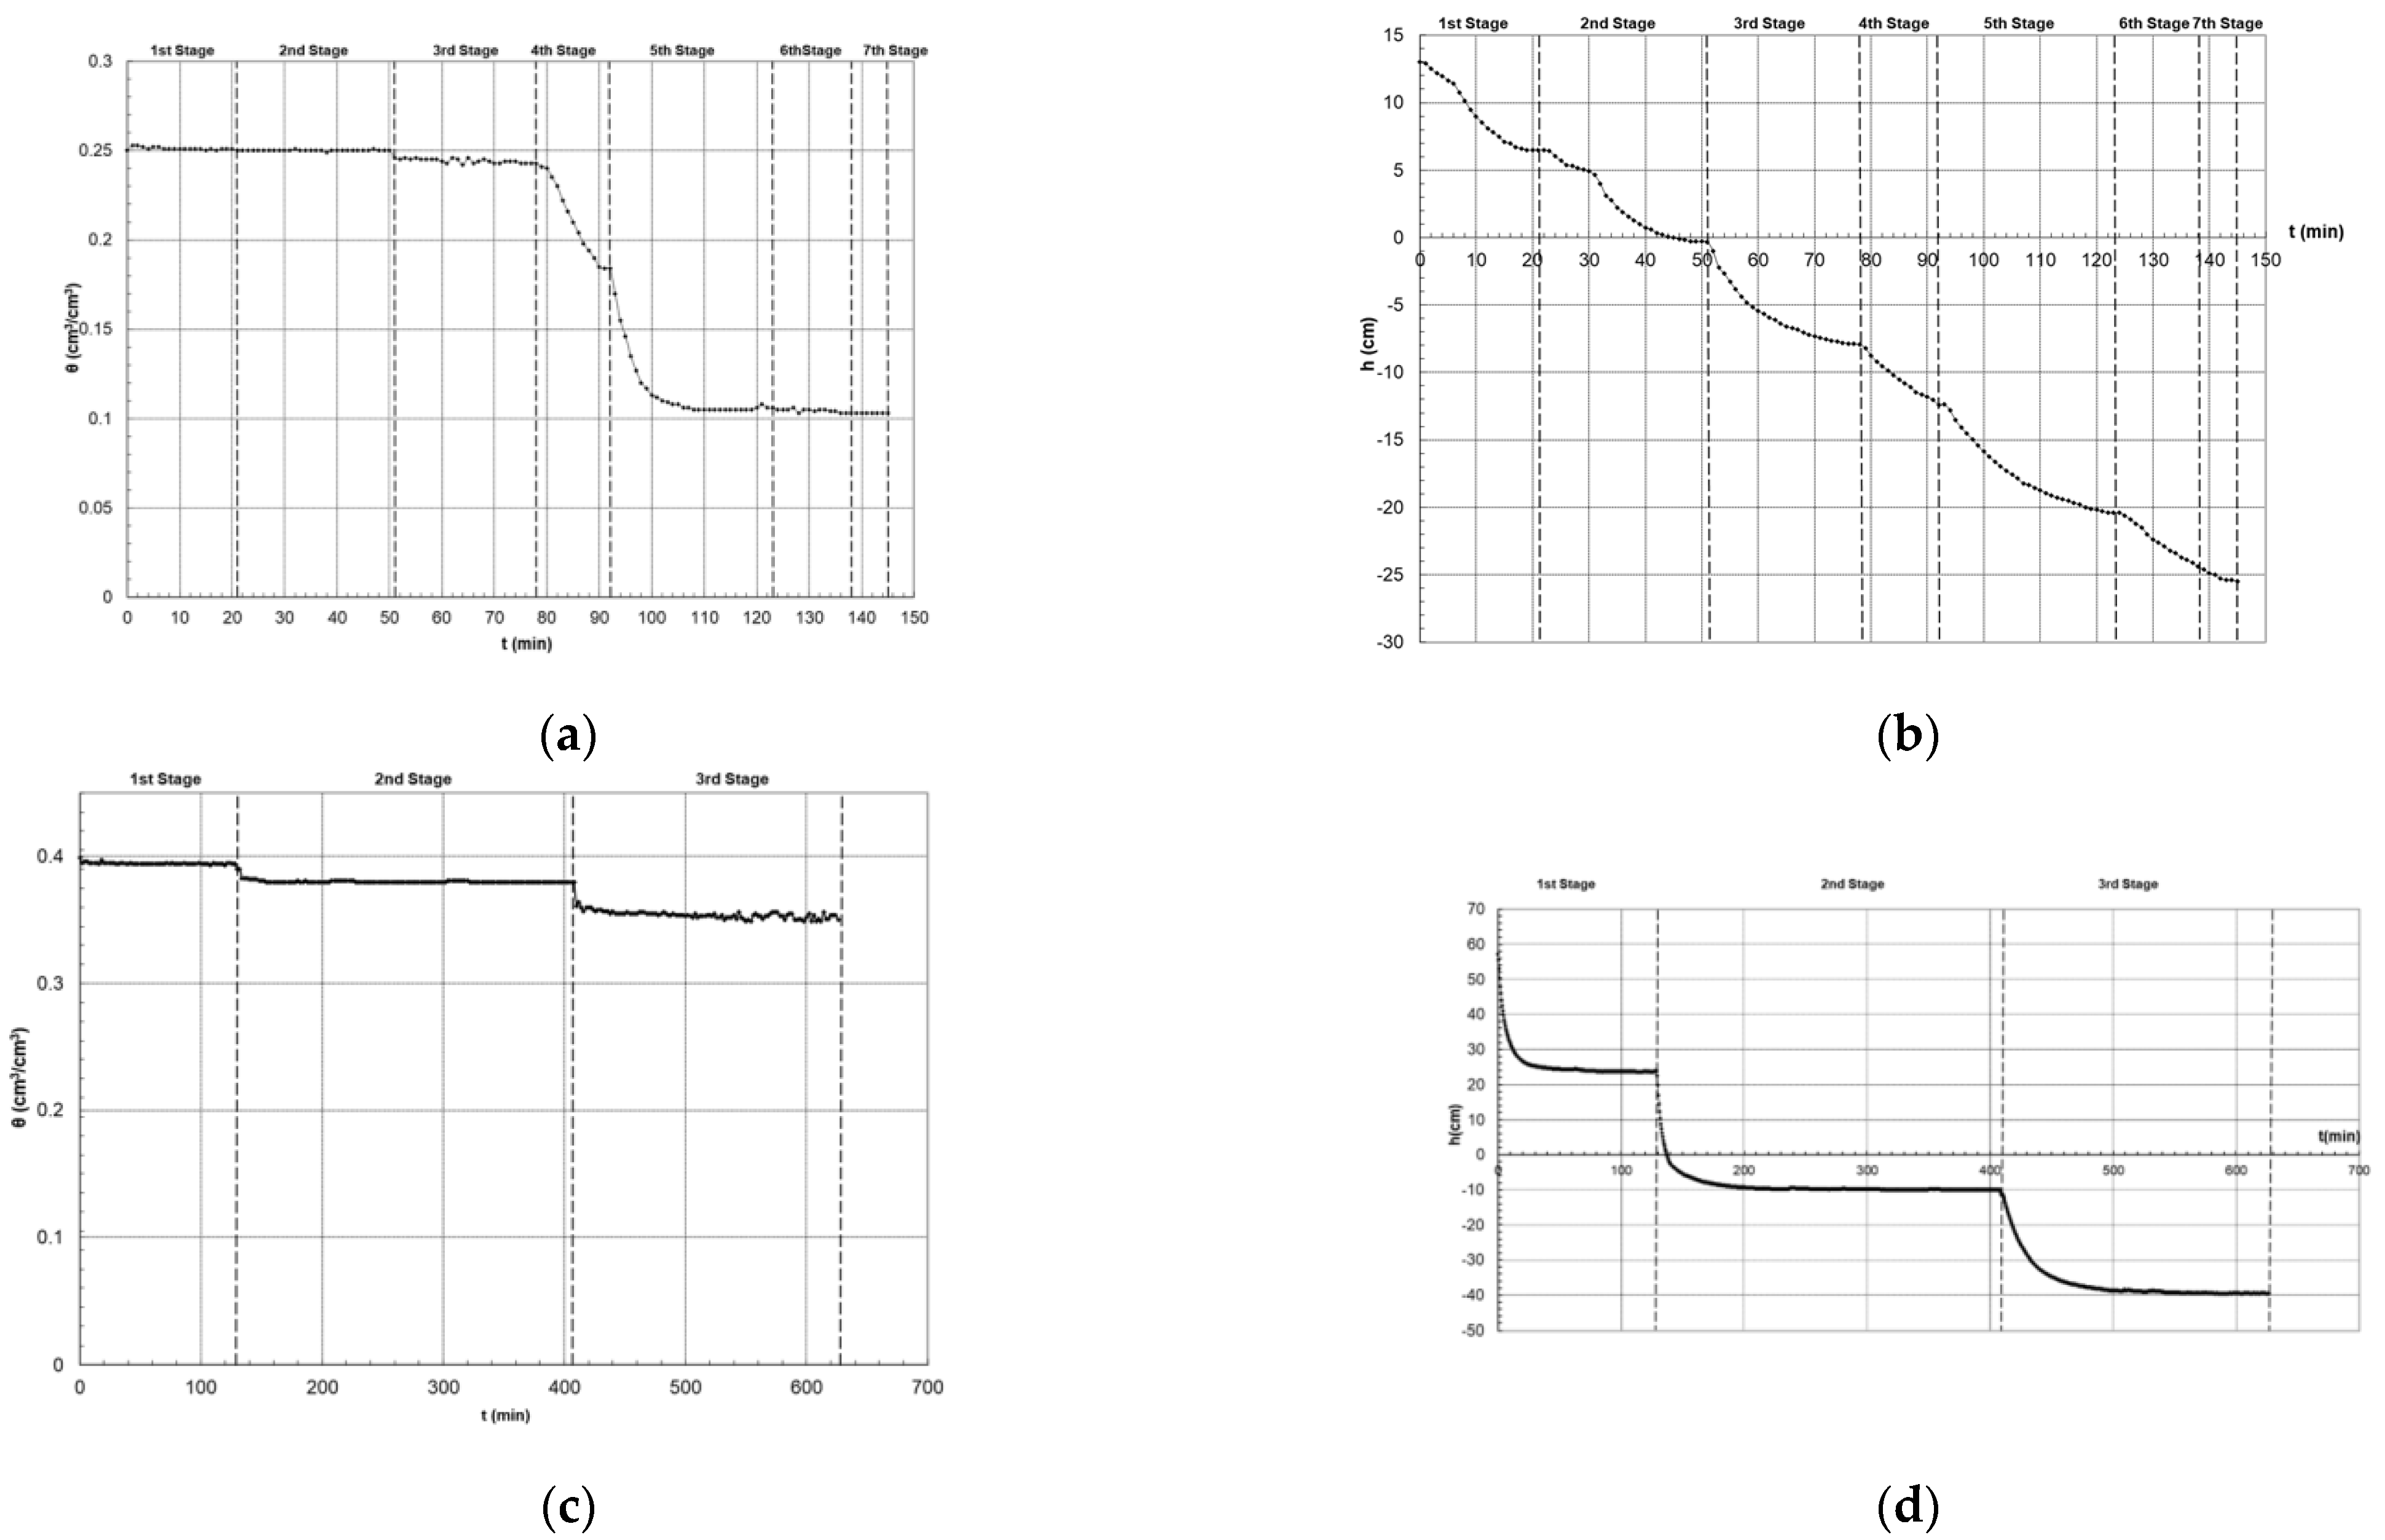
The second drainage of the soil column occurred in six stages, as below:
  • First stage: +6 cm, Δt1 = (21–0) min = 21 min.
  • Second stage: 0 cm, Δt2 = (51–21) min = 30 min.
  • Third stage: −8 cm, Δt3 = (78–51) min = 27 min.
  • Fourth stage: −12.5 cm, Δt4 = (92–78) min = 14 min.
  • Fifth stage: −20 cm, Δt5 = (123–92) min = 31 min.
  • Sixth stage: −25 cm, Δt6 = (138–123) min = 15 min.
The soil moisture and the soil water tension versus time curves are shown in Figure 4a,b, respectively.

3.6. Second Drainage—Sandy Loam

The second drainage was performed in three stages, as shown below:
  • First stage: + 23 cm, Δt1 = (128–0) min = 128 min.
  • Second stage: −10 cm, Δt2 = (408–128) min = 280 min.
  • Third stage: −40 cm, Δt3 = (626–408) min = 218 m
Using the TDR and the pressure transducer data the soil moisture versus time and the soil water tension vs. time curves were obtained and are shown in Figure 4c,d, respectively.
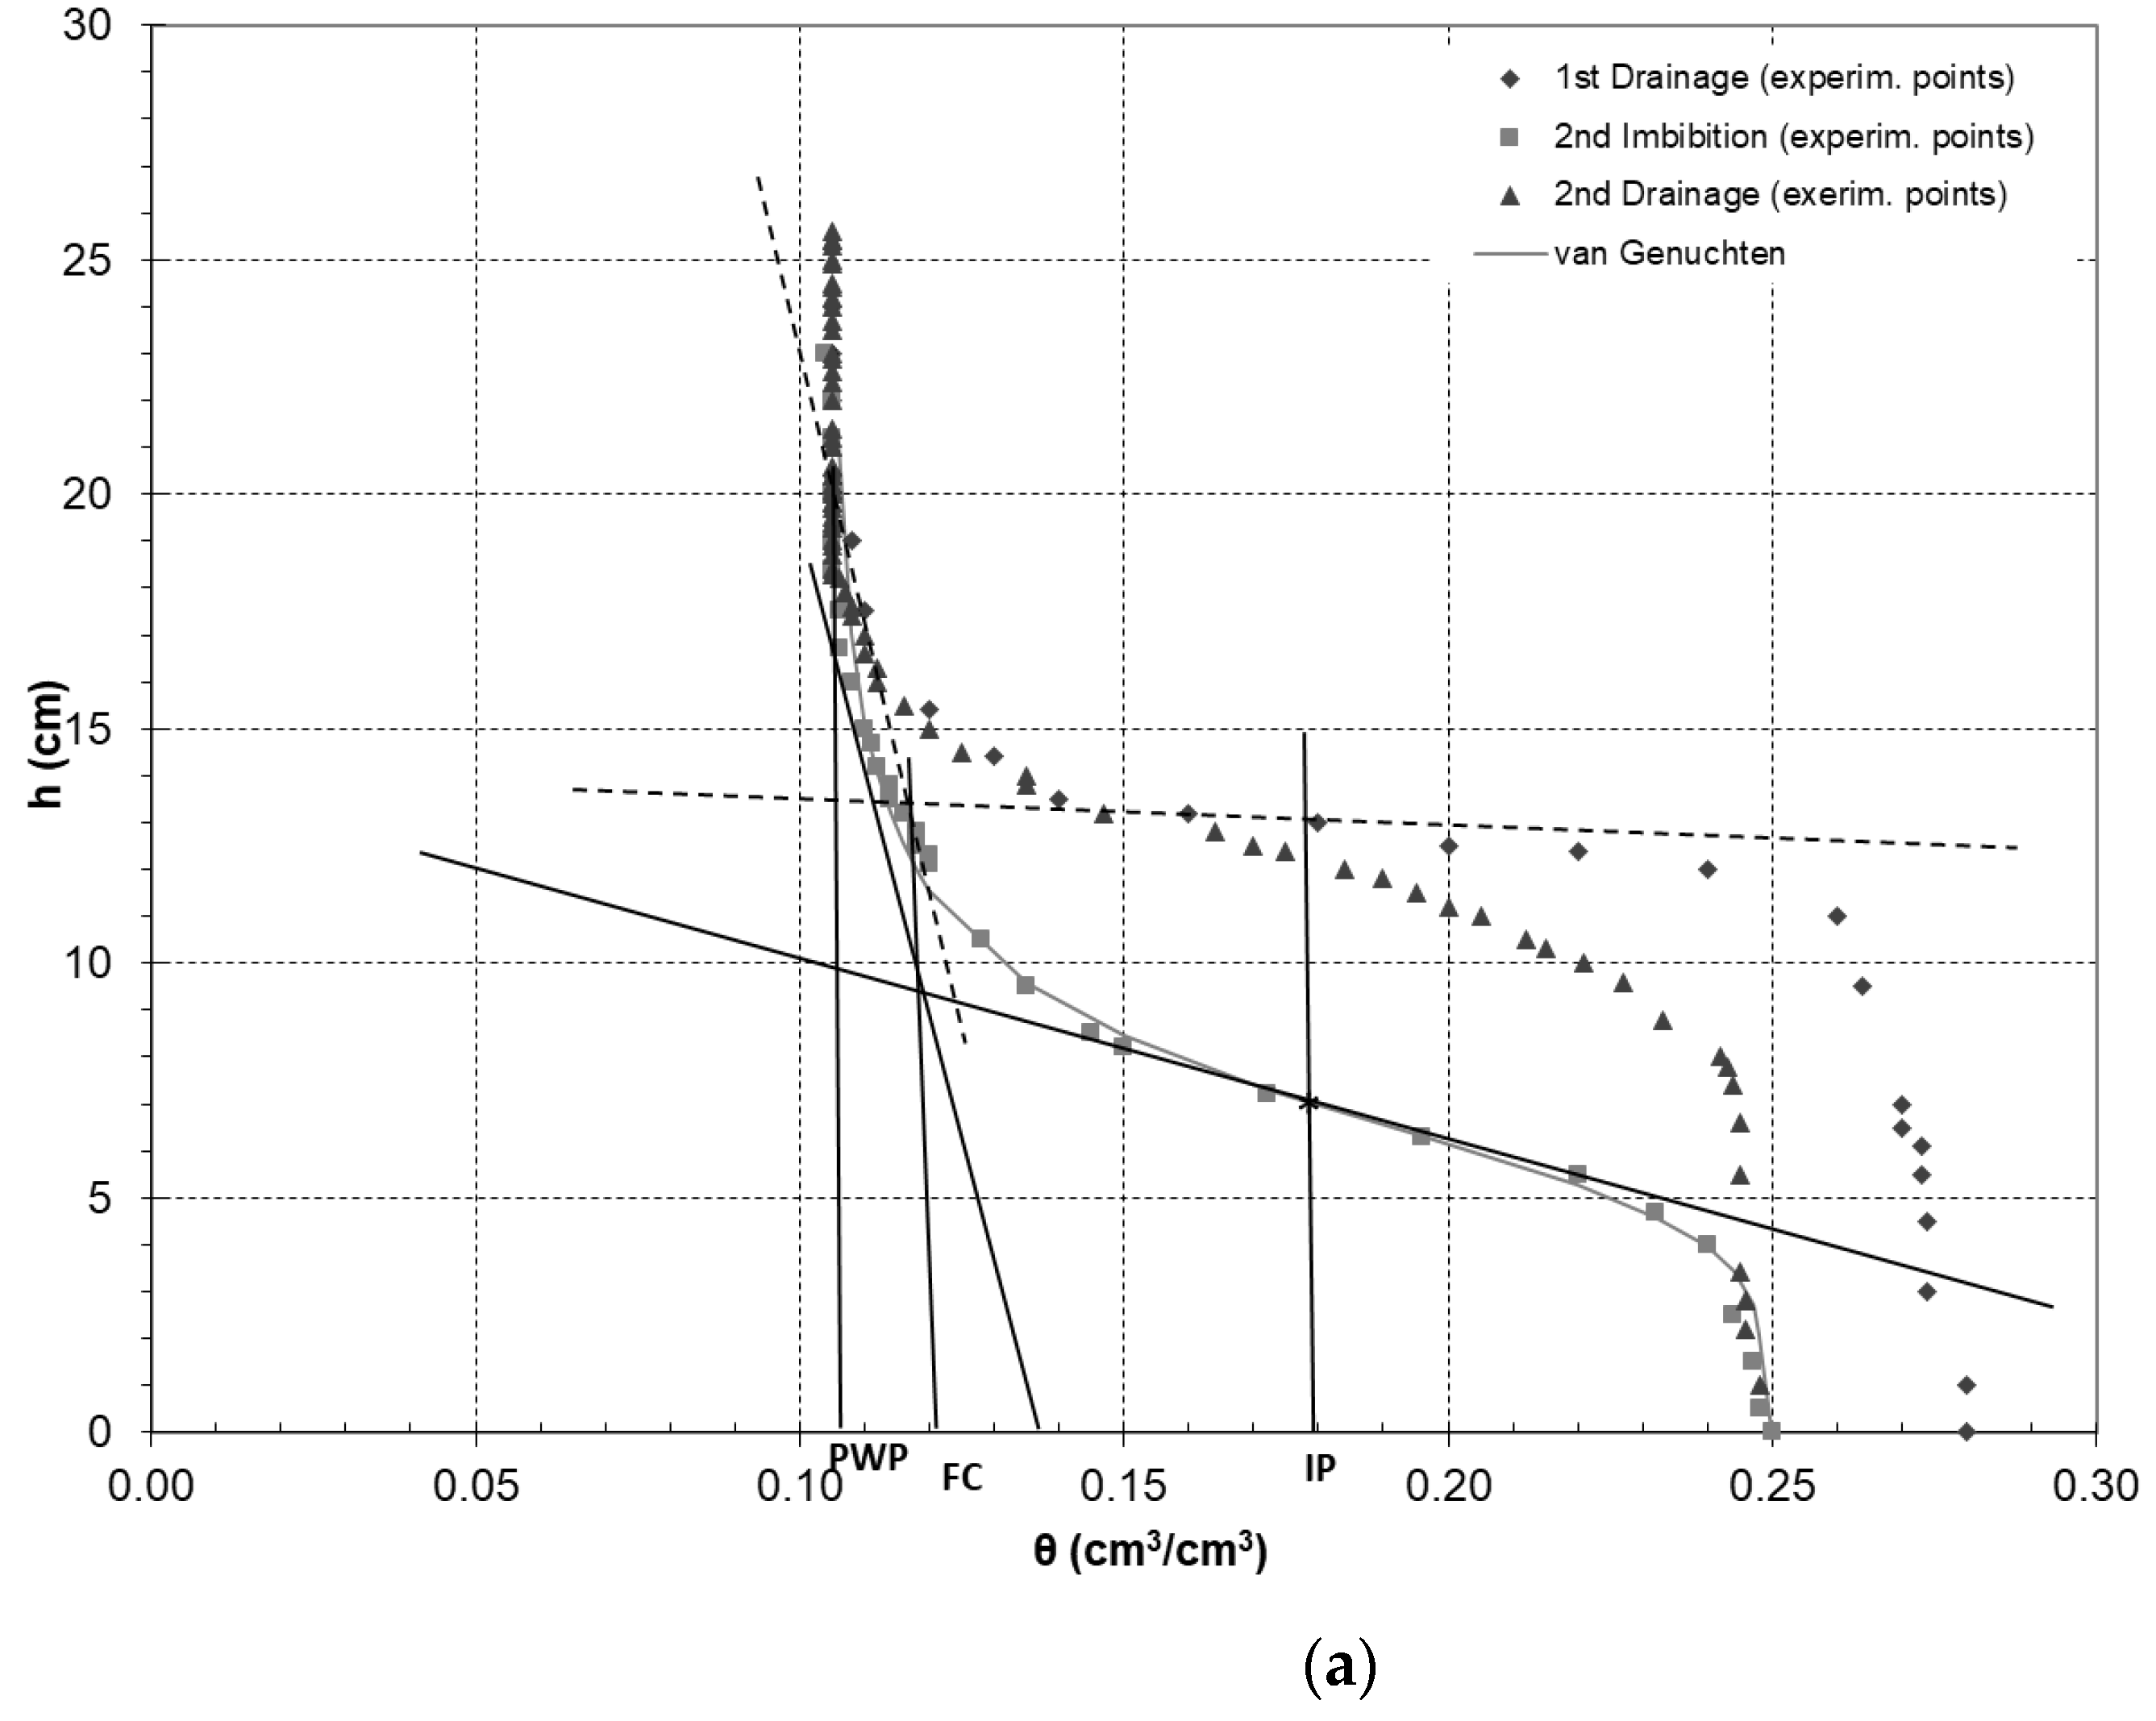
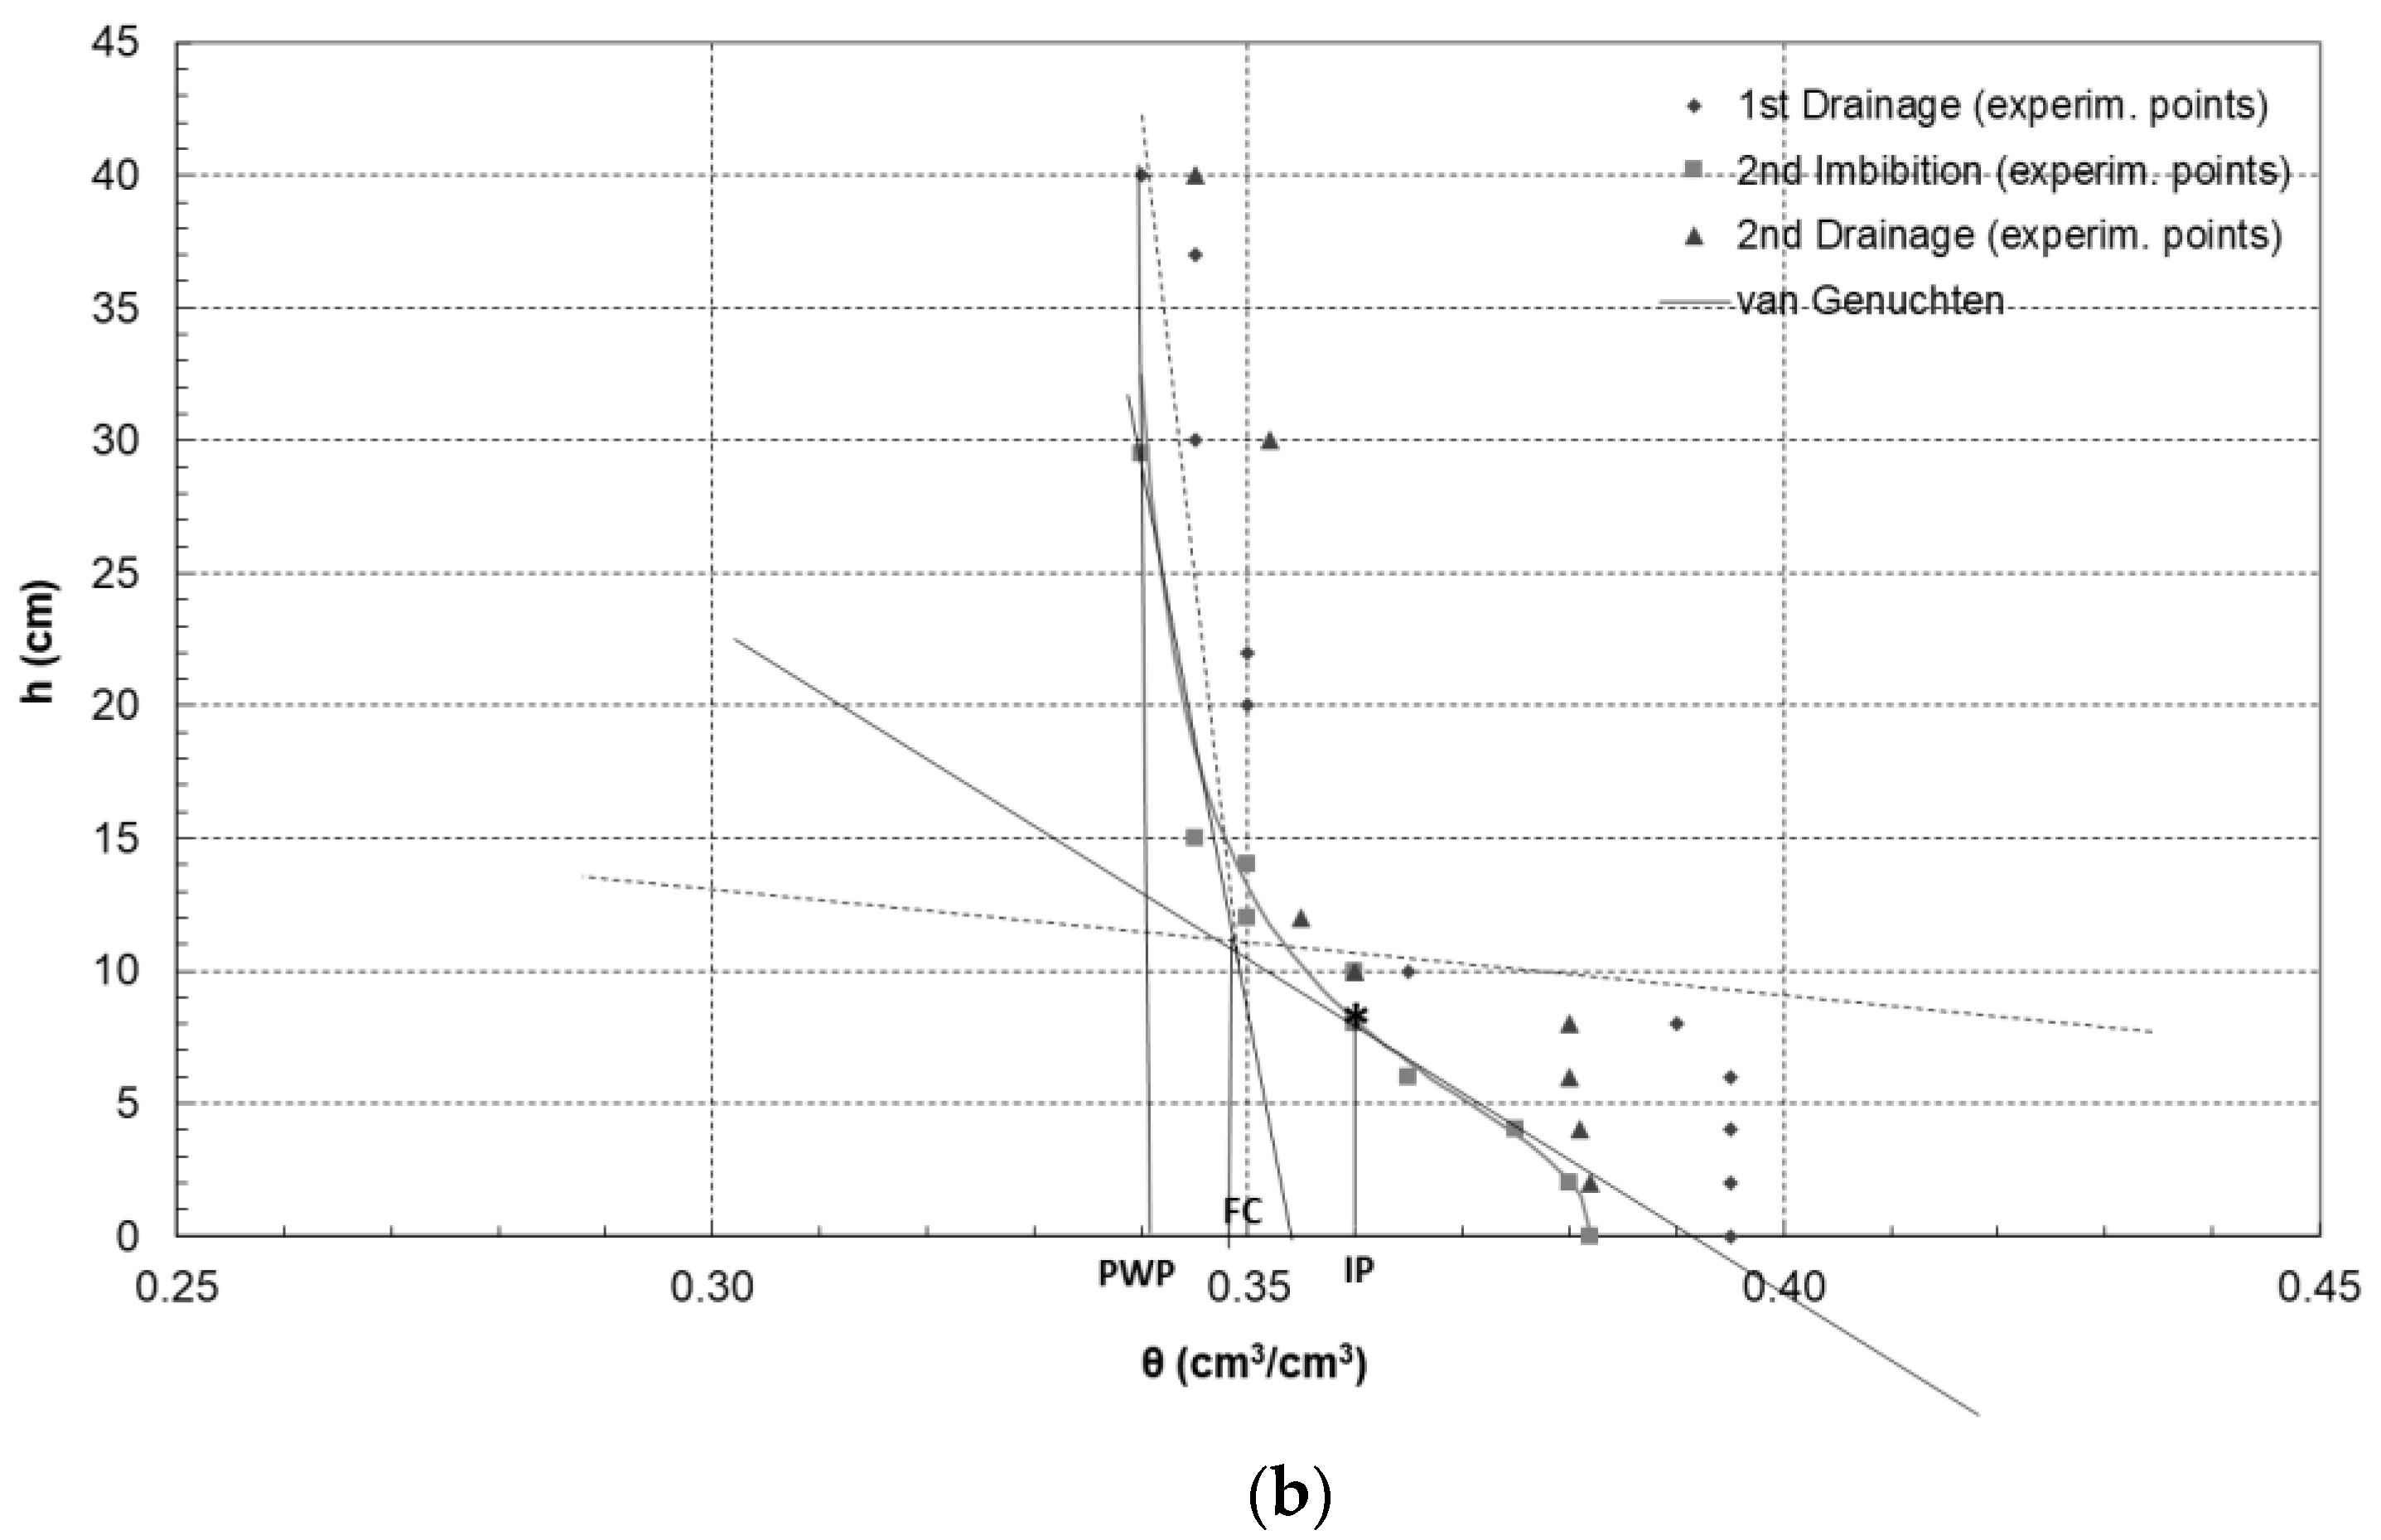
Figure 5 shows the SWCC for both soil samples under investigation, along with the approximation of the experimental points by the van Genuchten model.
Significant soil parameters can be estimated from the SWCC, which in turn can lead to the available soil moisture (ASM) calculation, one of the most useful tools for irrigation planning [43,44]. The algebraic solution demonstrates that the inflection point of SWCC can be found by setting the second derivative of Function (3) equal to zero. The first derivative of Function (3) is given below:
d h d θ = 1 α 1 n θ s θ r θ θ r 1 / m 1 1 n 1 1 m θ s θ r θ θ r 1 m 1 θ s θ r 1 θ θ r 2                                       = 1 α 1 n 1 m θ s θ r θ s θ r θ θ r 1 / m 1 1 n n θ s θ r θ θ r 1 m m 1 θ θ r 2
Supposing that:
F = θ s θ r θ θ r 1 / m 1 1 n n
g = θ s θ r θ θ r 1 m m
k = 1 θ θ r 2
the second derivative of Function (3) is:
d 2 h d θ 2 = 1 α 1 n 1 m θ s θ r d F d θ g k + F d g d θ k + F g d k d θ
where:
d F d θ = 1 n n θ s θ r θ θ r 1 n n 1 1 m θ s θ r θ θ r 1 m 1 θ s θ r 1 θ θ r 2                                                 = 1 n n 1 m θ s θ r θ θ r 1 2 n n θ s θ r θ θ r 1 m m θ s θ r 1 θ θ r 2
d g d θ = 1 m m θ s θ r θ θ r 1 m m 1 θ s θ r 1 θ θ r 2 =                   1 m m θ s θ r θ s θ r θ θ r 1 2 m m 1 θ θ r 2
d k d θ = 1 θ θ r 4 2 θ θ r = 2 θ θ r 3
Therefore, considering Functions (10)–(12), Function (9) becomes:
d 2 h d θ 2 = 1 α 1 n 1 m θ s θ r { 1 n n 1 m θ s θ r θ θ r 1 2 n n θ s θ r θ θ r 1 m m θ s θ r 1 θ θ r 2 θ s θ r θ θ r 1 m m 1 θ θ r 2                                                 + θ s θ r θ θ r 1 m 1 1 n n m 1 m θ s θ r θ s θ r θ θ r 1 2 m m 1 θ θ r 2 1 θ θ r 2                                                 + θ s θ r θ θ r 1 m 1 1 n n θ s θ r θ θ r 1 m m 2 1 θ θ r 3 }
Thus, finally the second derivative of dh/dθ becomes:
d 2 h d θ 2 = 1 α 1 n 1 m θ s θ r { n 1 n 1 m θ s θ r θ θ r 2 n + m 4 n m n m θ s θ r 1 θ θ r 4                                                       + m 1 m θ s θ r θ s θ r θ θ r 1 2 m m 1 θ θ r 4 θ s θ r θ θ r 1 m 1 1 n n                                                       2 θ s θ r θ θ r 1 m m 1 θ θ r 3 θ s θ r θ θ r 1 m 1 1 n n } d 2 h d θ 2                                                       = 1 α n m θ s θ r θ θ r 4 { n 1 n m θ s θ r θ θ r 2 n + m 4 n m n m θ s θ r                                                       + m 1 m θ s θ r θ s θ r θ θ r 1 2 m m θ s θ r θ θ r 1 m 1 1 n n                                                       2 θ θ r θ s θ r θ θ r 1 m m θ s θ r θ θ r 1 m 1 1 n n }
Setting Function (14) equal to zero, soil moisture and the corresponding soil water tension can be found. Additionally, graphical solution demonstrates that PWP is the intersection point of the line tangent to the soil water tension that corresponds to PWP and the x-axis. The straight line that penetrates the SWCC through the inflection point (IP) intersects with the straight line that is tangential to SWCC at the tension of PWP. This intersection point corresponds to FC (abscissa) [45]. The corresponding soil moisture (θIP) at the inflection point of the SWCC can be found using Equation (15) [43,46]:
θ I P = θ s θ r 1 + 1 m m + θ r
The equation of the straight line passing through the inflection point is:
y h θ I P = d h d θ θ = θ I P θ θ I P
The soil physical quality index (S) referring to the slope of SWCC is:
S = n θ s θ r 1 + 1 m ( 1 + m )
Table 2 shows the measured values of PWP and FC in the laboratory and the estimated ones via SWCC, along with the relative mean squared error between the measured and the estimated values, the inflection points and soil physical quality index for both samples.

4. Discussion

In Figure 2a, no significant change of soil moisture is observed for the first two stages. This is because the drain tank was in such a position during both stages that the TDR sensor was constantly in a saturated area. The soil moisture at saturation given by the TDR device was slightly higher than 0.28 and shows a 6% difference from the value of 0.30 measured in the laboratory. During the third stage, where the drain tank was 7 cm below the ceramic capsule and therefore 8 cm below the TDR sensor, soil moisture starts to decrease, showing a slight change from its initial value. During the fourth stage of drainage, no significant change of soil moisture is observed. However, about 82 min after the start of the first drainage, when the fifth stage begins, big change in soil moisture is observed. This occurs mainly in the first 10 min of this stage, when the soil drains quickly. In fact, during the first 2 min of the fifth stage, the slope dθ/dt is big and the curve can be considered straight, almost vertical [47]. The experimental value of soil moisture is stabilized, close to 0.1. The very large change of soil moisture during the fifth stage is due to the quite significant negative load imposed on the soil [10].
In contrast, the changes in soil water tension starts from the very first stage of drainage, as it is a quite more sensitive variable than soil moisture (Figure 2b) [4,5,12,23]. Thus, in 10 min the tension was stabilized and equal to the positive load applied to the ceramic capsule at the certain stage, which was 10 cm. In the second stage, the ceramic capsule was subjected to a positive load equal to 6 cm and so we see that the tension was reduced and, in about 20 min, reached the value of 6 cm. During the first two stages dh/dt had small values. Significant change in soil water tension occurred during the third stage, where a negative load equal to −7 cm was applied. The dh/dt slope was quite large, especially in the first 10 min of this stage, became zero at the end of the stage, where the tension was stabilized at a value of −7 cm. In the fourth stage the pressure gradually decreased, reaching the final value of about −12 cm. In the last stage of the first drainage, where the ceramic capsule was subjected to a negative load of −24 cm, there was a large dh/dt gradient at the beginning of the stage, which, however, was zeroed around 37 min from the beginning of the fifth stage. The zeroing of the dh/dt gradient shows that equilibrium has been reached at this position and therefore the tension is stabilized [4,5,19,23,48]. The final value of the soil water tension was stabilized at −24 cm.
Regarding sandy loam soil, the soil moisture and the soil water tension as functions of time during the three stages of the first drainage are presented in Figure 2c,d, respectively. During the first stage, no significant change in soil moisture was observed. In the second stage, where the drain tank was located 11 cm below the TDR sensor, a decrease in soil was observed and its final stabilization was close to the value of 0.39. The soil was drained more intensely during the third stage because the drainage container was located 42 cm below the soil moisture sensor, applying strong negative load to the soil column. Thus, at the beginning of the stage dθ/dt had big values, and afterwards, near the end of the third stage, dθ/dt tended to zero and the moisture was stabilized at about 0.34.
During the first drainage, a large dh/dt slope was observed at the beginning of each stage due to the abrupt change of the load applied to the ceramic capsule. At the end of each stage, the tensions were stabilized at values that are almost equal to the load applied to the ceramic capsule. Thus, in the first stage the soil water tension was stabilized at a value close to 28 cm, after 160 min, in the second stage after 30 min at a value of about −9 cm, and in the third stage there is a stabilization of the tension close to the value −40 cm, after 80 min.
The soil moisture during the first stage of the second wetting began to stabilize 22 min after the beginning of the stage and the final value of θ was 0.12. Thus, even though the Mariotte bottle was 13 cm below the TDR sensor, it was observed that the sensor detected an increase in soil moisture. This can be explained by the capillary phenomenon, which led to a soil moisture increase, although the external water level was several centimeters lower [4,10,23,25].
In the second stage we see that dθ/dt increases mainly in the first 3 min of the stage and then dθ/dt is equal to zero when the soil moisture is about 0.25. This was of course justified by the fact that, at this stage, the Mariotte bottle was 4 cm above the TDR sensor and therefore moistened the soil considerably at the height where the sensor was located. Stages three and four showed no difference in soil moisture. At the beginning of the third stage θ was increased to a value just over 0.25 in which it remained constant throughout the third and fourth stage. Although in both stages the soil moisture should have reached the value of saturation (which was the reason for the existence of the fourth stage), it remained at a value of about 0.25. This was due to the trapped air in the soil column and in fact the difference 0.28 − 0.25 = 0.03 is equal to the volume of the trapped air [4,48].
The soil water tension showed a significant change from the beginning of the second wetting. This is explained as the tension is directly affected by the load applied (while, contrarily, soil moisture shows strong changes only when a large positive or negative load is applied) [4,5,10,12]. Thus, in the first stage the tension rate is initially big, to become zero about 20 min after the beginning of the stage. Thus, at the end of the first stage, the value at which the pressure was stabilized was about −12 cm, which corresponded to the applied load. In the second stage, the dh/dt slope was even higher at the beginning and after about 15 min from the start of the stage, there was a zero slope, due to stabilization of the tension. The final tension for the second stage was 5 cm. In the third stage the applied load was +10 cm. Initially, for about 7 min changes in tension were observed and then stabilized at a value of 10 cm, which coincided with the value of the applied load. Finally, in the fourth stage there was observed a small change as expected, and while the applied load was +13 cm, the final constant value of the soil water tension was about 13 cm.
Regarding the sandy loam soil sample, the second wetting was carried out in three stages, placing the Mariotte bottle at the positions of −14 cm, +20 cm, and +58 cm from the ceramic capsule. During the first stage, no significant differences in soil moisture were observed, until the last minutes of the stage, where soil moisture was increased, but dθ/dt remained quite low. The small increase in soil moisture during the last minutes of the first stage occurred due to the capillary action [4,10,12,23]. In the second stage soil moisture was increased and stabilized slowly at a value of about 0.38. Finally, in the third stage, a small but steady increase in soil moisture was observed, but the final value of θ did not reach the value of moisture at saturation. The trapped air in the soil was the reason for not reaching the value of θs. As already mentioned, the difference between the final water content in the soil column and value of the soil moisture at saturation is equal to the volume of the trapped air [4,5,48]. Thus, the volume of the trapped air is 0.02.
The soil water tension during the first stage of the second wetting was increased and reached the value −14 cm, after 60 min. In the second stage, where the applied load was +20 cm, dh/dt reached great values at the beginning of the stage and then, after 60 min, the gradient was zeroed and therefore the tension was stabilized at 20 cm. Finally, in the third stage an even greater dh/dt was observed, which after about 50 min was tended to zero. The final value of the soil water tension at this stage was about 58 cm.
The first stage was carried out with an applied load equal to +6 cm in the ceramic capsule and therefore + 5 cm at the point where the TDR sensor was located. That means that, at the level of the TDR sensor, the soil was still saturated, so no changes in soil moisture have been observed. In the second stage, the applied load was 0 cm (from the ceramic capsule) and therefore the drainage container was located just 1 cm below the TDR sensor. This small difference did not lead to significant changes of θ. In the third stage the soil moisture was reduced and stabilized at a value of 0.24, while the drainage tank was 9 cm below the TDR sensor. During the fourth stage of the second drainage, the container was placed 13.5 cm below the soil moisture sensor, which led to a reduction in the soil moisture, while the dθ/dt gradient became zero after 10 min from the beginning of the stage and the final constant θ value for this stage was just over 0.18. In the fifth stage—where the drain tank was placed 21 cm below the TDR sensor—there was initially observed a large gradient at the experimental curve. The soil was drained strongly at this stage and up to about 15 min after the beginning of the stage, the soil moisture was stabilized just above the value of 0.10. Then, even stronger negative loads were applied to the soil column, but the soil did not drain further, and the soil moisture value remained constantly close to the value of 0.10. At the end of the sixth stage, the continuation of the water in the pipe that connected the experimental column to the drainage vessel was interrupted, which signified the end of the experiment.
Regarding the tensions during the above stages, we have noted the following: In the first stage, where the load in the ceramic capsule was + 6 cm, there was a significant change of h, and later on we observed stabilization at a value of 6 cm. In the second stage the drainage tank was placed exactly at the level of the ceramic capsule and the pressure into the soil pores was reduced and stabilized 30 min later, at a value of 0 cm, as expected. During the third stage the applied load was −8 cm and the dh/dt gradient was higher at the beginning of the stage, while towards the end of the stage the gradient tended to zero and the final tension value was −8 cm. In the fourth stage the load that was applied was −12.5 cm. Water pressure into the soil pores decreased from value −8 cm to value −12.5 cm. Then, a load equal to −20 cm was applied, and the soil water tension was decreased for the first 25 min, until it was stabilized at a value of −20 cm. As mentioned above, step six was added to the drainage process in order to investigate whether the soil could drain further, and it was mainly concerned with soil moisture data. Thus, although the soil did not drain anymore, the tension reduced significantly and the value of the tension at the end of the second drainage was about −25.5 cm.
Generally, with sandy soil, a good drainage has been achieved. It is obvious that the sand, under negative loads, expels a sufficient amount of water content [4,7,12]. Thus, while the soil moisture at saturation indicated values between 0.28 and 0.30, the residual soil moisture at the end of each drainage was about 0.1.
Regarding sandy loam soil, during the first stage of the second drainage the change of soil moisture was almost zero, which can be explained by the fact that that the drainage tank was placed 21 cm above the TDR sensor, so the sensor was almost in a state of saturation. A small but abrupt change in soil moisture was observed at the beginning of the second stage, where θ was stabilized at 0.38. Soil moisture decreased more during the third stage and finally reached a constant value of about 0.35.
The tension showed a significant change at the beginning of the phenomenon and stabilized at a value of 23 cm, 30 min later, which coincided with the applied load to the ceramic capsule. The dh/dt gradient showed great values at the beginning of the second stage and tended to zero after about 50 min, where the final value of the tension was about −10 cm. Finally, during the third stage of the second drainage there was initially observed a reduction in soil water tension, but after 90 min the tension was stabilized at a value of −40 cm.
During the experimental procedure of the sandy loam soil sample, no intense drainage was observed, a fact that is justified by the soil texture. Although strong negative loads were applied to the soil, the soil retained most of its moisture and θ(t) curves did not show an exceptional range of values. In particular, the minimum water content after the stronger negative load was only about 0.35, which means that the soil released only 6% moisture of the 41% moisture that the soil had in saturation. The adhesive forces are therefore observed to be high at the specific soil type, which leads to poor drainage [4,5,12,23,49].
As for the soil moisture profiles, there was quite fast movement of the moisture profile in the sandy soil, while sandy loam showed slow movement.
During the wetting and drainage circles, the moisture differences were greater in the sandy soil, and quite small in the sandy loam, which was a more cohesive soil type. On the contrary, the changes of soil water tensions were almost the same in both soils and their final values were equal to the externally applied loads.
The sandy soil characteristic curves are wide and clear because the hysteresis loop is large and the hysteresis effect is intense [49,50]. The sandy loam presents a smaller hysteresis loop due to the structure of the certain soil type, which is more synectic [23,27,50,51,52]. Regarding the trapped air, in the sandy soil the volume of trapped air was 0.03, while in the sandy loam it was 0.02.
According to the results of Table 2, estimation of FC shows very good approximation of the measured values of both soil samples. As FC refers to water holding capacity (or water retention capacity) it is the amount of water content that is held in the soil after drainage, the duration of which, after a rain or irrigation, depends on the soil type [43,46]. When irrigation or rain is applied to the surface of the soil, the soil pores are filled with water, but after the gravitational drainage, the large soil pores are filled with both air and water, while the smaller pores are still full of water. At this stage, the soil is said to be at field capacity. At FC, the water and air contents of the soil are considered to be ideal for crop growth [53,54,55]. The permanent wilting point refers to the soil moisture that means, essentially, no water is available to the plant. At this stage, there is some water content in the soil, but it is impossible for the plant to extract it by its roots. Thus, at this point, if no additional water is added to the soil, the condition is irreversible and causes death to the plant. Hence, with irrigation planning and rational and sustainable irrigation water management, we never put the plant in a state of such stress, even in cases of deficit irrigation [54,56] while irrigation levels constitute a percentage of FC [57,58,59] and the ideal soil moisture for the plant is FC [60,61,62,63]. The results of the current study show that SWCC can lead to precise estimation of the FC of both soil samples but overestimates the values of PWP, so it is suggested the usage of alternative methods for the estimation of PWP, such as the pressure plate extractor. A possible reason for the overestimation of PWP is that during the presented experiments, no gauge was used, and the soils were drained “naturally” at several stages, under external loads that were applied according to the position of the drainage bottle. As the irrigation practices that are commonly used never end up close to PWP, overestimation of PWP cannot negatively affect plants. Thus, it is suggested that the method can be used in irrigation planning where the irrigation doses, the duration and the frequency of irrigation are relevant to the FC or percentage of the FC. Moreover, it is remarkable that the intersection point that leads to the FC estimation is coincident for both curves (drainage and imbibition). Hence, from the SWCC, the inflection point of the curve and the FC of the soils under research can be estimated with very good approximation to the values that are measured with common methods, such as pressure plate extractor. This makes SWCC a useful tool and gives a new perspective on the usage of SWCC for sustainable water saving.

5. Conclusions

Specific laboratory experimental procedures were used in order to obtain the SWCC of two soil samples with different physical parameters and hydraulic properties. Significant hydraulic parameters, such as inflection point, soil physical quality index, permanent wilting point and field capacity were obtained from the SWCC. Field capacity and permanent wilting point estimated from SWCC were compared to the measured values at the laboratory. The results showed that possessing SWCC with the presented experimental method can give very good approximation for irrigation-related hydraulic parameters, as field capacity. On the other hand, the method overestimates the permanent wilting point, but this cannot negatively affect plants, as the estimated value is beyond the measured permanent wilting point, which is never reached during irrigation. Nevertheless, the current method is suggested to be used for full or deficit irrigation planning based on field capacity proportion for the soil types under research and gives a new perspective on the usage of SWCC as a useful tool for sustainable water saving practices.

Author Contributions

Conceptualization, A.A. and I.C.; methodology, A.A. and I.C.; software, A.A.; validation, A.A, V.B. and I.C.; formal analysis, A.A.; investigation, A.A and I.C.; resources, A.A., V.B. and I.C.; data curation, A.A, V.B. and I.C.; writing—original draft preparation, A.A.; writing—review and editing, A.A., V.B.; visualization, A.A and V.B.; supervision, A.A.; project administration, A.A. All authors have read and agreed to the published version of the manuscript.

Funding

This research received no external funding.

Institutional Review Board Statement

Not applicable.

Informed Consent Statement

Not applicable.

Data Availability Statement

Data available on request due to restrictions, e.g., privacy or ethical. The data presented in this study are available on request from the corresponding author. The data are not publicly available due to privacy and copyright reasons.

Conflicts of Interest

The authors declare no conflict of interest.

References

  1. Ren, X.; Kang, J.; Ren, J.; Chen, X.; Zhang, M. A method for estimating soil water characteristic curve with limited experimental data. Geoderma 2020, 360, 114013. [Google Scholar] [CrossRef]
  2. Chai, J.; Khaimook, P. Prediction of soil-water characteristic curves using basic soil properties. Transp. Geotech. 2020, 22, 100295. [Google Scholar] [CrossRef]
  3. Fredlund, D.G.; Sheng, D.; Zhao, J. Estimation of soil suction from the soil-water characteristic curve. Can. Geotech. J. 2011, 86, 338–344. [Google Scholar] [CrossRef]
  4. Brooks, A.T.; Corey, A.T. Hydraulic Properties of Porous Media; Hydrology Papers; Colorado State University: Fort Collins, CO, USA, 1964. [Google Scholar]
  5. Gaudet, J.P. Transferts d’eau et de soluté dans les sols non-saturés: Mesures et simulation. Ph.D. Thesis, Universite Scientifique et Médicale de Grenoble, Grenoble, France, 1978; p. 350. [Google Scholar]
  6. van Genuchten, R. Calculating the unsaturated hydraulic conductivity with a new closed form analytical model. Water Res. Prog. Res. Rep. 1978, 78, 8–63. [Google Scholar]
  7. van Genuchten, R. A closed form equation for predicting the hydraulic conductivity of unsaturated soils. Soil Sci. Soc. Am. J. 1980, 44, 862–898. [Google Scholar] [CrossRef] [Green Version]
  8. Mualem, Y. A new model for predicting the hydraulic conductivity of unsaturated porous media. Water Resour. Res. 1976, 12, 513–522. [Google Scholar] [CrossRef] [Green Version]
  9. Havercamp, R. Résolution de L’équation de l’Infiltration de l’Eau dans le Sol: Approches Analytiques et Numériques. 1983. Available online: https://theses.hal.science/tel-00688101 (accessed on 20 March 2023).
  10. Angelaki, A.; Sakellariou-Makrantonaki, M.; Tzimopoulos, C. Laboratory experiments and estimation of cumulative infiltration and sorptivity. Water Air Soil Pollut. Focus 2004, 4, 241–251. [Google Scholar] [CrossRef]
  11. Sakellariou-Makrantonaki, M.; Angelaki, A.; Evangelides, C.; Bota, V.; Tsianou, E.; Floros, N. Experimental determination of Hydraulic Conductivity at unsaturated soil column. Procedia Eng. 2016, 162, 83–90. [Google Scholar] [CrossRef] [Green Version]
  12. Eyo, E.U.; Ng’ambi, S.; Abbey, S.J. An overview of soil–water characteristic curves of stabilised soils and their influential factors. J. King Saud Univ.-Eng. Sci. 2022, 34, 31–45. [Google Scholar] [CrossRef]
  13. Li, X.; Hu, C.; Li, F.; Gao, H. Determining soil water characteristic curve of lime treated loess using multiscale structure fractal characteristic. Sci. Rep. 2020, 10, 21569. [Google Scholar] [CrossRef]
  14. Ket, P.; Oeurng, C.; Degré, A. Estimating Soil Water Retention Curve by Inverse Modelling from Combination of In Situ Dynamic Soil Water Content and Soil Potential Data. Soil Syst. 2018, 2, 55. [Google Scholar] [CrossRef] [Green Version]
  15. Sihag, P.; Angelaki, A.; Chaplot, B. Estimation of the recharging rate of ground water using Random Forest Technique. Appl. Water Sci. 2020, 10, 1–11. [Google Scholar] [CrossRef]
  16. Kumar, S.; Sekhar, M.; Reddy, D.V.; Mohan Kumar, M.S. Estimation of Soil Hydraulic Properties and Their Uncer-tainty: Comparison between Laboratory and Field Experiment. Hydrol. Process. 2010, 24, 3426–3435. [Google Scholar] [CrossRef]
  17. Suzaki, A.; Minato, S.; Ghose, R. SEG Technical Program Expanded Abstracts; Society of Exploration Geophysicists: Houston, TX, USA, 2019; pp. 2798–2802. [Google Scholar]
  18. Jiang, C.; Zhang, H.; Wang, X.; Feng, Y.; Labzovskii, L. Challenging the land degradation in China’s Loess Plateau: Benefits, limitations, sustainability, and adaptive strategies of soil and water conservation. Ecol. Eng. 2019, 127, 135–150. [Google Scholar] [CrossRef]
  19. Xu, X.; Jian, W.; Wu, N.; Xu, X. Experimental study on the SWCC transition zone features of unsaturated soil. Indian Geotech. J. 2019, 50, 348–358. [Google Scholar] [CrossRef]
  20. Rao, S.M.; Rekapalli, M. Identifying the dominant mode of moisture transport during drying of unsaturated soils. Sci. Rep. 2020, 10, 4322. [Google Scholar] [CrossRef] [Green Version]
  21. Fuentes, C.; Zavala, M.; Saucedo, H. Relationship between the storage coefficient and the soil-water retention curve in subsurface agricultural drainage systems: Water table drawdown. J. Irrig. Drain. Eng. 2009, 135, 279–285. [Google Scholar] [CrossRef]
  22. Patil, N.; Rajput, G. Evaluation of water retention functions and computer program “Rosetta” in predicting soil water characteristics of seasonally impounded shrink-swell soils. J. Irrig. Drain. Eng. 2009, 135, 286–294. [Google Scholar] [CrossRef]
  23. Angelaki, A.; Sakellariou-Makrantonaki, M.; Tzimopoulos, C. Theoretical and Experimental Research of Cumulative Infiltration. Transp. Porous Media 2013, 100, 247–257. [Google Scholar] [CrossRef]
  24. Zhai, Q.; Rahardjo, H.; Quanti, F. Cation of Uncertainties in Soil—Water Characteristic Curve Associated with Fitting Parameters. Eng. Geol. 2013, 163, 144–152. [Google Scholar] [CrossRef] [Green Version]
  25. Zhai, Q.; Rahardjo, H.; Satyanaga, A.; Dai, G.; Zhuang, Y. Framework to estimate the soil-water characteristic curve for soils with different void ratios. Bull. Eng. Geol. Environ. 2020, 79, 4399–4409. [Google Scholar] [CrossRef]
  26. Liang, X.; Liakos, V.; Wendroth, O.; Vellidis, G. Scheduling irrigation using an approach based on the van Genuchten model. Agric. Water Manag. 2016, 176, 170–179. [Google Scholar] [CrossRef] [Green Version]
  27. Abdallah, A. Prediction of the Soil Water Retention Curve from Basic Geotechnical Parameters by Machine Learning Techniques. In Information Technology in Geo-Engineering, Proceedings of the 3rd International Conference (ICITG), Guimarães, Portugal, 29 September–2 October 2019; Springer International Publishing: Berlin/Heidelberg, Germany, 2020; pp. 382–392. [Google Scholar]
  28. Amanabadi, S.; Vazirinia, M.; Vereecken, H.; Vakilian, K.A.; Mohammadi, M.H. Comparative Study of Statistical, Numerical and Machine Learning-based Pedotransfer Functions of Water Retention Curve with Particle Size Distribution Data. Eurasian Soil Sci. 2019, 52, 1555–1571. [Google Scholar] [CrossRef]
  29. Lamorski, K.; Šimůnek, J.; Sławiński, C.; Lamorska, J. An estimation of the main wetting branch of the soil water retention curve based on its main drying branch using the machine learning method. Water Resour. Res. 2017, 53, 1539–1552. [Google Scholar] [CrossRef] [Green Version]
  30. Achieng, K.O. Modelling of soil moisture retention curve using machine learning techniques: Artificial and deep neural networks vs support vector regression models. Comput. Geosci. 2019, 133, 104320. [Google Scholar]
  31. Yaseen, Z.; Sihag, P.; Yusuf, B.; Al-Janabi, A. Modelling infiltration rates in permeable stormwater channels using soft computing techniques. Irrig. Drain. 2021, 70, 117–130. [Google Scholar] [CrossRef]
  32. Batsilas, I.; Angelaki, A.; Chalkidis, I. Hydrodynamics of the Vadose Zone of a Layered Soil Column. Water 2023, 15, 221. [Google Scholar] [CrossRef]
  33. Wang, S.; Fan, W.; Zhu, Y.; Zhang, J. The effects of fitting parameters in best fit equations in determination of soil-water characteristic curve and estimation of hydraulic conductivity function. Rhizosphere 2021, 17, 100291. [Google Scholar] [CrossRef]
  34. Jabro, J.D.; Stevens, W.B. Soil-water characteristic curves and their estimated hydraulic parameters in no-tilled and conventionally tilled soils. Soil Tillage Res. 2022, 219, 105342. [Google Scholar] [CrossRef]
  35. Jabro, J.D.; Stevens, W.B.; Iversen, W.M.; Allen, B.L.; Sainju, U.M. Irrigation scheduling based on wireless sensors output and soil-water characteristic curve in two soils. Sensors 2020, 20, 1336. [Google Scholar] [CrossRef] [Green Version]
  36. Ghanbarian, B.; Skaggs, T.H. Soil water retention curve inflection point: Insight into soil structure from percolation theory. Soil Sci. Soc. Am. J. 2022, 86, 338–344. [Google Scholar] [CrossRef]
  37. Ranaivomanana, H.; Das, G.; Razakamanantsoa, A. Modeling of Hysteretic Behavior of Soil–Water Retention Curves Using an Original Pore Network Model. Transp. Porous Media 2022, 142, 559–584. [Google Scholar] [CrossRef]
  38. Zhang, F.; Zhao, C.; Lourenço, S.D.; Dong, S.; Jiang, Y. Factors affecting the soil–water retention curve of Chinese loess. Bull. Eng. Geol. Environ. 2021, 80, 717–729. [Google Scholar] [CrossRef]
  39. Nikooee, E.; Mirghafari, R.; Habibagahi, G.; Khorassani, A.G.; Nouri, A.M. Determination of soil-water retention curve: An artificial intelligence-based approach. In E3S Web of Conferences; EDP Sciences: Les Ulis, France, 2020; Volume 195, p. 02010. [Google Scholar]
  40. Yang, S.; Zheng, P.Q.; Yu, Y.T.; Zhang, J. Probabilistic analysis of soil-water characteristic curve based on machine learning algorithms. In IOP Conference Series: Earth and Environmental Science; IOP Publishing: Bristol, UK, 2021; Volume 861, p. 062030. [Google Scholar]
  41. Baumann, P.; Lee, J.; Behrens, T.; Biswas, A.; Six, J.; McLachlan, G.; Viscarra Rossel, R.A. Modelling soil water retention and water-holding capacity with visible–near-infrared spectra and machine learning. Eur. J. Soil Sci. 2022, 73, e13220. [Google Scholar] [CrossRef]
  42. Li, Y.; Vanapalli, S.K. Prediction of soil-water characteristic curves using two artificial intelligence (AI) models and AI aid design method for sands. Can. Geotech. J. 2022, 59, 129–143. [Google Scholar] [CrossRef]
  43. Vizitiu, O.P.; Calciu, I.; Pănoiu, I.; Simota, C. Soil physical quality as quantified by S index and hydro-physical indicies of some soils from Arges hydrographic basin Research. Res. J. Agric. Sci. 2011, 43, 249–256. [Google Scholar]
  44. Nolet, C.; Poortinga, A.; Roosje, P.; Bartholomeus, H.; Ruessink, G. Measuring and Modeling the Effect of Surface Moisture on the Spectral Reflectanceof Coastal Beach Sand. PLoS ONE 2014, 9, e112151. [Google Scholar] [CrossRef]
  45. Dexter, A.R.; Bird, N.R.A. Methods for predicting the optimum and the range of soil water contents for tillage based on the water retention curve. Soil Tillage Res. 2001, 57, 203–212. [Google Scholar] [CrossRef]
  46. Dexter, A.R. Soil physical quality: Part I. Theory, effects of soil texture, density and organic matter, and ef-fects on root growth. Geoderma 2004, 120, 201–214. [Google Scholar] [CrossRef]
  47. Richards, L.A. Capillary conduction of liquids through porous medium. Physics 1931, 1, 318–333. [Google Scholar] [CrossRef]
  48. Angelaki, A.; Sihag, P.; Sakellariou-Makrantonaki, M.; Tzimopoulos, C. The effect of sorptivity on cumulative Infiltration. Water Sci. Technol. Water Supply 2021, 21, 606–614. [Google Scholar] [CrossRef]
  49. Fullhart, A.T.; Kelleners, T.J.; Chandler, D.G.; McNamara, J.P.; Seyfried, M.S. Water Flow Modeling with Dry Bulk Density Optimization to Determine Hydraulic Properties in Mountain Soils. Soil Sci. Soc. Am. J. 2018, 82, 31–44. [Google Scholar] [CrossRef]
  50. Capparelli, G.; Spolverino, G. An Empirical Approach for Modeling Hysteresis Behavior of Pyroclastic Soils. Hydrology 2020, 7, 14. [Google Scholar] [CrossRef] [Green Version]
  51. Tao, G.L.; Zhang, J.R.; Zhuang, S.X.; Yang, L. Influence of compression deformation on the soil-water charac-teristic curve and its simplified representation method. J. Hydraul. Eng. 2014, 45, 1239–1246. [Google Scholar]
  52. Tao, G.; Li, Z.; Liu, L.; Chen, Y.; Gu, K. Effects of Contact Angle on the Hysteresis Effect of Soil-Water Characteristic Curves during Dry-Wet Cycles. Adv. Civ. Eng. 2021, 2021, 6683859. [Google Scholar] [CrossRef]
  53. Marković, M.; Filipović, V.; Legović, T.; Josipović, M.; Tadić, V. Evaluation of different soil water potential by field capacity threshold in combination with a triggered irrigation module. Soil Water Res. 2015, 10, 164–171. [Google Scholar] [CrossRef] [Green Version]
  54. Rai, R.K.; Vijay P, S.; Upadhyay, A. Soil Analysis, Planning and Evaluation of Irrigation Projects; Academic Press: Cambridge, MA, USA, 2017; Chapter 17; pp. 505–523. [Google Scholar]
  55. Lemos-Paião, A.P.; Lopes, S.; de Pinho, M. Analytical Study for Different Extremal State Solutions of an Irrigation Optimal Control Problem with Field Capacity Modes. Int. J. Appl. Comput. Math 2022, 8, 67. [Google Scholar] [CrossRef]
  56. Hohenegger, C.; Stevens, B. The role of the permanent wilting point in controlling the spatial distribution of precipitation. Proc. Natl. Acad. Sci. USA 2018, 115, 5692–5697. [Google Scholar] [CrossRef] [Green Version]
  57. Kang, S.; Shi, W.; Zhang, J. An improved water-use efficiency for maize grown under regulated deficit irrigation. Field Crops Res. 2000, 67, 207–214. [Google Scholar] [CrossRef]
  58. Lo, T.H.; Heeren, D.M.; Mateos, L.; Luck, J.D.; Martin, D.L.; Miller, K.A.; Barker, J.B.; Shaver, T.M. Field Characterization of Field Capacity and Root Zone Available Water Capacity for Varia-ble Rate Irrigation. Appl. Eng. Agric. 2017, 33, 559–572. [Google Scholar] [CrossRef] [Green Version]
  59. Evett, S.R.; Stone, K.C.; Schwartz, R.C.; O’Shaughnessy, S.A.; Colaizzi, P.D.; Anderson, S.K.; Anderson, D.J. Resolving discrepancies between laboratory-determined field capacity values and field water content observations: Implications for irrigation management. Irrig. Sci. 2019, 37, 751–759. [Google Scholar] [CrossRef] [Green Version]
  60. Sutton, B.G.; Merit, N. Maintenance of lettuce root zone at field capacity gives best yields with drip irrigation. Sci. Hortic. 1993, 56, 1–11. [Google Scholar] [CrossRef]
  61. Cong, Z.T.; Lü, H.F.; Ni, G.H. A simplified dynamic method for field capacity estimation and its parameter analysis. Water Sci. Eng. 2014, 7, 351–362. [Google Scholar]
  62. de Jong van Lier, Q.; Wendroth, O. Reexamination of the Field Capacity Concept in a Brazilian Oxisol. Soil Sci. Soc. Am. J. 2016, 80, 264–274. [Google Scholar] [CrossRef]
  63. Gómez-Armayones, C.; Kvalbein, A.; Aamlid, T.S.; Knox, J.W. Assessing evidence on the agronomic and environmental impacts of turfgrass irrigation management. J. Agron. Crop Sci. 2018, 204, 333–346. [Google Scholar] [CrossRef] [Green Version]
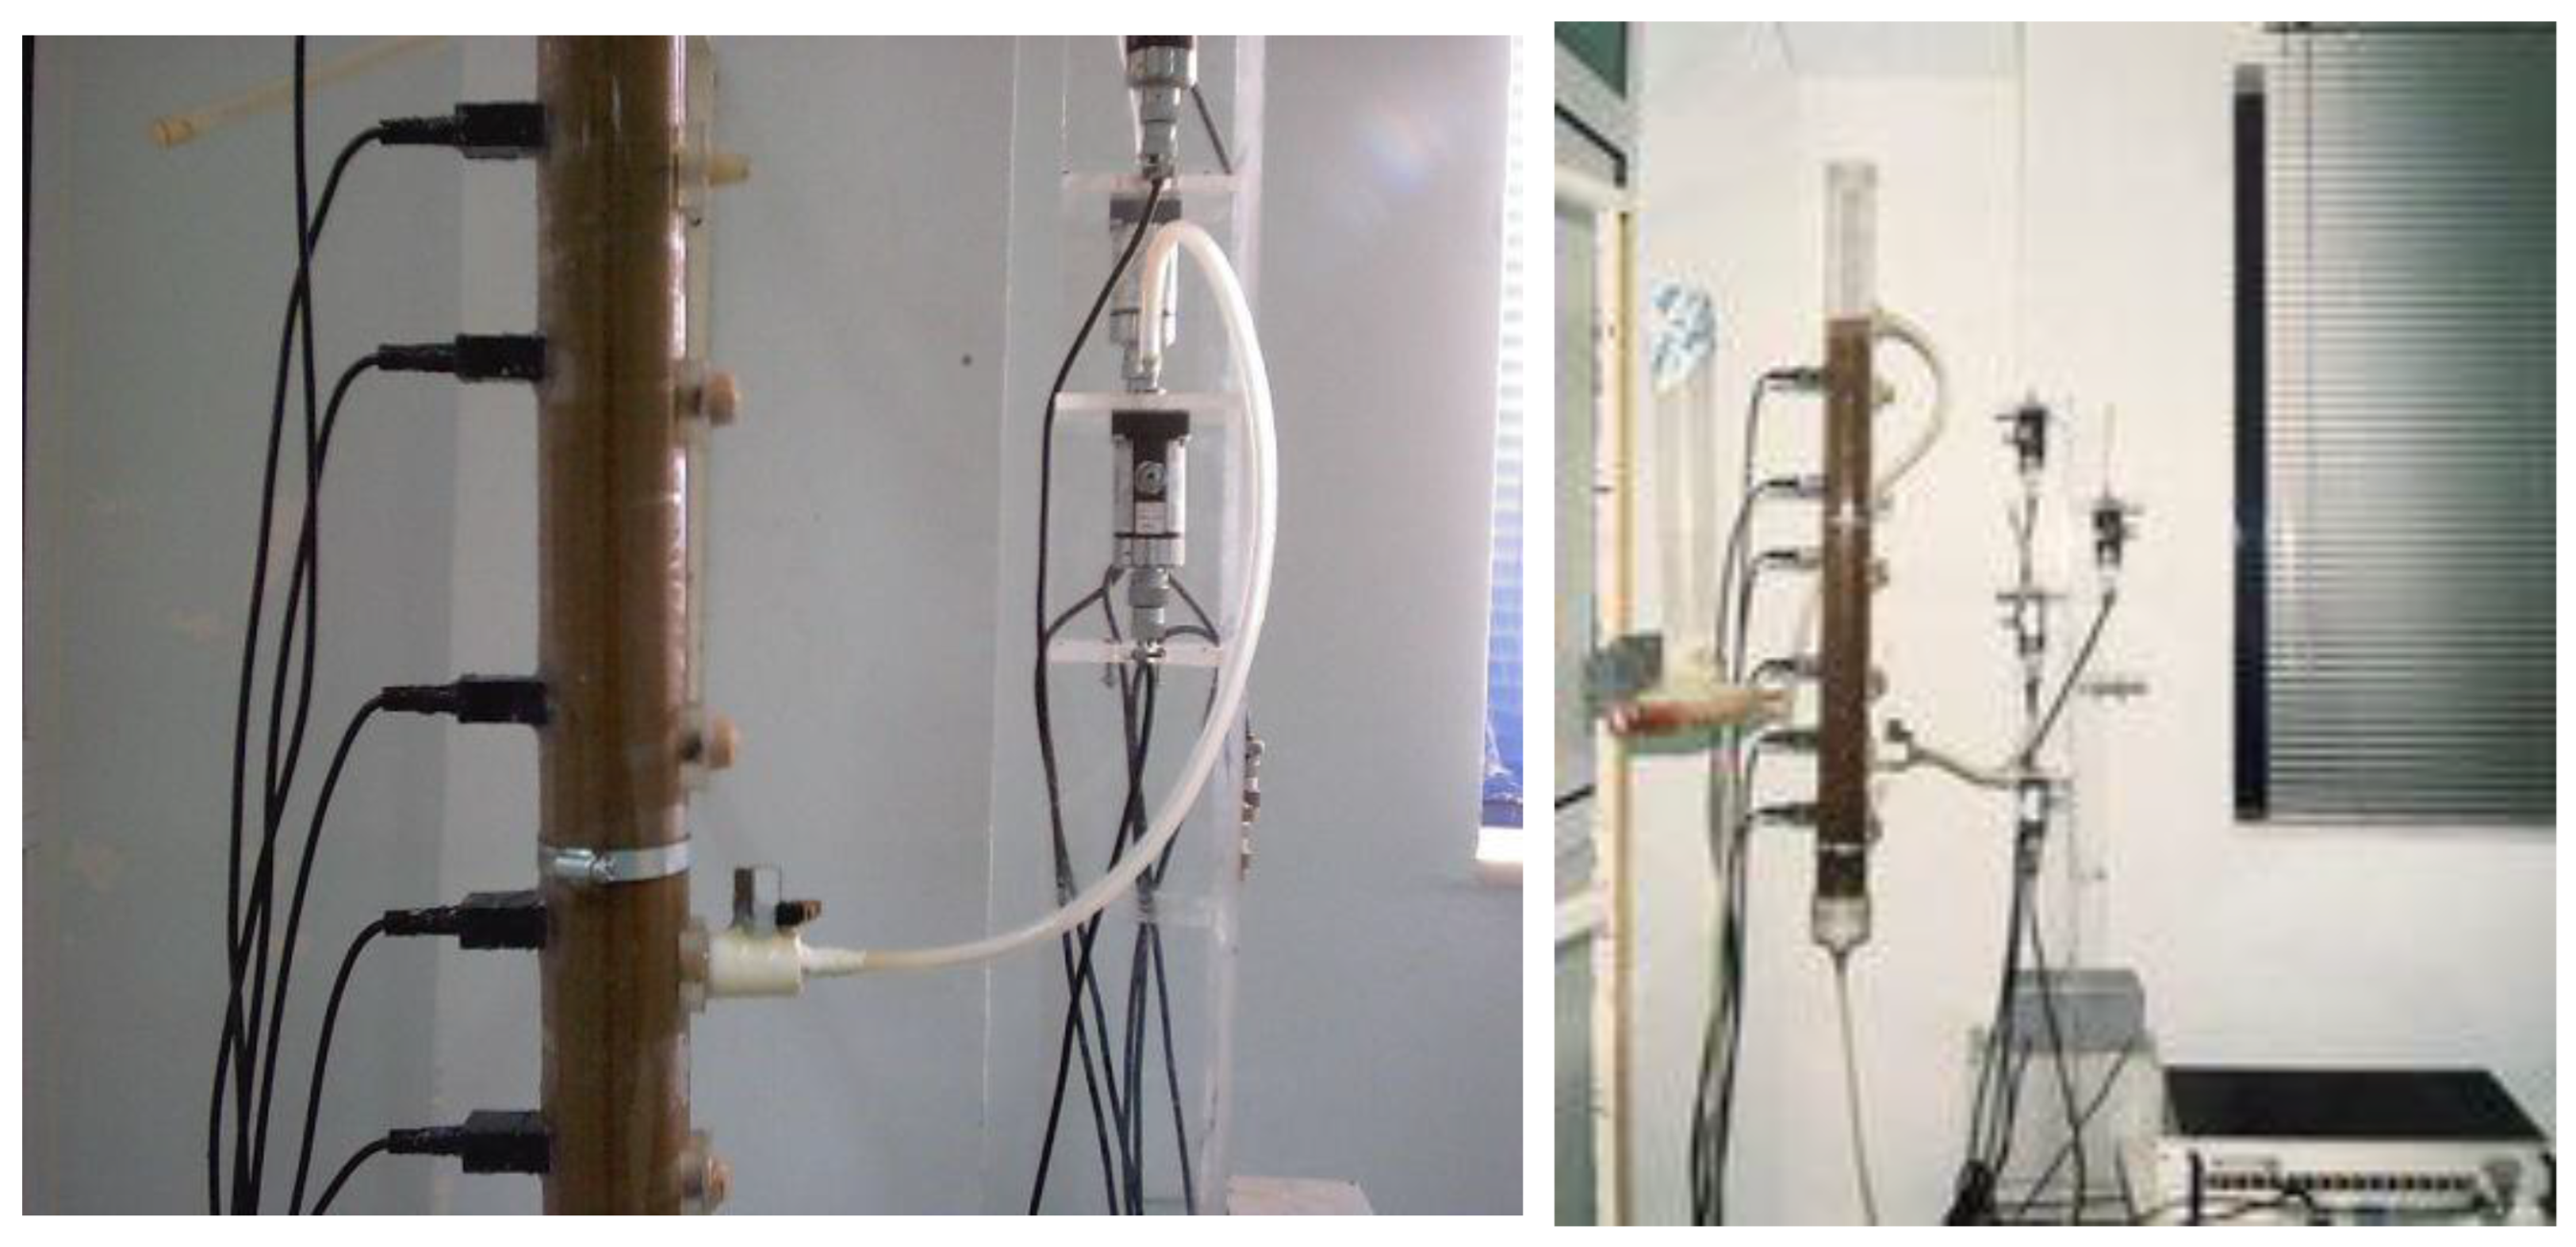
Figure 1. Soil column with TDR sensors and the ceramic capsule connected to the pressure transducer and the data logger.
Sustainability 15 06714 g001
Figure 2. First drainage. (a) Soil moisture vs. time, (b) soil water tension vs. time (sand), (c) soil moisture vs. time, (d) soil water tension vs. time (sandy loam).
Sustainability 15 06714 g002
Figure 3. Second wetting. (a) Soil moisture vs. time, (b) soil water tension vs. time (sand), (c) soil moisture vs. time, (d) soil water tension vs. time (sandy loam).
Sustainability 15 06714 g003
Figure 4. Second drainage. (a) Soil moisture vs. time, (b) soil water tension vs. time (sand), (c) soil moisture vs. time, (d) soil water tension vs. time (sandy loam).
Sustainability 15 06714 g004
Figure 5. SWCC. (a) Sand, (b) sandy loam.
Sustainability 15 06714 g005aSustainability 15 06714 g005b
Table 1. Physical characteristics of the soil samples (n = 3).
Soil Sampleθi (cm3/cm3)θs (cm3/cm3)ρb (g/cm3)
1Sand0.0020.295 1.56
2Sandy loam0.0020.4101.48
Table 2. PWP and FC (measured and estimated values).
Soil SamplePWP (cm3/cm3)
Measured (M)
PWP (cm3/cm3)
Estimated (E)
Relative
Mse
(M-E)
FC
(cm3/cm3)
Measured (M)
FC
(cm3/cm3)
Estimated (E)
Relative
Mse
(M-E)
SθIP
(cm3/cm3)
Sand0.0600.1060.5880.1250.1210.001−0.1640.180
Sandy loam0.2100.3400.3830.3500.3480.000−0.0230.361
Disclaimer/Publisher’s Note: The statements, opinions and data contained in all publications are solely those of the individual author(s) and contributor(s) and not of MDPI and/or the editor(s). MDPI and/or the editor(s) disclaim responsibility for any injury to people or property resulting from any ideas, methods, instructions or products referred to in the content.