Abstract
This study presents the experimental investigations of the thermal conductivity properties of refrigerated packages in an autonomous commercial open refrigerated display cabinet. The study aimed to determine whether the type of packaging can reduce the impact of a malfunctioning refrigeration unit on the product. The characteristics of refrigerated packages are studied during the freezing process on the level of loading and the arrangement of the packages in the display case. For the research, four types of packaging were used: combined, composite, plastic, and pulp. Based on the results obtained, the compliance of the packages with the established/existing requirements was determined during each test. It was found that during the refrigeration process, the permissible temperature norms in the case of individual packages complied with the most commonly used. None of the test packages met the norms during refrigeration by filling the products to the intended limit. As a result, simplified labeling of the respective cooling zones is proposed, and the issue of ensuring the uniformity of the cooling itself remains open. Given the cost of production, it is also proposed to take into account this issue (marking the corresponding cooling zones) when designing similar refrigeration equipment.
1. Introduction
Due to population growth, climate change, and other factors, the sustainable use of food products is becoming more and more important, García-Oliveira et al. [1]. To maintain the quality and safety of perishable food and to reduce food loss and waste, the food industry uses various refrigeration equipment, Stoecker [2]. Temperature is one of the main factors that determines the deterioration of food quality, Kou et al. [3]; Aung and Chang [4]; Rong et al. [5]; Ndraha et al. [6]. The temperature of the packaged food products in the refrigerated display cabinets in the shopping areas changes during the exposure time and directly affects the safety and quality of the food products. Many factors can contribute to this variability, such as the type of display cabinet (vertical, horizontal), the position of the product in the display cabinet, the ambient temperature variations in the shopping centers (day/night, working hours, seasons, air conditioning, etc.), and environmental conditions of the display cabinets, Smale et al. [7]; Laguerre et al. [8].
There are a number of articles in the scientific literature about the different types and structures of packaging, Marsh et al. [9]; Robertson [10]; Vermeiren et al. [11] as well as the different types of printing methods, Bolanča et al. [12]. The mechanical, surface, and optical properties of the packaging and its printing elements have been studied in sufficient detail. The market for refrigeration equipment is not subject to extensive public scrutiny, as most companies represent only their interests and seek to maintain competition, so testing is carried out only indoors. There are no publications in the scientific literature related to defects in the operation of refrigeration equipment that affect the refrigerated product and its packaging. The paper package was examined by Efremov et al. [13] in the freezing mode. Efremov et al. described what should be followed when examining the product packaging in the refrigeration unit, as well as what negative factors affect the product.
The Freezing Theory is given by Pham [14]. He mentioned that understanding the freezing behavior of foods differs from that of water. In terms of the quality of food, the freezing process is still very important in the food industry. Freezing processes used in the food industry were reviewed by George [15]. Frozen food analysis and technologies are presented in the book, edited by Evans [16]. There are various types of displays used. Vertical open refrigerated display cabinets (VORDC) were investigated by Wu et al. [17]. They showed that the temperature distribution of the products in the refrigerated display cabinet was more affected by porosities than their locations. A horizontal freezer for seafood was analyzed by Kolbe and Kramer [18]. Air-blast freezers were investigated by Zheng et al. [19]. They mentioned that food entering the warehouse in the early stage must be placed in an area with poor freezing conditions and food entering in the later stage must be placed in an area with better freezing conditions. Considering horizontal turbulent buoyant jets, open food display cabinets were analyzed by Wu et al. [20]. They show that the goods stacked within the cabinet in a convex shape would improve the heat-insulating performance of the cooling air curtain to keep a steady temperature in the cabinet, as well as cut down the power consumption of the refrigerating unit, but for the concave shape, the results were reversed.
The heat transfer in a display cabinet was investigated by Laguerre et al. [8]. They proposed a heat transfer model to predict the load temperature in an open vertical display cabinet. The effect of operating conditions on the temperature performance of a closed refrigerated display case was analyzed by Chen and Yuan [21]. They showed that thermal entrainment tends to increase with momentum force but decreases when gravitational force dominates. The effect of operating conditions on the temperature performance of a closed refrigerated display cabinet was investigated by Chaomuang et al. [22]. They mention that closed refrigerated display cases should be used to achieve better food preservation. An experimental study of heat transfer and airflow in a refrigerated display cabinet was investigated by Laguerre et al. [23]. They mentioned that ambient air infiltration contributes to the rapid velocity fluctuations in air curtains.
The performance of a refrigerated open-type multi-deck display cabinet with integrated phase change material was investigated experimentally by Alzuwaid et al. [24]. Their test results showed that by installing the phase change material radiators, up to 5% of energy savings and lower cabinet temperatures could be achieved. A simplified heat transfer model of a closed refrigerated display cabinet was investigated by Chaomuang et al. [25]. They showed the applicability of the presented model for studying the effect of air infiltration through the door gaps on the performance of the closed display cabinet in both thermal and energy aspects. A theoretical study of phase change materials in an open refrigerated display cabinet was given by Alzuwaid et al. [26]. They noted that significant energy savings can be achieved through the installation of a phase change material container. The performance of an open refrigerated display cabinet with two air curtains was investigated by Li et al. [27]. It is noted that an open refrigerated display cabinet with two air curtains has better performance characteristics than an open refrigerated display cabinet with one air curtain.
Laguerre et al. [23] studied the influence of operating conditions on heat transfer in a refrigerated display cabinet. The authors proposed a heat transfer model to predict the load temperature in an open vertical display cabinet. Heat transfer by conduction, convection, and radiation were taken into account in the model. Four load positions were considered: top/front, top/rear, bottom/front, and bottom/rear where the product temperatures were significantly different. The model was validated by comparing predicted values with experimental ones. Then it was used to predict the influence of various parameters such as the ambient temperature in the supermarket, the radiation temperature of the surrounding walls, and the internal/ external infiltration rates.
2. Problem Formulation
This paper considers the case of an open refrigerated cabinet when the task of its effective use is set. From this point of view, the geometry of the package (size, shape, etc.), the type of product (yogurt, butter, eggs, etc.), and the expiration date of the package become important. The problem arises when different types of goods are placed in the same storefront. Question: Is the temperature evenly distributed in the refrigerated display cabinet? If not, in terms of the product expiry date, can products be sorted by expiration date and partly by package size, geometry, etc.? After formulating the relevance of the topic, the object of the research, the research goals, and the objectives of the work, a physical experiment is carried out. This study also attempts to make a recommendation for identifying/labeling areas with colder temperatures during vitrine cabinet/display manufacturing. That is, for the seller to place the goods in the display/vitrine cabinet more efficiently by expiration date and, if possible, take into account the geometry of the package. While the research generated in this work is limited to identifying cold distribution in an open cabinet and recommendation, further research will include investigating the causes of uneven cold distribution through numerical simulation.
However, we have not seen studies on the effect of packaging on the product when the ambient temperature changes. This paper investigates different types of packaging and determines which packaging minimizes the negative impact of refrigeration equipment on the product. This study hopes to answer questions related to the use of an open refrigerated display case. The questions that have arisen can be formulated as follows: What effect does the location, size, and quantity of the package have?; which type of packaging is more sensitive to temperature changes? This work also needs to pay attention to whether there are significant temperature differences, which means it is important to evaluate where, what, and how many packages need to be placed in the display case. The bottom line is that if the expiration dates of the products are different, then those packages that have a faster expiration date should be placed in correspondingly colder areas (also pay attention to the recommended storage temperature of the product). Moreover, evaluate the size and type of packaging, because this also has a different cooling effect on the contents of the package.
Although measurements are made physically, we do not exclude that they may not be entirely accurate, since the equipment used is not new. However, we emphasize that the refrigerated display case must be used efficiently, taking into account possible temperature fluctuations and the type of packaging placed in the display case. After the study, it was noted that the amount of data obtained is sufficient to answer the selected substantive questions in this work.
Relevance of the topic. While operating a commercial refrigerated display case in the store, the customer notices that the temperature distribution in the volume of the furniture is uneven. Due to improper refrigeration, product frostbite has been recorded in certain areas of the refrigeration unit. Further work studies are used to determine the effect of the packaging on the refrigerated product, whether the packaging can protect the product from temperature fluctuations due to malfunction of the refrigeration unit, as well as changes in product temperature with showcase operating modes and other variables.
Object of research. The main objects of the research are different types of packaging. The study uses original and uncontaminated packaging of different types.
Research goals and objective. To determine if the product packaging under test may reduce the impact of the malfunctioning refrigeration unit on the product. To determine how the cold conductivity properties of the package change by changing the test conditions, the load level, the refrigeration conditions, and the arrangement of the packages in the refrigerated display case. To Determine which of the packages tested met and did not meet the requirements.
One of the criteria by which packages are divided is their composition. According to this criterion, three groups can be distinguished:
- Simple packaging consisting of one material, for example, glass, plastic, metal, or paper;
- Composite packaging consisting of different materials that can be separated from each other by hand, for example, a paper candy box covered with a scratch-resistant plastic film;
- Combined or multi-layer packaging consisting of different materials that cannot be separated from each other by hand or using simple physical means, for example, a coffee packet, when the packaging is made by melting plastic and metal foil, milk or juice packages made by melting paper, plastic, and foil. Packaging in which the predominant material is paper is also classified as combined. Such packages are very common in households; they are carton packs for juice and milk (Tetra Pak). Compared to other types of combined packaging, these are the easiest to recycle. Cardboard-combined beverage packages are made of layers of paper (about 74%), plastic (about 22%), and aluminum (about 4%) that protect the liquids inside the package. When recycling such packaging, paper can be used to make new cardboard or paper packaging, and plastic can be used to make plastic packaging or products.
It should be noted that the layout of the packages is chosen taking into account the typical general layout of goods observed in stores. The location of items may vary from store to store. Known measuring equipment (sensors) were used for temperature measurement, but it cannot be ruled out that the results may differ if the measuring equipment used is from a different manufacturer or even new.
In this work, a physical experiment was carried out, during which the places of distribution of cold were identified. Since this is not a numerical experiment, the mathematical model is not observed/predictable. This is rather an experiment of an observational nature, which should take into account the identification of the problem of uneven distribution of cooling. Moreover, the paper gives recommendations to both the manufacturer and the seller when placing the goods. In general, the manufacturer is asked to label the appropriate zones in the display case, and the seller to place the goods by temperature and, accordingly, to place goods with a shorter shelf life in colder places, thus ensuring a longer shelf life of products.
3. Description of Experiment
3.1. Used Product Packaging
Different product packages were used for the study, which are presented in Table 1. Each of the product packaging is original and has not been contaminated with the internal product. Different types of packaging were selected for the test, composite and combined materials. Examples of samples used are shown in Figure 1.

Table 1.
Product packaging used in the study.
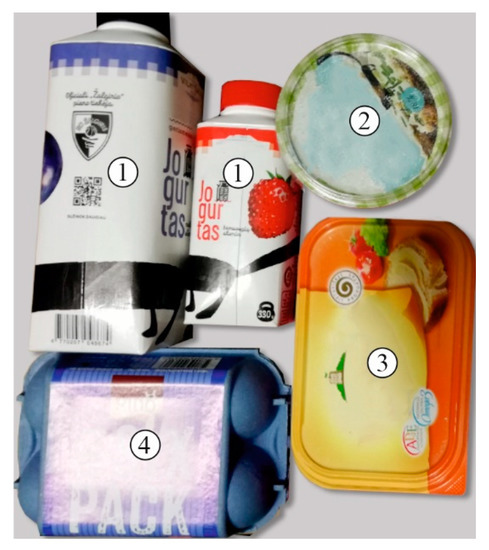
Figure 1.
Examples of packaging used for research: 1—yogurt packaging; 2—a package of cottage cheese spread; 3—margarine package; 4—a package of eggs.
3.2. Description of Refrigerated Showcase
The refrigeration showcase “Ida Compact 700” [28] was used for all tests in this study. It is a small, self-contained, commercial refrigerator designed to encourage impulse purchases in high-traffic areas. Thanks to the transparent sides, this self-service showcase ensures the visibility of products from all sides and easy access to them for convenient shopping. Perfect for displaying beverages, dairy products, and other prepackaged food products, and presenting promotional items. This showcase perfectly meets the requirements for the display and storage conditions of products of various formats, be it a supermarket, a smaller shop, a gas station, or a cafe. A section of the “Ida Compact 700” refrigerated display case is shown in Figure 2.
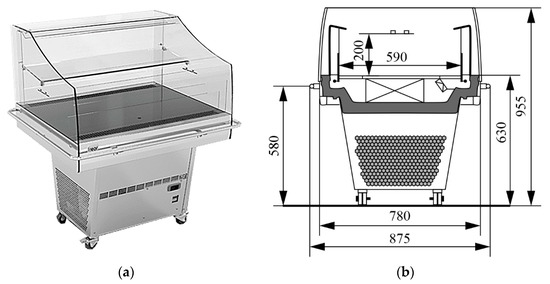
Figure 2.
View of the refrigerated display case “Ida Compact 700” (a) and a sectional view with the main overall dimensions in millimeters (b).
“Ida Compact 700” is a compact self-service counter, suitable for a wide range of display requirements, which can be moved easily and placed in any shopping area to stimulate impulse purchases [28]. Providing 360° visibility, it is great for displaying special promotions or product launches.
Although the display case is designed for promotional items, it operates in 3M1 refrigeration mode. The manufacturer declares that during testing in laboratory conditions, the coldest place for the tested product reaches −1.0 °C, and the warmest is 5.0 °C. This refrigeration unit requires a defrost cycle that takes place four times a day. Other technical data of the refrigerated display cabinet (showcase) are presented in Table 2.
Table 2.
Basic technical data of the “Ida Compact 700” refrigerated display case.
3.3. Product Placement in the Refrigerated Display Case
During the tests with the product packages, the standard ISO 23953-2:2005 [29], and ISO 23953-2:2015 [30] were used. Refrigerated display cabinets—Part 2: Classification, requirements, and test conditions were used. This part of the ISO standard specifies requirements for the construction, characteristics, and performance of refrigerated display cabinets used in the sale and display of foodstuffs. It specifies test conditions and methods for checking that the requirements have been satisfied, as well as the classification of the cabinets, their marking, and the list of their characteristics to be declared by the manufacturer. It does not apply to refrigerated vending machines or cabinets intended for use in catering or similar non-retail applications, nor does it cover the choice of the types of foodstuffs chosen to be displayed in the cabinets [29], ISO 23953-2:2015 [30].
Loading of the refrigerated display case. According to the ISO 23953-2:2005 [29], and ISO 23953-2:2015 [30] standards, rectangular parallelepiped test packages consisting of oxyethyl methylcellulose, water, sodium chloride, and parachlorometacresol are used to fill the refrigerated part of the counter. Such trial packages are called “M packages”. A test “M package” is shown in Figure 3. The counter must be loaded with test packages up to the load limit as shown in Figure 4. These packages must be pre-cooled to the temperature expected during the test. During this research, instead of special packages, authentic product packages were used [29], ISO 23953-2:2015 [30].
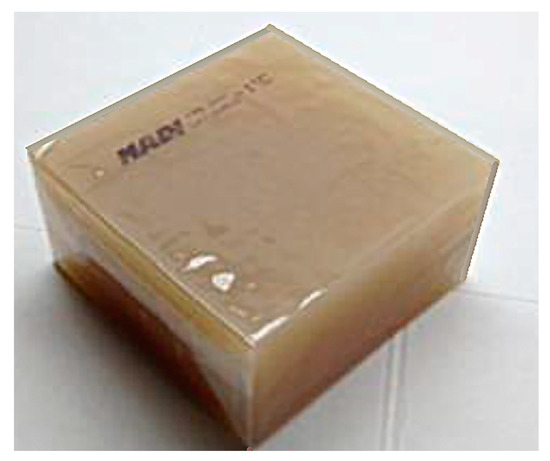
Figure 3.
Trial “M Package”.
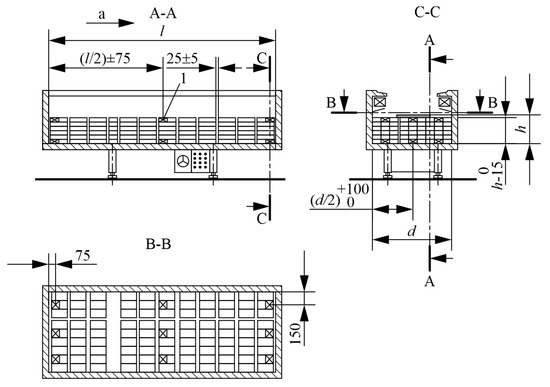
Figure 4.
Arrangement of test packages in the refrigerated display case [30]: l—length of the display case; d—depth of base deck; h—height at load limit; 1—M package (test package); a—air currents parallel to the plane of the opening (in longitudinal direction). Dimensions are in millimeters.
The loading height of the refrigerated shelves must be equal to the height of the set loading limit, with a tolerance of 0 mm to 15 mm. The product loading height of the “Ida Compact 700” showcase is 150 mm. The layout of the research packages is shown in Figure 4.
The stand must be set up and loaded according to the instructions shown in Figure 4 and operated under the conditions of the test room suitable for the climate class for which the stand is intended. After that, the counter must be left in operation for 24 h, during which measurement data must be recorded.
3.4. Preparation of Laboratory Equipment and Packaging for Testing
Before starting the tests, the tested packages must be placed in the refrigerating unit over the entire area of the refrigerating section, based on the ISO 23953-2:2005 [29], and ISO 23953-2:2015 [30] standards. The product packages are placed in three vertical and horizontal rows in the showcase. The packages are filled with glycol liquid at a freezing temperature of −27 °C. Glycol mimics the food product in the packaging during research. Once the packages are placed in the device, they are assigned sensors in the lab with alphanumeric indexes. Sensors are assigned based on the schemes prepared by monitoring, which are shown in Figure 5.
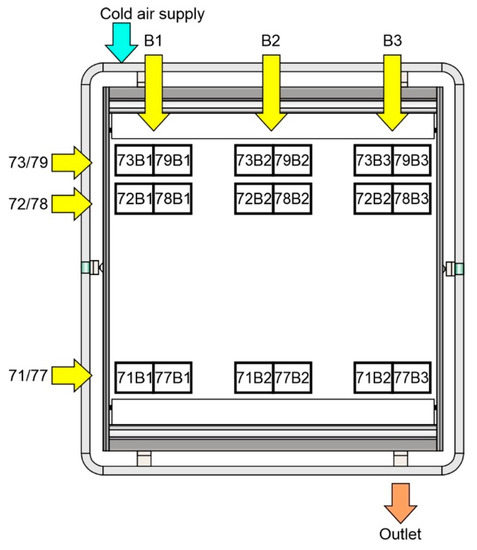
Figure 5.
Graphical arrangement of monitoring sensors in the showcase.
Each product is assigned a temperature sensor with a special marking. During one test, two product packages will be used, therefore, for their simpler marking, all sensors are divided into two groups of sensors:
Sensors of the first package: 71B1-73B1; 71B2-73B2; 71B3-73B3.
Sensors of the second package: 77B1-79B1; 77B2-79B2; 77B3-779B3.
In this research, the letter of the sensor with a numerical index represents the vertical row of the product package, and the number represents the horizontal row.
A sequence of sensors with an alphanumeric index indicates a vertical row:
B1—means that it is the first row when viewed from the top of the furniture;
B2—is the second;
B3—is last and third respectively.
The sensor number indicates the horizontal row of the package:
Numbers 73 and 79—are the first horizontal row at the air outlet;
Numbers 72 and 78—are the second row;
Numbers 71 and 77—are the bottom or otherwise the third row, located near the air intake.
3.5. Preparation of Test of Temperature Variation of Product Packages during Freezing
During the tests, four different types of packaging were studied and it was determined how the temperature inside them changed. During one test two types of packaging were tested. The conditions that are varied in the study are the loading level of the products and the stages of the refrigeration process. The flow of the research process is shown in the diagram in Figure 6.
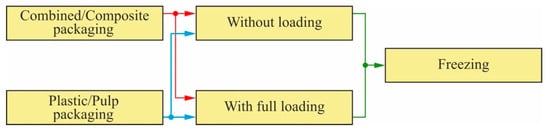
Figure 6.
Test scheme.
These tests use original and unused different product packages, which differ in their manufacturing materials and printing methods. Due to the small area of the refrigerating unit, not all packages can be tested at the same time, so two types of packages are tested.
The first test is performed by placing two different packages over the entire area of the furniture, without loading them with additional products. After placing the packages with product imitation, they are assigned the corresponding sensors described in the previous subsection. The showcase is turned on and the freezing process begins. Readings are recorded with the help of monitoring, and the test takes place for at least 24 h.
During the cooling process, four defrosting cycles occur in 24 h, during which the temperature readings of the air blown and drawn in by the refrigerating device are recorded, as well as the temperature readings of the sensors in the product package. Defrosting of the display case takes place using hot steam technology, the duration of which is 20 min.
At the end of the freezing and thawing tests, the display is stopped. Natural defrosting begins, during which the temperature of the product in the packages is fixed until the temperature in the product package rises to an ambient temperature close to the laboratory. During the entire test, the data is monitored using the laboratory monitoring system and recorded in data tables in the Excel program.
After the first two packages have been tested, the tests are repeated with the remaining untested packages again based on the test flow diagram shown in Figure 6. After completing all the tests, the obtained data is compared. It is then determined how the temperature in different packages changes as various conditions change.
4. Experiment
A brief discussion of the research before the experiment should be given. Studies have been carried out:
- (a)
- The cooling conditions change during the cooling process;
- (b)
- The changes in loading conditions, given without loading and with loading up to a given limit, respectively.
During the test, the temperature of the product was controlled in different packages under different conditions and in different places of the product in the refrigerator. The data was controlled by the PlantVisor program and systematized using the MS Excel program.
Temperature measurements were carried out with combined and composite packages, freezing them, and changing the loading conditions. The first test was carried out after placing the combined and split packages in the refrigeration unit. The packages placed in the showcase were cooled until the temperature of the liquid in them stabilized. The tested packages and their location in the showcase are shown in Figure 7.
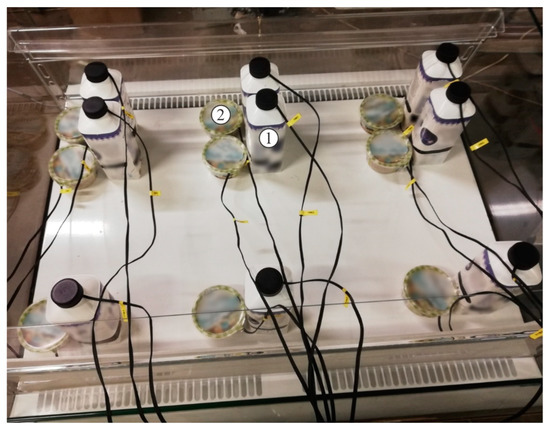
Figure 7.
Investigated composite and combined packages and their placement on the showcase. 1—combined packages; 2—composite packages.
Packages were tested in a refrigerated display case for at least 24 h. The determined intervals of temperature change during cooling in individual sensors (without load) are shown in Figure 8.
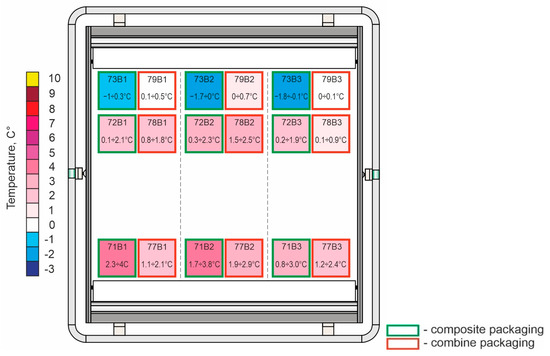
Figure 8.
Intervals of temperature change of composite and combined packaging during cooling without additional loading.
According to the results of the first test without load, the temperature fluctuates in the positive and negative temperature ranges when the same type of package is placed in different places. In the combined package, the temperature was the lowest in the group of 73 sensors (in the packages of the first row), and in the combined packages in the group of 79 sensors (also in the packages of the first row). These packages are located next to the cold air supply. The highest temperature was recorded at the sensors of groups 71 and 77, which are located near the air intake.
The lowest and highest product temperatures were recorded:
In the composite package
- The lowest temperature was recorded by the 73B3 sensor: −1.8 °C. The combined packaging sensor 79B3 was recorded at the same location: 0 °C;
- The 71B1 sensor recorded the highest temperature: 4 °C. The sensor of the Combined Pack, located in the same place is fixed at 2.1 °C.
In the combined package
- The lowest temperature was recorded by the 79B3 sensor: 0 °C. It held on throughout the test. Meanwhile, the 73B3 sensor of the composite package at the same location recorded a temperature of −0.1 °C to −1.8 °C throughout the test;
- The 77B2 sensor recorded the highest temperature: 2.9 °C. The composite packaging sensor in the same place recorded: 3.8 °C.
Based on the data of the graph shown in Figure 9, a distribution of temperature differences between packages was compiled, which is presented in Figure 10. For an objective assessment of the temperature difference, the data was taken after the establishment of frosts.
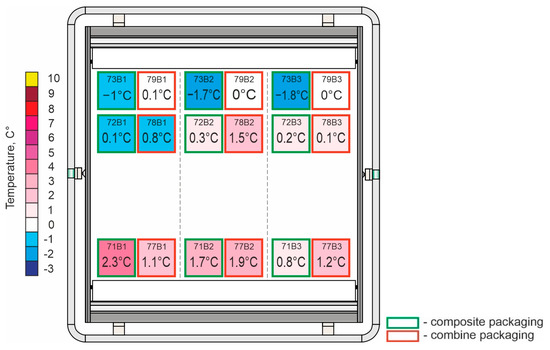
Figure 9.
Composite and combined batch (without load) temperatures depending on the position in the refrigerated display case after cold settling (at a specific point in time).

Figure 10.
The temperature difference between composite and combined packages.
The test showed that the distribution of cold in the refrigerated display case was uneven. The coldest place was on the cold air supply, the warmest was on the air inlet side. Regularity is valid for both tested product packages. Furthermore, from the information presented in the graphs, the temperature of the liquid in the larger combined package was not lower than 0 °C degrees during the entire test.
The test was repeated with the same pair of sales packages, with a change in placement conditions. The product in the showcase was loaded with simulated goods to the load limit, thereby imitating the real working conditions of the showcase in the shopping center with the full placement of goods in the entire volume of furniture. The tested packages and their location in the display case after changing the loading conditions are shown in Figure 11.
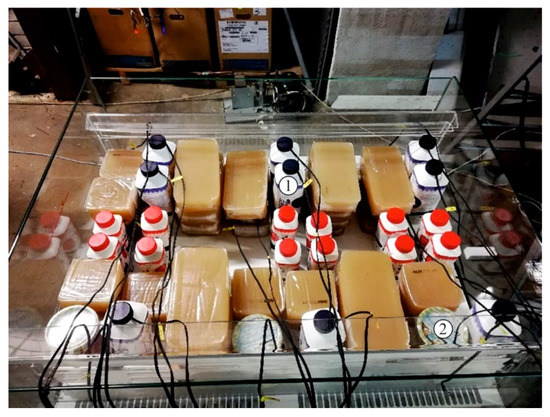
Figure 11.
Studied packages and their placement in the showcase after changing loading conditions. 1—combined packages; 2—composite packages.
During the load test, the pattern observed during the first test was preserved, the coldest place remained on the air injection side, and the warmest was on the air intake side. There was also a significant difference between packages of the same type but placed in different places. The temperature of the product in the combined package in the first vertical row was below <0 °C according to the 79B1/78B1 sensors, the temperature of the combined package in the middle product row of the showcase was below <0 °C only according to the 79B2 sensor, and the sensors in the combined package of the third row recorded a temperature ≥ 0 °C. It was also noticed that after placing the imitations of the product, compared to the first test, the temperature of the product decreased. The temperature at the outlet channel in the larger building (79B1; 79B2; 79B3) was ≤0 °C.
Below are the lowest and highest temperatures observed for the packaged product.
Composite packages
- The lowest temperature was recorded by sensor 73B2: −2.0 °C. The 79B2 Combined Packing Sensor measured −1.6 °C at the same location (Figure 12);
- The highest temperature was recorded by the 71B1 sensor: [5 °C]. The 77B1 Combined Packing Sensor was recorded at the same location: 2.0 °C.
Combined packages
- The lowest temperature was recorded by the 79B1: −2.0 °C. In the same place at different times of testing, the same temperatures were recorded in the range from −2 °C to −1.7 °C. The 73B1 composite package sensor measured −1.2 °C at the same location. In the same place at different times of testing, the same temperatures were recorded in the range from −1.2 °C to −0.6 °C;
- The 77B3 sensor recorded the highest temperature: 3.5 °C. The composite packaging sensor in the same place recorded: 1.6 °C.
Based on the graph data presented in Figure 13, the temperature difference between the packages was compiled, which is presented in Figure 14. For an objective assessment of the temperature difference, the data was taken after the cooling was established.
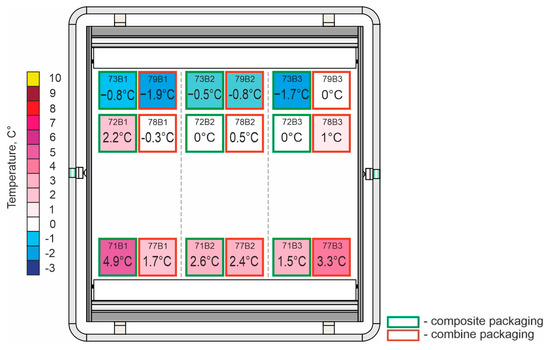
Figure 13.
Test data of composite and combined packaging, refrigeration with extra load temperature after refrigeration has settled.
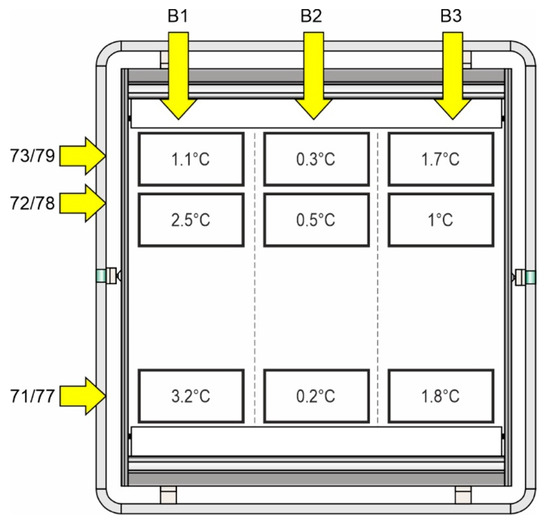
Figure 14.
The temperature difference between composite and combined packages after changing loading conditions.

Figure 12.
Cooling with load (temperature variation intervals).
Comparing the results with the temperature measurements of individual packages and based on the data obtained from the 73B1/73V2/73B3 sensors, we see that the smaller package maintains a negative temperature even without direct contact with the cold air blown.
In order to ensure efficient use of the cooling area, the manufacturer may evaluate /mark the relevant cooling zones in the cooling area of the refrigerated display case. In this way, it will be possible to place the packages purposefully, taking into account the temperature differences in the particular refrigerated display case under consideration (Figure 15 is suggested as a possible step to mark and take into account possible temperature fluctuations).
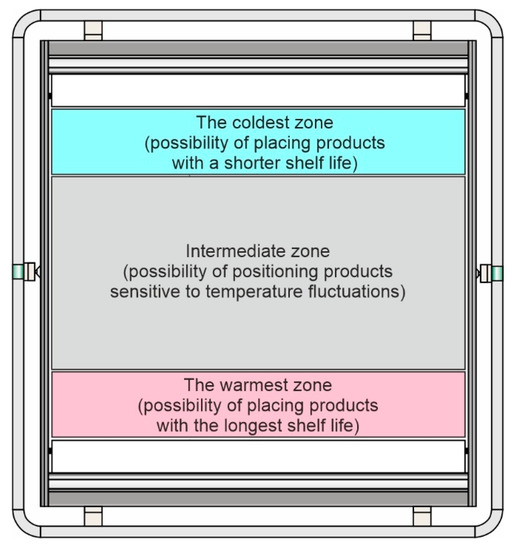
Figure 15.
Temperature differences in the refrigerated display case are under consideration (a possible step to mark and account for possible temperature fluctuations).
Our study can be expanded to evaluate different product types/package geometries, this will be the next step when further research is generated to evaluate the best placement of more different product types.
Additional research considering other various packages. Temperature changes in plastic and pulp packaging
Two types of food packaging are used cellulose and plastic. The location of the test packs in the refrigerated display case is shown in Figure 16.
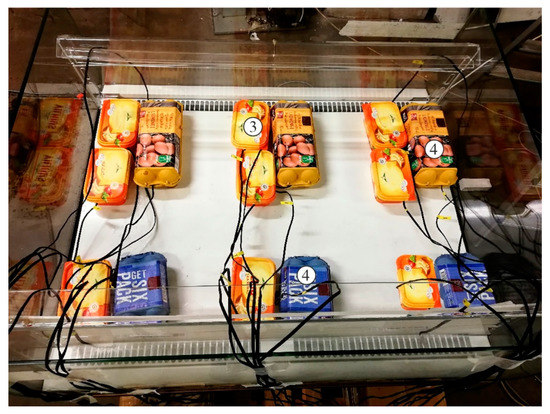
Figure 16.
Plastic and pulp research packages and their arrangement. 3—plastic packages; 4—pulp packages.
As in the study described earlier, the packages were tested in a refrigerated display case for at least 24 h. The determined intervals of temperature change during cooling in individual sensors (without load) are shown in Figure 17.
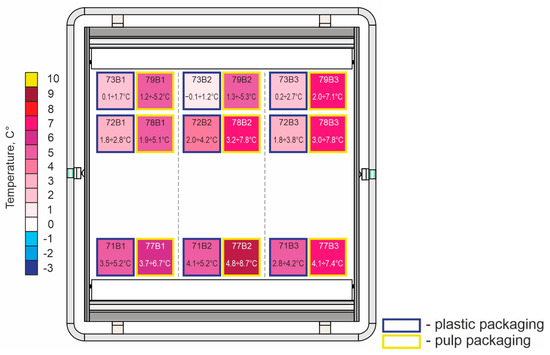
Figure 17.
Intervals of temperature change of plastic and pulp packaging during cooling without additional loading.
After testing with pulp and plastic packaging, the temperature differed when they were placed in different places in the same type of packaging. For the entirety of the test, the negative temperature was recorded only in one package with the sensor marking 73B2. The negative temperature was not constant and was recorded only once, while in the composite package, the sensor always showed a negative temperature at this place/location.
In this test, the temperature of the product in plastic packaging was the lowest for the group 73 sensors, and in the pulp package for the group 79 sensors. The above groups of sensors are located near the air outlet. The highest temperature was determined, respectively, in the sensors of groups 71 and 77, which are located near the air intake. Comparing the temperature of both types of packaging during the entire test, we can see that the temperature in the pulp packaging was always slightly higher than in the plastic packaging product in the same place.
The lowest and highest product temperatures after freezing were recorded:
- -
- In plastic packaging, the lowest temperature was recorded by the 73B2 sensor: −0.2 °C and the highest temperature was recorded by the 71B2 sensor: 4.1 °C;
- -
- In the pulp package, the lowest temperature was recorded by the 79B1 sensor: 1.2 °C and the highest temperature was recorded by the 77B2 sensor: 5.1 °C.
Based on the graph data presented in Figure 18, the temperature difference between the packages was compiled, which is presented in Figure 19. For an objective assessment of the temperature difference, the data was taken after the cooling was established.
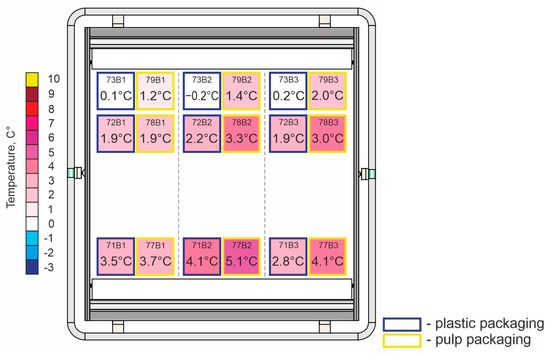
Figure 18.
Plastic and pulp packaging (without load) temperatures depending on the position in the refrigerated display case after cold settling (at a specific point in time).

Figure 19.
The temperature difference between plastic and pulp packages.
After freezing, the largest temperature difference in the product was determined between sensors 73B3 and 79B3 and reached 1.8 °C. According to the location of the packages in the showcase (refrigerated display case), this is the right corner of the air showcase near the air outlet.
The test was repeated with the same pair of sales packages, with a change in placement conditions. The product in the showcase was loaded with simulated goods to the load limit, thereby imitating the real working conditions of the showcase in the shopping center with the full placement of goods in the entire volume of furniture. The determined temperature changes during cooling in individual sensors are shown in Figure 20, and the temperature difference between packages after changing loading conditions is shown in Figure 21.
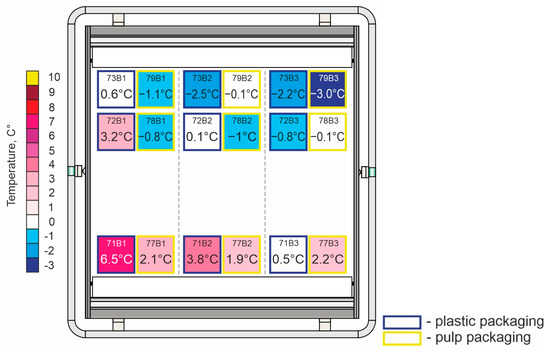
Figure 20.
Test data of plastic and pulp packaging after changing loading conditions (at a specific point in time).
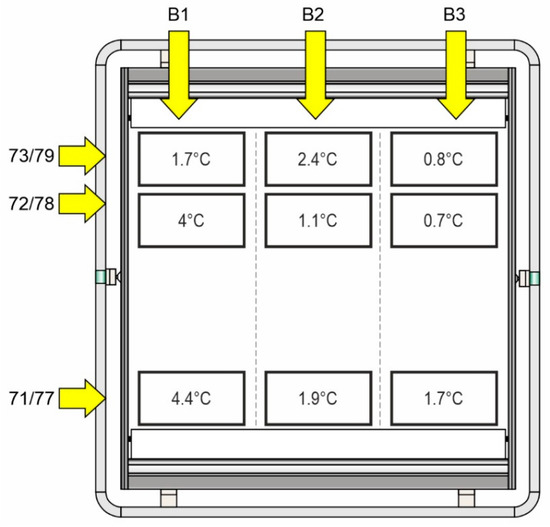
Figure 21.
The temperature difference between plastic and pulp packages after changing loading conditions.
In this load test, the pattern found in previous tests was not violated. The coldest place remained on the air outlet side and the warmest on the air intake side. From Figure 20, it can be seen that the temperatures of the product packs located near the air outlet were the highest, and those near the air inlet were the warmest.
The temperature of the liquid in pulp packages located near the air outlet (79B1; 79B2; 79B3) remained negative throughout the test. At the same time, the temperature of the liquid in the plastic packaging fluctuated. The temperature of the package located near the glass on the left side (73B1) remained positive throughout the test, while the other packages near the outlet (73B2; 73B3) remained negative.
The lowest and highest product temperatures after freezing were recorded:
- -
- In plastic packaging, the lowest temperature was recorded by the 73B2 sensor: −2.5 °C and the highest temperature was recorded by the 71B1 sensor: 6.5 °C;
- -
- In the pulp package, the lowest temperature was recorded by the 79B3 sensor: −3.0 °C and the highest temperature was recorded by the 77B3 sensor: 2.2 °C.
5. Conclusions
Below are summarized results and insights:
- There is a sufficiently significant distribution of temperatures over the packages in the investigated zone of the refrigeration equipment under consideration;
- The lowest temperatures are recorded not in the entire area, but in the corresponding area, i.e., in the first row closest to the cold air supply zone. The highest temperatures are observed on the opposite side of the refrigerated display case;
- The appropriate arrangement of the packages made it possible to evaluate the loaded and lightly loaded freezer;
- The results showed obvious temperature differences between the various types of packaging. This remains an important type/form/height/volume of packaging due to temperature sensitivity. It is most sensitive for composed/smaller packaging as well as for the refrigerated display case with the smallest load. The highest difference between various packaging (depending on placed zone and loading) can be approximately reached at up to 3 °C;
- Unlike the combined package, temperature differences are more sensitive in the composite package (lower loaded and smaller packages);
- To ensure efficient use of the cooling area, the manufacturer may evaluate/mark the appropriate cooling zones in the cooling area of the refrigerated display case. This will make it possible to expediently place the packages, taking into account temperature differences in the particular refrigerated display case under consideration (Figure 15 is suggested as a possible step to mark and account for possible temperature fluctuations);
- Although we offer simplified labeling of the respective cooling zones, the issue of ensuring the uniformity of the cooling itself remains open. Given the cost of production, this issue must also be taken into account when designing similar refrigeration equipment.
Author Contributions
Methodology, I.I., R.S. and R.J.; validation, I.I., R.S. and R.J.; formal analysis, I.I., R.S. and R.J.; data curation, I.I., R.S. and R.J.; writing—original draft preparation I.I., R.S. and R.J.; writing—review and editing, I.I., R.S. and R.J.; supervision, I.I., R.S. and R.J. All authors have read and agreed to the published version of the manuscript.
Funding
This research received no external funding.
Institutional Review Board Statement
Not applicable.
Informed Consent Statement
Not applicable.
Data Availability Statement
The data presented in this study are available on request from the corresponding author. The data are not publicly available due to privacy.
Acknowledgments
We thank Robert Lonski for previously provided material.
Conflicts of Interest
The authors declare no conflict of interest.
References
- García-Oliveira, P.; Fraga-Corral, M.; Pereira, A.G.; Prieto, M.A.; Simal-Gandara, J. Solutions for the sustainability of the food production and consumption system. Crit. Rev. Food Sci. Nutr. 2022, 62, 1765–1781. [Google Scholar] [CrossRef] [PubMed]
- Stoecker, W.F. Industrial Refrigeration Handbook; McGraw-Hill Education: New York, NY, USA, 1998. [Google Scholar]
- Kou, L.; Luo, Y.; Ingram, D.T.; Yan, S.; Jurick, W.M., II. Open-refrigerated retail display case temperature profile and its impact on product quality and microbiota of stored baby spinach. Food Control 2015, 47, 686–692. [Google Scholar] [CrossRef]
- Aung, M.M.; Chang, Y.S. Temperature management for the quality assurance of a perishable food supply chain. Food Control 2014, 40, 198–207. [Google Scholar] [CrossRef]
- Rong, A.; Akkerman, R.; Grunow, M. An optimization approach for managing fresh food quality throughout the supply chain. Int. J. Prod. Econ. 2011, 131, 421–429. [Google Scholar] [CrossRef]
- Ndraha, N.; Hsiao, H.I.; Vlajic, J.; Yang, M.F.; Lin, H.T.V. Time-temperature abuse in the food cold chain: Review of issues, challenges, and recommendations. Food Control 2018, 89, 12–21. [Google Scholar] [CrossRef]
- Smale, N.J.; Moureh, J.; Cortella, G. A review of numerical models of airflow in refrigerated food applications. Int. J. Refrig. 2006, 29, 911–930. [Google Scholar] [CrossRef]
- Laguerre, O.; Hoang, M.H.; Flick, D. Heat transfer modelling in a refrigerated display cabinet: The influence of operating conditions. J. Food Eng. 2012, 108, 353–364. [Google Scholar] [CrossRef]
- Marsh, K.; Bugusu, B. Food packaging—Roles, materials, and environmental issues. J. Food Sci. 2007, 72, R39–R55. [Google Scholar] [CrossRef]
- Robertson, G.L. Food Packaging: Principles and Practice; CRC Press: Boca Raton, FL, USA, 2005. [Google Scholar] [CrossRef]
- Vermeiren, L.; Devlieghere, F.; van Beest, M.; de Kruijf, N.; Debevere, J. Developments in the active packaging of foods. Trends Food Sci. Technol. 1999, 10, 77–86. [Google Scholar] [CrossRef]
- Bolanča, S.; Majnarić, I.; Golubović, K. Packaging printing today. Acta Graph. Znan. Časopis Za Tisk. I Graf. Komun. 2015, 26, 27–33. Available online: https://hrcak.srce.hr/file/228449 (accessed on 12 April 2023).
- Efremov, N.F.; Kornilov, I.K.; Lebedev, J.M. Reliability and Testing of Packaging: Textbook; MSUPA: Moscow, Russia, 2004. (In Russian) [Google Scholar]
- Pham, Q.T. Freezing Theory. In Encycl. Food Health; Caballero, B., Finglas, P.M., Toldrá, F., Eds.; Academic Press: Cambridge, MA, USA, 2016; pp. 110–118. [Google Scholar] [CrossRef]
- George, R.M. Freezing proceseses used in the food industry. Trends Food Sci. Technol. 1993, 4, 134–138. [Google Scholar] [CrossRef]
- Judith, A. Evans. Frozen Food Science and Technology; Blackwell Publishing Ltd.: Hoboken, NJ, USA, 2008. [Google Scholar] [CrossRef]
- Wu, X.; Chang, Z.; Yuan, P.; Lu, Y.; Ma, Q.; Yin, X. The optimization and effect of back panel structure on the performance of refrigerated display cabinet. Food Control 2014, 40, 278–285. [Google Scholar] [CrossRef]
- Kolbe, E.; Kramer, D. Planning for Seafood Freezing; Alaska Sea Grant College Program, University of Alaska Fairbanks: Fairbanks, AK, USA, 2007; p. 126, MAB-60. [Google Scholar]
- Zheng, Y.; Wang, G.; Kang, Z.; Liu, X.; Li, Z. Effects of air supply operation on the distribution and spatial differences of airflow field in conditioned room: A CFD Study. MATEC Web Conf. 2019, 272, 01013. [Google Scholar] [CrossRef]
- Wu, Y.; Xie, G.; Chen, Z.; Niu, L.; Sun, D. An investigation on flowing patterns of the airflow and its characteristics of heat and mass transfer in an island open display cabinet with goods. Appl. Therm. Eng. 2004, 24, 1945–1957. [Google Scholar] [CrossRef]
- Chen, Y.G.; Yuan, X.L. Experimental study of the performance of single-band air curtains for a multi-deck refrigerated display cabinet. J. Food Eng. 2005, 69, 261–267. [Google Scholar] [CrossRef]
- Chaomuang, N.; Flick, D.; Denis, A.; Laguerre, O. Influence of operating conditions on the temperature performance of a closed refrigerated display cabinet. Int. J. Refrig. 2019, 103, 32–41. [Google Scholar] [CrossRef]
- Laguerre, O.; Hoang, M.H.; Osswald, V.; Flick, D. Experimental study of heat transfer and air flow in a refrigerated display cabinet. J. Food Eng. 2012, 113, 310–321. [Google Scholar] [CrossRef]
- Alzuwaid, F.; Ge, Y.T.; Tassou, S.A.; Raeisi, A.; Gowreesunker, L. The novel use of phase change materials in a refrigerated display cabinet: An experimental investigation. Appl. Therm. Eng. 2015, 75, 770–778. [Google Scholar] [CrossRef]
- Chaomuang, N.; Laguerre, O.; Flick, D. A simplified heat transfer model of a closed refrigerated display cabinet. Therm. Sci. Eng. Prog. 2020, 17, 100494. [Google Scholar] [CrossRef]
- Alzuwaid, F.A.; Ge, Y.T.; Tassou, S.A.; Sun, J. The novel use of phase change materials in an open type refrigerated display cabinet: A theoretical investigation. Appl. Energy 2016, 180, 76–85. [Google Scholar] [CrossRef]
- Li, X.; Zhang, Z.; Liu, H.; Hu, X.; Liu, S.; Xu, Z.; Wang, Q. Performance of an open refrigerated display cabinet with two air curtains. Appl. Therm. Eng. 2022, 212, 118549. [Google Scholar] [CrossRef]
- FREOR LT, UAB (Closed Joint-Stock Company), Katiliskiu St. 92, LT—02212, Vilnius, Lithuania. Available online: https://freor.com (accessed on 12 April 2023).
- ISO 23953-2:2005; Refrigerated Display Cabinets—Part 2: Classification, Requirements and Test Conditions. ISO: Geneva, Switzerland, 2005. Available online: https://www.iso.org/standard/37029.html (accessed on 12 April 2023).
- ISO 23953-2:2015; Refrigerated Display Cabinets—Part 2: Classification, Requirements and Test Conditions. ISO: Geneva, Switzerland, 2015. Available online: https://www.iso.org/standard/62002.html (accessed on 12 April 2023).
Disclaimer/Publisher’s Note: The statements, opinions and data contained in all publications are solely those of the individual author(s) and contributor(s) and not of MDPI and/or the editor(s). MDPI and/or the editor(s) disclaim responsibility for any injury to people or property resulting from any ideas, methods, instructions or products referred to in the content. |
© 2023 by the authors. Licensee MDPI, Basel, Switzerland. This article is an open access article distributed under the terms and conditions of the Creative Commons Attribution (CC BY) license (https://creativecommons.org/licenses/by/4.0/).