Article

Hydrogeochemical Responses of MTMS-Coated Capillary Cover under Heavy Rainfalls

1
College of Civil Engineering and Architecture, Zhejiang University, Hangzhou 310027, China
2
School of Civil Engineering, Sun Yat-Sen University, Zhuhai 519082, China
*
Author to whom correspondence should be addressed.
Sustainability 2023, 15(8), 6667; https://doi.org/10.3390/su15086667
Submission received: 30 January 2023 / Revised: 24 March 2023 / Accepted: 30 March 2023 / Published: 14 April 2023
(This article belongs to the Section Hazards and Sustainability)

Abstract

:
To limit the oxidation of waste rocks that originates from mining operations and the subsequent leaching of acidic solutions with high concentration of metal ions, a tailing–rock–clay triple layer capillary cover system was developed to prevent rainwater infiltration in humid climatic regions. The fine grained soil (FGS) layer consists of mine tailing and a hydrodesulfurization (HDS) clay from waste-water treatment with a 95:5 mass ratio. The coarse grained soil (CGS) layer consists of local waste rock granules with a size of 1–10 mm. Methyltrimethoxysilane (MTMS), an oxidation-inhibiting agent with strong hydrophobicity, was passivated on the rock grains to further reduce water infiltration and leaching of metal ions. Prototype-scale column tests were performed with matric suction and water content measurements under 680 min rainfall of 60 mm/h, the most severe annual precipitation case scenario for the Dexing Copper Mine (Jiangxi Province, China, 28.95° N, 117.57° E, humid climate). Both the uncoated and the coated covers exhibited zero leakage throughout the experiment. The passivation on rock granules in the coated cover increased the water entry value (WEV) of the CGS layer to −0.56 kPa. This led to a 15 mm water storage increment in the overlain FGS layer as compared to that in the uncoated cover, and induced lateral drainage (5% of the precipitation) in the FGS layer, which was not overserved in the uncoated cover. The concentrations of the leached Fe2+, Cu2+, Zn2+, Mn2+ and Mg2+ cations drained from the CGS layers of the uncoated cover were 0, 0.4, 0.8, 73.5, and 590.5 mg/L, which are all within the regulation limits of industrial discharge water standards. The concentrations of Cu2+, Mn2+ and Mg2+ cations drained from the coated CGS layer were reduced by 1–3 orders of magnitude. The abovementioned laboratory studies validated the water retention and leaching prevention abilities of the proposed three-layer capillary covers and the MTMS coating, which hold promises in engineering applications.

1. Introduction

The extraction and utilization of mineral resources generate enormous amounts of waste rock, which are frequently deposited in open-air heaps without proper management [1]. The sulfide minerals in the waste rock react with water and oxygen to produce acid mine drainage (AMD). Taking pyrite as an example, its reaction is shown in Equation (1). To inhibit AMD, most methods start from the source of AMD generation, i.e., to reduce the contact between mine waste and oxygen or water. A cover system with a capillary-barrier effect is the most commonly used method, and its effective water- or oxygen-barrier ability has been confirmed in both the laboratory and field [2,3,4].
4 FeS 2 + 14 H 2 O + 15 O 2 4 Fe ( OH ) 3 + 8 SO 4 2 - + 16 H +
Traditional forms of barrier cover systems have evolved through the following stages of development: monolithic barrier with simple cladding → monolithic barrier with compacted clay → multilayer composite structure barrier comprising geomembrane or geosynthetic clay liner or other geotechnical materials and soil layers, which rely on the low permeability of soil materials to reduce rainfall infiltration. However, dry and wet cyclic conditions easily lead to cracking, hole breaking, and destabilization along the interface of traditional cover-barrier materials [5,6,7,8]. On the other hand, an evapotranspiration cover with a large water storage capacity by maintaining a non-saturated state through strong evapotranspiration, or a capillary cover, has demonstrated excellent water-blocking and acid-control effects in the laboratory and field, owing to its superior durability and stability [3,9,10,11,12]. A basic capillary cover consists of two layers, with one layer of FGS over a layer of CGS. Due to the smaller pores and permeability in FGS than those in CGS, rainfall tends to retain in FGS layer under strong capillary forces until the suction reaches the CGS water entry value, when water begins to percolate into the CGS. However, it is difficult to achieve low permeability with compacted clay or capillary-barrier cover types in wet areas (rainfall > 500 mm/year) [13]. Ng et al. [14] proposed a three-layer capillary-barrier cover system for humid climate zones, with an additional layer of low-permeability clay layer underneath the CGS. The additional clay layer ensures that even if the upper capillary cover is broken through by water, the clay layer can prevent rainwater leakage by lateral drainage along the CGS-clay interface [15].
However, when the rainfall is extremely heavy and enters the clay layer, the low-permeability layer is still subject to the wet and dry cycle, resulting in the formation of dry fissures. To achieve the long-term durability of the cover system, the water storage and drainage capacity of the upper soil layer should be enhanced. A common method for increasing the water storage capacity is to increase the thickness of the FGS layer; however, this increases the difficulty, construction cost, and the need to consider stability issues. The emerging surface coating technology shows promises in the cover system. The surface-passivated CGS grains become hydrophobic and have increased water entry suction value, which requires increased water accumulation (and therefore increased water pressure) in the FGS layer to break through the FGS–CGS interface [16]. Common hydrophobic agents include organic acids (such as stearic acid [17], oleic acid [18,19], wax [20]), silane compounds (such as trimethylchlorosilane [16], octadecyltrichlorosilane [21], dimethyldichlorosilane [22]), and dissolved organic carbon solutions [23]. Among them, silane compounds are considered to be the most suitable reagents for achieving lasting and stable hydrophobicity [24]. However, limited studies on these hydrophobic coated capillary covers have been reported. A cover system consisting of synthetic water-repellent sand, could withstand over 2 h of rainfall, whereas a conventional capillary barrier was broken through after 44 min of rainfall [25]. Zheng et al. [16] simulated the response of cover systems with synthetic water-repellent soils under rainfall conditions through the flume test, which showed that after the hydrophobic treatment of the coarse-grained layer, rainwater did not enter the coarse-grained layer during the test time and was all converted into lateral drainage.
Waste rock piles are usually in remote locations, which drives up the transportation cost of cover materials and the carbon footprint. Therefore, local, economical and recycled materials were widely tested, such as crushed concrete [26], crushed rock–bentonite mixtures [27], sewage sludge residue (biosolids) [28,29], and mine wastes [3]. For an instance, Kabambi et al. [30] used non-acid-generating waste rock as the CGS layer and desulphurization tailings as the FGS layer. A high degree of saturation (>85%) in the FGS layer was observed in all test columns, suggesting the qualification as an oxygen barrier. Larochelle et al. [31] found that capillary covers composed of either an acid-producing waste rock as CGS layer or non-acid-generating waste rock as the CGS layer yielded satisfactory water retention ability. Red mud bauxite, fly ash, and bottom ash are also used as raw materials for a cover system [32,33,34] with success. Dublet-Adli et al. [35] used low-sulfide tailings as the FGS layer, which reduced the concentration of Cu in the drainage by more than two orders of magnitude compared to non-covered tailings. However, high acidity and higher concentrations of Cu in the leachate compared to using fine sand as the FGS layer were identified. Leaching is still a challenging problem for future promotion of the cover technologies involving reused and recycled local materials [35].
The goal of this study is to use passivation technology and recycled local materials to develop capillary cover systems suitable for humid climate. The specific objectives of this study are as follows: (1) demonstrate that a cover system made from mine waste, comprising waste rock, tailings, and HDS clay, can be utilized for water and acid resistance in humid climates; (2) investigate the water balance to elucidate the water barrier mechanism of uncoated and coated covers; (3) assess the impact of the passivated technique of cover on the quality of discharged water.

2. Materials and Methods

2.1. Material Preparation

Waste rock, tailings, and HDS clay were all obtained the Dexing Copper Mine site (Figure S1). Dexing Copper Mine is located in Dexing City, Jiangxi Province, 35 km from Dexing City, at 117.57° E and 28.95° N latitude. The mining area primarily consists of exposed volcanic sedimentary rock series strata, situated in a fault structural junction zone. In addition to Cu, the mine also produces metals such as Ag, Au, Zn, Fe, Pb, Sn, Mn, Cr, etc. The area is characterized by a subtropical monsoon climate, with an annual average temperature of 17.7 °C, an average rainfall of 1802 mm, and an evaporation of 1272 mm. Original and crushed waste rocks were obtained from the Fujiawu waste rock yard. The crushed waste rock is mechanically crushed and used to fill roads, and the particle size does not exceed 2 cm. The tailings and HDS clay were obtained from the No. 4 tailings pond and vulcanization process plant, respectively. The FGS consists of mine tailing and an HDS clay with 95:5 mass ratio. The CGS consists of local waste rock grains. Deionized water was used for wetting, hydration, and infiltration throughout the experiments.
Instead of the common passivation methods of organosilane compounds on waste rocks, such as mixed stirring [17,36] and powder-coating methods [37], a new passivation process with the conditioned parameters for the highest passivation efficiency established by Dong et al. [38] was adopted due to its effectiveness in inhibiting pyrite (FeS) oxidation. This process contains three steps, including hydrolysis, condensation, and curing, as elaborated as follows: First, add about 8% of MTMS solution into 20 L deionized water. Then, the pH of the solution is adjusted to 3 using 1 mol/L HCl., and then placed in a 40 °C incubator and continuously stir for 1 h to fully hydrolyze MTMS. Afterward, 20 kg of dried waste rock is added to the hydrolyzed solution, and the pH of the solution adjusted to 7 with 1 mol/L NH4OH solution. The solution is transferred to a 50 °C incubator for 3 h of condensation, with intermittent stirring every 10 min. Finally, the coated waste rock was separated from the passivation solution through sieve-filtering, cured at 80 °C for 24 h, and subsequently sealed and left to stand before being used. The chemical reaction of hydrolysis and condensation occurring in MTMS is as follows:
CH 3 Si ( OCH 3 ) 3 + 3 H 2 O CH 3 - Si ( OH ) 3 + 3 CH 3 OH
CH 3 - Si ( OH ) 3 + ( OH ) 3 Si - CH 3 CH 3 - Si ( OH ) 2 - O - Si ( OH ) 2 CH 3

2.2. Measurement of Soil Hydrophobicity

The soil hydrophobicity is quantified via contact angle (CA). The mobile sessile drop method was used to measure CA: the soil grains were glued on a glass slide with double-sided tape, and gently flattened with a glass slide. After removing the loose particles, the shape of the water droplets on the soil surface was imaged using an optical goniometer, and the CA was obtained graphically [22,39].
Water droplets can stand on the surface of hydrophobic soil without entering the pores temporarily until the gradual infiltration of water in the small channels in the soil due to capillarity. The time required for water droplets to completely penetrate soil, or the water droplet penetration time (WDPT), is another means of evaluating soil hydrophobicity or the persistence of water repellency of the soil. The test steps were briefly stated as follows: the soil was placed in a Petri dish (diameter of 8 cm) and was slightly compacted and leveled with a scraper. Deionized water (50 µL) was dropped on the sample surface with a pipette; the Petri dish was covered with a food-wrap to prevent evaporation, and the penetration time was recorded (Figure S2) [40,41,42]. The measured contact angle of the passivated waste rock was 170.1°, and the WDPT exceeded 3600; thus, it is extremely hydrophobic. Contrarily, the CA of the uncoated waste rock was 13.2°, and its WDPT was below 5 s; thus, it was hydrophilic.

2.3. Geotechnical and Hydrogeological Properties

The particle size distributions of CGS and FGS were obtained using the sieving method (ASTM D422 [43]). The particle size distribution of the HDS clay was measured using a laser particle size analyzer (APA2000, Malvern, UK) (Figure 1). The data for the grain size distribution curve is located in Tables S1–S3. The coefficient of uniformity ( C U = D 60 / D 10 ) for CGS is 15.00, and the curvature coefficient ( C C = D 30 2 / D 10 × D 60 ) is 2.86, indicating a well-graded gravelly soil. The C U for FGS is 12, and the C C is 2.68, falling under the category of well-graded silty sand. The liquid limit and plastic limit of the HDS clay are 61.4% and 40.3%, respectively, with a plasticity index of 21.1 (greater than 17), indicating that it belongs to clay. The specific gravity of the material was determined using a pycnometer (ASTM D854-14 [44]). Atterberg limits of FGS and HDS clay were measured using the Electric Plastic Limit and Liquid Device (ASTM D4318 [45]). Obtaining a compaction curve through indoor Proctor compaction test (ASTM D698 [46]). The physical and hydrogeological properties of soil are shown in Table 1.
Saturated hydraulic conductivities (ksat) of the FGS and HDS clay were determined using a flexible wall permeameter, and the confining pressure, base pressure, and back pressure of the soil sample were set to 50 kPa, 30 kPa, and 10 kPa, respectively (ASTM D5084 [47]). The ksat of the CGS was measured using the constant head method described in ASTM D2434 [48].
The soil water characteristic curve (SWCC) of the FGS was measured using a pressure plate (1D-SDSWCC, EURAMERICAN DADI, Shanghai, China), and that of the HDS clay was measured using a WP4C Dewpoint PotentiaMeter (METER, Pullman, WA, USA). The SWCC of the uncoated waste rock was estimated both analytically using the toroidal water model [49], and numerically with SEEP/W software (GeoStudio 2007, Geo-Slope, Calgary, AB, Canada). The SWCC of the coated waste rock was measured using the water-ponding method [50]. This method entails applying water pressure on the soil surface and increasing it until infiltration occurs. Once water begins to enter the soil, the water entry pressure at the soil–water interface is recorded. Infiltration begins when the pressure at the soil–water interface suddenly drops. The soil was filled in the acrylic column with a diameter of 15 cm, and the length scale was marked on the outside of the column. The soil was 10 cm high and compacted in layers. To detect and capture the accurate filtration time, a tensiometer was installed 0.5 cm below the soil sample surface to detect the change in pore water pressure to determine the beginning of infiltration.

2.4. Mineralogical and Element Composition

The mineralogical composition of the cover materials was determined using X-ray diffraction (XRD) (D8 ADVACNCE, Bruker, Bremen, Germany) (Figure S3). The tailings mainly comprised 84.5% (by weight) of quartz and carbonate minerals (muscovite and calcite) (Table 2). The waste rock comprised 51.7% of carbonate minerals, 17.5% of quartz, and 4.7% of iron disulfide (FeS2), and 1% of calcium sulfate. The mineral composition of the coated waste rock accounts for 41.7%, and the silane polymer colloid coating occupying the remaining mass. Elemental concentrations of waste rock, tailings, HDS clay, and passivated waste rocks can be determined through ICP-MS (NexION 300XX, PerkinElmer, Waltham, MA, USA) experiments. Prior to conducting concentration tests, soil samples must be digested with nitric acid and hydrofluoric acid. The highest concentration of elements in all soil samples is Fe, with waste rock having the highest Fe content, followed by relatively high amounts of Al, Ca, Cu, Zn, Mn, and Mg. Compared to the uncoated waste rock, the metal element concentrations of the coated waste rocks have decreased to varying degrees (Table 3). Scanning electron microscopy and energy-dispersive X-ray spectroscopy (SEM-EDS) measurements (SU-8010, HITACHI, Tokyo, Japan) were performed to analyzed the surface morphology and elemental composition of waste rock and coated waste rock.

2.5. Column Test

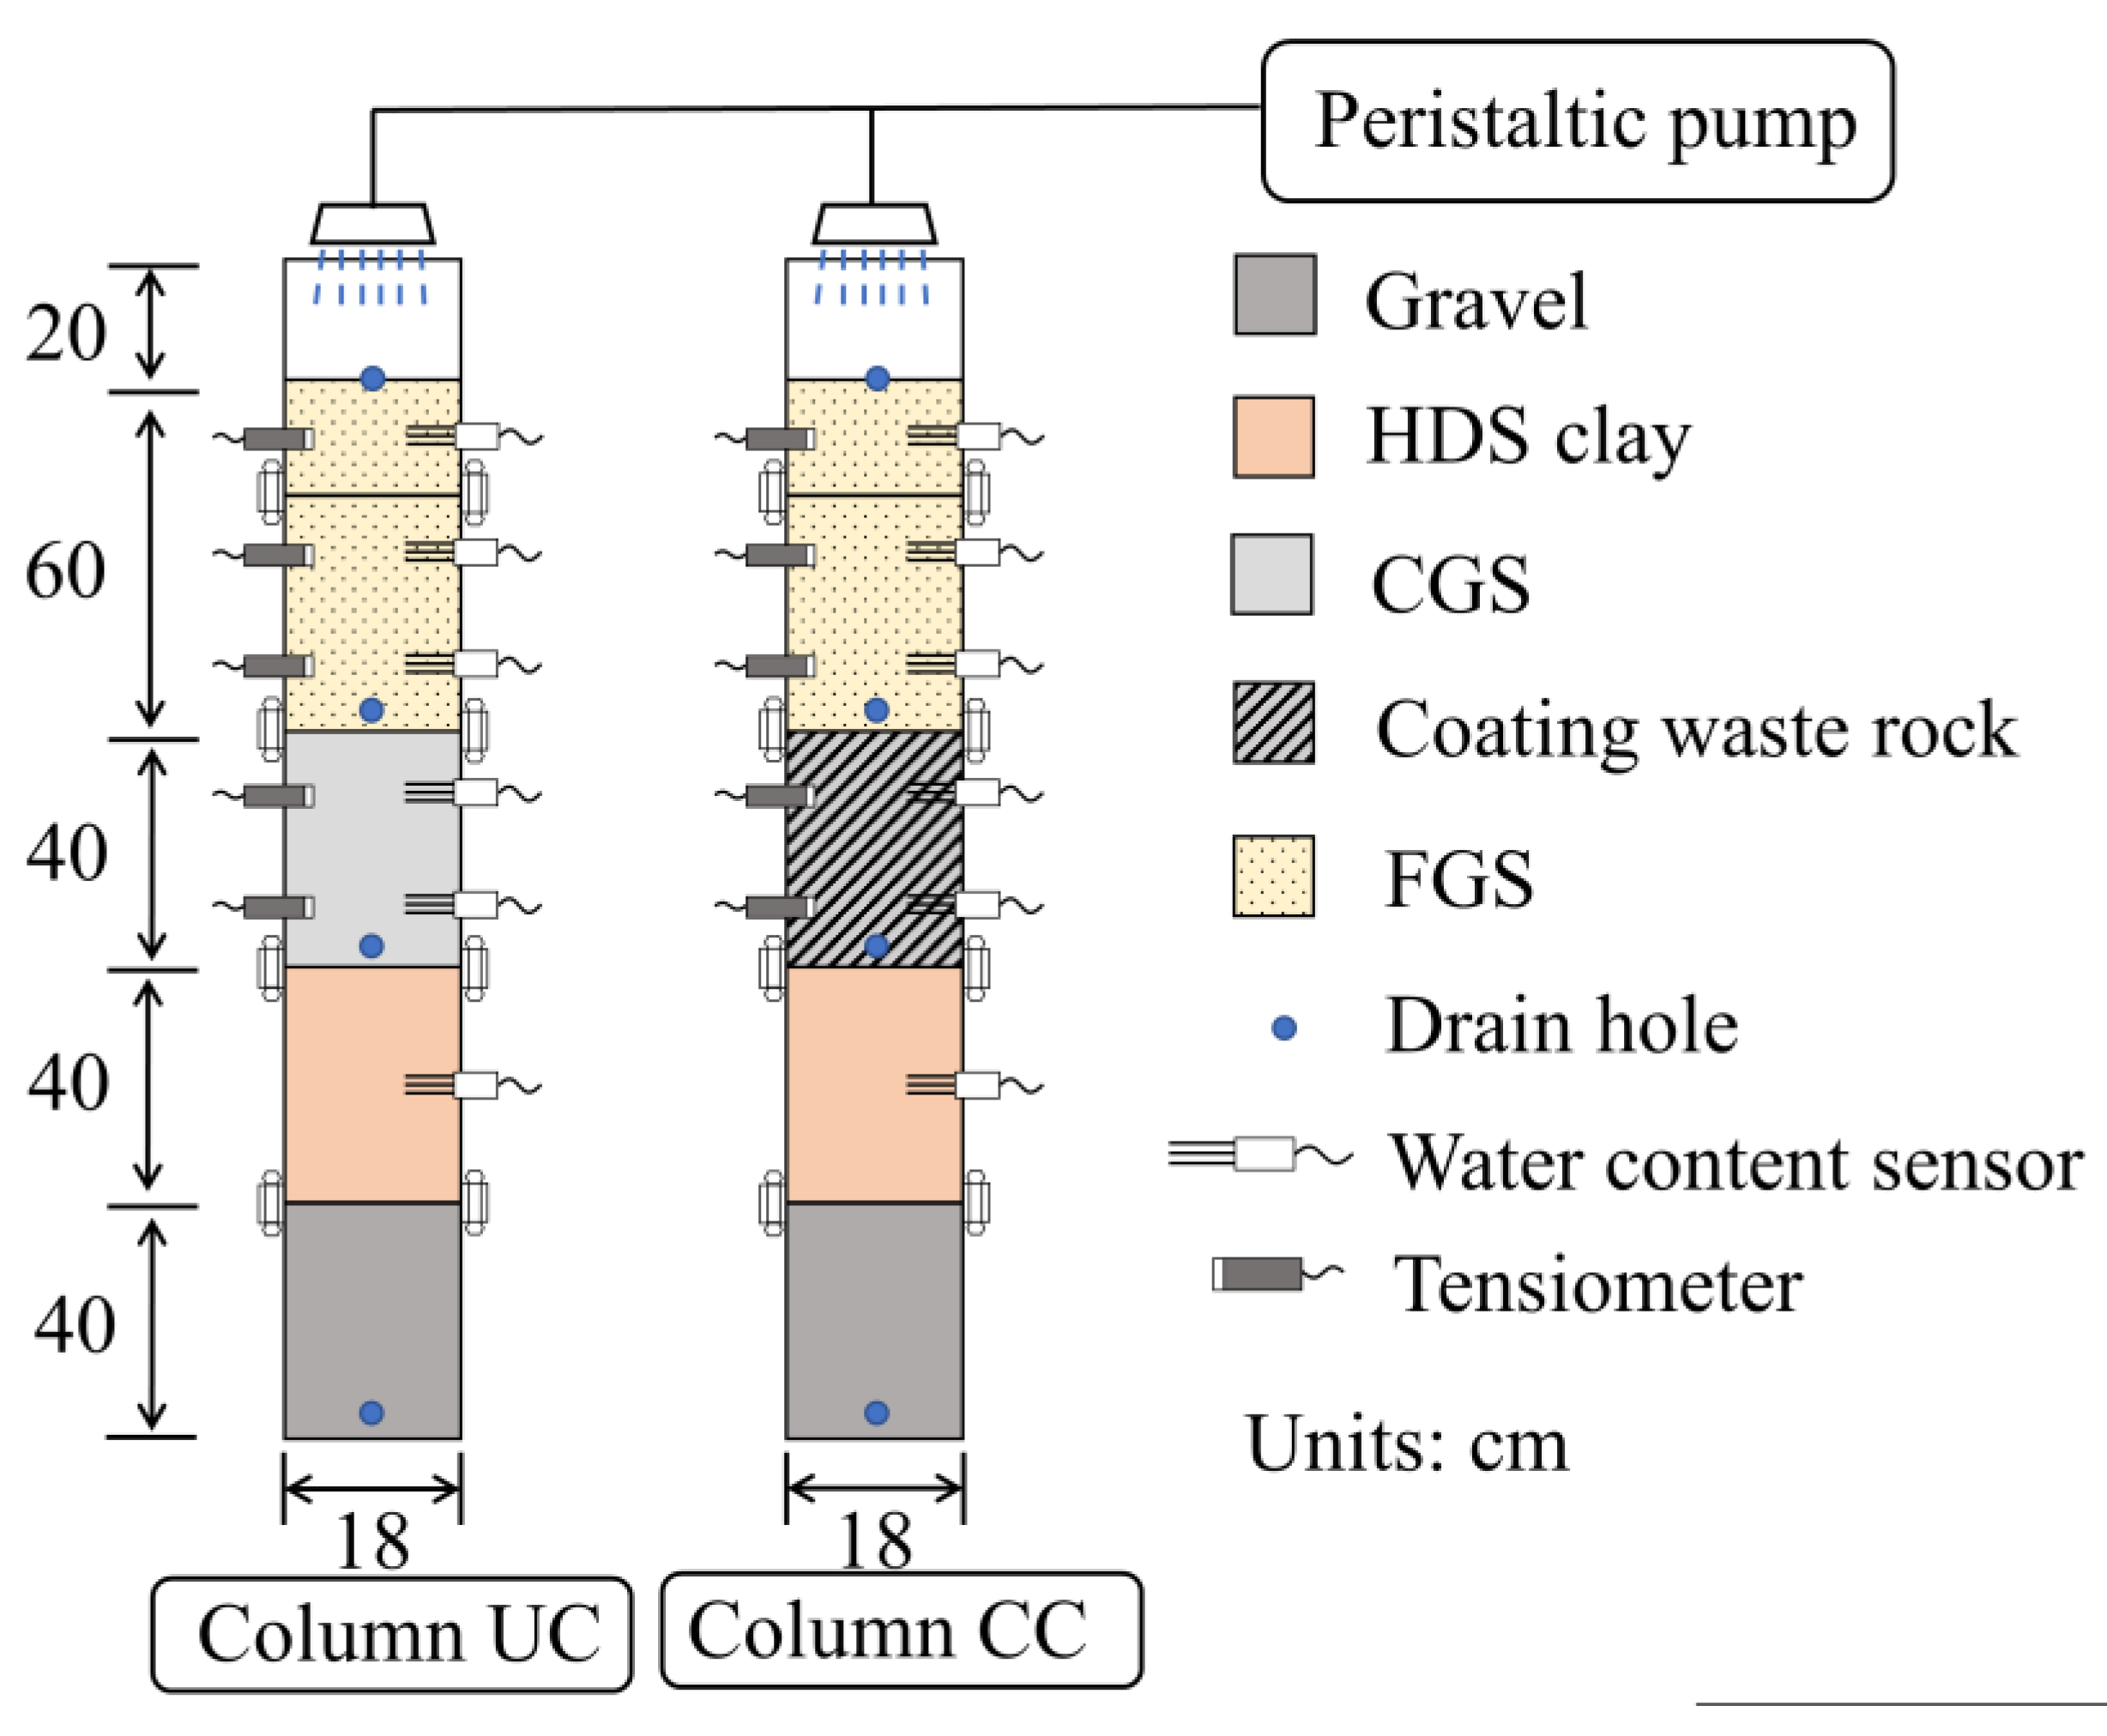
The schematic diagram of prototype capillary cover column test setup (1:1) is shown in Figure 2. The 2 m tall column consists of five acrylic cylinders with an inner diameter of 18 cm that are 40 cm tall. The water in the tank was siphoned through a peristaltic pump and was distributed evenly by perforated holes in the coiled silicone hose to simulate rainfall. Five tensiometers (YZTE-PPT100, Yanzhi Technology, Shenzhen, China) were installed alone the acrylic column at depths of 0.1, 0.3, 0.5, 0.7, and 0.9 m from the top of column (Figure 2) to monitor the pore water pressure with measurement range from −100 to 100 kPa. The water pressure in the HDS clay exceeded this range, and was not measured. Prior to installation, the ceramic head of each tensiometer was fully saturated in a vacuum cell while the tensiometer body was filled with deaired water. Tensiometer readings were sampled at an interval 1 s. The water content profile alone the column was measured with six moisture content probes (YZTE V100, Yanzhi Technology, Shenzhen, China) were installed at column side with distance of 0.1, 0.3, 0.5, 0.7, 0.9, and 1.2 m from the top, respectively (Figure 2). They were calibrated prior to use, and the reading interval was 1 s. Drainage holes were drilled at the top soil surface, FGS layer bottom, CGS layer bottom, and the bottom of the column to collect surface runoff, laterally drained water in the FGS layer, laterally drained water in the CGS layer, and cover percolation, respectively.

2.6. Test Procedures

A rainfall with an intensity of 60 mm/h was simulated at the top of column for a continuous duration of 680 min. The surface runoff, lateral drainage in the FGS and CGS layers, and percolation were recorded every 10 min until they reached zero. The water samples were collected from the CGS layer every 1 h, and were analyzed for their chemical composition.

3. Results

3.1. SWCCs and Permeability Functions

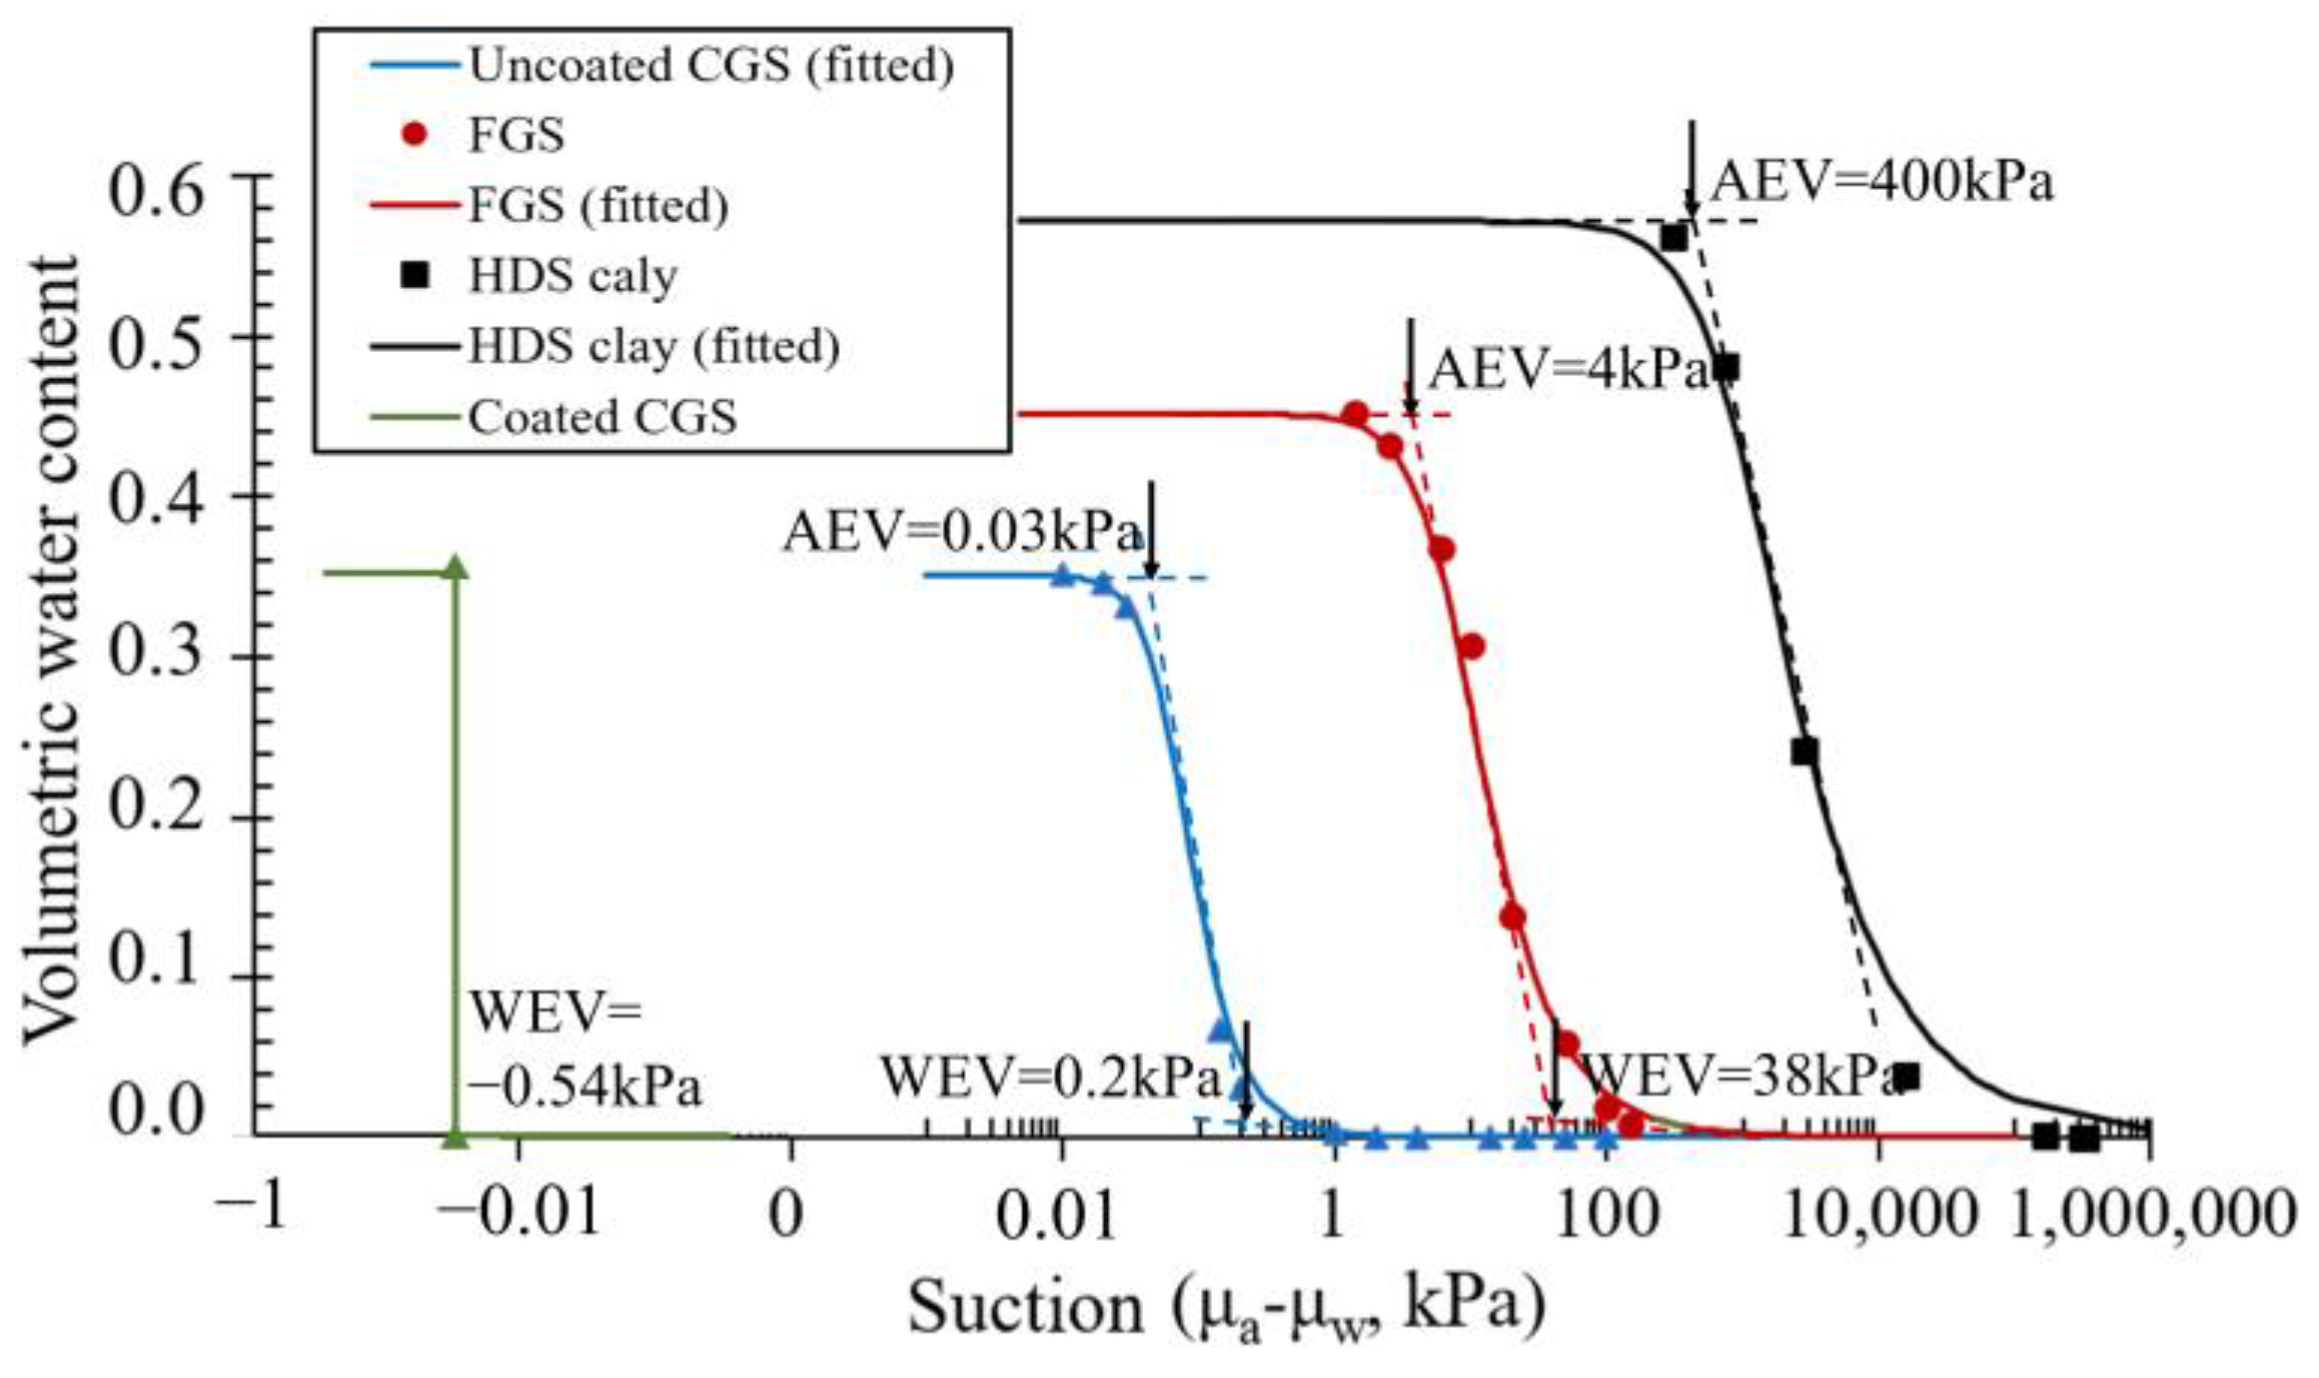
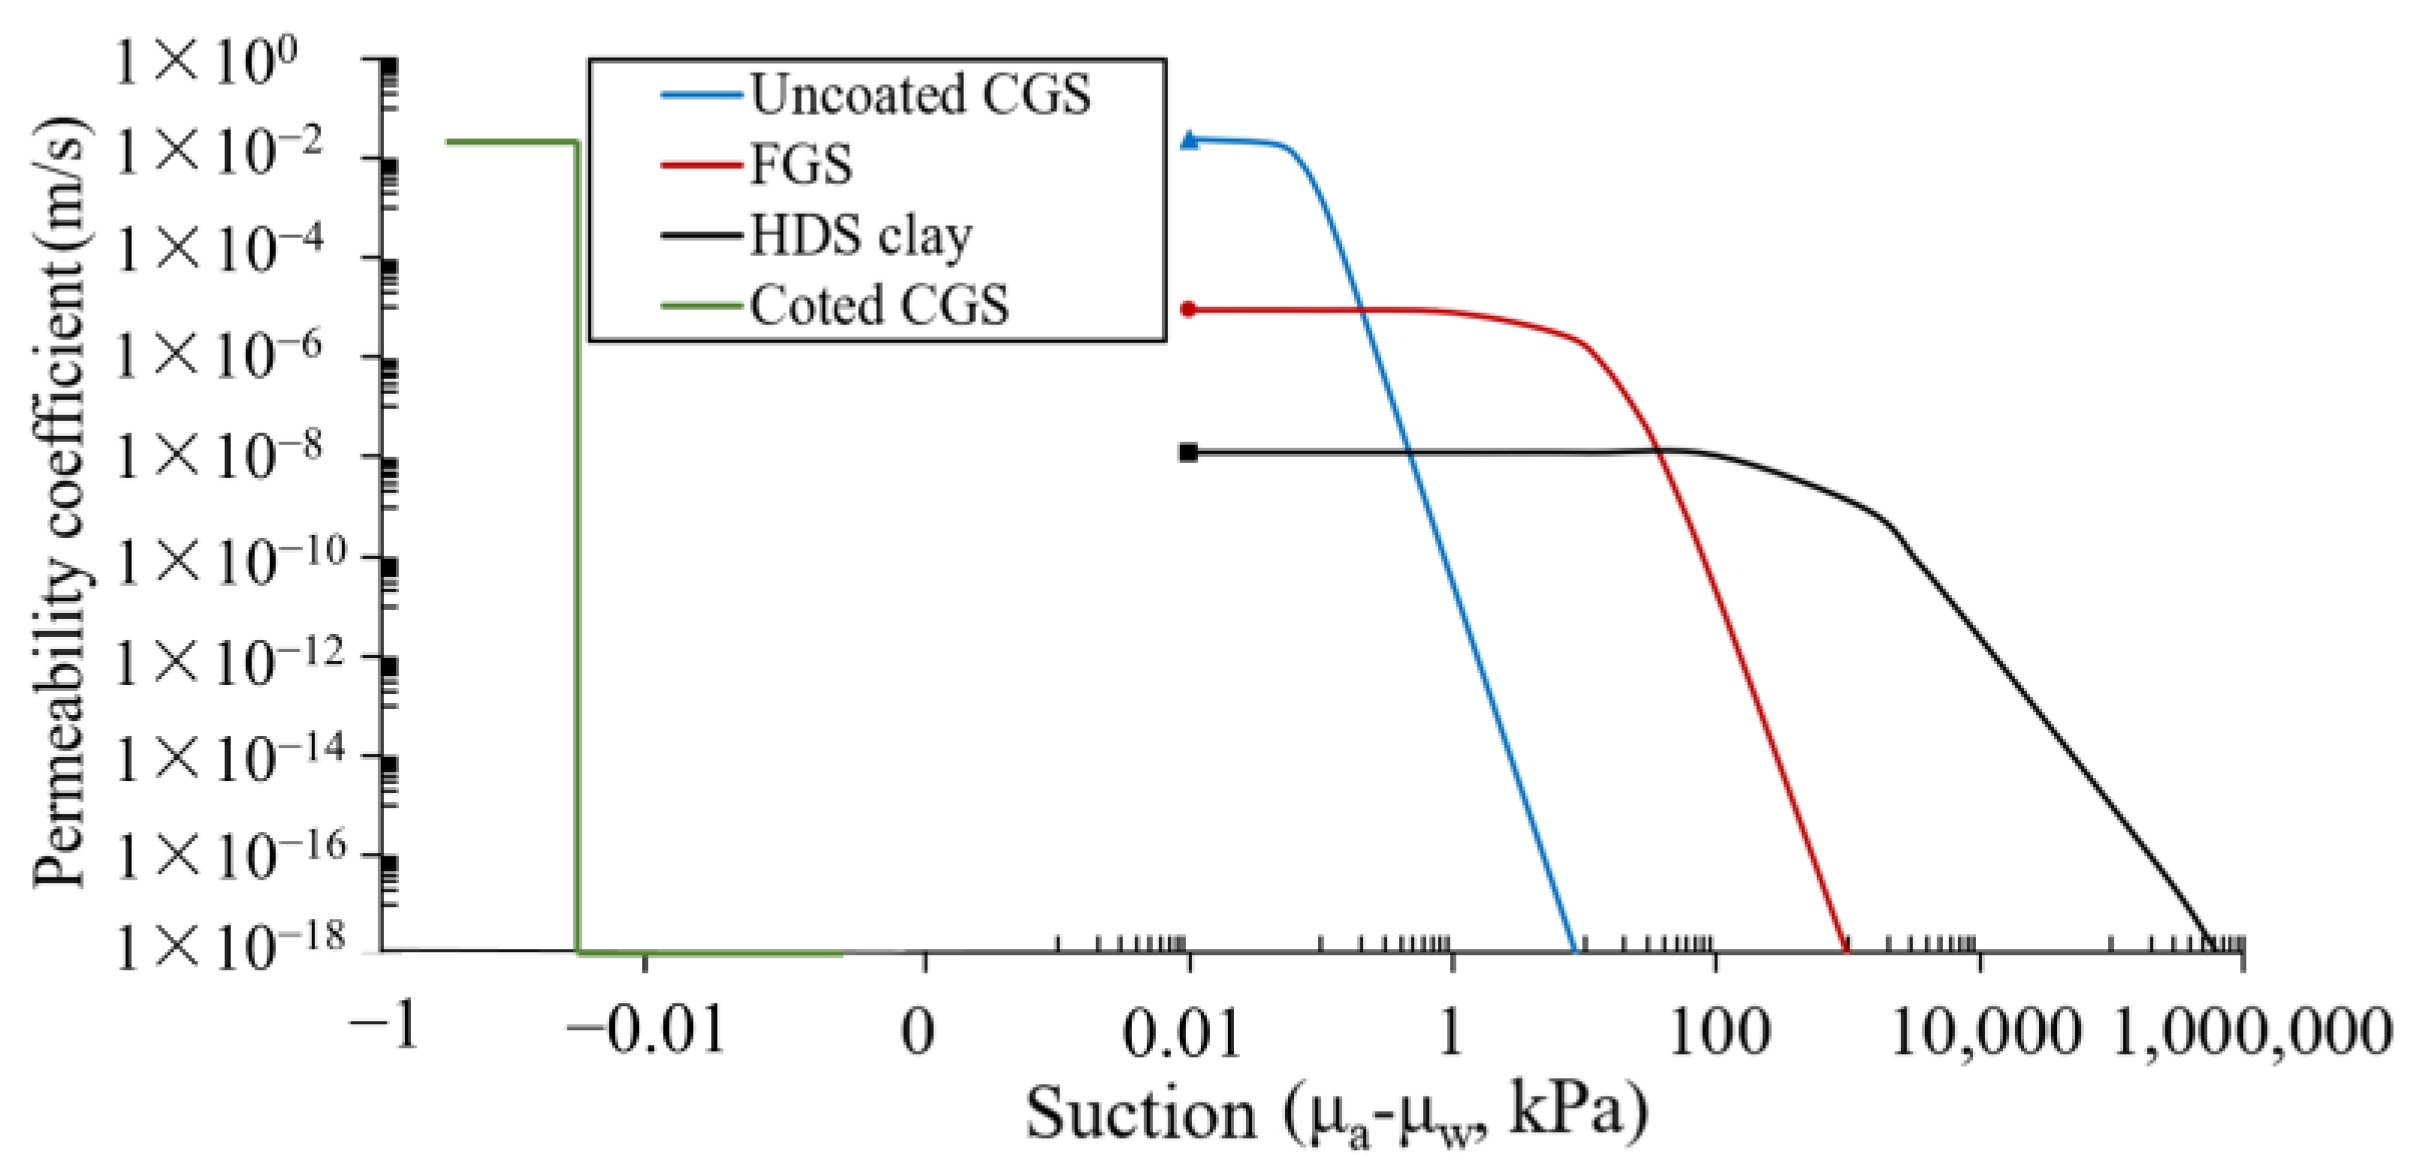
The soil water characteristic curves (SWCC) and the unsaturated permeability curves of FGS, CGS, HDS clay, and the coated CGS are illustrated in Figure 3 and Figure 4. The van Genuchten model fitting parameters for SWCCs are listed in Table 1. The air entry values (AEV) for FGS, CGS, HDS clay, and coated CGS are 4, 0.03, 400 and −0.54 kPa, respectively. MTMS coating increased the contact angle and the WEV of the waste rock, the water penetration into which requires even positive water pressure equivalent to a 5.4 cm of elevation head. The WEV of both uncoated and coated waste rocks (0.2 and −0.54 kPa in matric suction) were lower than the AEV of FGS (4 kPa), which facilitates the full saturation of FGS layer before water enters the waste rock layer. The ksat of CGS, FGS and HDS clay are 2.37 × 10⁻², 8.12 × 10⁻⁶, and 1.12 × 10⁻⁸ m/s respectively. When the material is completely saturated, the permeability coefficient (k) of CGS is four and six orders of magnitude greater than that of FGS and HDS clay, and the low permeability of the cover system is dominated by HDS clay. With the gradual increase in suction, the k of CGS decreases rapidly, and when the suction exceeds 0.48 kPa, the k of CGS is smaller than that of HDS clay; at this time, the water barrier performance is mainly dependent on the CGS layer (Figure 4). The low AEV (0.03 kPa) and high ksat of CGS means poor water holding and good permeability. FGS has high AEV (4 kPa) and high porosity (45%), which is a high-quality material for water retention. Together with the low permeability of the HDS clay, this forms the theoretical basis for seepage prevention of the three-layer soil cover system [8].

3.2. Selection Criteria of Capillary Cover Materials

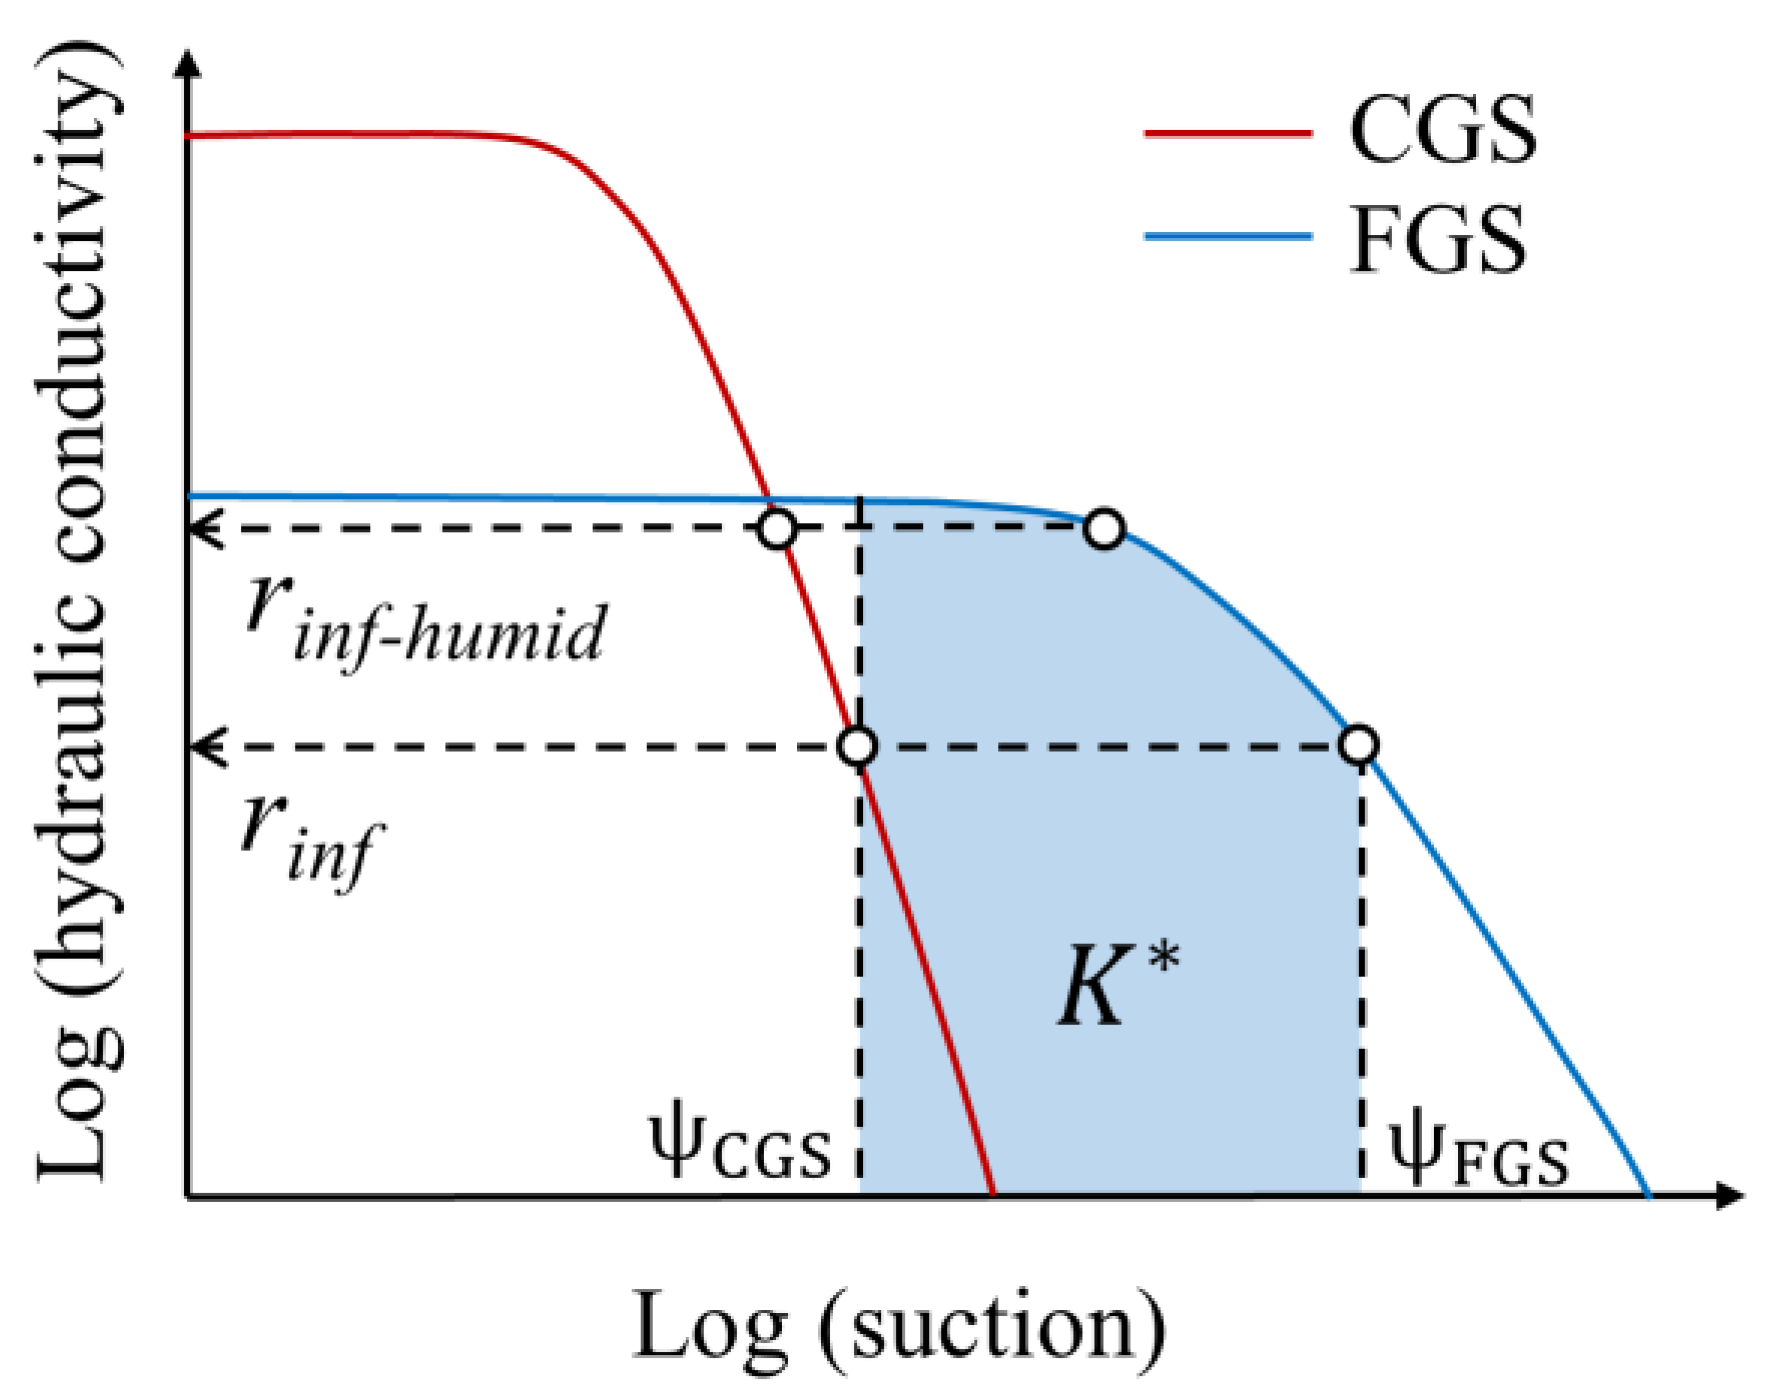
Three recommended guidelines for the selection of FGS and CGS materials for a capillary cover were provided by Rahardjo et al. [51]: (1) WEVFGS: WEVCGS > 10; (2) WEVCGS < 1 kPa; (3) ksat, FGS > 10−5 m/s to facilitate lateral drainage. Aubertin et al. [52] proposed ksat, CGS: ksat, FGS > 1000. Smesrud et al. [53] proposed D50, CGS: D50, FGS > 5 to obtain the largest possible diversion length. The model of Ross (1990), Parent and Cabral [54] stated that ψ FGS should be as high as possible, and ψ CGS should be as small as possible to obtain the largest possible diversion length (proportional to K * ) for a given infiltration rate (rinf, precipitation minus surface runoff) (Figure 5). In a humid climate, the infiltration rate (rinf-humid) is close to the saturation permeability coefficient of the FGS layer when the corresponding value of ψ FGS is close to the AEV of the FGS and ψ CGS is close to the WEV of the CGS. Therefore, under strong rainfall conditions, to exert the capillary-barrier effect, the AEV of the FGS layer should significantly exceed the WEV of CGS. This viewpoint has also been proven by previous research (Table 4).The materials selected in this study essentially satisfy all of the above criteria: (1) WEVFGS: WEVCGS (=38: 0.2 = 190) > 10, (2) WEVCGS (0.2 kPa) < 1 kPa, (3) ksat, CGS: ksat, FGS (=2.37 × 10⁻²: 8.12 × 10−6 = 2918) > 1000, (4) D50, CGS: D50, FGS (=16: 0.15 = 107) > 5, (5) AEVFGS: WEVCGS (=4: 0.2) = 20.

3.3. Performance of Uncoated Cover

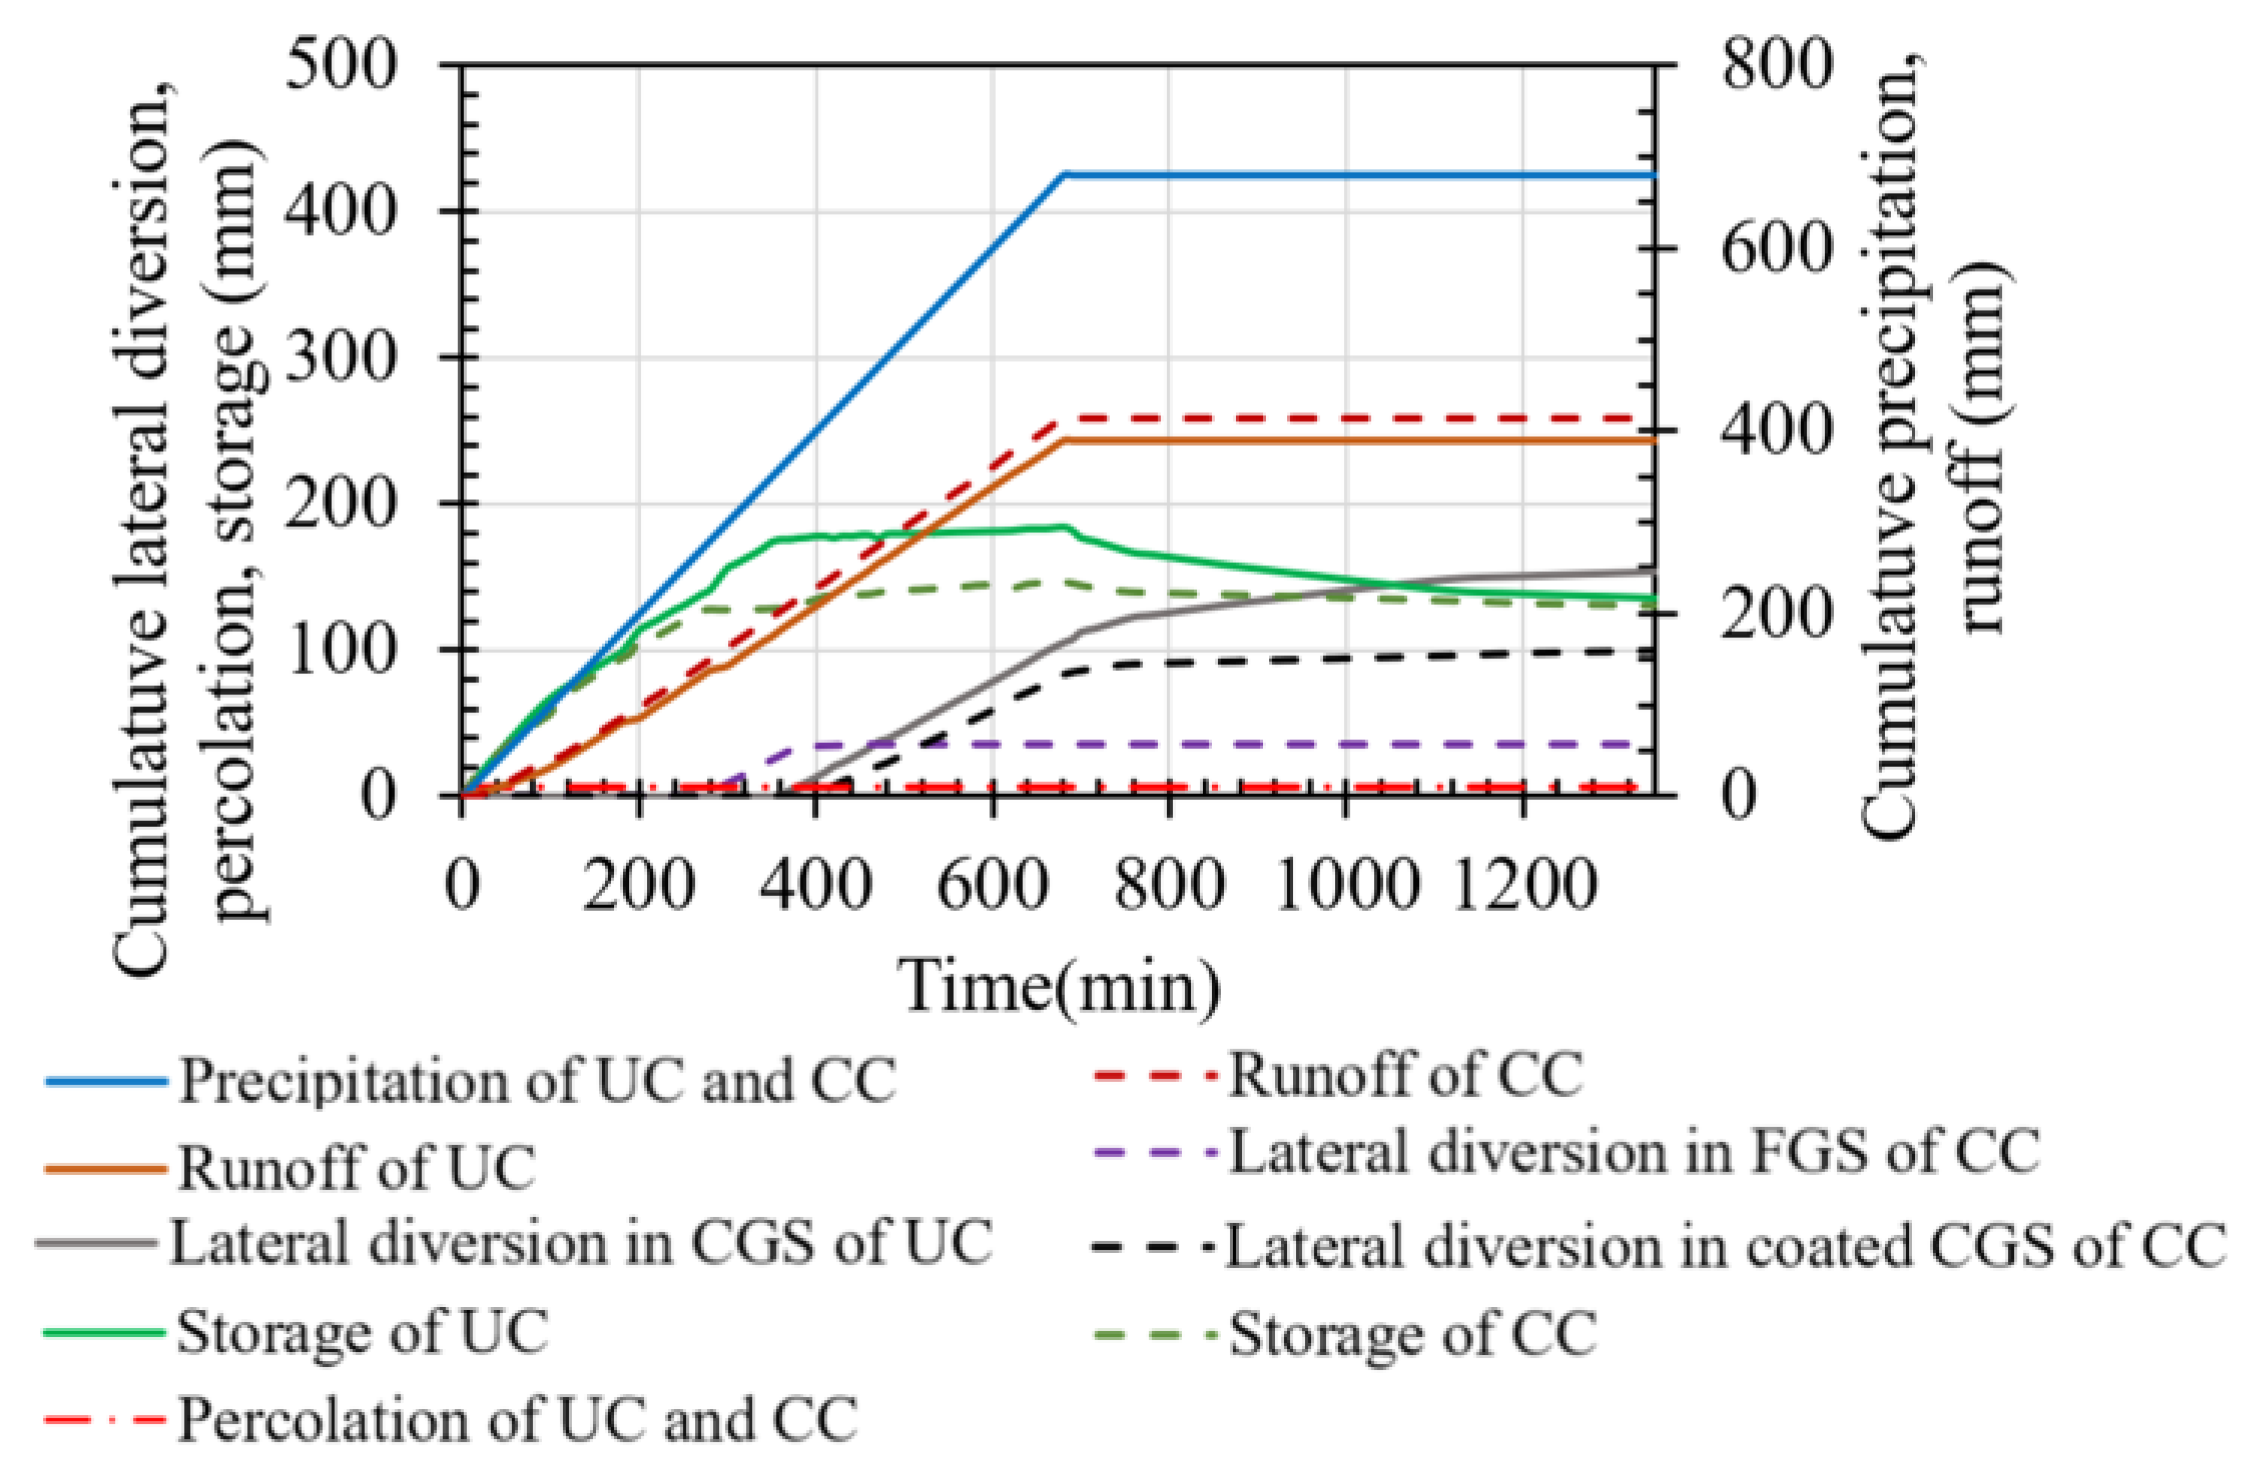
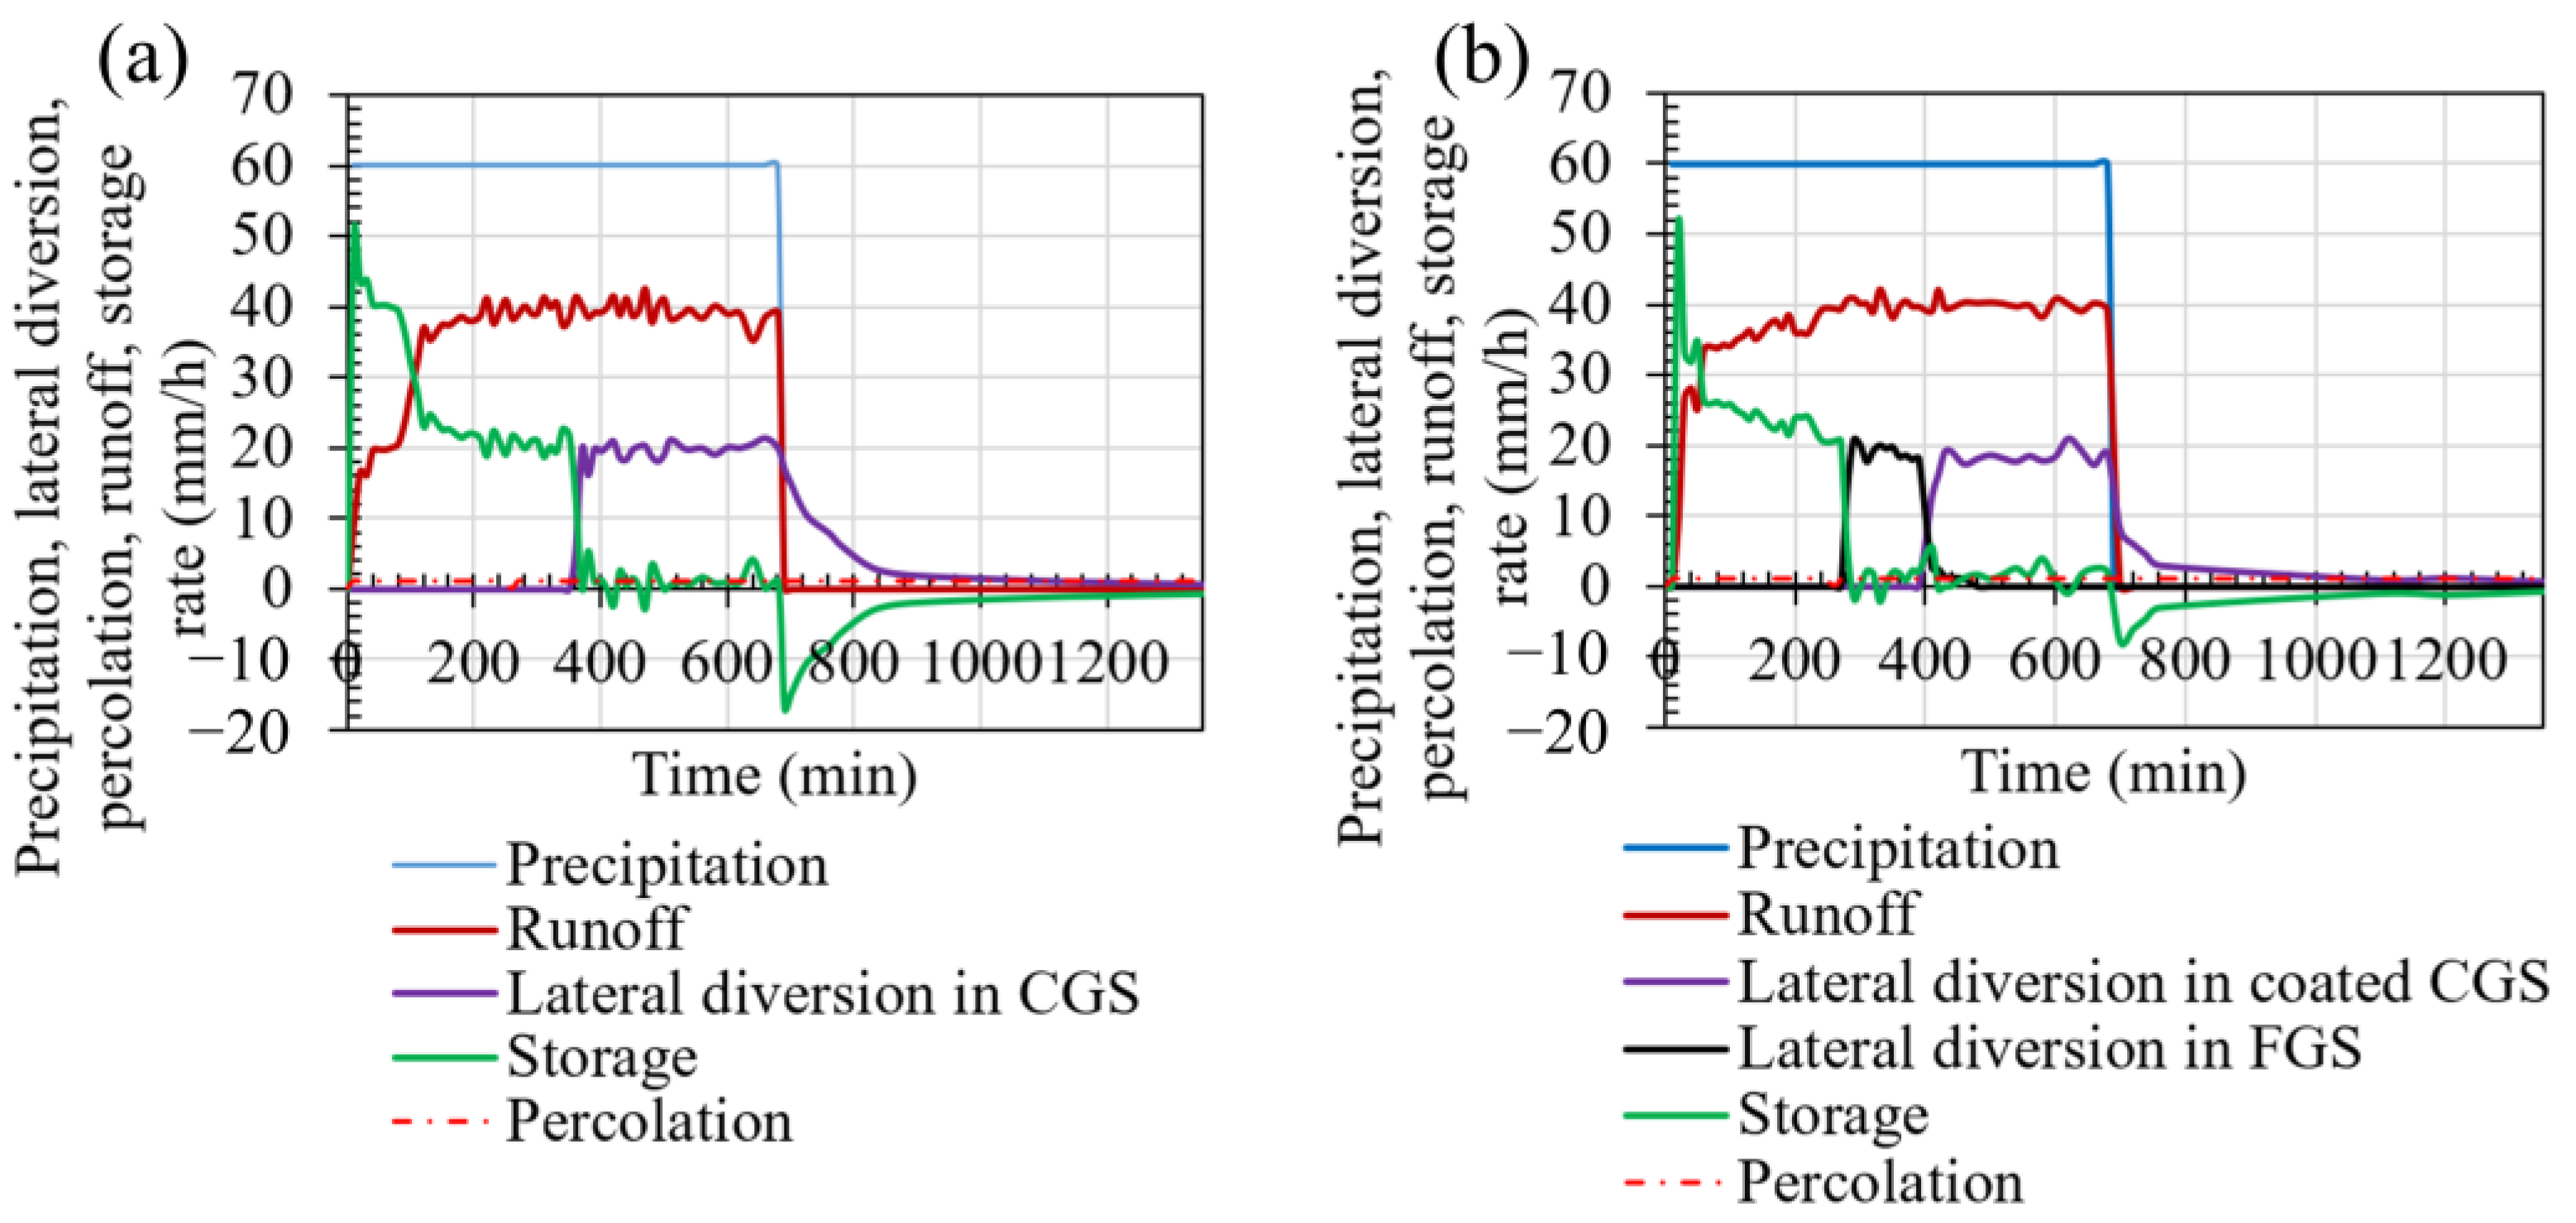
The total precipitation of 60 mm/h for 680 min was either drained via surface runoff, stored in the pore space of the cover, or drained laterally alone the bottom of the CGS layer or the FGS layer via the following operating mechanisms. First, 57% (40 mm/h) of the precipitation was surface runoff (Figure 6 and Figure 7), leaving the infiltration rate around 20 mm/h (5.6 × 10⁻⁶ m/s). This infiltration rate was approximately equal to the ksat of FGS (8.1 × 10⁻⁶ m/s). Secondly, the storage of precipitation in the FGS layer increased at a reduced rate up to 20 mm/h (Figure 6 and Figure 7a). This led to a continued increase in water content in the FGS layer until water broke through the CGS layer. The third mechanism is lateral drainage through the CGS layer. As the water broke into the CGS layer, the rainwater slowly moved down and laterally drained on top of the nearly impermeable HDS clay layer due to its low permeability. In this particular cover structure and precipitation event, the accumulated precipitation was diverted by surface runoff (57%), lateral drainage in the CGS layer (23%), and storage (20%). No precipitation penetrated the HDS clay layer, suggesting that the cover system worked well. After rainfall, surface runoff stopped immediately. The practically saturated storage layer continued to release water at a reduced rate in the CGS layer, where water was laterally drained quickly (Figure 6). Water contents for both layers reached equilibrium in 820 min (Figure 7a).
The storage drainage processes at the interface between the FGS and CGS layers, where the two layers share identical matric suction, and the permeability function can be shown in the SWCCs (Figure 3).
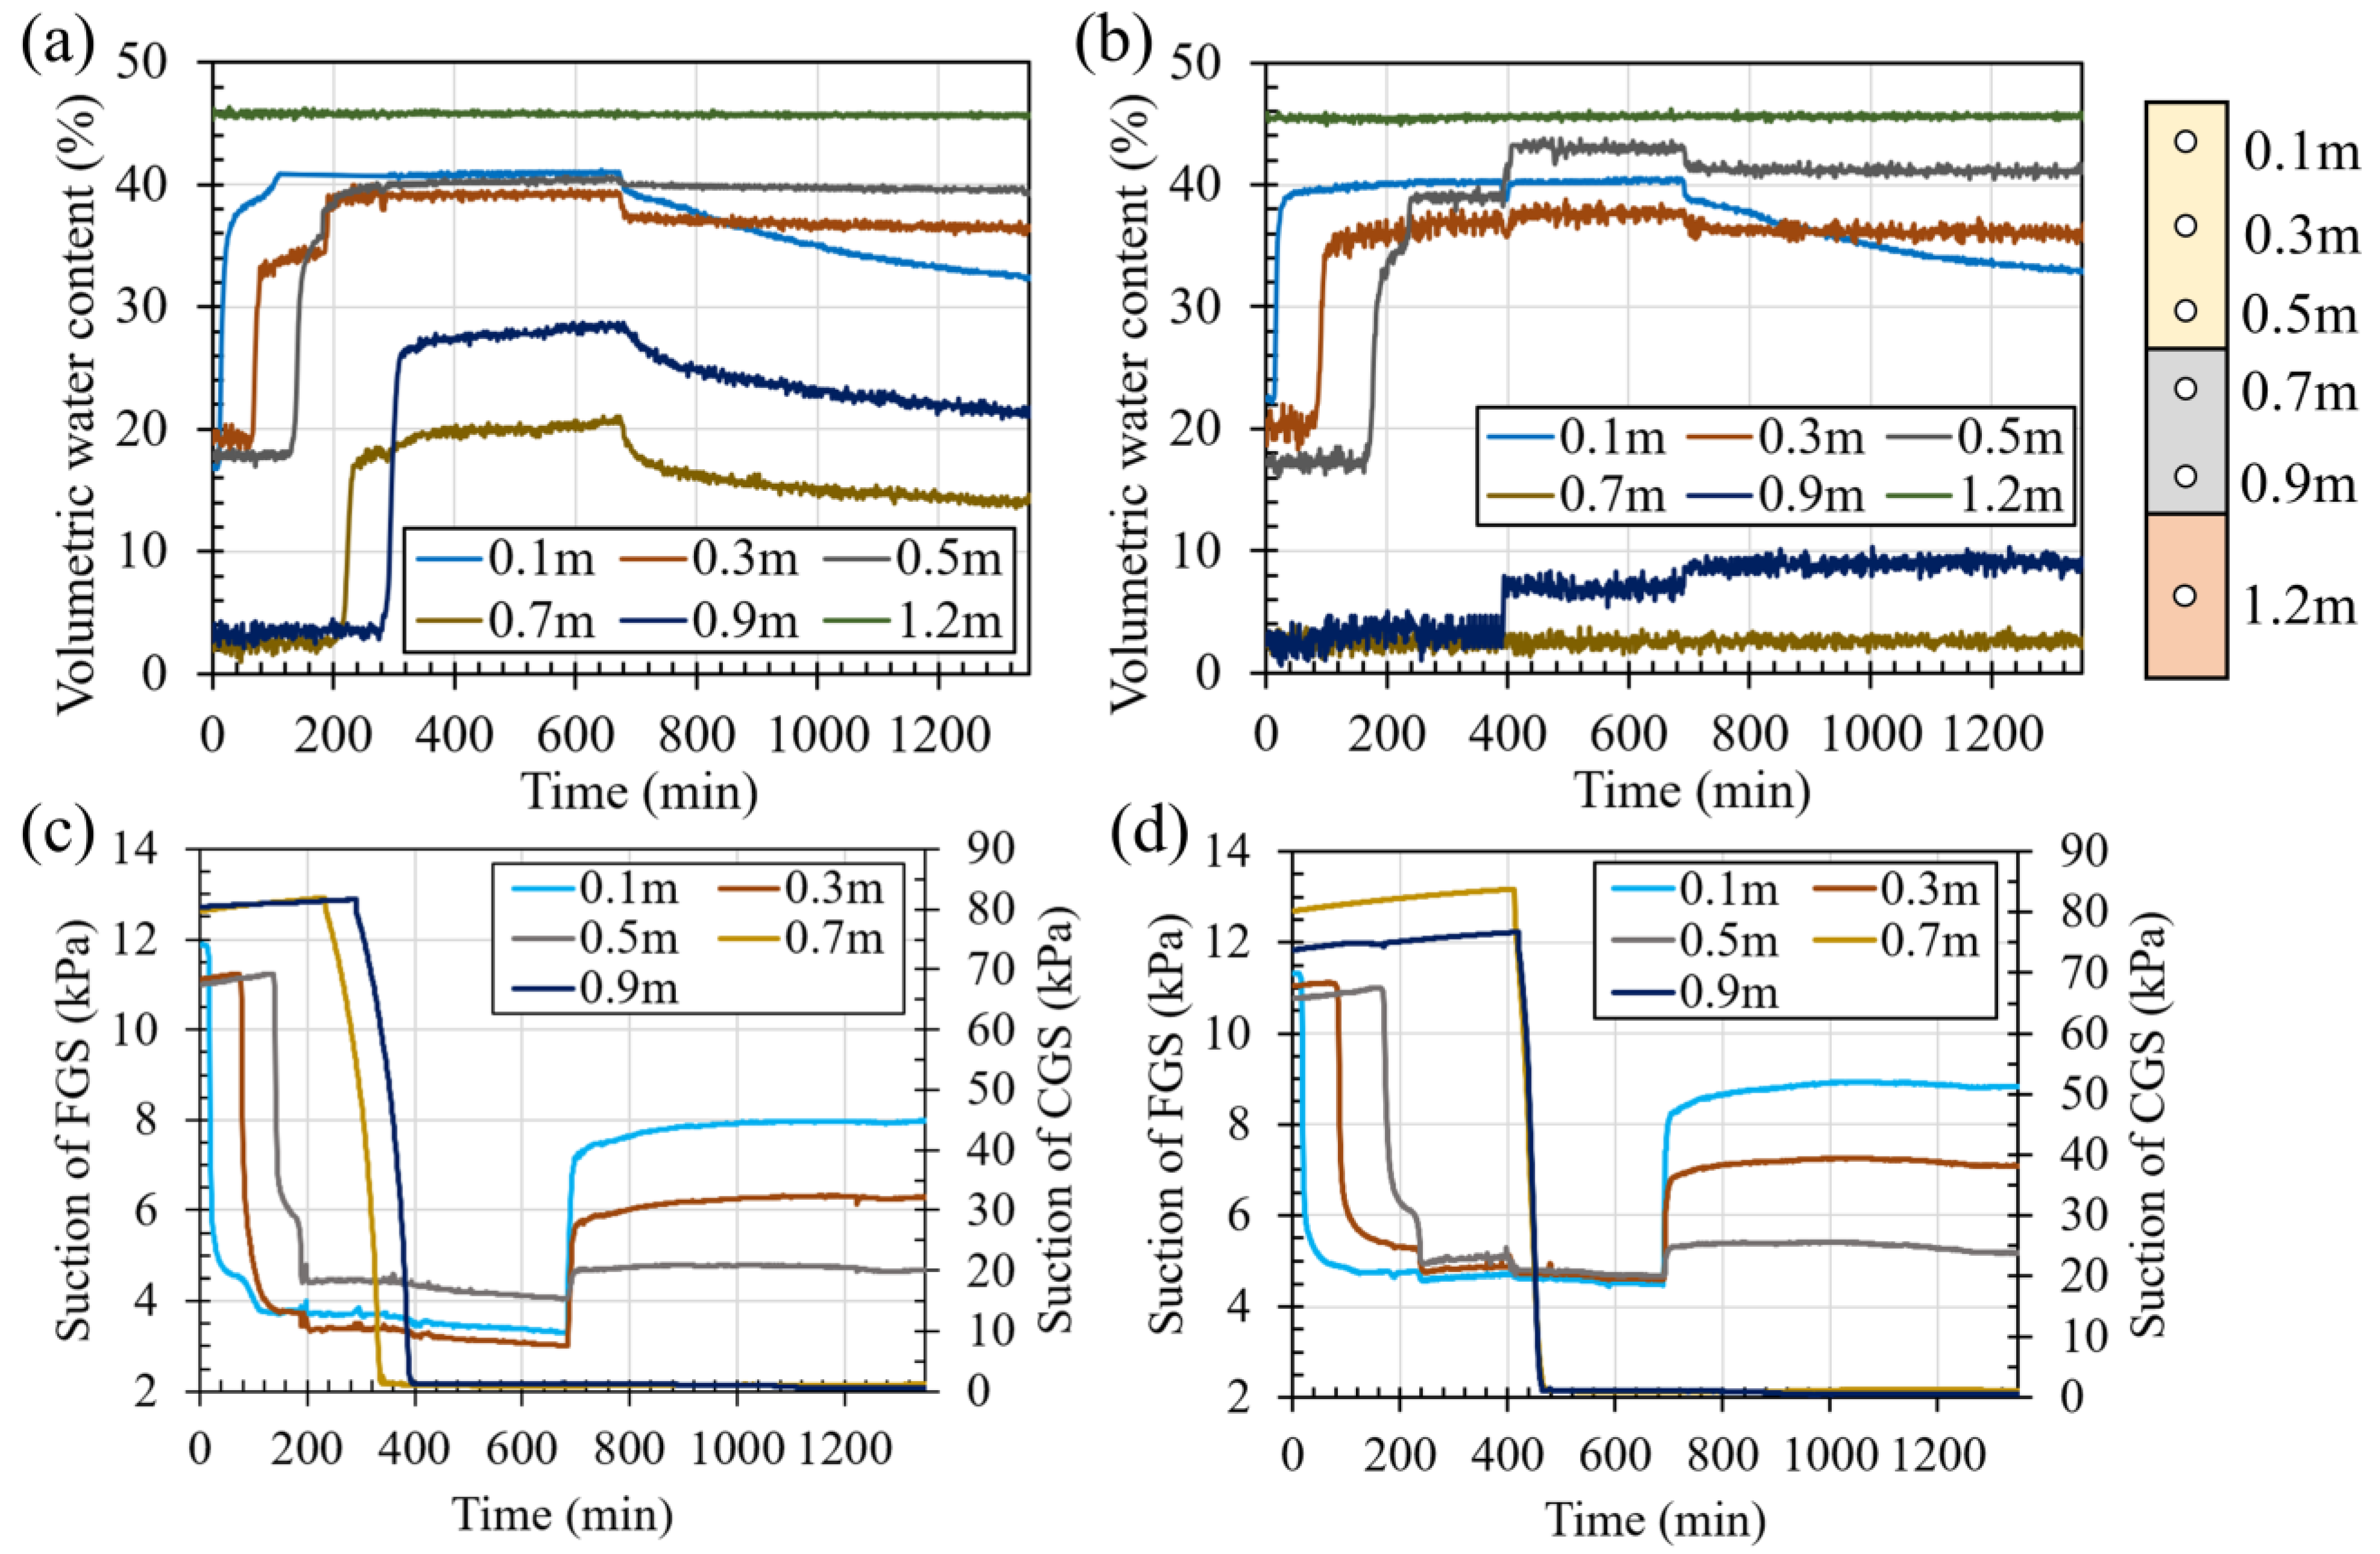
As rainfall began, the water content of the FGS layer increased from 20% to 41%, and the ψ of FGS decreased to 4 kPa, which was close to the AEV of FGS (Figure 3). The calculated k of the FGS layer was 2 × 10⁻⁶ m/s (Figure 4). The ψ of the CGS layer was 80 kPa (Figure 8c), and the k of CGS was below 1 × 10⁻¹⁸ m/s. Thus, water tended to be stored in the FGS layer and did not penetrate into the CGS layer (Figure 8a).
As water further infiltrated, no more storage capacity could be provided by the FGS layer, and the ψ at the FGS–CGS interface rapidly reached the WEV of the CGS layer (0.2 kPa), whereas water began to penetrate the CGS layer (Figure 3). At ψ = 0.2 kPa, the k of the CGS was 7.5 × 10⁻⁶ m/s (Figure 4), which allowed water into the CGS layer.
With continued precipitation, the water content of the CGS increased until plateau values were attained, i.e., from 20% to 30% along the depth of the layer. The CGS layer reached maximum water storage capacity (Figure 8a), and the additional water entering the CGS layer was laterally drained. At this moment, the ψ of the CGS layer ranged from 0.05 to 0.08 kPa (Figure 8c), and kCGS was close to the ksat, CGS.
After the rainfall stopped, under the action of gravity, the water in the FGS layer filtrated to the underlying CGS, causing a reduction in water content, particularly on the soil surface (from 40% to 32%). In the CGS layer, water was laterally drained, with water content decreasing to a range of 15–20%, where the corresponding matric suction reduced to a range of 0.06–0.09 kPa, a range far below the WEV of the CGS. The water break capability had not been restored.

3.4. Performance of the Coated Cover

The water-storage drainage process for the coated cover system was as follows: At 210 min, the water began to enter the CGS layer of uncoated cover, while the suction of the coated cover was still 75 kPa, corresponding to an equivalent k of less than 1 × 10⁻¹⁶ m/s. Rainwater could not enter the coated CGS layer and accumulated at the bottom of the FGS layer, as the water content increased from 36% to 39% at a depth of 0.5 m (Figure 8b). As rain continued to accumulate at the base of the FGS layer, lateral drainage occurred in the FGS layer from 250 to 390 min (Figure 7b), and the drainage rates (water volume divided by time) in the FGS layer sharply increased from 0 to 20.8 mm/h, which was the same as the infiltration rate (Figure 7b). The infiltrated rainwater had completely discharged through lateral drainage in the FGS layer during this time span.
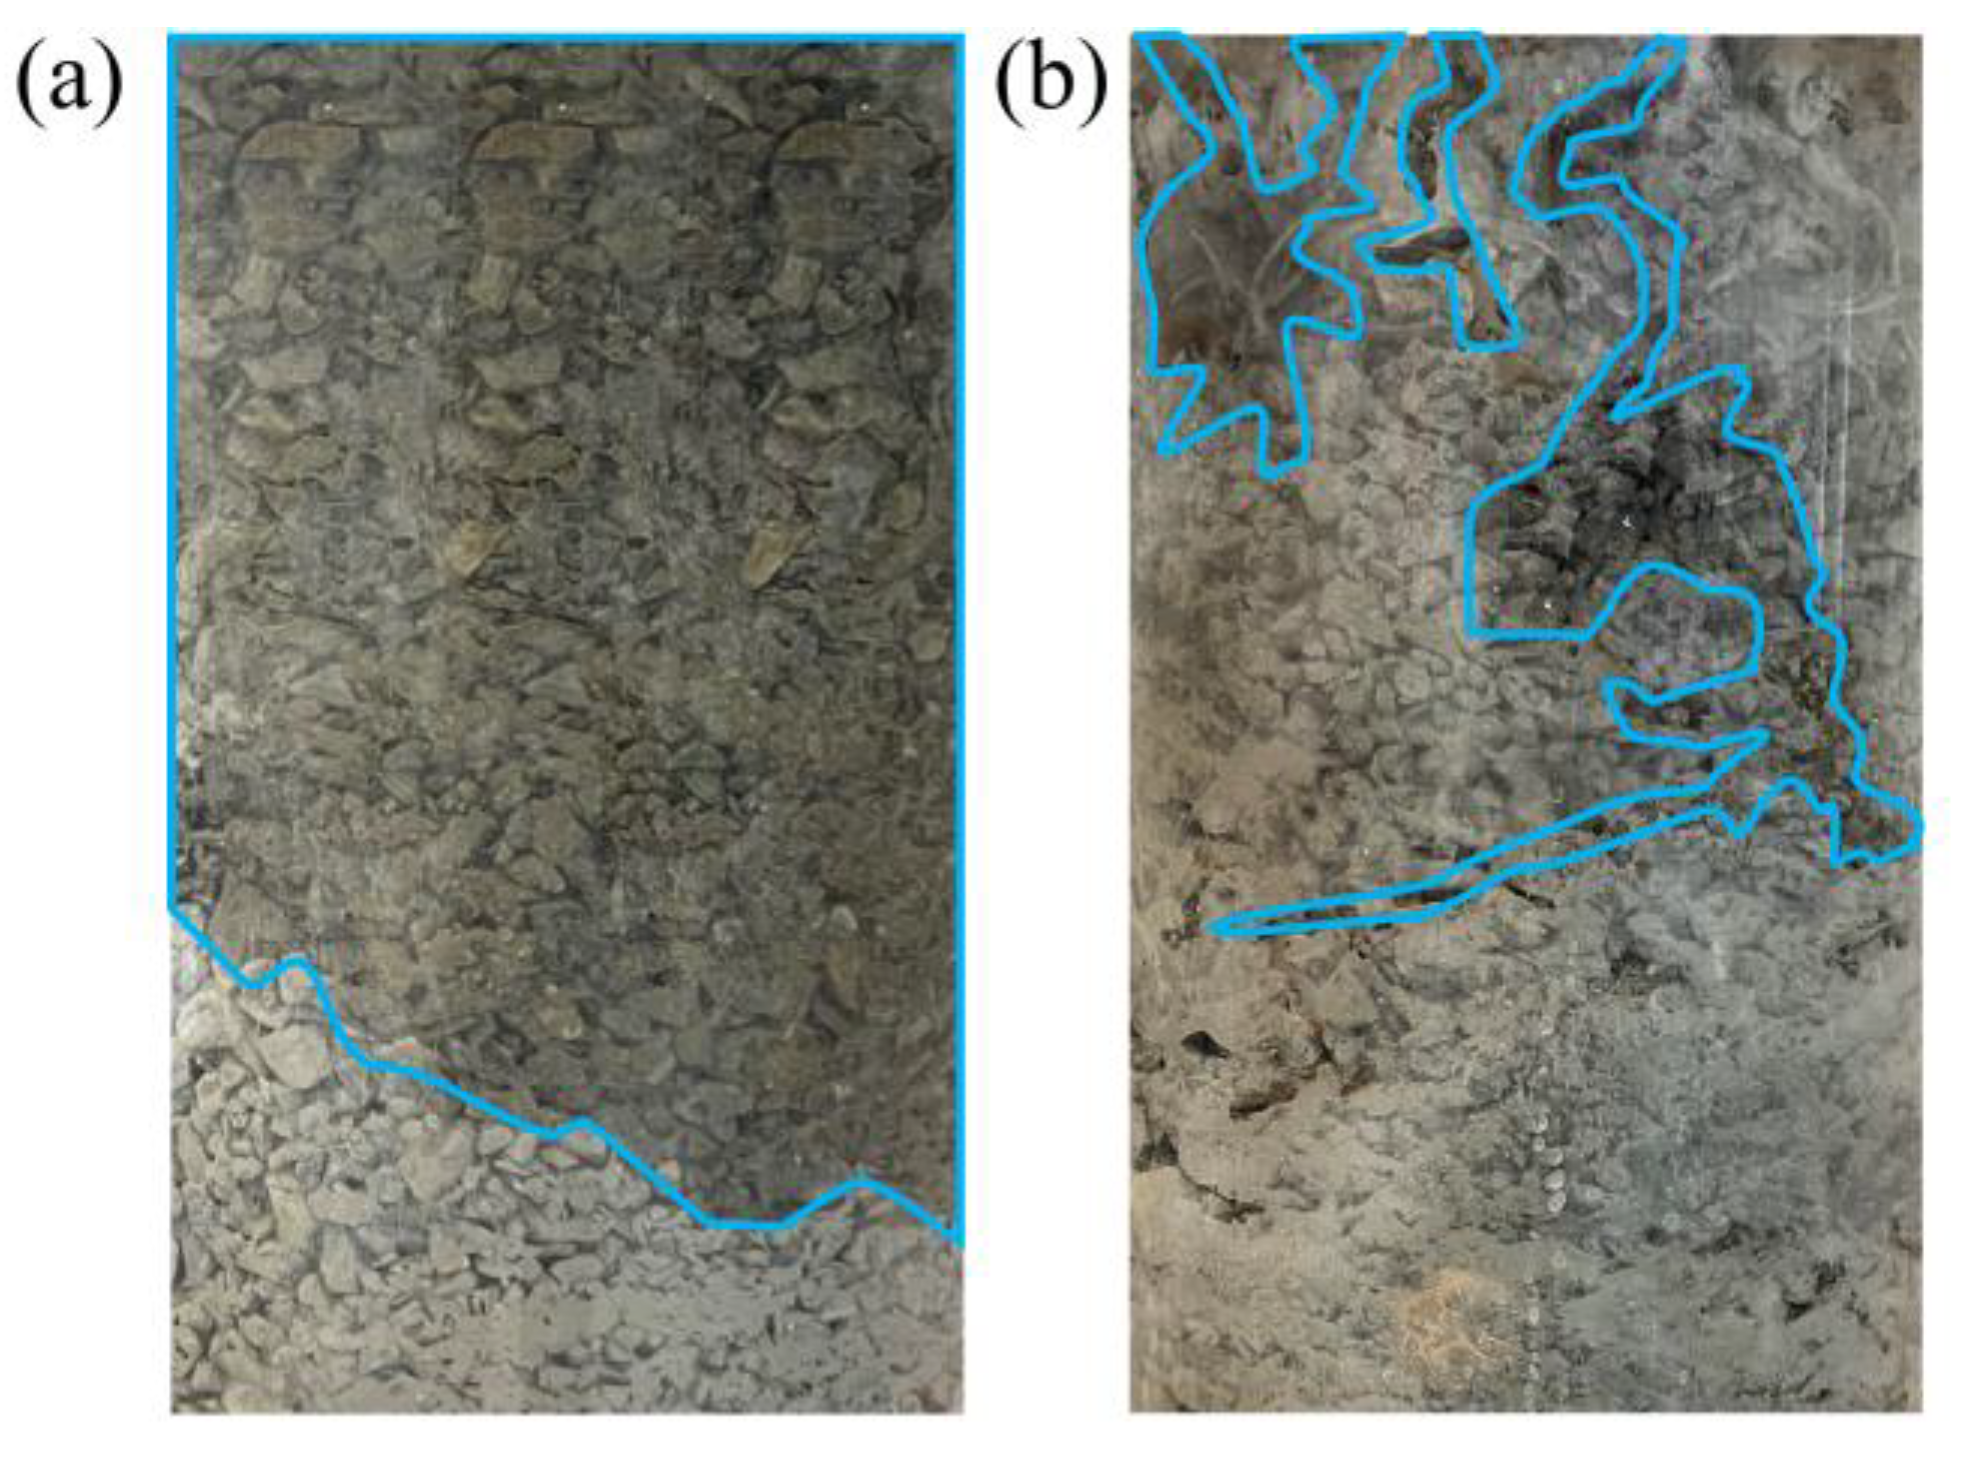
The water content at the depth of 0.5 m increased from 39% to 43% at 390 min (Figure 8b), and the lateral drainage rate in the FGS decreased sharply to 0 (Figure 7b), which may be caused by the blockage of lateral drainage hole alone in the acrylic column. The increase in water content caused the ψ at the FGS–CGS interface to decrease to the WEV of the coated CGS (−0.56 kPa) (Figure 8d). Rainwater broke through into the CGS layer, and the water content of CGS increased at a depth of 0.9 m. The invasion patterns of rainwater that penetrated the uncoated CGS layer formed a compact displacement flow, whereas those of the coated CGS layer formed an irregular finger-like flow that directly migrated to the bottom of the CGS layer (Figure 9).
At the end of the experiment, the measured percentages of surface runoff, lateral drainage in the FGS layer, lateral drainage in the CGS layer, and infiltration were 61%, 5%, 15%, and 0%, respectively. This gave a storage percentage in both FGS and CGS of 19%.

3.5. Chemical Speciation of the Collected Water Samples

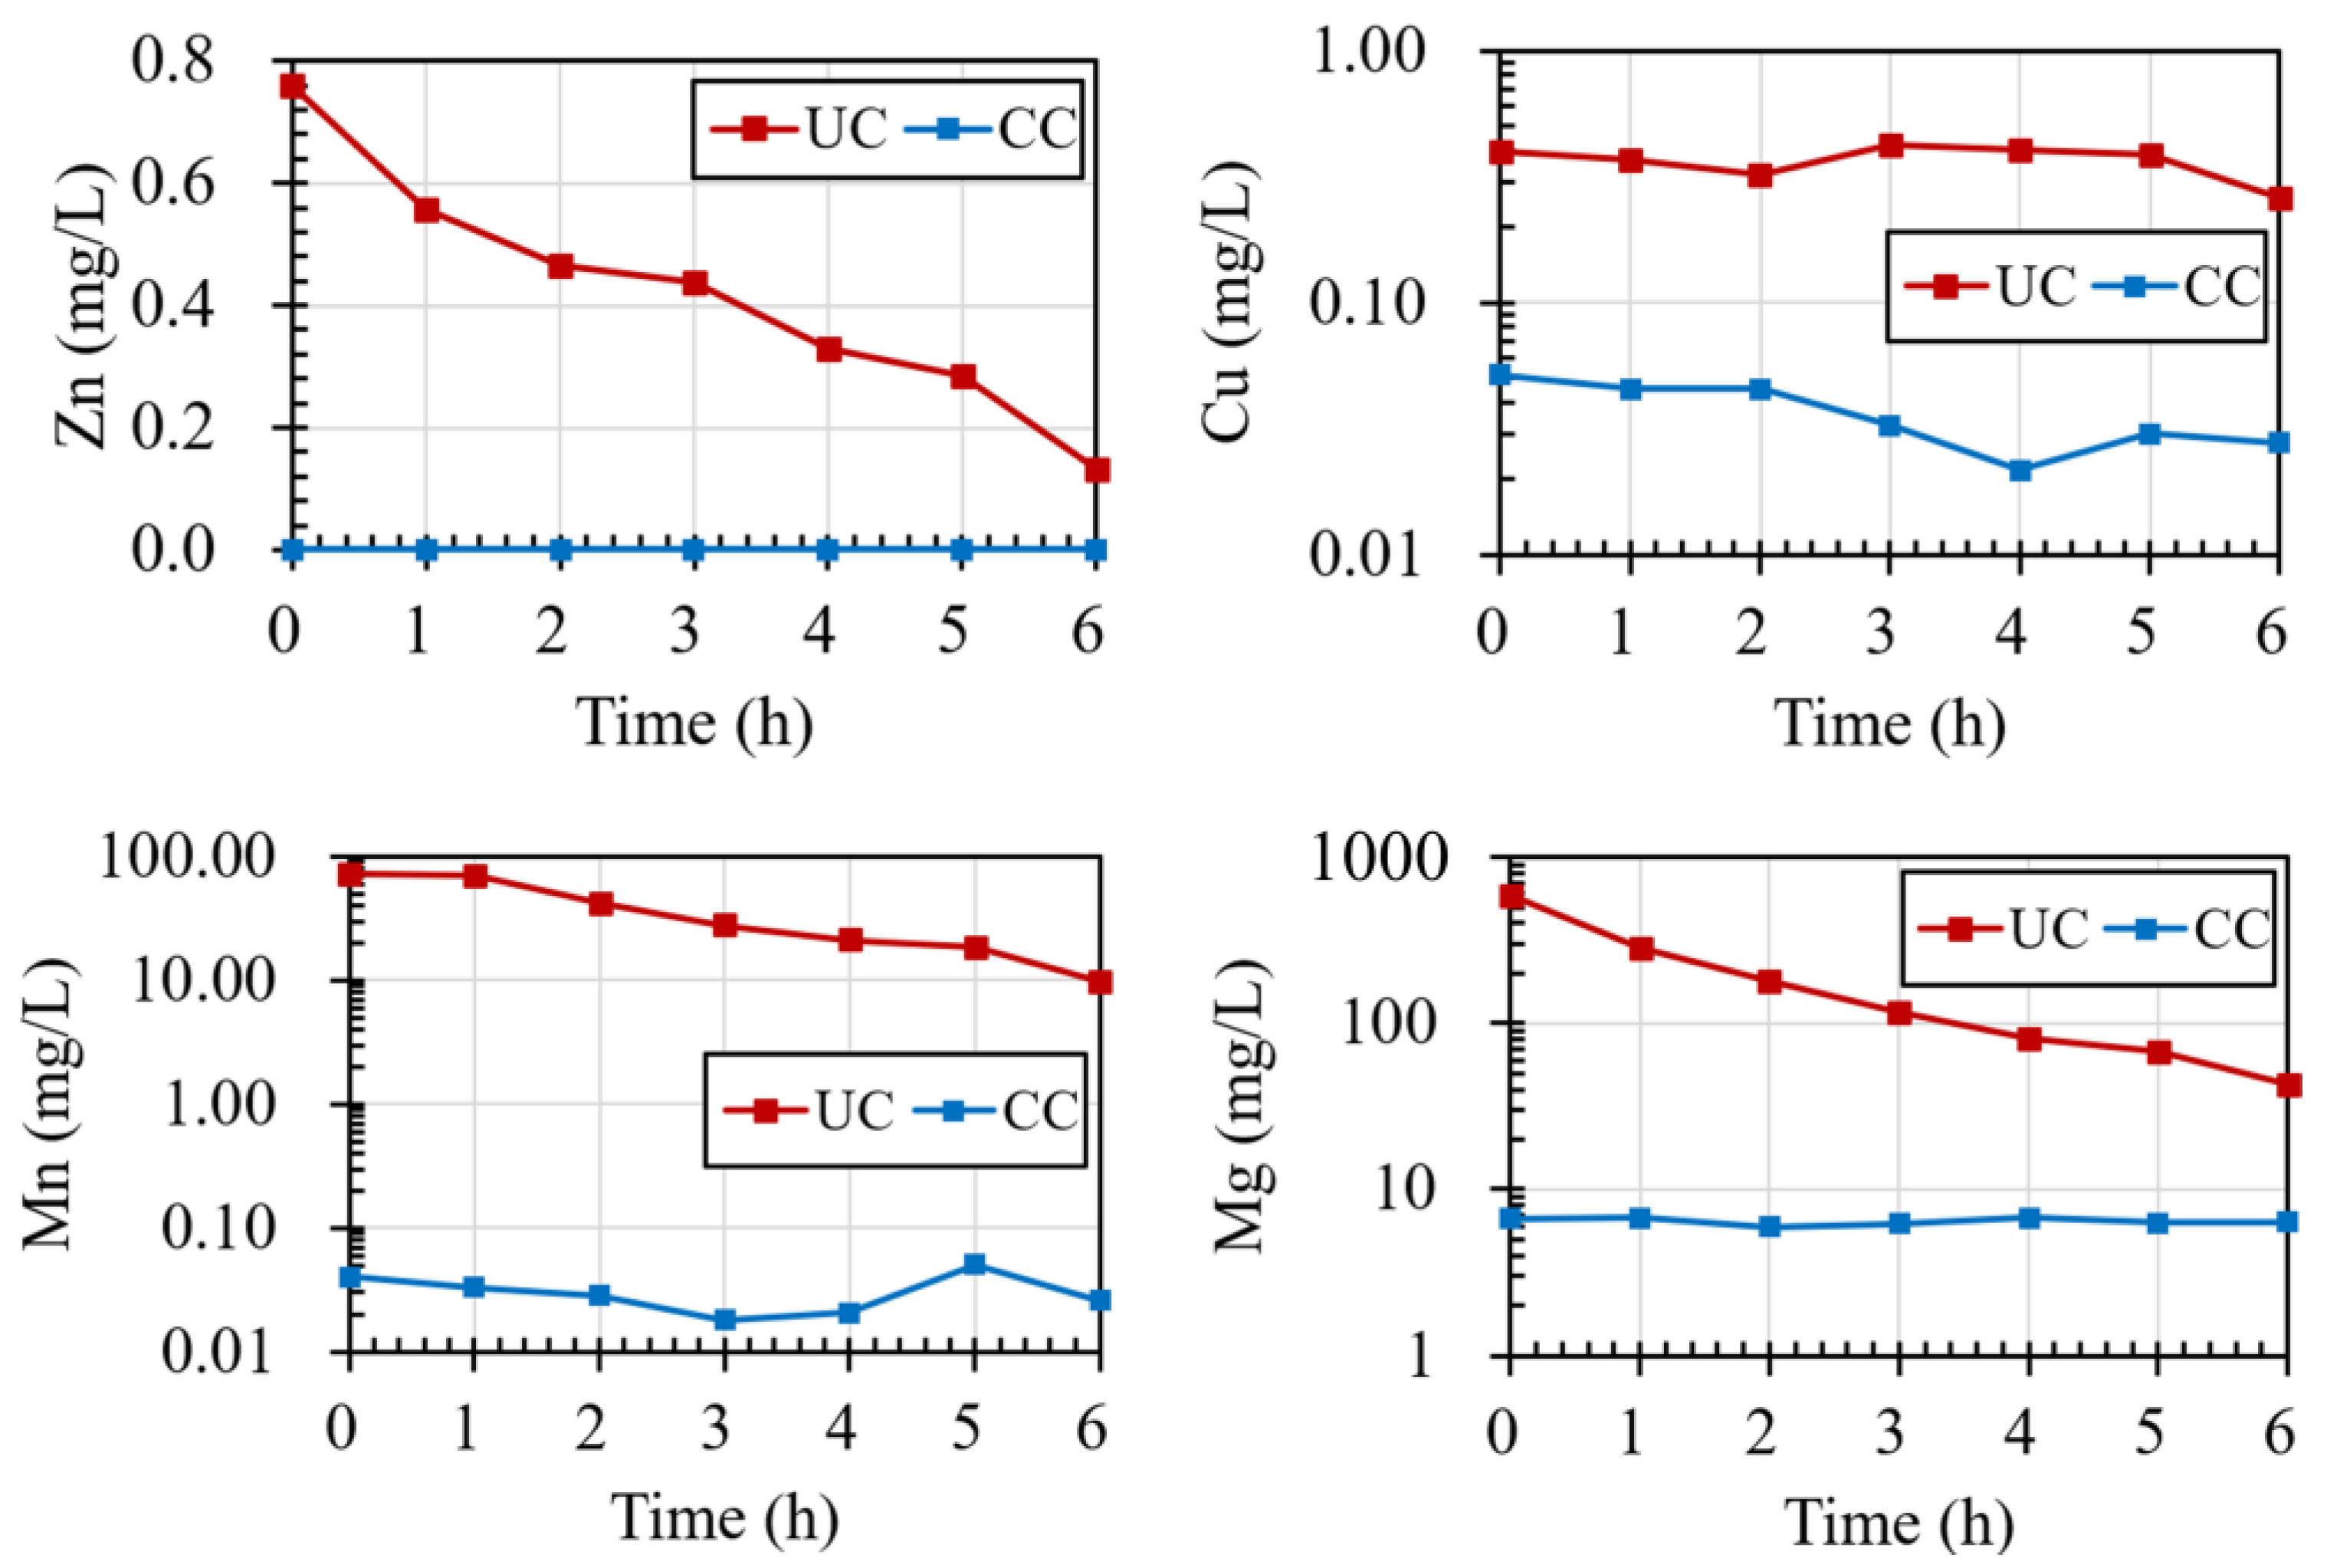
The concentrations of Cu2+, Mn2+, Zn2+, and Mg2+ in the drainage water are shown in Figure 10. The Fe2+ concentration was below the detection limit of the inductively coupled plasma (ICP). The Mn2+ and Mg2+ were mainly derived from the dissolution of carbonate minerals in the acidic environment formed by the reaction of pyrite with water. The initial concentrations of Mg2+ and Mn2+ were 73.5 and 590.5 mg/L, respectively; they gradually decreased to 9.8 and 43.2 mg/L at the 6th hour. This is because sulfide minerals (mainly pyrite) are oxidized by oxygen and water to produce sulfate and divalent iron. The divalent iron was unstable and was oxidized to ferric iron. Under neutral or alkaline conditions, the ferric iron produced a precipitate of iron hydroxide in situ, which adhered to the surface of the waste rock (Equation (2)), thereby preventing the oxidation of the sulfide and reducing the reaction rate, a process known as the self-passivation of pyrite [60,61]. It was also assumed that the reaction rate would be reduced by the disappearance of the fast-reacting fine particles [62]. The lack of acidic conditions prevented the dissolution of carbonate minerals and reduced the concentration of Mg2+ and Mn2+. This also explained why no Fe2+ was detected in the conductive drainage fluid, as Fe remained in the soil as precipitation (Equation (1)).
The pH of the drainage water from the uncoated CGS layer was approximately 8.5, which correlated with the water pollution discharge control requirements (6–9) and slightly decreased over time. The weak alkalinity of the drainage water was due to the carbonate minerals consuming the acid produced by sulfide oxidation to maintain the pH at a high value. This indicated that the tailings and waste rock contained sufficient carbonate to neutralize the acid produced by the oxidation of the sulfide minerals.
The Cu2+ and Zn2+ concentrations of the drainage water were relatively low, with Cu2+ concentrations around 0.4 mg/L, which did not fluctuate with time, and Zn2+ concentrations between 0.1 and 0.8 mg/L, which significantly decreased over time. As the main ionic component of AMD, it is necessary to consider the possibility of its emission polluting the environment. According to the Emission Standards of Pollutants for Copper, Nickel and Cobalt Industry (GB 25467-2010 [63]), Cu2+ below 1.0 mg/L and Zn2+ below 2.0 mg/L can be directly discharged; therefore, the use of raw materials from the mine to construct capillary cover in this study did not cause primary pollution to the environment. To avoid the lack of persuasion of the data due to the short drainage time, the waste rock was leached for 20 days at pH = 7, and the Cu2+ and Zn2+ concentrations were 0.16 and 0.46 mg/L, respectively, which were well below the standard limits.
Compared with the uncoated cover, the concentrations of Cu2+, Mn2+, and Mg2+ in the drainage water decreased by 1–3 orders of magnitude, with the concentrations of Cu2+ and Mn2+ both below 0.1 mg/L, and the Mg2+ concentration maintained between 6-7 mg/L, while the Zn2+ concentrations were below the ICP detection limit (Figure 10). Similarly, no Fe was detected. Unlike the UC column, the concentrations in the drainage from the CC column remained relatively stable over time.

4. Discussion

4.1. The Effect of Coated Waste Rock on the Geochemical Behavior of the Covers

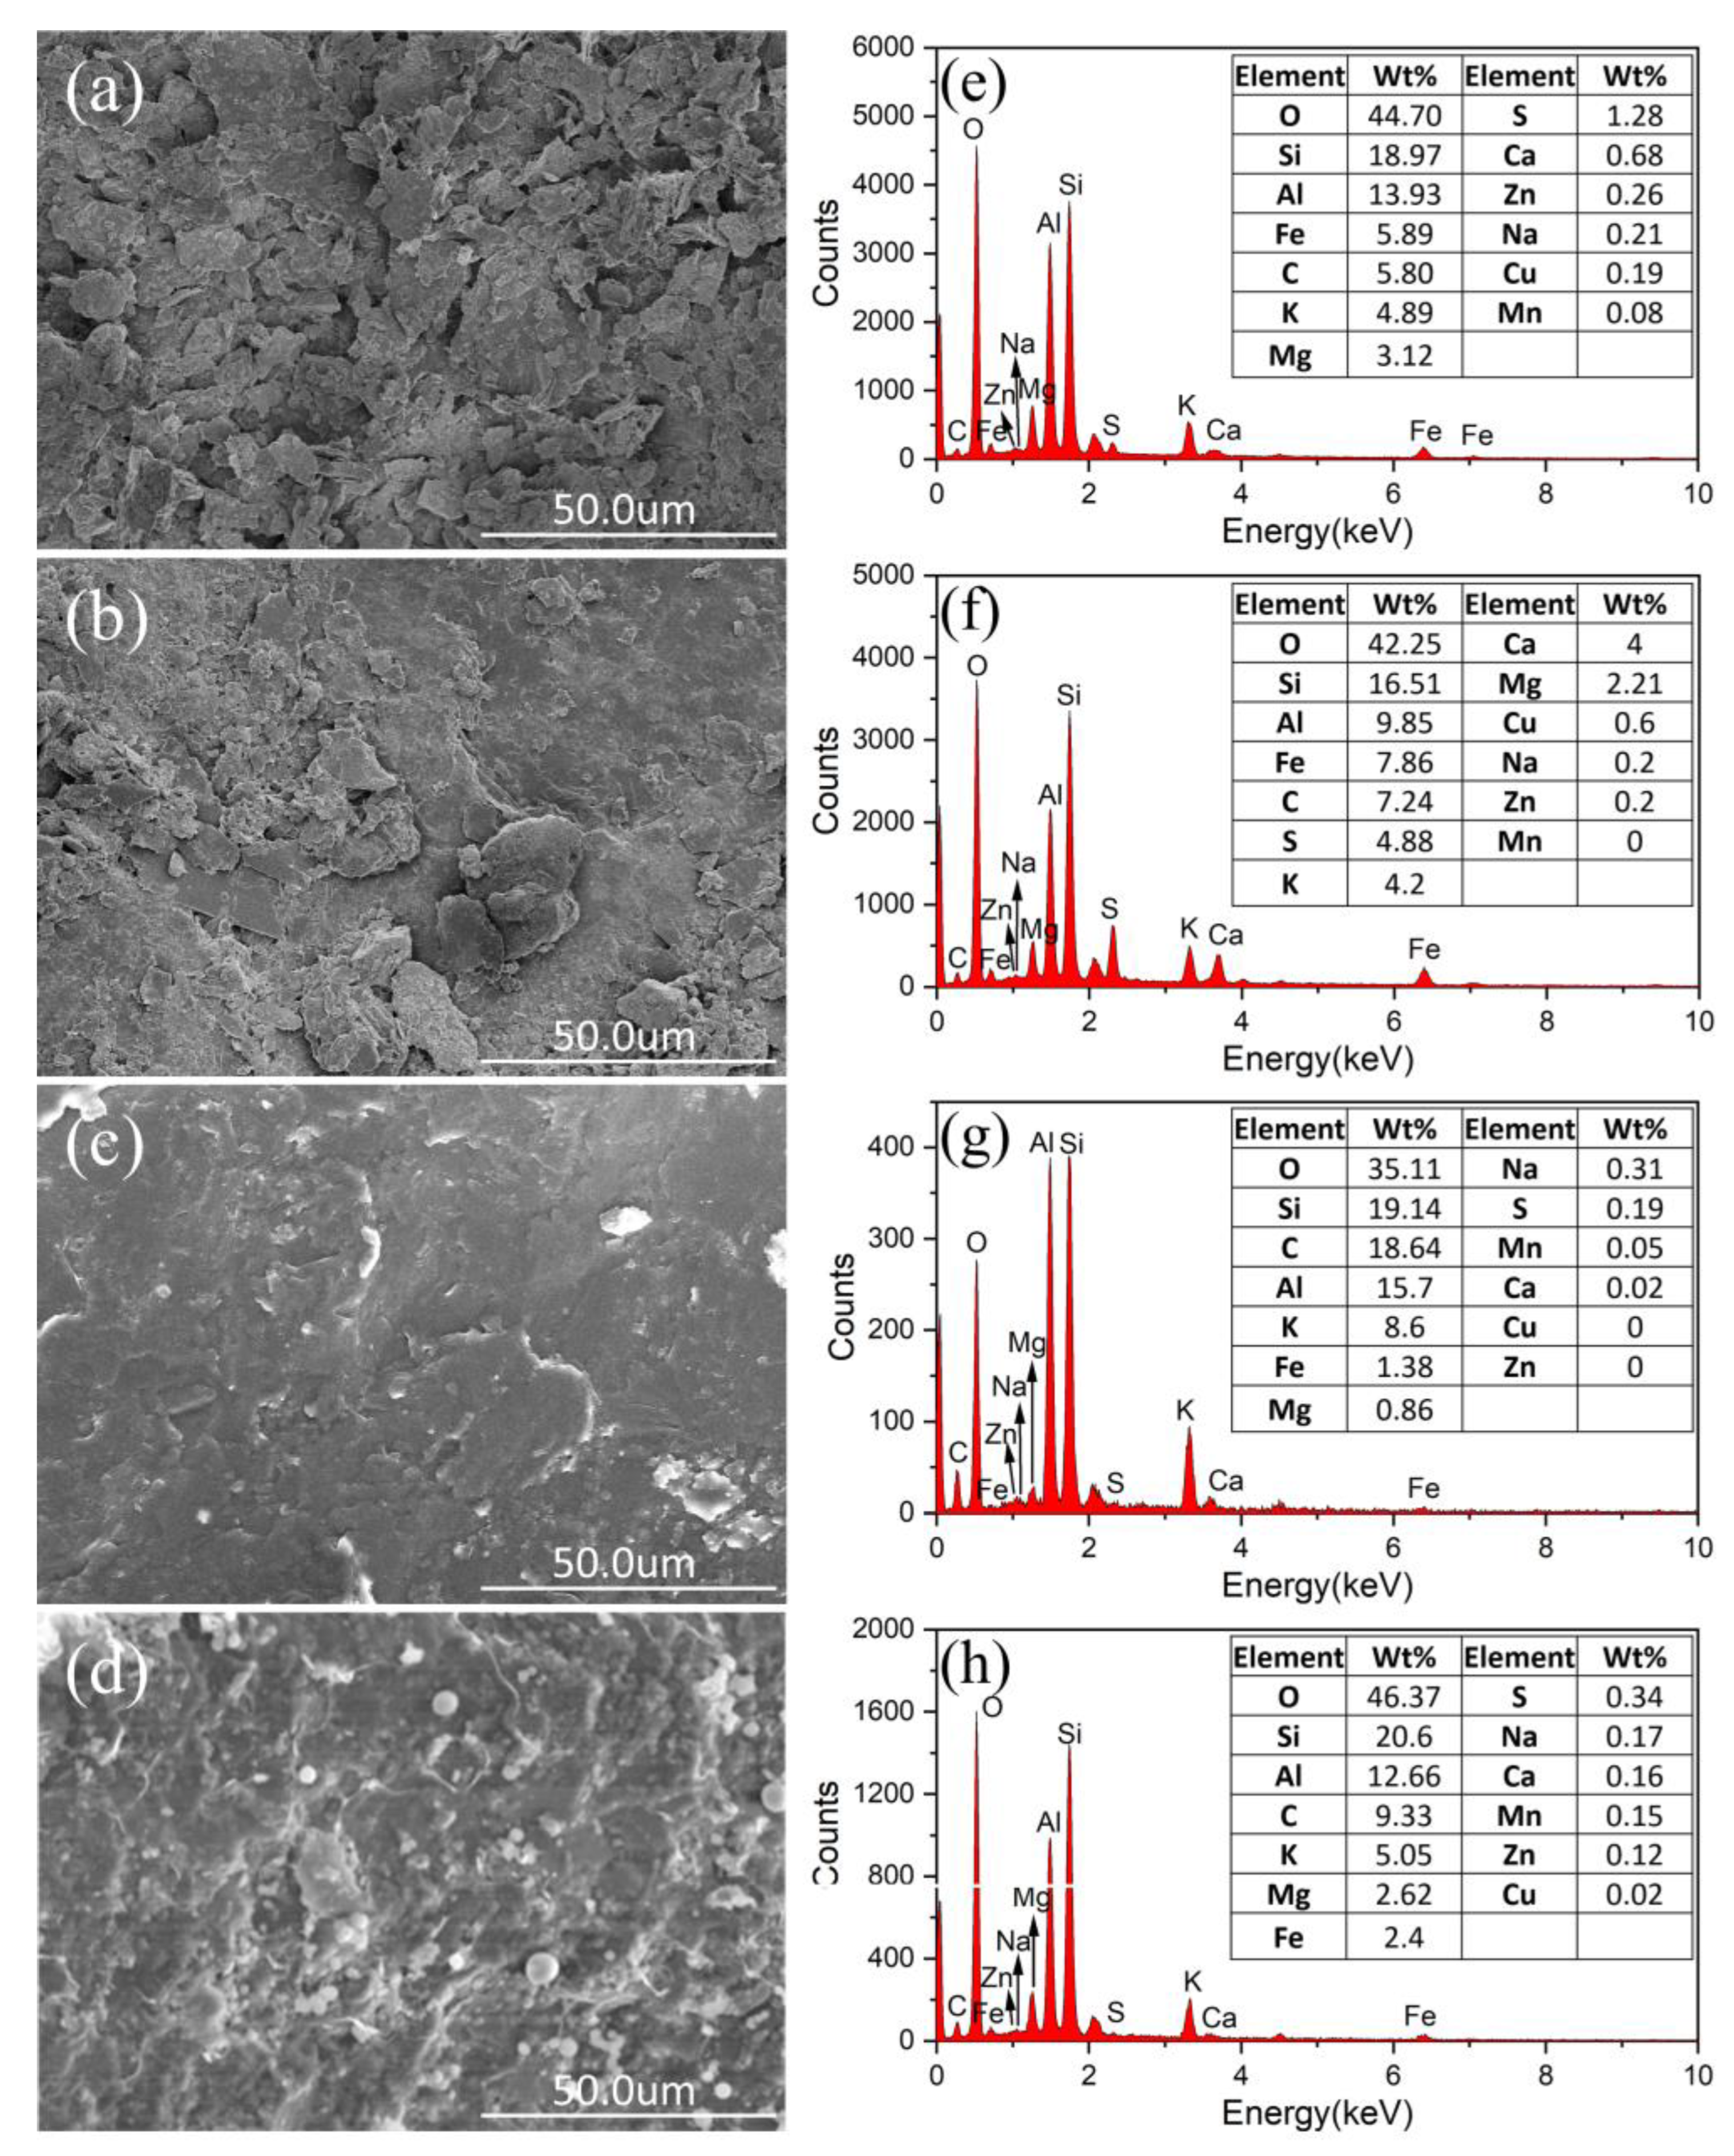
Before passivation, the surface of the waste rock was rough and uneven with noticeable flake-like protrusions (Figure 11a). After passivation, the surface of the waste rock became noticeably smoother with a rippled texture. Although there were still some protrusions, they were not as prominent (Figure 11c). This demonstrates that during the preparation process, the MTMS molecules successfully attached to the surface of the waste rock, forming a surface film with a certain thickness. After passivation, the C content increased by 12.84%. The weight ratio of O to Si decreased from 2.36 to 1.85, indicating that the total amount of O and Si elements tended to be similar after passivation (Figure 11a,c). The MTMS hydrolysis products is mainly composed of O, Si, and C (Equation (2)). Additionally, the contents of Fe and S are significantly decreased. This also confirmed the formation of MTMS passivated film on the surface of waste rock. Due to the hydrolysis of MTMS, which creates hydrophobic methyl functional groups (-CH3), the waste rock exhibits extreme hydrophobicity (CA = 170.1°, WDPT > 3600 s) [64]. This strong hydrophobicity reduced the contact of water with the waste rock surface, thereby limiting the oxidation of sulfide minerals and preventing the generation of acids and the dissolution of minerals. Concomitantly, hydrolyzed MTMS dimers can form a Si-O-Si network by linking other dimers (see Equation (3)) [65]. These can react with -OH on the surface of pyrite to create Fe-O-Si bonds, which stably adhere to the surface of the waste rock and form a smooth coating [38]. This provides a physical barrier to prevent the waste rock from coming into contact with water (Figure 11). This is the direct cause of the decrease in the concentration of various heavy metal elements (Figure 10). By testing the ion concentration in the drainage from FGS (Table 5), it was found that the ion concentration in the leachate from FGS was similar to that in the leachate from CGS, which also indicated that the passivation film isolated the contact between waste rock and water.
After rainfall, the surface of the waste rock remained uneven with flake-like protrusions; however, there were fewer protrusions compared to before the rainfall (Figure 11b). Through analysis of the lateral drainage ion concentration, it was speculated that this was due to the dissolution of carbonate minerals by rainwater. The surface of the coated waste rock after rainfall still had a rippled texture, which was rougher than before; however, no cracks or pores were observed, and the surface film remained intact (Figure 11d). Combined with the trend of ion concentration remaining stable over time, this indicates that the passivation film was not washed away by water in the short term.
The efficiency of the surface coating (Esc) in reducing metal concentrations drained from the CGS layer was calculated using the following equation [3]:
E sc ( % ) = 100 × ( 1 - M co M um )
where   M co and M un are the total elemental masses in the drainage water collected from the CGS layer of the coated and uncoated waste rocks. The Esc values of Cu, Mn, Zn, and Mg were 90.03%, 99.92%, 100.00%, and 96.69%, respectively. The waste rock coating treatment effectively inhibited heavy metal pollution in the drainage water.

4.2. The Effect of Coated Waste Rock on the Hydrogeological Behavior of the Covers

The increase in WEV of the coated waste rock caused a 180 min delay in rainwater entering the CGS layer from the FGS layer (from 210 min to 390 min). This led to rainwater accumulated at the bottom of the FGS layer and directly triggered the lateral drainage in it. Before the rainwater entered the CGS layer, the water storage capacity of the FGS layer in the UC column was 118 mm (0–210 min), while it was increased to 133 mm in the CC column, an increase of 15 mm (Figure 7). Using the three parameters of α, n, and m in the SWCC, the value of the maximum water storage capacity of the FGS was calculated as 138 mm using Equation (5) [66], which is close to the value observed in the CC column.
S c = θ r b + ( θ s - θ r )   0 b 1 + [ α ( z + h w * ) ] n m dz
where θ r   and θ s are the saturated and residual water contents, respectively; b is the total height of the fine soil; h w *   is the suction head at the interface between the FGS and CGS layers; and α , n, and m are the fitting parameters of the van Genuchten model.
The CA of coated waste rock increased from 13.2° to 170.1°, shifting from hydrophilic to extremely hydrophobic, which altered the invasion patterns of rainwater in the CGS (Figure 9). A similar phenomenon has also been reported by Movasat and Tomac [67]. This means that the passivation film reduces the flow channels in the CGS layer, lowering the probability of waste rock contacting rainwater. As a result, the saturation degree of the passivated CGS layer decreased, reducing its water storage capacity from 64 mm to 13 mm (Figure 7), an 80% decrease. The reduction in flow channels also explains why there was no change in water content measured by the sensor at a depth of 0.7 m (Figure 8b).
To sum up, passivation of MTMS can increase the hydrophobicity of the material, thereby increasing the WEV and causing an increase in water storage capacity of the FGS layer. It also delays the time for rainwater to enter the CGS layer, resulting in less contact between rainwater and the clay layer. Theoretically, increasing the WEV can continuously improve the water storage capacity of the FGS layer. If the water head corresponding to the WEV exceeds the thickness of the FGS layer, the FGS layer can reach a fully saturated state before percolation. This can be achieved by optimizing the passivation process or finding a more suitable passivating agent. Furthermore, passivation of MTMS fills the pores and cracks in the particles (Figure 11a–d), blocks the flow channel, reduces the pore space connectivity of the CGS, and also delays the time for rainwater to enter the CGS layer.

5. Conclusions

A one-dimensional soil-column model was constructed to investigate the performance of a three-layer capillary-barrier cover system constructed from raw materials from a mine site under humid climatic conditions. The water-barrier mechanism of the cover system was investigated through the MTMS passivation treatment of the CGS layer. In addition, the chemical composition of the lateral drainage was analyzed to evaluate the effect of the passivation treatment technology on the quality of the lateral drainage water. The following conclusions were drawn:
(1)
Under the condition of heavy rainfall experiment, both uncoated and coated covers exhibited zero leakage.
(2)
Compared with the uncovered cover layer, the MTMS coating increases the contact angle and WEV of the waste rock, delays rainwater entering the CGS layer for 180 min, and increases the water storage capacity of the FGS layer by 15 mm.
(3)
Through SEM-EDX testing of the surface morphology and elemental content of the waste rock before and after passivation, the surface of the coated waste rock is smoother and the Fe and S content is reduced, which reduces the potential for acid generation of the waste rock. The passivation film adheres well to the surface of the waste rock.
(4)
The water quality of the lateral drainage from the cover system constructed using raw materials from the mine met the discharge requirements. In addition, the passivation treatment technology reduced the concentration of heavy-metal ions in the lateral drainage by over 90%, which holds promises as regards environmental protection.

Supplementary Materials

The following supporting information can be downloaded at: https://www.mdpi.com/article/10.3390/su15086667/s1, Figure S1: Cover material: (a) tailing; (b)waste rock; (c) HDS clay. Figure S2: WDPT test: (a) waste rock; (b) coated waste rock. Figure S3: XRD pattern: (a) tailing; (2) HDS clay; (c) waste rock; (d) coated waste rock. Table S1: Data of grain size distribution curve (CGS). Table S2: Data of grain size distribution curve (HDS clay). Table S3: Data of grain size distribution curve (FGS).

Author Contributions

Conceptualization, L.X. and B.B.; Methodology, L.X. and B.B.; Validation, L.X.; Formal analysis, L.X. and B.B.; Investigation, L.X., J.C. and Y.Y.; Data curation, J.C.; Writing—original draft, L.X.; Writing—review & editing, J.C., Y.Y., H.Z., L.Z. and B.B. All authors have read and agreed to the published version of the manuscript.

Funding

This research was funded by [the Ministry of Science and Technology of China] grant number [2019YFC1805002], [the National natural Science Foundation of China] grant number [42177118, 51779219], [the Basic Science Center Program for Multiphase Evolution in Hypergravity of the National Natural Science Foundation of China] grant number [51988101], and [Overseas Expertise Introduction Center for Discipline Innovation] grant number [B18407].

Institutional Review Board Statement

Not applicable.

Informed Consent Statement

Not applicable.

Data Availability Statement

Data sharing not applicable.

Acknowledgments

We would like to express our sincere gratitude to the anonymous reviewers for their feedback and constructive criticism, which have greatly improved the quality of this manuscript. We would also like to acknowledge the contributions of all those who have supported throughout this research project.

Conflicts of Interest

The authors declare no conflict of interest.

References

  1. Park, I.; Tabelin, C.B.; Jeon, S.; Li, X.; Seno, K.; Ito, M.; Hiroyoshi, N. A review of recent strategies for acid mine drainage prevention and mine tailings recycling. Chemosphere 2019, 219, 588–606. [Google Scholar] [CrossRef] [PubMed]
  2. Albright, W.H.; Benson, C.H.; Gee, G.W.; Roesler, A.C.; Abichou, T.; Apiwantragoon, P.; Lyles, B.F.; Rock, S.A. Field water balance of landfill final covers. J. Environ. Qual. 2004, 33, 2317–2332. [Google Scholar] [CrossRef] [PubMed]
  3. Bussière, B.; Benzaazoua, M.; Aubertin, M.; Mbonimpa, M. A laboratory study of covers made of low-sulphide tailings to prevent acid mine drainage. Environ. Geol. 2004, 45, 609–622. [Google Scholar] [CrossRef]
  4. Aubertin, M.; Cifuentes, E.; Apithy, S.A.; Bussiere, B.; Molson, J.; Chapuis, R.P. Analyses of water diversion along inclined covers with capillary barrier effects. Can. Geotech. J. 2009, 46, 1146–1164. [Google Scholar] [CrossRef]
  5. Sinnathamby, G.; Phillips, D.H.; Sivakumar, V.; Paksy, A. Landfill cap models under simulated climate change precipitation: Impacts of cracks and root growth. Géotechnique 2014, 64, 95–107. [Google Scholar] [CrossRef] [Green Version]
  6. Jian-yong, S.; Xue-de, Q.; Yue-bing, Z. Experimental methods for interface behaviors of geosynthetics in landfills. Chin. J. Geotech. Eng. 2010, 32, 688–692. [Google Scholar]
  7. Albright, W.H.; Benson, C.H.; Gee, G.W.; Abichou, T.; McDonald, E.V.; Tyler, S.W.; Rock, S.A. Field performance of a compacted clay landfill final cover at a humid site. J. Geotech. Geoenviron. Eng. 2006, 132, 1393–1403. [Google Scholar] [CrossRef]
  8. Ng, C.W.; Chen, R.; Coo, J.L.; Liu, J.; Ni, J.; Chen, Y.M.; Zhan, L.-T.; Guo, H.W.; Lu, B.W. A novel vegetated three-layer landfill cover system using recycled construction wastes without geomembrane. Can. Geotech. J. 2019, 56, 1863–1875. [Google Scholar] [CrossRef]
  9. O’kane, M.; Wilson, G.; Barbour, S. Instrumentation and monitoring of an engineered soil cover system for mine waste rock. Can. Geotech. J. 1998, 35, 828–846. [Google Scholar] [CrossRef]
  10. Yanful, E.K.; Simms, P.H.; Payant, S.C. Soil covers for controlling acid generation in mine tailings: A laboratory evaluation of the physics and geochemistry. Water Air Soil Pollut. 1999, 114, 347–375. [Google Scholar] [CrossRef]
  11. Morris, C.E.; Stormont, J.C. Parametric study of unsaturated drainage layers in a capillary barrier. J. Geotech. Geoenvironmental Eng. 1999, 125, 1057–1065. [Google Scholar] [CrossRef] [Green Version]
  12. Argunhan-Atalay, C.; Yazicigil, H. Modeling and performance assessment of alternative cover systems on a waste rock storage area. Mine Water Environ. 2018, 37, 106–118. [Google Scholar] [CrossRef]
  13. Apiwantragoon, P.; Benson, C.H.; Albright, W.H. Field Hydrology of Water Balance Covers for Waste Containment. J. Geotech. Geoenviron. Eng. 2015, 141, 04014101. [Google Scholar] [CrossRef] [Green Version]
  14. Ng, C.W.; Liu, J.; Chen, R.; Xu, J. Physical and numerical modeling of an inclined three-layer (silt/gravelly sand/clay) capillary barrier cover system under extreme rainfall. Waste Manag. 2015, 38, 210–221. [Google Scholar] [CrossRef]
  15. Chen, R.; Huang, J.; Leung, A.K.; Chen, Z.; Chen, Z. Experimental investigation on water release and gas emission of evapotranspirative capillary barrier landfill covers. Soil Sci. Soc. Am. J. 2022, 86, 311–323. [Google Scholar] [CrossRef]
  16. Zheng, S.; Xing, X.; Lourenço, S.D.; Cleall, P.J. Cover systems with synthetic water-repellent soils. Vadose Zone J. 2021, 20, e20093. [Google Scholar] [CrossRef]
  17. Lourenço, S.; Jones, N.; Morley, C.; Doerr, S.; Bryant, R. Hysteresis in the soil water retention of a sand–clay mixture with contact angles lower than ninety degrees. Vadose Zone J. 2015, 14, vzj2014.07.0088. [Google Scholar] [CrossRef]
  18. Wijewardana, N.S.; Kawamoto, K.; Moldrup, P.; Komatsu, T.; Kurukulasuriya, L.C.; Priyankara, N.H. Characterization of water repellency for hydrophobized grains with different geometries and sizes. Environ. Earth Sci. 2015, 74, 5525–5539. [Google Scholar] [CrossRef]
  19. Subedi, S.; Kawamoto, K.; Jayarathna, L.; Vithanage, M.; Moldrup, P.; de Jonge, L.W.; Komatsu, T. Characterizing time-dependent contact angles for sands hydrophobized with oleic and stearic acids. Vadose Zone J. 2012, 11, vzj2011-0055. [Google Scholar] [CrossRef]
  20. Bardet, J.-P.; Jesmani, M.; Jabbari, N. Permeability and compressibility of wax-coated sands. Géotechnique 2014, 64, 341–350. [Google Scholar] [CrossRef] [Green Version]
  21. Chan, C.S.H.; Lourenço, S.D.N. Comparison of three silane compounds to impart water repellency in an industrial sand. Géotechnique Lett. 2016, 6, 263–266. [Google Scholar] [CrossRef] [Green Version]
  22. Ng, S.; Lourenço, S. Conditions to induce water repellency in soils with dimethyldichlorosilane. Géotechnique 2016, 66, 441–444. [Google Scholar] [CrossRef] [Green Version]
  23. Lamparter, A.; Bachmann, J.; Goebel, M.-O.; Woche, S. Carbon mineralization in soil: Impact of wetting–drying, aggregation and water repellency. Geoderma 2009, 150, 324–333. [Google Scholar] [CrossRef]
  24. Bachmann, J.; Woche, S.; Goebel, M.O.; Kirkham, M.; Horton, R. Extended methodology for determining wetting properties of porous media. Water Resour. Res. 2003, 39. [Google Scholar] [CrossRef]
  25. Dell’Avanzi, E.; Guizelini, A.; Da Silva, W.; Nocko, L.; Buzzi, O. Potential Use of Induced Soil-Water Repellency Techniques to Improve the Performance of Landfill’s Alternative Final Cover Systems; CRC Press: Boca Raton, FL, USA, 2010. [Google Scholar]
  26. Rahardjo, H.; Santoso, V.; Leong, E.; Ng, Y.; Tam, C.; Satyanaga, A. Use of recycled crushed concrete and Secudrain in capillary barriers for slope stabilization. Can. Geotech. J. 2013, 50, 662–673. [Google Scholar] [CrossRef]
  27. Boulanger-Martel, V.; Bussière, B.; Côté, J.; Mbonimpa, M. Influence of freeze–thaw cycles on the performance of covers with capillary barrier effects made of crushed rock–bentonite mixtures to control oxygen migration. Can. Geotech. J. 2016, 53, 753–764. [Google Scholar] [CrossRef]
  28. Nason, P.; Jia, Y.; Maurice, C.; Alakangas, L.; Öhlander, B. Biodegradation of biosolids under aerobic conditions: Implications for cover materials for sulfide mine tailings remediation. Mine Water Environ. 2016, 35, 273–282. [Google Scholar] [CrossRef]
  29. Hey, C.; Simms, P. Preliminary assessment of biosolids in covers with capillary barrier effects. Eng. Geol. 2021, 280, 105973. [Google Scholar] [CrossRef]
  30. Kabambi, A.K.; Bussiere, B.; Demers, I. Hydrogeological Behaviour of Covers with Capillary Barrier Effects Made of Mining Materials. Geotech. Geol. Eng. 2017, 35, 1199–1220. [Google Scholar] [CrossRef]
  31. Larochelle, C.G.; Bussière, B.; Pabst, T. Acid-generating waste rocks as capillary break layers in covers with capillary barrier effects for mine site reclamation. Water Air Soil Pollut. 2019, 230, 57. [Google Scholar] [CrossRef]
  32. Duchesne, J.; Doye, I. Effectiveness of covers and liners made of red mud bauxite and/or cement kiln dust for limiting acid mine drainage. J. Environ. Eng. 2005, 131, 1230–1235. [Google Scholar] [CrossRef]
  33. Mollamahmutoğlu, M.; Yilmaz, Y. Potential use of fly ash and bentonite mixture as liner or cover at waste disposal areas. Environ. Geol. 2001, 40, 1316–1324. [Google Scholar] [CrossRef]
  34. Soares, A.B.; Ubaldo, M.d.O.; de Souza, V.P.; Moreira Soares, P.S.; Barbosa, M.C.; Mendonça, R.M.G. Design of a Dry Cover Pilot Test for Acid Mine Drainage Abatement in Southern Brazil. I: Materials Characterization and Numerical Modeling. Mine Water Environ. 2009, 28. [Google Scholar] [CrossRef]
  35. Dublet-Adli, G.; Pabst, T.; Okkenhaug, G.; Sætre, C.; Vårheim, A.; Tvedten, M.; Gelena, S.; Smebye, A.; Kvennås, M.; Breedveld, G. Valorisation of Partially Oxidized Tailings in a Cover System to Reclaim an Old Acid Generating Mine Site. Minerals 2021, 11, 987. [Google Scholar] [CrossRef]
  36. Hosseini, M.; Karapanagiotis, I. Materials with Extreme Wetting Properties: Methods and Emerging Industrial Applications; Springer Nature: Berlin/Heidelberg, Germany, 2021. [Google Scholar]
  37. Saulick, Y.; Lourenço, S.D.; Baudet, B.A. Optimising the hydrophobicity of sands by silanisation and powder coating. Géotechnique 2021, 71, 250–259. [Google Scholar] [CrossRef]
  38. Dong, Y.; Zeng, W.; Lin, H.; He, Y. Preparation of a novel water-soluble organosilane coating and its performance for inhibition of pyrite oxidation to control acid mine drainage at the source. Appl. Surf. Sci. 2020, 531, 147328. [Google Scholar] [CrossRef]
  39. Chau, H.W.; Biswas, A.; Vujanovic, V.; Si, B.C. Relationship between the severity, persistence of soil water repellency and the critical soil water content in water repellent soils. Geoderma 2014, 221, 113–120. [Google Scholar] [CrossRef]
  40. Hewelke, E.; Gozdowski, D.; Korc, M.; Małuszyńska, I.; Górska, E.B.; Sas, W.; Mielnik, L. Influence of soil moisture on hydrophobicity and water sorptivity of sandy soil no longer under agricultural use. Catena 2022, 208, 105780. [Google Scholar] [CrossRef]
  41. Zheng, S.; Lourenço, S.D.; Cleall, P.J.; Chui, T.F.M.; Ng, A.K.; Millis, S.W. Hydrologic behavior of model slopes with synthetic water repellent soils. J. Hydrol. 2017, 554, 582–599. [Google Scholar] [CrossRef]
  42. Doerr, S.H. On standardizing the ‘water drop penetration time’and the ‘molarity of an ethanol droplet’techniques to classify soil hydrophobicity: A case study using medium textured soils. Earth Surf. Process. Landf. J. Br. Geomorphol. Group 1998, 23, 663–668. [Google Scholar] [CrossRef]
  43. ASTM D422; Standard Test Method for Particle-Size Analysis of Soils. ASTM International: West Conshohocken, PA, USA, 2007.
  44. ASTM D854-14; Standard Test Methods for Specific Gravity of Soil Solids by Water Pycnometer. ASTM International: West Conshohocken, PA, USA, 2014.
  45. ASTM D4318; Standard Test Methods for Liquid Limit, Plastic Limit, and Plasticity Index of Soils. ASTM International: West Conshohocken, PA, USA, 2017.
  46. ASTM D698; Standard Test Methods for Laboratory Compaction Characteristics of Soil Using Standard Effort. ASTM International: West Conshohocken, PA, USA, 2021.
  47. ASTM D5084-16a; Standard Test Methods for Measurement of Hydraulic Conductivity of Saturated Porous Materials Using a Flexible Wall Permeameter. ASTM International: West Conshohocken, PA, USA, 2016.
  48. ASTM D2434-22; Standard Test Method for Permeability of Granular Soils (Constant Head). ASTM International: West Conshohocken, PA, USA, 2022.
  49. Bate, B.; Nie, S.; Chen, Z.; Zhang, F.; Chen, Y. Construction of soil–water characteristic curve of granular materials with toroidal model and artificially generated packings. Acta Geotech. 2021, 16, 1949–1960. [Google Scholar] [CrossRef]
  50. Wang, Z.; Wu, L.; Wu, Q. Water-entry value as an alternative indicator of soil water-repellency and wettability. J. Hydrol. 2000, 231, 76–83. [Google Scholar] [CrossRef]
  51. Rahardjo, H.; Tami, D.; Leong, E. Effectiveness of sloping capillary barriers under high precipitation rates. In Proceedings of the 2nd International Conference on Problematic Soils, Petaling Jaya, Malaysia, 3–6 December 2006; pp. 3–5. [Google Scholar]
  52. Ecole Polytechnique (Montréal, Québec). Centre de développement technologique, Aubertin, M. Evaluation en Laboratoire des Barrières Sèches Construites à Partir de Résidus Miniers: Rapport Final; École polytechnique de Montréal: Montreal, QC, Canada, 1995. [Google Scholar]
  53. Smesrud, J.K.; Selker, J.S. Effect of soil-particle size contrast on capillary barrier performance. J. Geotech. Geoenviron. Eng. 2001, 127, 885–888. [Google Scholar] [CrossRef]
  54. Parent, S.-É.; Cabral, A. Design of inclined covers with capillary barrier effect. Geotech. Geol. Eng. 2006, 24, 689–710. [Google Scholar] [CrossRef]
  55. Shaikh, J.; Bordoloi, S.; Yamsani, S.K.; Sekharan, S.; Rakesh, R.R.; Sarmah, A.K. Long-term hydraulic performance of landfill cover system in extreme humid region: Field monitoring and numerical approach. Sci. Total Environ. 2019, 688, 409–423. [Google Scholar] [CrossRef]
  56. Hopp, L.; McDonnell, J.J.; Condon, P. Lateral subsurface flow in a soil cover over waste rock in a humid temperate environment. Vadose Zone J. 2011, 10, 332–344. [Google Scholar] [CrossRef] [Green Version]
  57. Zhan, L.-T.; Li, G.-Y.; Jiao, W.-G.; Lan, J.-W.; Chen, Y.-M.; Shi, W. Performance of a compacted loess/gravel cover as a capillary barrier and landfill gas emissions controller in Northwest China. Sci. Total Environ. 2020, 718, 137195. [Google Scholar] [CrossRef]
  58. Bussière, B.; Aubertin, M.; Chapuis, R.P. The behavior of inclined covers used as oxygen barriers. Can. Geotech. J. 2003, 40, 512–535. [Google Scholar] [CrossRef]
  59. Khire, M.V.; Benson, C.H.; Bosscher, P.J. Capillary barriers: Design variables and water balance. J. Geotech. Geoenviron. Eng. 2000, 126, 695–708. [Google Scholar] [CrossRef] [Green Version]
  60. Huminicki, D.M.; Rimstidt, J.D. Iron oxyhydroxide coating of pyrite for acid mine drainage control. Appl. Geochem. 2009, 24, 1626–1634. [Google Scholar] [CrossRef]
  61. Nicholson, R.V.; Gillham, R.W.; Reardon, E.J. Pyrite oxidation in carbonate-buffered solution: 2. Rate control by oxide coatings. Geochim. Et Cosmochim. Acta 1990, 54, 395–402. [Google Scholar] [CrossRef]
  62. Benzaazoua, M.; Bussière, B.; Dagenais, A.-M.; Archambault, M. Kinetic tests comparison and interpretation for prediction of the Joutel tailings acid generation potential. Environ. Geol. 2004, 46, 1086–1101. [Google Scholar] [CrossRef]
  63. GB 25467; Emission Standard of Pollutants for Copper, Nickel and Cobalt Industry. China Environmental Press: Beijing, China, 2010.
  64. Rao, A.V.; Kulkarni, M.M.; Amalnerkar, D.; Seth, T. Superhydrophobic silica aerogels based on methyltrimethoxysilane precursor. J. Non-Cryst. Solids 2003, 330, 187–195. [Google Scholar]
  65. Khummalai, N.; Boonamnuayvitaya, V. Suppression of arsenopyrite surface oxidation by sol-gel coatings. J. Biosci. Bioeng. 2005, 99, 277–284. [Google Scholar] [CrossRef]
  66. Stormont, J.C.; Morris, C.E. Method to estimate water storage capacity of capillary barriers. J. Geotech. Geoenviron. Eng. 1998, 124, 297–302. [Google Scholar] [CrossRef] [Green Version]
  67. Movasat, M.; Tomac, I. Assessment of Physical Properties of Water-Repellent Soils. J. Geotech. Geoenviron. Eng. 2021, 147, 06021010. [Google Scholar] [CrossRef]
Figure 1. Grain size distribution curve.
Sustainability 15 06667 g001
Figure 2. One-dimensional soil column apparatusInfiltration test on FGS–CGS–clay structure (0.6 m: 0.4 m: 0.4 m) were performed in the column setup (Figure 2). Taking the uncoated CGS column (column UC) as an example, a 0.4 m gravel layer (D50 = 15 mm) was added under the clay layer to simulate waste rock pile. Before soil placement, a thin layer of Vaseline was smeared on the inner surface of the cylinder to minimize preferential flow of water or gas along the soil–wall interface [15]. The dry density and initial gravimetric water content of compacted soils were listed in Table 1. Nonwoven geotextile was placed between soil layers to minimize particle migration. After compaction, the soil was let stand for 48 h for the dissipation of excess pore water pressure. Infiltration test on coated CGS column (column CC) was performed similarly.
Sustainability 15 06667 g002
Figure 3. Soil water characteristic curves.
Sustainability 15 06667 g003
Figure 4. Unsaturated permeability coefficient curves.
Sustainability 15 06667 g004
Figure 5. Schematic diagram of the calculation of the diversion length at given infiltration rate.
Sustainability 15 06667 g005
Figure 6. Water balance analysis of two cover systems.
Sustainability 15 06667 g006
Figure 7. Temporal flow rates: (a) uncoated column and (b) coated column.
Sustainability 15 06667 g007
Figure 8. Measured water content and suction: (a) water content of uncoated column, (b) water content of coated column, (c) suction of uncoated column, and (d) suction of coated column.
Sustainability 15 06667 g008
Figure 9. Invasion patterns of rainwater: (a) uncoated column and (b) coated column.
Sustainability 15 06667 g009
Figure 10. Concentration of Cu, Zn, Mn, Mg in the CGS drainage.
Sustainability 15 06667 g010
Figure 11. SEM images for (a) waste rock before rainfall, (b) waste rock after rainfall, (c) coated waste rock before rainfall, and (d) coated waste rock after rainfall and EDX images for (e) waste rock before rainfall, (f) waste rock after rainfall, (g) coated waste rock before rainfall, and (h) coated waste rock after rainfall.
Sustainability 15 06667 g011
Table 1. Main physical and hydrogeological parameters of soil.
ParameterFGSCGSHDS Clay
Specific gravity, G s 2.73-2.37
Atterberg limits
Liquid limit20.3-61.4
Plastic limit1.9-40.3
Plasticity index18.3-21.1
Grain-size diameter
D 10 mm 0.0150.430.0013
D 30 mm 0.0852.50.0038
D 60 mm 0.186.00.0095
Coefficient of uniformity,   C U 122.47.3
Coefficient of curvature,   C C 2.682.421.17
Maximum dry densities (g/cm3)1.771.8421.15
Optimum water content (%)12.2-47.3
ksat (m/s)8.12 × 10−62.37 × 10−21.12 × 10⁻⁸
Air entry value (kPa)40.03400
α   (kPa−1)0.1314.51 × 10−3
n2.12.81.7
m0.520.640.41
Table 2. Mineralogical analysis.
TailingHDS ClayWaste RockCoated Waste Rock
Quartz52.834.217.59.7
Muscovite31.716.947.517.2
Clinochlore5.712.415.77.9
Calcite-10.54.21.1
Microcline7.35.9--
Kaolinite2.4---
Albite-20.2--
Pyrite -4.72.2
Rutile--10.4
Gypsum--7.32.8
Cronstedtite---0.4
Nacrite--1.3-
Calcium Sulfate--1-
MTMS---58.3 **
**: Note: MTMS coating tends to form powder-like fine particles after oven-drying, and blends with fine portion of the waste rock. In this XRD sample, their relative portion is very high (59%). However, the weight percentage of MTMS in coated waste rock was only 8%.
Table 3. Chemical composition of the tailing, waste rock, HDS clay, and coated waste rock.
ElementUnitsTailingHDS ClayWaste RockCoated Waste Rock
Fewt%3.663.966.875.31
Alwt%1.770.172.281.80
Kwt%2.380.072.372.34
Nawt%0.500.861.910.51
Camg/kg255.65794.4910.2159.8
Cumg/kg1320.1390.61852.41630.5
Znmg/kg50.8118.9802.628.4
Asmg/kg102.290.9219.099.6
Srmg/kg9.224.316.71.1
Momg/kg90.44.0104.251.1
Cdmg/kg1.681.902.470.83
Bamg/kg94.811.6586.927.7
Hgmg/kg0.280.330.220.31
Pbmg/kg10.15.616.88.6
Mgmg/kg124.91068.6436.2142.6
Crmg/kg63.011.376.179.3
Mnmg/kg267.1949.8225.0192.8
Comg/kg48.171.491.8149.5
Nimg/kg38.386.655.471.9
Table 4. Selection criteria of capillary cover materials.
ReferenceClimateWEVCGSAEVFGS W E V F G S W E V C G S k s a t ,     F G S k s a t ,   C G S ksat, FGS D 50 ,   C G S D 50 ,   F G S
[8]Humid0.4220035.7 × 10−568.2
[55]Humid270720>100032.9 × 10−85.5
[56]Humid0.0421.2>100022.3 × 10−5-
[57]Semi-humid0.317.3219451.8 × 10−7-
[12]Semi-arid28024-21.0 × 10⁻⁷-
[58]Semi-arid13.5735.1 × 10−58.4
[59]Arid and semi-arid927497.812.7 × 10−4-
This studyHumid0.2419048.1 × 10−6107
Table 5. The ion concentration in the drainage from FGS and CGS after one hour.
Sample NameFe (mg/L)Cu (mg/L)Zn (mg/L)Mn (mg/L)Mg (mg/L)
Drainage of FGS00.0590.0380.0468.516
Drainage of coated CGS00.04500.0335.966
Disclaimer/Publisher’s Note: The statements, opinions and data contained in all publications are solely those of the individual author(s) and contributor(s) and not of MDPI and/or the editor(s). MDPI and/or the editor(s) disclaim responsibility for any injury to people or property resulting from any ideas, methods, instructions or products referred to in the content.