Review

Integrated Electricity and Gas Systems Planning: New Opportunities, and a Detailed Assessment of Relevant Issues

Department of Electrical Engineering, University of Zanjan, Zanjan 45371-38791, Iran
*
Author to whom correspondence should be addressed.
Sustainability 2023, 15(8), 6602; https://doi.org/10.3390/su15086602
Submission received: 19 February 2023 / Revised: 30 March 2023 / Accepted: 11 April 2023 / Published: 13 April 2023

Abstract

:
Integrated electricity and gas systems (IEGS) with power-to-gas (PtG) units, as novel sector coupling components between electricity and gas systems, have been considered a promising solution for the reliable and economic operation of the integrated energy systems which can effectively reduce the challenges associated with the high penetration of renewable energy sources (RES). To confirm the economic viability and technical feasibility of the IEGS, its coordinated planning will play a crucial role. The more comprehensive the modeling and evaluation of IEGS planning studies are, the more precise and practical the results obtained will be. In this paper, an in-depth and up-to-date assessment of the available literature on the IEGS planning is presented by addressing critical concerns and challenges, which need further studies. A vast variety of related topics in the IEGS planning, including the impact of costs, constraints, uncertainties, contingencies, reliability, sector coupling components, etc., are also reviewed and discussed. In addition, the role of PtGs and their impacts on the coordinated IEGS planning are reviewed in detail due to their crucial role in increasing the penetration of RES in future energy systems as well as limiting greenhouse gas emissions. The literature review completed by this paper can support planners and policymakers to better realize the bottlenecks in the IEGS development, so that they can concentrate on the remaining unsolved topics as well as the improvement of existing designs and procedures.

1. Introduction

1.1. Background

Limiting the average global temperature rise below 2 °C, according to the Paris Agreement, will require significant changes in the energy sector planning to increase the penetration of renewable energy sources (RES) [1]. Based on the International Renewable Energy Agency projections [2], to achieve the Paris Agreement goals, the overall RES penetration in the electricity generation mix should increase from 25% in 2018 to 57% and 86% in 2030 and 2050, respectively. The European Union also targets a 32% share of RES in total energy consumption by 2030 [3]. Some European countries have set even more ambitious targets. For example, Germany has planned a 60% share of RES in the gross final energy consumption by 2050 [4]. To achieve the above goals, electric power systems (EPSs) will see an increase in the deployment of solar or wind energy for electricity generation. In 2021, a total amount of 41 billion euros was invested in Europe for new wind power plants, which will lead to the installation of 24.6 Gigawatt (GW) capacity of wind farms [5]. In addition, in 2021, a total capacity of 314.5 GW renewable energy (RE)-based power plants were newly installed worldwide and the share of RE reached 28.3%, showing an almost 8% increase in the past decade [6]. However, wind and solar-based power generations depend on the availability of the primary energy sources as well as their uncertain and fluctuating nature, which will lead to challenges in generation and demand balancing, and will add more complexity to the EPS planning and operation [7]. To ensure the safe and economic use of energy systems in the presence of high RES penetration, it is necessary to evaluate new technologies and solutions. In this way, the integration of EPS and the natural gas system (NGS) to form integrated electricity and gas (IEGS) systems has been considered a promising solution [8]. The interdependence between these two systems can reduce the total costs in both systems, increase the RES share in the energy mix as well as reduce their forced curtailment, and compensate for their uncertainties. However, accurate and comprehensive strategies are required for the safe and economic planning and operation of these systems. Gas-fired power plants (GFPPs), as the traditional linking components between EPS and NGS, have been considered a helpful balancing option to increase the penetration of RES, accounting for various issues, such as the advantages of natural gas (NG) over other fossil fuels as well as the ability of GFPPs to quickly respond to generation and demand changes. NG, as the second largest source of electric power (EP) generation in the world with a share of about 23% in 2019 and 2020 [9,10], will still play a key role in the generation mix due to its various benefits, including less pollution than other fossil fuels, higher thermal efficiency, lower investment costs and construction time, and also, more operational flexibility of GFPPs. According to the United States (US) Energy Agency [11], EP generation from NG in the US has quadrupled in the past 30 years, and its share has reached about 37%. However, NG has environmental hazards, and its supply may be limited due to various technical, economic, or political reasons. On the other hand, fluctuations in RE-based generations due to their inherent intermittent nature leads to changes in NG demand and affects the NGS operation.
Converting excess RE-based generation into another product (Power-to-X), e.g., gas, heat [12,13,14,15], etc. is gaining more attention due to its share in increasing the RES penetration, reducing carbon dioxide (CO2) emissions, and the forced curtailment of RES-based power plants. A detailed review of Power-to-X systems are presented in [16,17,18,19]. Power-to-Gas (PtG) units are a type of Power-to-X technology, which can be referred to a suitable approach to lessen the challenges associated with the increasing penetration of RES. This technology provides a supportive alternative for storing surplus EP [20] and has a direct impact on both EPS and NGS [21]. The integration of PtG within the IEGS creates another linkage between the EPS and NGS sectors and causes an amount of fossil NG to be replaced by synthetic NG (SNG). Hence, NG demands to be supplied from import terminals or gas wells are reduced [22]. In [23], for example, it is estimated that the installation of 500 GW PtG capacity will have the potential to provide almost 75% of Europe’s NG needs by 2050, which shows the important role of PtG in supplying the NG demand. In addition, PtG can provide helpful solutions for long-term and large-scale storage of RE-based power generations to increase their penetration in the IEGS [24,25,26]. PtG is the technology to convert mainly, but not exclusively, surplus RE-based EP into a gaseous fuel, such as hydrogen (H2) or synthetic methane (CH4) [27]. If this RE-based generation is not absorbed by the PtG units, it will be curtailed due to grid limitations or lack of demand [28]. Hence, PtG can prevent or reduce the curtailment of RE-based generations and CO2 emissions [29,30]. The SNG produced in a PtG can be injected into the NGS in order to take advantage of the inherent large-scale storage capacity of gas pipelines [31,32]. In Europe, there is more than 1100 Terawatt-hours (TWh) of total gas storage capacity; for example, the gas storage capacity in Denmark is equivalent to 38% of its total NG demand [33]. While electricity storage is expensive and limited to short-term and small-scale technologies such as batteries, SNG storage, in return, is a seasonal, large-scale, and low-cost option through the widespread and already installed facilities of the NGS [7,27].
The coordinated planning of EPS and NGS can not only reduce the costs in both systems and prevent the unwanted expansion of the EPS [34], but also can increase the share of RES, reduce their curtailment, and compensate for the uncertainties associated with their fluctuating nature [7]. Since any changes in the EPS can affect the NGS and vice versa, it is essential to perform their planning and operation simultaneously, through the IEGS prospect [29,35]. Figure 1 shows the main interactions in the IEGS planning, considering bidirectional coupling between its EPS and NGS sectors.

1.2. Contributions

IEGS steady-state studies can be performed from two main viewpoints: technical aspects and market perspectives. The latter aims to model the interfaces of pricing methods between two systems [36,37,38]. The technical perspective can be classified into planning and operational studies. Operational studies usually have a short-term interval with more technical and geographical details, while the planning studies consider a long-term horizon with fewer modeling details [39]. A detailed review of modeling and solution methods for the optimal coordinated operation of IEGS has been presented in [7,40]. In this paper, the focus is on the planning of IEGS. The IEGS planning aims to determine the future expansion requirements of EPS and NGS as well as their coupling components to ensure the stable supply of predicted EP and NG demands with the lowest cost in addition to meeting the corresponding requirements, such as multiple technical and environmental constraints, relevant uncertainties, desired reliability level, etc. Various aspects of IEGS steady-state studies and modeling perspectives [39] are depicted in Figure 2, where the focus of this review paper is marked with green color.
IEGS planning has been reviewed in several existing works. For instance, a survey on models for IEGS coordination has been presented in [39] with a focus on the methodologies in the modeling of EP and NG interdependencies. Moreover, the coordination of interdependent EPS and NGS has been reviewed in [41] from various perspectives. However, a comprehensive and up-to-date survey of the IEGS planning considering novel issues and relevant features, such as the impact of related costs, constraints, uncertainties, N − 1 contingency, reliability levels, and coupling components is missing in the existing literature, and this paper aims to fill this gap. In addition, the impact of PtGs on IEGS planning will be reviewed in detail, taking into account its different technical and economic aspects. The main contributions of the paper can be summarized as follows:
  • Modeling of IEGS for planning studies is reviewed thoroughly and the concerning issues in the integrated planning of IEGS are classified. In addition, modeling the line pack phenomenon in gas pipelines is done in detail due to its crucial role in the integrated planning of electric power and natural gas systems.
  • A technical overview of IEGS planning with a comprehensive review of PtG technology and its relevant technical and economic aspects and constraints are presented due to the crucial role of this technology in IEGS planning, and the need for increasing the penetration of RES in future energy systems to restrict the CO2 emissions.
  • A detailed evaluation of the existing literature is performed, and the associated issues in the coordinated planning of EPS and NGS, including various objectives, relevant costs, constraints, uncertainties, reliability, N − 1 contingency, the modeling of EPS and NGS, real networks, impact of RES, and PtG units are highlighted.
  • A classification is done for the solution approaches which deal with the non-convex and non-linear optimization models in both EPS and NGS from the planning perspective.

1.3. Paper Organization

The remainder of the paper is organized as follows: a technical overview and mathematical modeling of IEGS components is reviewed in Section 2, where PtG technology is focused on various aspects, including its detailed components and working procedure as well as its mathematical modeling in the IEGS. In addition, from the planning perspective, various methods for the mathematical modeling of the electric and gas load flows in EPS and NGS are presented. The modeling of the line pack phenomenon and NG compressors are also given in detail. In Section 3, the optimal integrated planning of EPS and NGS is investigated comprehensively, taking into account the associated issues, including the general formulation, various objectives, decision variables, related costs, constraints, uncertainties, reliability level, N − 1 contingency, and the impacts of RES and PtG units. Next, different solution approaches for the IEGS optimized planning are reviewed in Section 4. Finally, conclusions and future research directions are presented in Section 5.

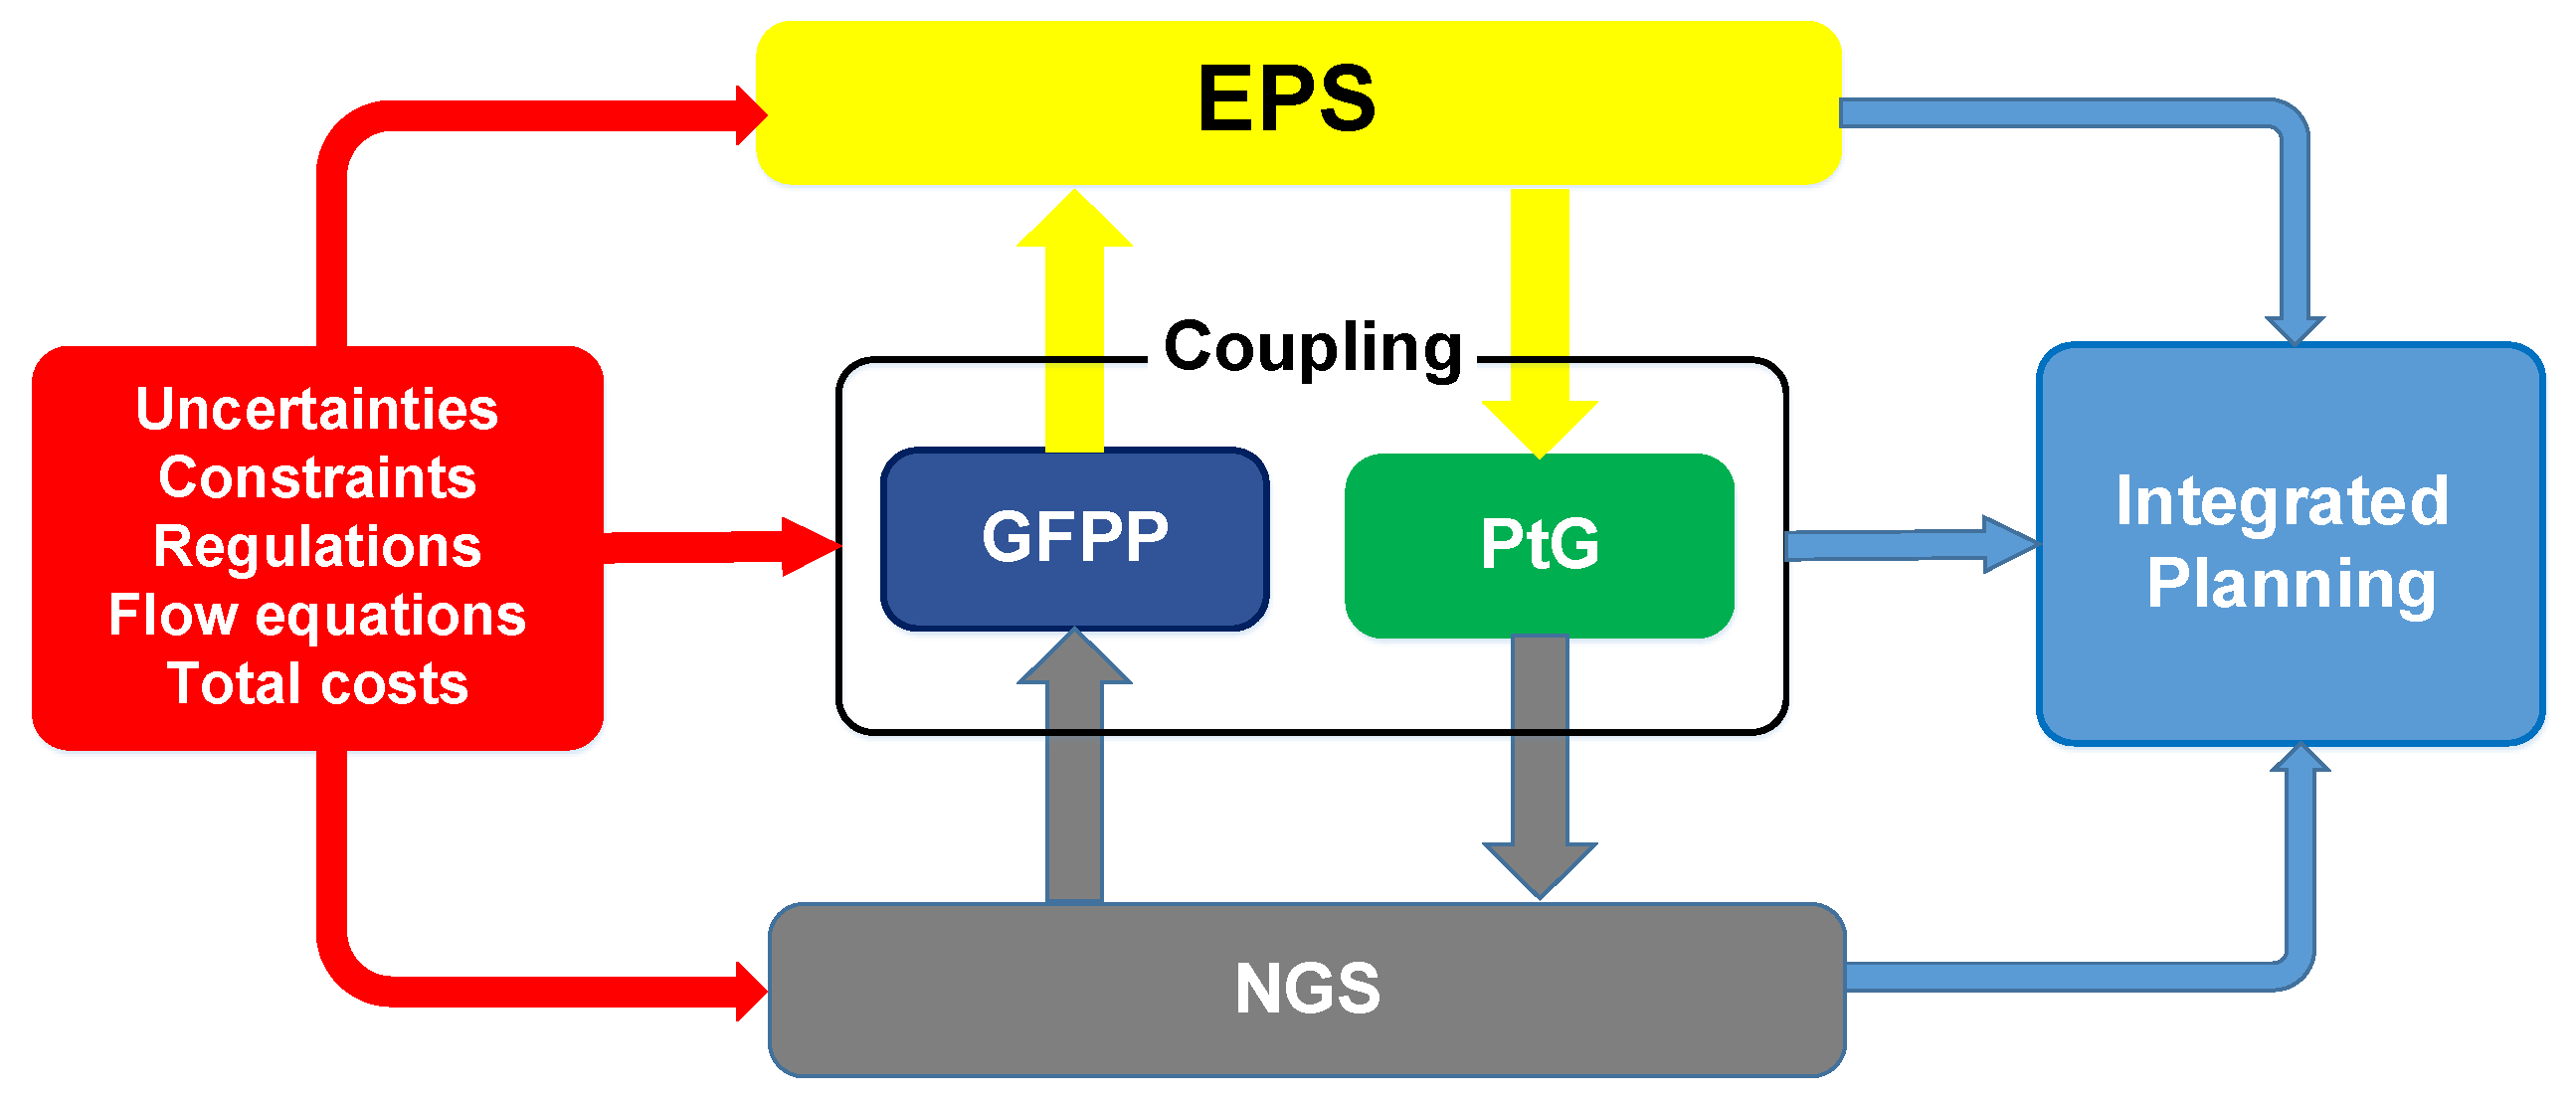
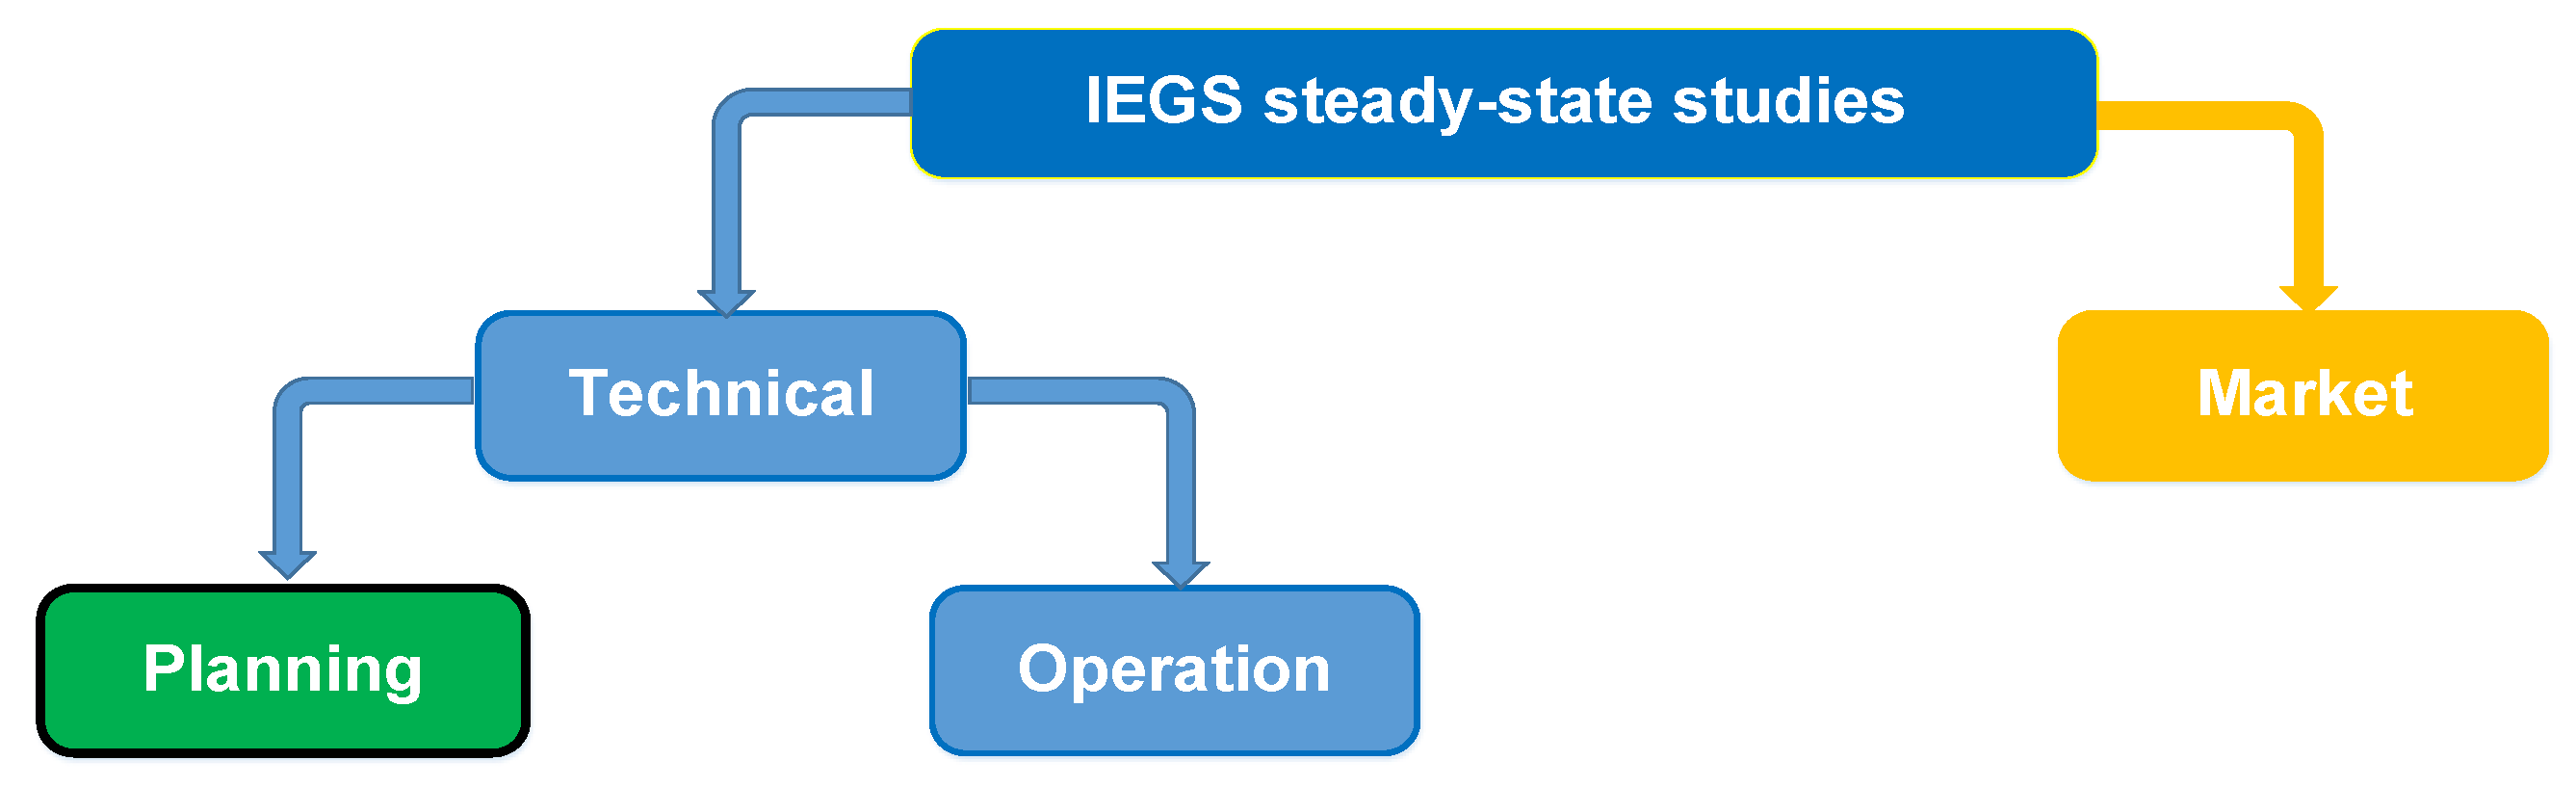
2. Technical Overview and Modeling of IEGS

The IEGS can be considered as three main sections, i.e., EPS, NGS, and linking components. Figure 3 illustrates a schematic view of an IEGS with a bidirectional connection between EPS and NGS, i.e., GFPPs and PtG units. From the EPS viewpoint, PtG units are EP demands. Likewise, GFPPs are considered as NG demands for the NGS.
One of the concerns in the IEGS modeling is the computational burden of its corresponding large-scale model due to the different dynamic characteristics and various equipment available in both EPS and NGS. Electric power transmission can be considered as an almost instantaneous process with response times as microseconds or milliseconds. In contrast, NG flow is a much slower process compared to that in the EPS due to the low velocity of the gas in the pipelines, which leads to a longer response time (e.g., several minutes) to disturbances, and a significant time delay between the gas injection and consumption nodes. In the following, different sections of an IEGS are reviewed and the mathematical modeling of their various components is presented.

2.1. Electric Power System

The EPS consists of high-voltage transmission lines and substations, which link the power plants to load centers. A detailed description of EPS can be found in [42,43,44]. Power plants are the main source energy in EPS which supply the electricity demand instantly. They include multiple types based on the employed primary energy source as well as the energy conversion process. RE-based power plants such as wind, solar, and hydro, as well as non-renewable types, including GFPPs and other thermal power plants, are common power plant types. In [45], various types of RE-based and fossil-fueled power plants are investigated in detail. EPS modeling in the IEGS planning is performed by the steady-state load flow model considering high voltage transmission lines and transformers, load centers, and power plants. The purpose of load flow analysis in the EPS is to calculate the voltage magnitude and angle of buses as well as the power flowing in transmission lines. The most accurate load flow model for considering the non-linear and non-convex equations of power grid parameters is alternating current (AC) load flow, in which the relationship between the injected power, voltage magnitude, and voltage angle of buses is determined through non-convex and non-linear equations. Several references, such as [46,47,48,49], have presented a comprehensive and detailed description and formulation of the load flow analysis in power systems. The AC load flow equations for bus k in an EPS can be expressed by Equations (1) and (2). Equation (1) represents the net active power injected at bus k as a function of voltage magnitudes and angles. Net active power means the difference between the active power generated ( P G , k ) and the active power consumed ( P L , k ) at bus k. Likewise, Equation (2) represents the net reactive power injected at bus k as the difference between the reactive power generated ( Q G , k ) and the reactive power consumed ( Q L , k ) at bus k.
P G , k P L , k = V k n = 1 N b Y k n V n cos δ k δ n θ k n
Q G , k Q L , k = V k n = 1 N b Y k n V n sin δ k δ n θ k n
where N b is the number of buses in the EPS, V k and δ k are the voltage magnitude and angle at bus k, respectively, and Y k n θ k n is the element of the Y b u s admittance matrix in position (k,n). Since the AC load flow considers the losses along the transmission lines, for a line with i and k buses at two ends, the apparent power flowing from bus i to k will be different from that flowing in the opposite direction. To solve AC load flow equations, iterative-based techniques, such as Newton-Raphson, Gauss-Seidel, or fast decoupled methods, are employed [47].
In the IEGS planning, to reduce the computational burden in complex optimization problems, the load flow equations can be relaxed to convex linear equations—called DC load flow—through considering some assumptions. This model is the most adopted approach for the IEGS planning studies. Table 1 summarizes the literature from the viewpoint of EPS load flow analysis showing that the DC load flow has been employed in the majority of the related literature.
Table 1. EPS load flow analysis in IEGS planning studies.
Load FlowRef.
AC[50,51,52,53,54,55]
DC[29,56,57,58,59,60,61,62]
[35,63,64,65,66,67,68,69,70,71]
[72,73,74,75,76,77,78,79,80]
The DC load flow calculates only active power flows in the EPS and is resulted through the consideration of the following assumptions to relax the non-linear equations of the AC model [46]:
  • Assuming all systems have high enough X/R ratios, only the series reactances of transmission lines are considered.
  • Voltage magnitudes are constant and equal to 1 per unit (p.u.) at all buses.
  • The voltage angle difference between the i and k buses of a transmission line is slight, which leads to: sin δ i δ k δ i δ k .
By applying the above assumptions to Equation (1), the linear DC load flow equation is extracted as follows:
P G , k P L , k = n = 1 N b B k n δ n
where B k n is the element of the bus susceptance matrix in the position (k,n), which considers the series reactance of the transmission lines. Since line losses are also neglected in the DC load flow, the line flow from bus i to bus k can be expressed as follows:
P i k = P k i = 1 X i , k δ i δ k
where X i , k is the series reactance of the branch connected between buses i and k.

2.2. Natural Gas System

The NGS can be taken into account as a high-pressure pipeline network, which transfers the NG over long distances from the suppliers to the consumers. The main components of the NGS include NG demands, storage facilities, pipelines, compressors, and NG suppliers, i.e., import terminals or gas wells. In [81], the fundamentals of NGS have been explained thoroughly.
NGS models are divided into two major categories: dynamic and steady-state models. In the dynamic model, the gas flow in the pipeline changes over time due to the line pack effect. This model is described by partial differential equations, which will lead to a significant increase in the computational burden. In the steady-state model, it is assumed that the inflow and outflow gas of pipelines are equal, and the gas flow status does not change over time, meaning that the line pack effect is not considered. In this case, the system model is represented by non-linear algebraic equations called the Weymouth equation, which is a general formulation for high-pressure gas transmission pipelines and is employed in the planning studies of IEGS. A detailed gas flow formulation and analysis can be found in [82]. Considering a pipeline with length L between nodes a and b, the Weymouth non-convex and non-linear equation is commonly written as follows:
f a b = s g n π a , π b C a , b π a 2 π b 2
s g n π a , π b = + 1 ,     i f   π a π b 1 ,     i f   π a < π b
where f a b is the gas flow rate in ( m 3 ) , π a , π b are the gas pressure at nodes a and b, respectively, and C a , b is a coefficient, called the Weymouth factor, which depends on the pipeline and the gas properties, and can be calculated as follows:
C a b = 1.3656 × 10 2 D a b 2.5 F a b   Z   T   L a b   δ
where D a b is the pipe inside diameter (mm), L a b is the pipeline segment length (km), Z is the gas compressibility factor, T is the gas temperature in the pipeline segment ( ° K ), δ is the specific gravity of natural gas (0.55 to about 0.87), and F a b is the friction factor of the pipeline segment between nodes a and b, which is given by the following equation:
1 F a b = 2 log 10 3.7   D a b ϵ
where ϵ is the absolute pipe roughness in millimeter (mm).
The term s g n π a , π b in Equation (6) is a sign function defining the gas flow direction. When π a π b , it will equal 1 denoting the gas flow from node a to node b, and if π a < π b , it will equal −1, expressing the gas flow direction from node b to node a. If the gas flow in the pipelines is considered unidirectional with π a π b , the Weymouth equation will be simplified as follows:
f a b = C a , b π a 2 π b 2
However, with the increasing penetration of RES, the bidirectional modeling of the gas flow in pipelines will be essential as sudden changes in renewable generations will lead to the rapid start of PtG units or GFPPs and thus, a sudden change in the gas flow direction in the pipelines. Furthermore, in both cases of unidirectional and bidirectional gas flow in the pipelines, the term π a 2 π b 2 , which is the squared pressure difference of nodes a and b, makes the Weymouth equation a non-linear and non-convex function. In order to avoid dealing with non-differentiable equations of the NGS, a method has been presented in [83] to linearize the gas network model.

2.2.1. Line Pack Effect

Unlike the EPS, the NGS has a compression property called the line pack effect, which involves using the pipelines as short-term storage [7,84]. Line pack is the ability of a pipeline to store a certain amount of NG in the pipeline due to the difference in the quantity of gas in-flow into and out-flow of the pipeline [85]. The utilization of line pack results in a further operational flexibility in the EPS and it will decrease the total operational costs of the IEGS. It will also flatten the nodal gas prices by ensuring the more efficient employment of cheaper gas sources [86].
The amount of line pack in a pipeline segment is proportional to the average pressure along the pipeline measured at standard conditions (generally 1.01 bar and 288 °K) [82,87] and plays a crucial role in balancing the transients of NG supply and consumption, especially when EPS disturbances influences the NG supply [84,88]. In cases where large PtG units are added to the IEGS, the role of line pack as a storage source will become more significant [73]. The line pack gas volume in a pipeline between nodes a and b can be calculated as follows [82]:
L P a b = 7.855 × 10 4 T s π s π a b , a v Z a v T a v D a b 2 L a b
where L P a b is the line pack volume in a pipeline segment between nodes a and b in standard m 3 , T s and π s are the base temperature (generally 288 ° K ) and pressure (generally 1.01 bar), respectively, π a b , a v is the average pressure in the pipeline segment between nodes a and b, T a v is the average gas temperature in the pipeline segment ( ° K ), Z a v (generally 0.9) is the gas compressibility factor at T a v and π a b , a v , D a b is the pipe inside diameter (mm), and L a b is the pipeline segment length (km). π a b , a v can be calculated by the following equation [82]:
π a b , a v = 2 3 π a + π b π a π b π a + π b
where π a and π b are the gas pressures at nodes a and b, respectively. Employing the above-mentioned nonlinear formulation may result in computational burden in large optimization problems. In [89], a linear approximation of the average pressure in a pipeline segment and hence, the linear estimation of the line pack modeling, has been introduced. It is worth noting that using the mean value of the in-flow and out-flow node pressures for the average pressure of the pipeline may lead to major errors, especially when the pressure difference between the nodes is large [89].
It is possible to consider the gas properties and geometrical volume of the pipeline between nodes a and b as a coefficient ( K L P , a b ), called the line pack coefficient, and rewrite the Equation (9) as follows:
L P a b m 3 = K L P , a b . π a b , a v ( b a r )
where the line pack coefficient ( K L P , a b ) taking into account T s = 288   ° K , π s = 1.01   bar , and Z a v = 0.9 will be given as follows [83]:
K L P , a b = 0.24887 × D a b 2 L a b T a v
In dynamic conditions, the gas flow into and out of a pipeline segment fluctuates with varying gas supply and demand. Based on the conservation of mass Law, the change of the total gas volume will be equal to the difference between the flow into and out of the pipeline [90]. Therefore, line pack at time t, ( L P a b , t ), can be defined as the accumulated difference between the injection ( f i n , a b ) and withdrawal ( f o u t , a b ) of NG flows in the pipeline as follows [73]:
L P a b , t = L P a b 0 + T = 1 t f i n , a b T f o u t , a b T
where L P a b 0 is the initial line pack value in the pipeline between nodes a and b and can be calculated using Equation (11). Line pack storage should be restored once it is used, which usually occurs every 24 h at the beginning of every day.
As mentioned above, solving the partial differential equations related to the gas flow dynamics faces a computational burden. On the other hand, steady-state models ignore the line pack effect and its helpful storage capability in the NGS. Moreover, the role of line pack will be even more critical when PtG is added to the IEGS. For these reasons, and considering that line pack is a relatively slow process, another steady-state model—called the quasi-steady-state model—has been developed in some research works in which the line pack effect is roughly considered without the solution of partial differential equations [83]. In this model, it is assumed that for a pipeline between nodes a and b, the average gas flow at the time t ( f a b , t ¯ ) is approximated by [7]:
f a b , t ¯ = f a b , t i n + f a b , t o u t 2
where f a b , t i n and f a b , t o u t denote the inflow and outflow in the pipeline, respectively. Hence, the Weymouth Equation (5) at time t can be written as:
f a b , t ¯ = s g n π a , t , π b , t K a , b π a , t 2 π b , t 2
The line pack update at every time step will be as follows [85,91]:
L P a b , t = L P a b , t 1 + f a b , t i n f a b , t o u t
where L P a b , t and L P a b , t 1 are the line pack effect of the pipeline between nodes a and b at time t and t − 1, respectively.
The line pack effect in the NGS faces several operational constraints, the most applicable of which are explained in Equations (17) and (18) [73,83,91]:
L P a b _ L P a b , t L P a b ¯
L P a , b , t = e n d = L P a , b , t = 1
Equation (17) implies that the line pack amount in the pipeline segment between nodes a and b at time t should be within the lower ( L P a b _ ) and upper ( L P a b ¯ ) line pack levels. In addition, Equation (18) indicates that the amount of line pack in all pipelines at the end of scheduled time ( L P a , b , t = e n d ) should be equal to that in the beginning time ( L P a , b , t = 1 ).

2.2.2. Gas Compressors

As the gas flows in pipelines, its friction with the pipelines leads to a pressure drop in the gas flow process. Thus, compressors are utilized on gas pipelines to compensate for the pressure drop of the gas along pipelines and provide the required pressure for gas transport from one node to another [82]. In long-distance pipelines and owing to limitations of pipeline pressures, several compressors may be required to transport a certain volume of NG. Compressors can be driven by electric motors or NG engines. Typically, two kinds of compressors are employed: reciprocating and centrifugal ones. The former may be driven by either NG engines or electric motors, and the latter employ electric motors or NG turbines as drivers [92]. The required energy of compressors is often supplied by a portion of NG flowing in the pipeline. In this case, 3 to 5% of the NG transmitted along them is usually assumed to be used as their working energy consumption [93,94]
The compression power of the compressor in an adiabatic compression process depends on the gas flow rate in the pipeline as well as the compression ratio. The term adiabatic refers to zero heat transfer between the gas and the surroundings. For a compressor located between nodes a and b with ( η c ) compression efficiency, this energy can be presented as follows [82,95,96]:
P o w e r a b ( k W ) = 4.0639 f a b T a η c Z a + Z b 2 α α 1 π b π a α 1 α 1
where α is the specific heat ratio of the NG, f a b is the gas flow rate from node a to node b in million cubic meters per day ( Mm 3 day ) , T a is the suction temperature of gas ( ° K ), Z a and Z b are the compressibility of gas at suction and discharge conditions, respectively, η c is the compressor adiabatic efficiency (generally ranges from 0.75 to 0.85). The ratio of discharge pressure ( π b ( b a r ) ) to the suction pressure ( π a ( b a r ) ) is called the compression ratio r  ( r = π b π a ) .
Considering η m as the mechanical efficiency of the compressor driver, the driver power of the compressor ( P c o m p ) will be as follows [82]:
P c o m p k W = P o w e r a b k W η m
If the gas pressure compressors in the NGS are driven by electric motors consuming EP, there will be another link between the two systems as a load for EPS. Hence, for an electric-motor driven compressor, the electrical energy supplied from the EPS ( E P c o m p ) can will be given by [97]:
E P c o m p ( M W h ) = P c o m p ( k W ) × 10 3 3600
If the compressor energy is provided by NG turbine, the consumed NG ( f c o m p , a b ) in the k-th compressor can be calculated by the following equation [96,97]:
f c o m p , k ( m 3 ) = a k E P c o m p , k ( M W h ) 2 + b k E P c o m p , k ( M W h ) + c k
where a k , b k , and c k are the consumption coefficients of the compressor. As the models in Equations (18) and (19) are non-linear, approximated linear models are usually employed in IEGS studies to avoid high computational burden. For instance, a piecewise linear approximation has been employed in [65] for the modeling of NG compressors.

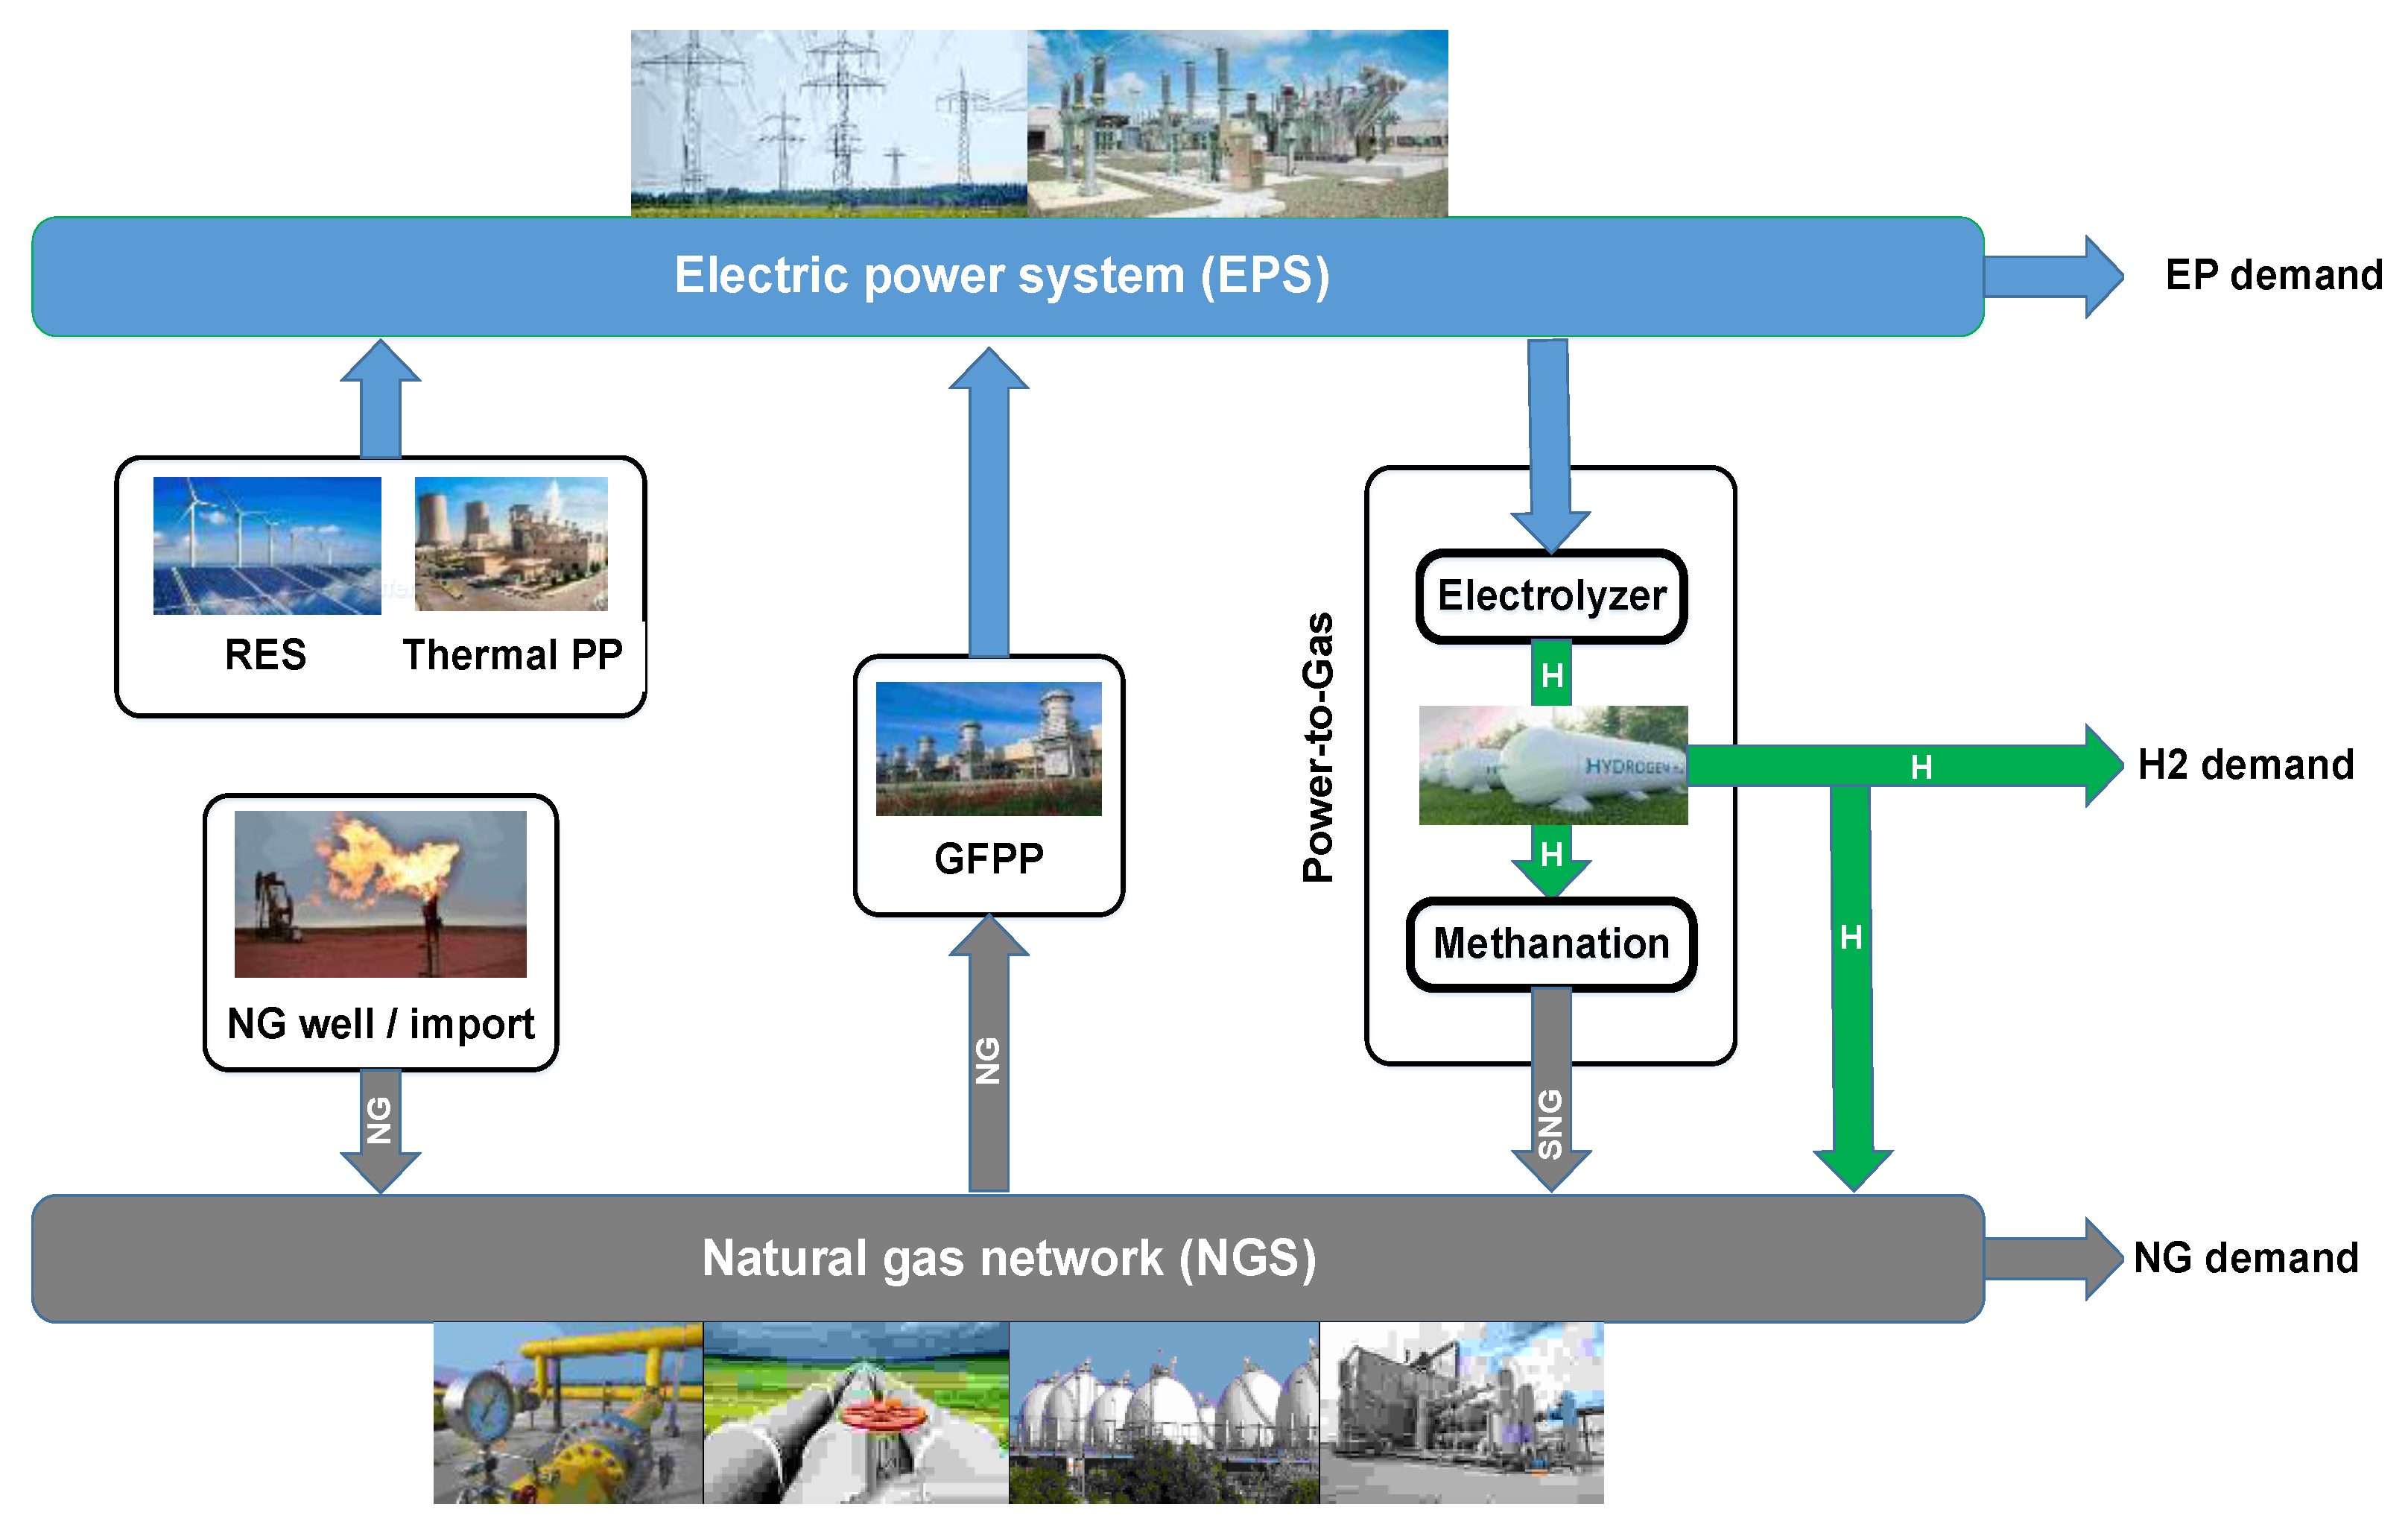
2.3. Sector-Coupling Components

2.3.1. Gas-Fired Power Plants
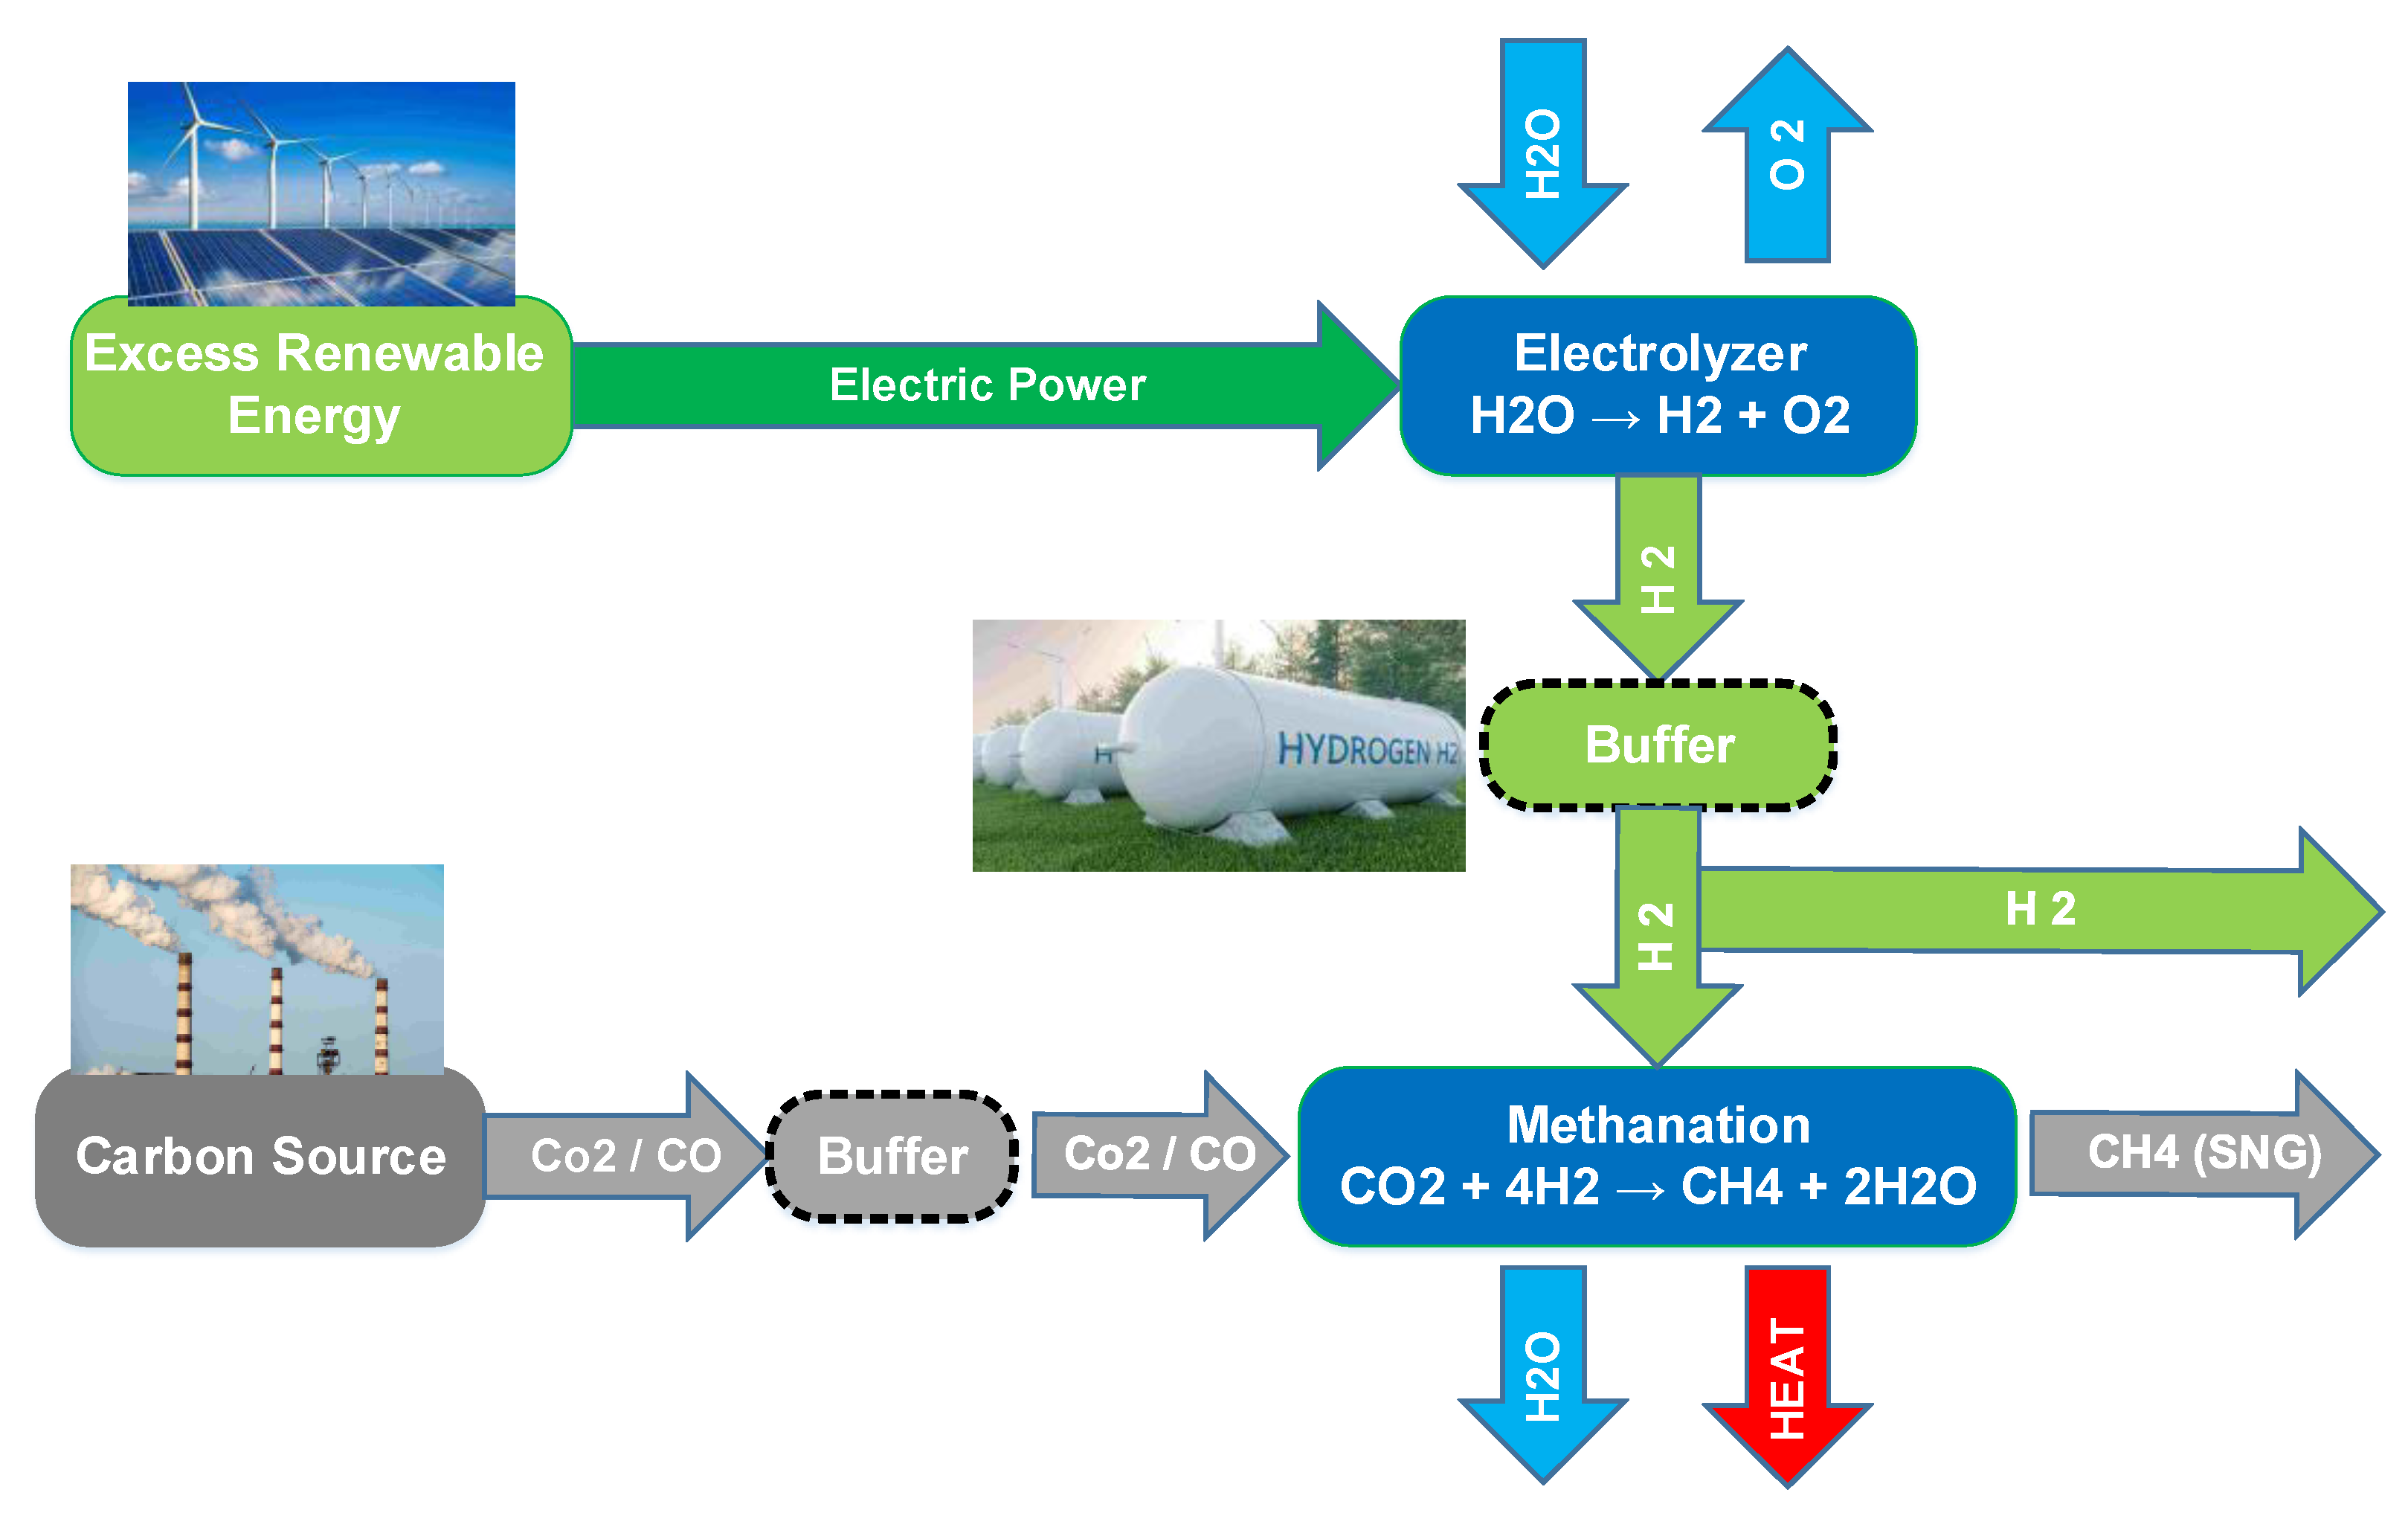
GFPPs are the traditional linking component between EPS and NGS [55]. The generated power in a GFPP is associated with its NG demand. If P k is the generated power in the k-th GFPP, the corresponding NG demand can be defined by a quadratic heat rate (HR) curve relationship as follows [73,98,99]:
H R = a k P k 2 + b k P k + c k
where a k , b k , c k are coefficients relating to the power plant characteristics. Then, the NG consumption of the GFPP can be calculated approximately as follows:
N G c o n s G F P P = H R . P k
where N G c o n s G F P P is the NG consumption of the k-th GFPP for the generation of P k power.

2.3.2. Power-to-Gas

PtG units are the novel linking components between EPS and NGS, in addition to GFPPs. They are the focus of recent IEGS-related research due to their various advantages. Many PtG projects have been performed since 2000, the leading centers of which are currently located in Europe and North America [100]. A complete overview of PtG technology is presented in [101,102,103]. A typical PtG comprises four main parts: an electrolyzer, a methanation device, a source of CO2, and storage equipment to safely store and buffer H2, CO2, and SNG, allowing for more production [104]. A simple process of the PtG unit is illustrated in Figure 4.
The first stage of the PtG process is the dissociation of water (H2O) using EP in an electrolyzer to produce H2. If the EP is supplied from the RES, the produced H2 is called green hydrogen since no CO2 will be emitted. The overall electrolyzer chemical reaction is as follows [27,105]:
2 H 2 O + E l e c t r i a c l   e n e r g y 2 H 2 + O 2
The energy consumption in the electrolysis process depends on the employed technology, and varies with the pressure and temperature of the process [106]. In view of the utilized electrolyte type, three electrolysis technologies are the focus of PtG applications: Alkaline electrolysis (AEC), Proton exchange membrane or Polymer electrolyte membrane (PEM), and solid oxide electrolysis (SOEC) [105]. The latter is not at a developed and commercial level yet, although some studies [107] have assessed its application. Various electrolysis technologies are categorized by a variety of technical issues, including operating temperature and pressure, efficiency, ramp rates, cold start time, hydrogen purity, etc. [105,108,109,110]. Alkaline and PEM electrolyzers operate at low temperatures (60–80 °C for PEM and 60–90 °C for AEC), and their efficiency varies between 55–67% for Alkaline and 60–70% for PEM type, while the operating temperature of the SOEC is much higher (700–1000 °C) with an efficiency of over 90% [27,102]. In return, its efficiency is also higher due to reduced energy needs [108,109,110]. The PEM has a faster ramp rate, and thus has the potential for faster adoption with wind fluctuations, which makes it more suitable to follow RE-based variable generations [28]. It is worth noting that novel Alkaline electrolyzers similarly have quick ramp rates [111]. The investment cost of alkaline technology is lower than that of the other types due to the use of non-precious metals as catalysts. In comparison, PEM employs noble metals and has a higher investment cost at the moment [110,111,112]. Moreover, the hydrogen purity in an alkaline-based system is within 99.8–99.9%, which can be even more through an extra purification method. On the other hand, in the PEM technology, the hydrogen purity is over 99.99% without the employment of any purification system [106]. Finally, the lifetime of a PEM-based electrolyzer is often within 5–20 years, which is shorter than the 15–30 years lifetime in an Alkaline-based system [113,114].
In the methanation step, the H2 is converted to SNG—explicitly synthetic methane (CH4)—in the methane production reactor through a catalytic chemical reaction using CO2, also called the Sabatier process [27,30]. The methanation process can be completed through either CO2 or carbon monoxide (CO), if a source of CO exists [115]. Equations (26) and (27) denote the chemical reactions of SNG production through CO2 and CO, respectively [24].
C O 2 + 4 H 2 C H 4 + 2 H 2 O
C O + 3 H 2 C H 4 + H 2 O
Although in most cases the SNG is the PtG output, it is also possible to directly use the H2 to increase the PtG efficiency due to eliminating the methanation part. In addition, the location of PtG units will not depend on CO2 availability [27]. The H2 can be used directly in H2-fired gas turbines as well as fuel cells or injected in small volumes into the NGS [22,28,116,117]. In addition, it is possible to employ the green H2 directly in the industrial sector including the steel industry, chemical industry, and refineries [118] as well as the road and non-road transport sectors [119]. However, current limitations for injecting H2 into the NGS (2–10% by volume) require the methanation step in PtG units to produce SNG [120]. On the other hand, SNG production makes it possible to use CO2 and thus, reduce carbon emissions [121].
The CO2 purity influences the quality of SNG. Main CO2 sources for the methanation process can be supplied from the carbon capture (CC) in fossil-fueled power plants, biomass, air, and industrial procedures like steel, iron, and cement production processes [122]. Due to the CO2 source, various environmental impacts will result in reduced carbon emissions [7]. Based on the employed CC source, energy consumption and related costs will vary in different processes. Due to the low purity of CO2 in the air, extensive energy consumption and costs are needed to capture carbon from the air than other methods. The cost and energy consumption of CO2 captured from the air are almost 1000 euros per one ton of CO2  ( ϵ / t C O 2 ) and 3000–5000 kilowatt hours per one ton of CO2  ( k W h / t C O 2 ) , respectively [24,123]. These values for CC processes are about 20–60 ( ϵ / t C O 2 ) and 100–350  ( k W h / t C O 2 ) , respectively [123]. However, the energy demand and the investment costs of direct air capture of CO2 are expected to significantly reduce in the future, and CO2 capture costs below 50 ( ϵ / t C O 2 ) are attainable by 2040 [124].
In power plants, the best option for the CC process is the post-combustion method in which the CO2 is extracted from the gas produced by combustion [125]. In this method, it is required to identify the CO2 content of gases and their pressure. Other methods include pre-combustion and oxyfuel combustion. In the former, the fuel is pre-treated before it is fired, and in the latter, combustion is done using pure oxygen instead of air. Employing any kind of CC method will lead to a fuel consumption increase owing to more energy requirements by the system [123,125,126].
PtG locations in IEGS are determined by EPS, considering NGS infrastructure [61]. Candidate sites are generally located near RE-based power plants, and they are connected to the nearest NG node [35]. The optimal location of PtG units as well as the RES penetration and power grid properties may result in significant effects on the obtainable green H2 [127]. Depending on the technology, their efficiency varies between 55 to 80% [128] and is usually about 64% [129]. Due to their limited efficiency, their operation should be in a way that does not reduce the overall efficiency of the system [73]. PtG investment costs include electrolyzer, methanation, EP equipment, piping, construction, and control systems [130]. Their economic viability is affected by size, location, technology, and CO2 source [7,110].
In PtG units, the energy conversion in the PtG at time t with conversion efficiency of ( η P t G ) can be modeled as [35,69,73]:
f P t G , t ( m 3 ) = P P t G , t ( M W ) η P t G H V
where f P t G , t ( m 3 ) and P P t G , t ( M W ) are the flow rate of produced SNG by PtG at time t and its EP input, respectively, and H V is the heat value of SNG, i.e., methane, in megawatt hour per cubic meter ( M W h m 3 ). The conversion efficiency of PtG ( η P t G ) is usually considered 0.6 to 0.7, although the PtG technology is growing and high-efficiency PtG units can be taken into account [102]. PtG operation is limited by some related constraints including its input power limit at time t, maximum operational power limit, ramp up and ramp down limits, maximum accessible CO2 and water at time t, and the maximum SNG that can be injected to the gas network or stored. Equations (29)–(34) express the operational constraints of PtG:
P P t G , t P P t G m a x
P P t G , t P P t G i n p u t
R D P t G P P t G , t P P t G , t 1 R U P t G
C O 2 P t G , t C O 2 s t o r e d , t 1 + C O 2 s u p p l i e d , t
H 2 O P t G , t H 2 O s t o r e d , t 1 + H 2 O s u p p l i e d , t
f P t G , t S N G s t o r a g e m a x S N G s t o r e d , t 1 + f i n j e c t , t
where P P t G m a x is the maximum power capacity of the PtG and P P t G i n p u t is the electric power that can be injected to the PtG at time t due to power grid conditions. R U P t G and R D P t G are the PtG ramp up and ramp down limits, respectively. C O 2 P t G , t is the carbon needs of PtG at time t considering the injected electric power and other constraints, C O 2 s t o r e d , t 1 is the stored carbon in the buffer at time t − 1, and C O 2 s u p p l i e d , t is the carbon supplied from CO2 sources at time t. Likewise, H 2 O P t G , t is the water needs of PtG at time t considering the injected electric power and related constraints, H 2 O s t o r e d , t 1 is the stored water in the storage at time t − 1, and H 2 O s u p p l i e d , t is the water supplied from water sources at time t. Finally, S N G s t o r a g e m a x is the maximum storage capacity taken into account for SNG storage, S N G s t o r e d , t 1 is the stored SNG at the storage at time t − 1, and f i n j e c t , t is the SNG injection to the gas network at time t. Taking into account the technical and economic impact of the required carbon and water supply in PtG units on IEGS planning results is a topic which has not been addressed in the related literature. Hence, involving their role and effect in IEGS planning studies may be a motivating area of further research in this field.
In [28,131], a more detailed modeling of the PtG procedure is presented in which the electrolysis and methanation processes are modeled separately. It is possible to consider a H2 buffer between the two processes. In this case, excess energy will be needed to compress the H2 to the desired pressure and discharge it for injection into the NGS [132].

2.3.3. Other Sector-Coupling Components

Furthermore, if the CO2 needed for SNG production is captured from the fossil-fueled power plants, there will be another indirect connection between the EPS and NGS, resulting in the complex inter-section dependencies [121]. It is also possible to recover the heat generated in the methanation process to increase the efficiency of the PtG unit [133].

3. Optimal Planning of IEGS

In the literature, the total cost minimization has been the target of all research works for the optimal planning of the IEGS. In addition, some other issues have been taken into account. For instance, in [74], the IEGS planning has been studied considering the EPS resilience via a robust two-stage optimization problem as well as a series of variable uncertainties to show the severe natural events. According to the results, in the integrated planning of IEGS, less investment costs will be required to create a certain level of resilience. IEGS planning has been done in [51], considering the heat generated by gas turbines as distributed generation (DG). In [64], the long-term planning of EPS in an IEGS market has been studied, and the impact of the NGS on the EPS expansion decisions has been investigated. The results show lower electricity prices and improved social welfare. In [75], an IEGS model is presented considering different types of energy storage, including water reservoir in hydro power plants, NG storage systems, and the line pack effect, presenting a close relationship between storage resources in the two systems and their role in preventing long-term energy shortages. In [54], a multi-stage model is presented to improve social welfare in view of reliability, security, and flexibility. It is demonstrated that integrated planning can improve the social welfare level of the whole society, and make more efficient use of the equipment in both systems. A planning model is presented in [58] for the resilient operation of IEGS with NG storage facilities, demonstrating that disregarding NG pipeline outages may lead to inaccurate results in EPS resilience studies.

3.1. General Formulation

The optimal planning of IEGS is often a multi-stage decision-making problem, which aims to determine the future expansion requirements of both systems to ensure the supply of predicted EP and NG demands with the lowest cost as well as meeting the relevant issues, such as various constraints, uncertainties, reliability level, etc. Thus, a general problem formulation for the optimal planning of IEGS can be composed of an objective function and the related constraints in the EPS, NGS, and their linking components. The objective function—as the target of the optimization problem—often includes economic efficiency, i.e., the minimization of total costs, or may consist of other issues, such as the minimization of CO2 emissions [134,135] and wind power curtailment [136], or the maximization of reliability [53], resiliency [137], and social welfare [54]. It is also possible to formulate the IEGS planning as a multi-objective problem [53,56,76,134,136], in which several objective functions are simultaneously optimized. The general formulation of the IEGS optimization can be summarized as follows:
min / max O F ; S u b j e c t   t o : r e l a t e d   c o n s t r a i n t s

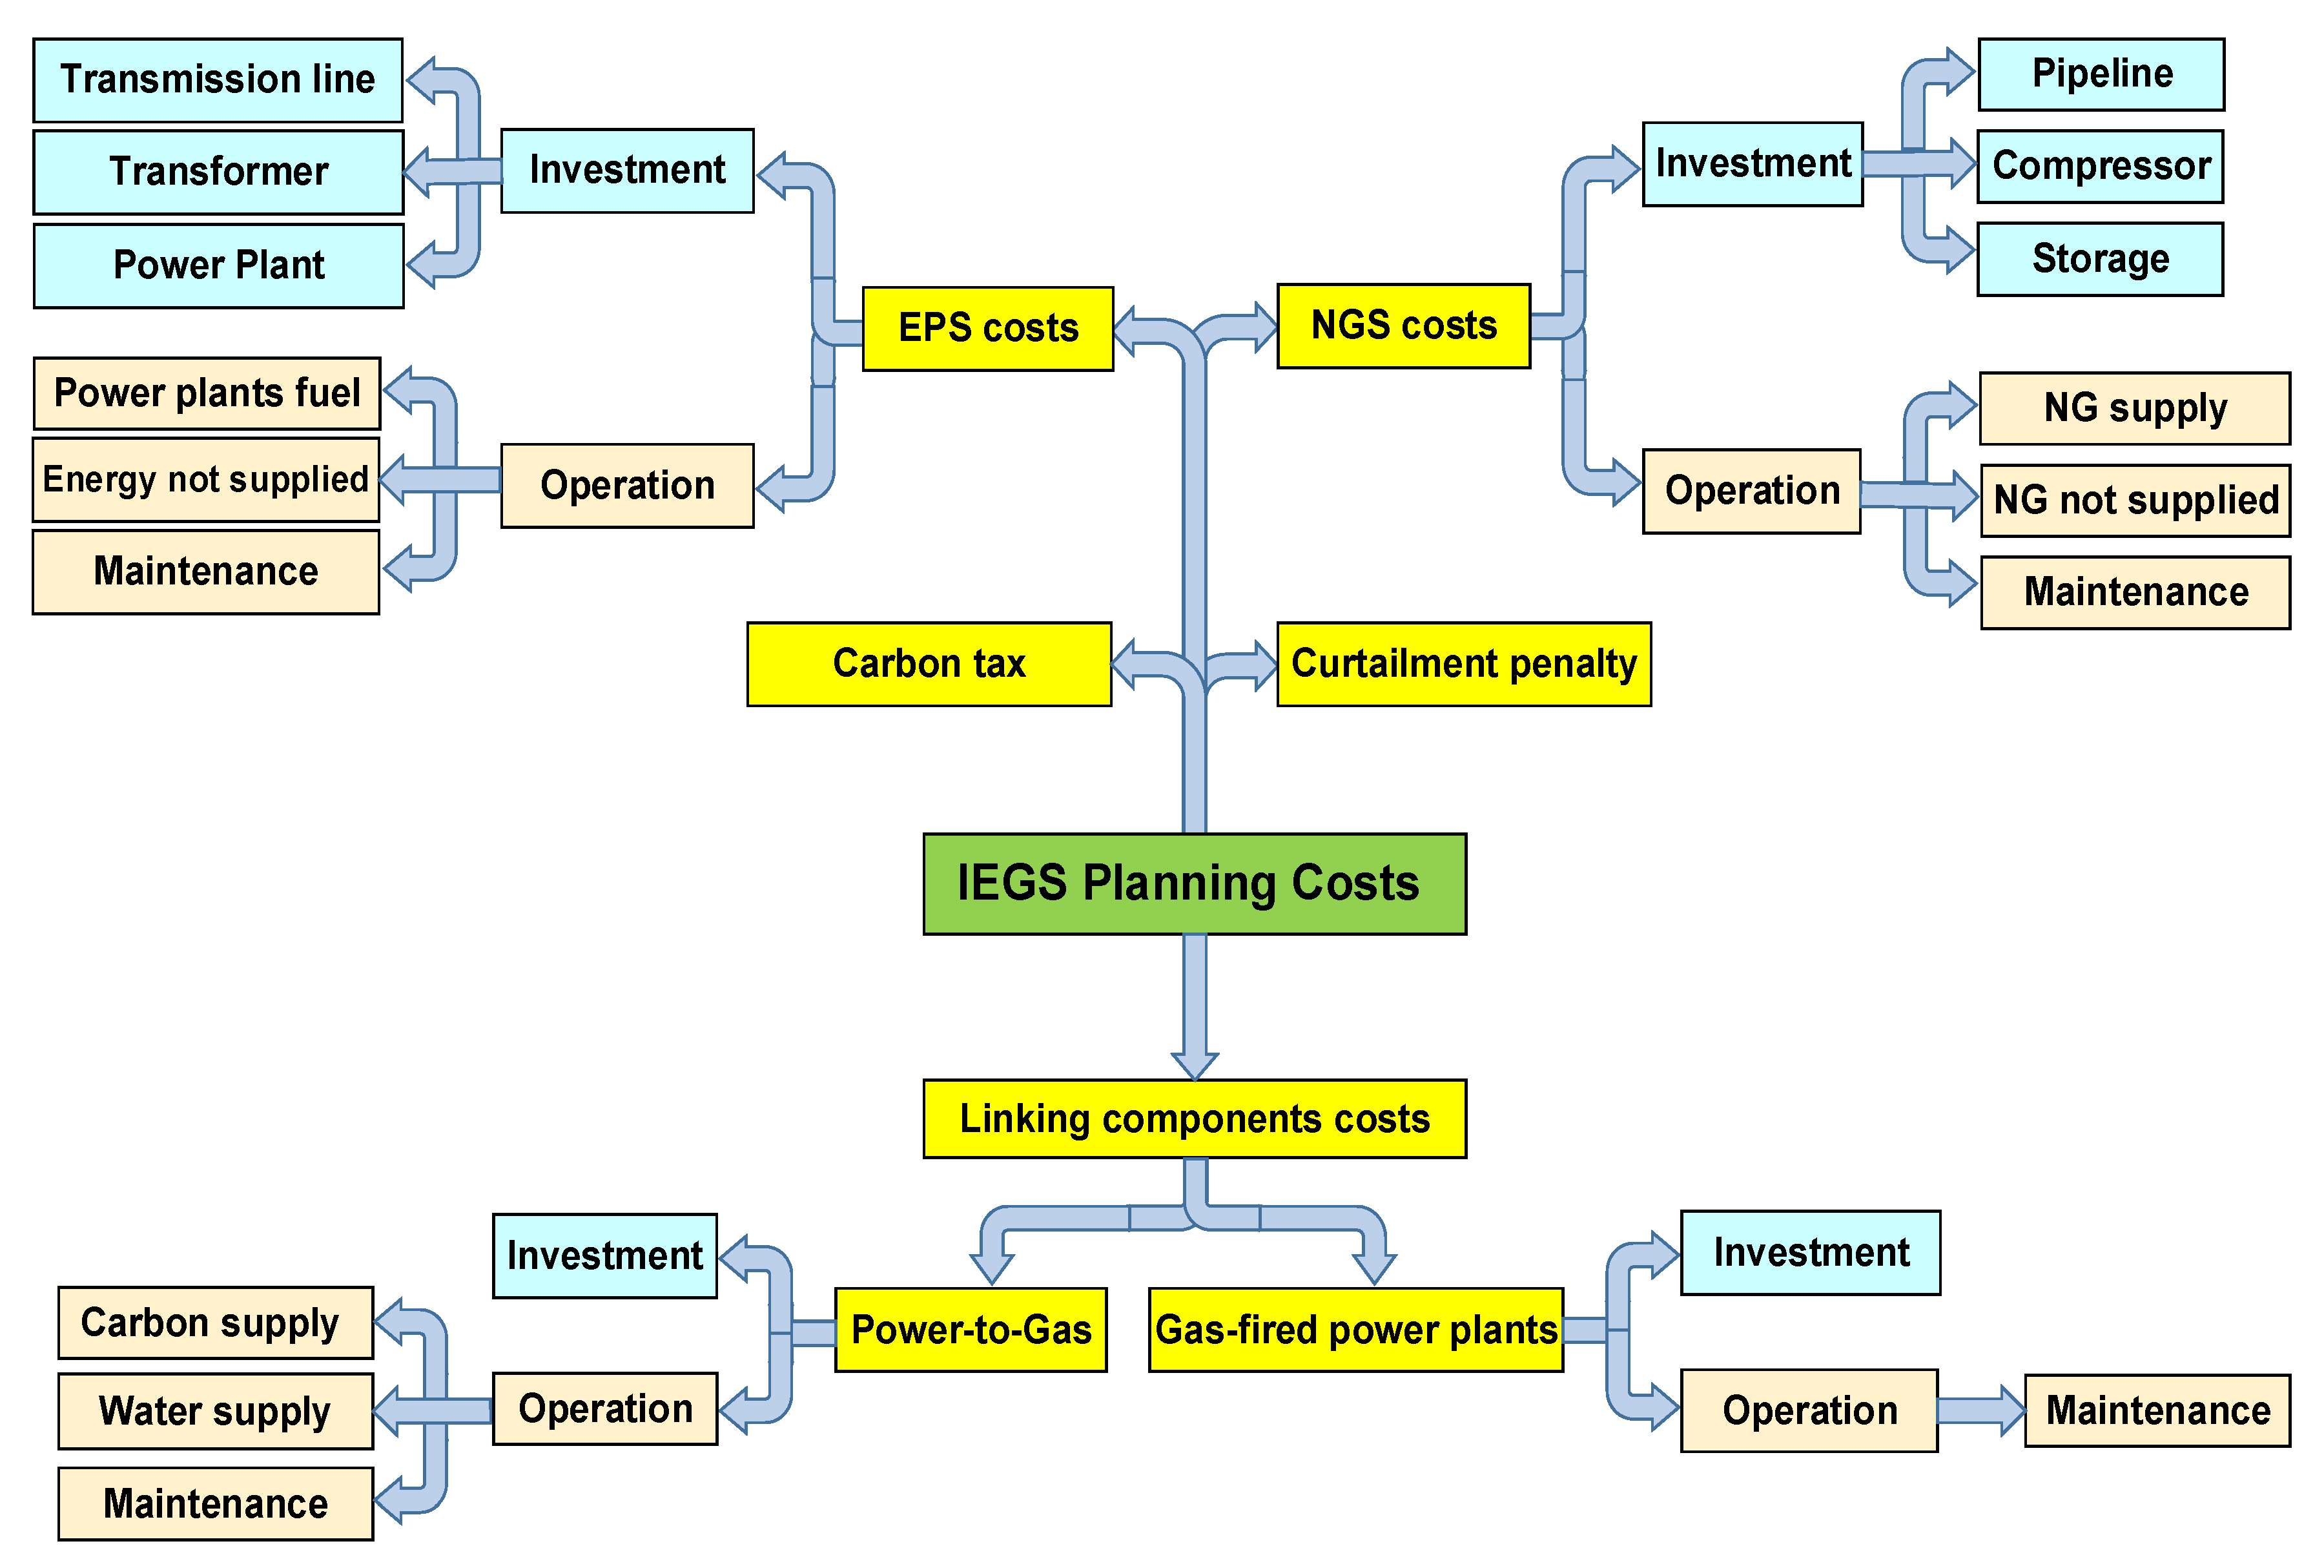
3.2. Objective Function

In the case of considering the total cost minimization as the objective function in the optimal planning of IEGS, the optimization model can be summarized as follows:
min O F = C o s t E P S + C o s t N G S + C o s t l i n k
Subject to: constraints of: EPS, NGS, linking components, and any other relevant constraints. Where C o s t E P S , C o s t N G S , and C o s t l i n k represent the total costs in the EPS, NGS, and linking components, respectively.
Figure 5 illustrates a classification of related costs in the IEGS planning optimization comprising EPS costs, NGS costs, and linking components costs. The total cost in the IEGS planning includes both investment costs as well as operational ones during the time period of the study. Moreover, some other related costs, such as RE-based curtailment penalties, carbon tax, electrical energy not supplied, and NG demand not supplied may also be considered. It is worth noting that the NG cost of GFPPs is taken into account in the NG supply costs; thus, it does not appear in the operational costs of GFPPs.

3.3. Constraints

3.3.1. Planning Constraints

The IEGS planning constraints can be classified into planning and operational constraints [35,62,69]. Planning constraints may include sequential investment states of new assets and generation capacity adequacy constraints [29,35,62]. In commissioning time constraints, when a candidate element is installed in the t 1 t h year, it will be included in the system for the remaining years, which can be formulated as follows:
X i , ( t 1 ) X i , t
where X i is a decision variable denoting the i-th candidate element to be installed in the system. The sequential investment constraint means that the total new installed component in the t t h year will be more than or equal to that in the t 1 t h year.
The generation capacity adequacy constraint guarantees that the total generation capacity of the existing and installed candidate power plants will be able to cover the predicted EP plus system reserve, which can be formulated as:
e P L P e , t ( 1 + R t ) i C P X i , t P i , m a x + i E P P i , m a x
where P e , t , P i , m a x are the predicted load in the t-th year and maximum generation power of the i-th power plant, respectively. X i , t is a decision variable, which indicates the investment state of the i-th power plant in the t-th year. R t is the generation reserve rate in the t-th year, and P L , C P , and E P denote the set of EPS loads, candidate power plants, and existing ones, respectively. A similar constraint can be considered for the predicted NG demand. Moreover, in [69], the retirement of existing coal-fired power plants within the planning interval has been taken into account as a planning constraint, meaning that their operation status will be changed to 0 after retirement:
X i , t r e t i r e = 0 , t T i r e t i r e
where X i , t r e t i r e is the operation status of the i-th coal-fired power plant in the t-th year, and T i r e t i r e is its lifetime.
Non-anticipativity is another planning constraint, considered in [66,79], stating that the decision-makers must not anticipate the outcome of future random events when making their decisions. Hence, the investment decisions made at any stage must depend only on information related to that stage, without taking into account future actions.

3.3.2. Operational Constraints

Typical operational constraints considered in EPS mainly include load flow and power balance equations, the on/off status of generators, generation limits in active power and reactive power (in the case of AC load flow model of EPS), power plants ramp rates, buses voltages, maximum capacities of transmission lines, EP curtailment limits, and active power losses in the case of AC load flow model. The constraints of EPS and NGS linking elements include the operational limitations in GFPPs and PtG units. The operational constraints related to the PtG units include their minimum and maximum operating limits, the PtGs converting process, and the EP consumed by PtG units. In addition, the SNG flow volume of the pipelines connecting PtGs to the NGS should be within the capacity bounds of pipelines, and the EP flowing in feeders (transmission lines) linking PtGs to the EPS should not exceed their maximum capacity [28,138]. The operational constraints of NGS include gas flow equations, minimum and maximum nodal pressure limits, nodal gas balance, the compressor model, the maximum capacity of storage facilities, NG curtailment limits, and minimum/maximum gas supply or import limits [139]. A detailed formulation of operational constraints in EPS and NGS has been presented in [7].

3.3.3. Other Related Constraints

In addition to the above-mentioned constraints, some other limitations such as reliability [66,69], resiliency [74], fuel availability [79,140,141], energy transformation efficiency between EPS and NGS [52], and environmental and carbon emission constraints [72,142,143] have also been taken into consideration in the literature.

3.4. Decision Variables

Decision-making variables in the IEGS planning typically include one or several items of the following:
  • Construction of new transmission lines and substations in the EPS and their optimal capacities or increasing the capacity of existing equipment [29,62,63,66,74,78].
  • Construction of new power plants and determining their technology and capacities [35,53,66,67,74,76].
  • Construction of new PtG units and determining their optimal capacities or increasing the capacity of existing PtG units [29,35,69,73].
  • The power flow in transmission lines in various operating modes [73].
  • Generation capacity of power plants in various operating modes [73,75].
  • Construction of new pipelines, compressors, storage units, and NG supply sources in the NGS as well as their optimal capacities [35,62,63,67,78].
  • The NG supply from wells or import terminals and the NG flowing in pipelines [56,57,59,69].
  • The NG pressure of nodes [61].

3.5. Impact of Uncertainties

Uncertainties have a significant impact on the optimized planning of IEGS, especially in the presence of RE-based generations. Modeling the RES-related uncertainties is a challenge, which along with other uncertainties, adds to the complexity of the optimization model [39]. From a time-scale point of view, the uncertainties related to the IEGS planning can be divided into short-term and long-term types. The former includes EP and NG demands and their prices as well as RE-based generations. The latter consists of uncertainties related to investment plans, regulations, and technological advances, such as interest rate, carbon tax policies, PtG, storage technological developments, etc. From another viewpoint, uncertainties may be categorized into structural and parametric types. Structural uncertainties are associated with the model structure since a model cannot define the perfect description of a real system. Parametric uncertainties can be taken into account as the input uncertainties of the model.
Various uncertainties have been considered in the IEGS planning, the most important of which include EP and NG demands as well as RE-based generations, mainly wind power. Moreover, other parameters, such as EP or NG prices, interest rare, carbon tax, capital investment, etc., have also been considered as uncertain parameters in some research works, as summarized in Table 2.
Table 2. Considering uncertainties in IEGS planning.
UncertaintyRef.
Power and NG load demands[29,35,56,57,59,63,65,66,67]
[54,55,68,72,95,99,144]
Wind power generation[29,35,50,56,58,59,62,72]
[63,65,69,76,99,145]
Photovoltaic generation[57,72]
EP or NG prices[29,52,54,72,141]
Interest rate[63]
Carbon tax[29]
Forced outage rate (FOR)[52]
Occurrence of severe natural disasters[74]
Capital investment[136]
Various plans with different attitudes[71]
Demand response[52,145]
Load forecast error[52]
Modeling the uncertainties in the IEGS planning is generally achieved through gathering historical data and their estimation as a probability distribution function (PDF). Two-parameter Weibull distribution as well as one-parameter Rayleigh distribution are common PDFs for modeling the wind speed behavior, and the Weibull distribution is the most widely accepted and employed PDF for the wind speed description [146,147]. To model the uncertainty of EP and NG load demands, mainly normal PDF [29,66,67] has been employed in the literature, while the uniform PDF has been used in [59] for this purpose.
The stochastic scenario-based approach is one of the most common methods for considering these uncertainties [148,149], in which scenario trees are presented as various planning conditions, such as bi-level problems, to model the planning situations of IEGS. However, as the number of planning variables increases, the number of scenarios will grow exponentially; hence, a large number of scenarios have to be considered in detailed IEGS planning models, leading to a high complexity level and computational burden of the problem. In addition, the exact probability distribution of scenarios must be known based on historical data, which creates another challenge in dealing with uncertainties. To reduce the computational burden associated with the large number of scenarios, several scenario reduction methods have been developed, such as statistical approximation methods and decomposition techniques, in which some sampled scenarios are taken into consideration instead of all scenarios [66]. The scenario reduction method has the risk that the sample scenarios may not represent the whole uncertainty properties. Another method for considering the uncertainties in the problem is to use robust optimization in which, instead of probability distributions, distribution-free parametric sets are used to describe the uncertainties [39,50]. This technique is more conservative than the scenario-based method. Sensitivity analysis is another method which can be employed to assess the impact of uncertainties, in which other variables are considered stable and the effect of variations in one or several related inputs is investigated in the IEGS planning model [150]. According to the literature summarized in Table 3, the majority of research works related to the IEGS planning studies have employed stochastic scenario-based approaches to investigate the impact of uncertainties; however, robust optimization has also been utilized in several studies.
The impacts of uncertainties have been assessed from various viewpoints in IEGS planning. For example, a planning solution has been presented in [67] to minimize the total cost and provide a desirable level of reliability in EPS and NGS. The results show that ignoring the uncertainties leads to a significant reduction in reliability. Minimizing the costs in IEGS through a two-stage stochastic optimization model is presented in [68] in the presence of uncertainties in power and NG consumptions. It is emphasized that ignoring uncertainties may lead to inaccurate planning of the grid expansions. A stochastic multi-stage problem is formulated in [65] for the planning of IEGS with uncertainty in RE-based generations and load demands, verifying that proper consideration of uncertainties results in optimal investments and the reduction of costs in the whole system. A decentralized stochastic model is presented in [63] to reduce operating and investment costs in EPS and NGS accounting for uncertainties in wind power, interest rates, and load demands. The results indicate that considering severe uncertainties can lead to higher costs of grid expansions. In [76], a multi-objective optimization model is proposed for the planning of IEGS with uncertain wind power generation, revealing that uncertainty in wind power generation can increase the total costs. The IEGS planning in terms of simplified frequency constraints is studied in [56] concerning wind and EP demand uncertainties; the results imply that the considered uncertainties in the presence of frequency constraints have a great impact on the system planning where more expansions may be needed.

3.6. N − 1 Contingency

The N − 1 security criterion is commonly employed in IEGS planning to guarantee the reliability of the system. It necessitates that under any single contingency event in the system, the normal operation has to be continued without any load curtailment. Investigating the impact of the N − 1 contingency on the optimal planning of IEGS has been considered one of the crucial issues in several literature. In a number of research works, the N − 1 contingency only in the EPS has been studied, but in some others, both EPS and NGS have been assessed. Table 4 summarizes the literature concerning this issue.
In [69], the N − 1 contingency in the EPS has been modeled using the worst-case scenario. Results show that the integrated planning of IEGS can limit the power imbalance in the N − 1 contingency and ensure the overall reliability of the system. In [57], the N − 1 contingency in both EPS and NGS has been evaluated by the reduced disjunctive model (RDM) to reduce the computational burden. In [35], the N − 1 contingency in power transmission lines is considered by a contingency screening method based on the line outage distribution factors to identify and create a set of chief events to satisfy the N − 1 criterion. It is shown that by N − 1 contingency consideration, more transmission lines and pipelines are needed, which will lead to increased investment costs. In [56], by considering the N − 1 contingency in both EPS and NGS, their significant impact on increasing the required equipment in the IEGS expansion planning has been revealed. Ref. [70] considers N − 1 contingency for both EPS and NGS using a contingency matrix and evaluates its impact on the IEGS expansion planning.

3.7. Impact of Renewable Energy Sources

Renewable wind and solar generations will affect the planning of IEGS. For example, sudden changes in the RE-based generations, in addition to affecting the EPS operation, will lead to changes in NG demand. Therefore, various studies have examined the impact of renewable generations on the optimal planning of IEGS. A stochastic two-stage method is proposed in [72] for the Queensland IEGS in Australia, considering the high-penetration level of renewable generations. Investment decisions for constructing power plants, NG suppliers, transmission lines, and gas pipelines are determined as here-and-now decisions. Then, operational decisions are made as wait-and-see parameters. Based on the results, increasing the penetration level of renewable generations reduces the amount of NG flowing in gas pipelines and thus, postpones the need for their expansions. Moreover, considering environmental constraints has increased the total costs due to the need for further investment in RE-based generations as well as transmission lines and substations. In [57], a two-objective model is presented for IEGS planning regarding the effect of high-penetration photovoltaic generations. In the first objective, total cost is minimized, while the second objective minimizes the pollution from power plants. The problem is solved by the Epsilon-constrained method, and then, Pareto front is obtained to select the optimal solution by the fuzzy method. The results show that the photovoltaic generations, in addition to saving the total cost, have led to a significant pollution reduction. A decentralized stochastic model is proposed in [63] to reduce the total cost in IEGS. In addition, regulatory policies are considered to limit the penetration of renewable generations. The results show that increasing the capacity of wind farms has reduced the power generation costs.

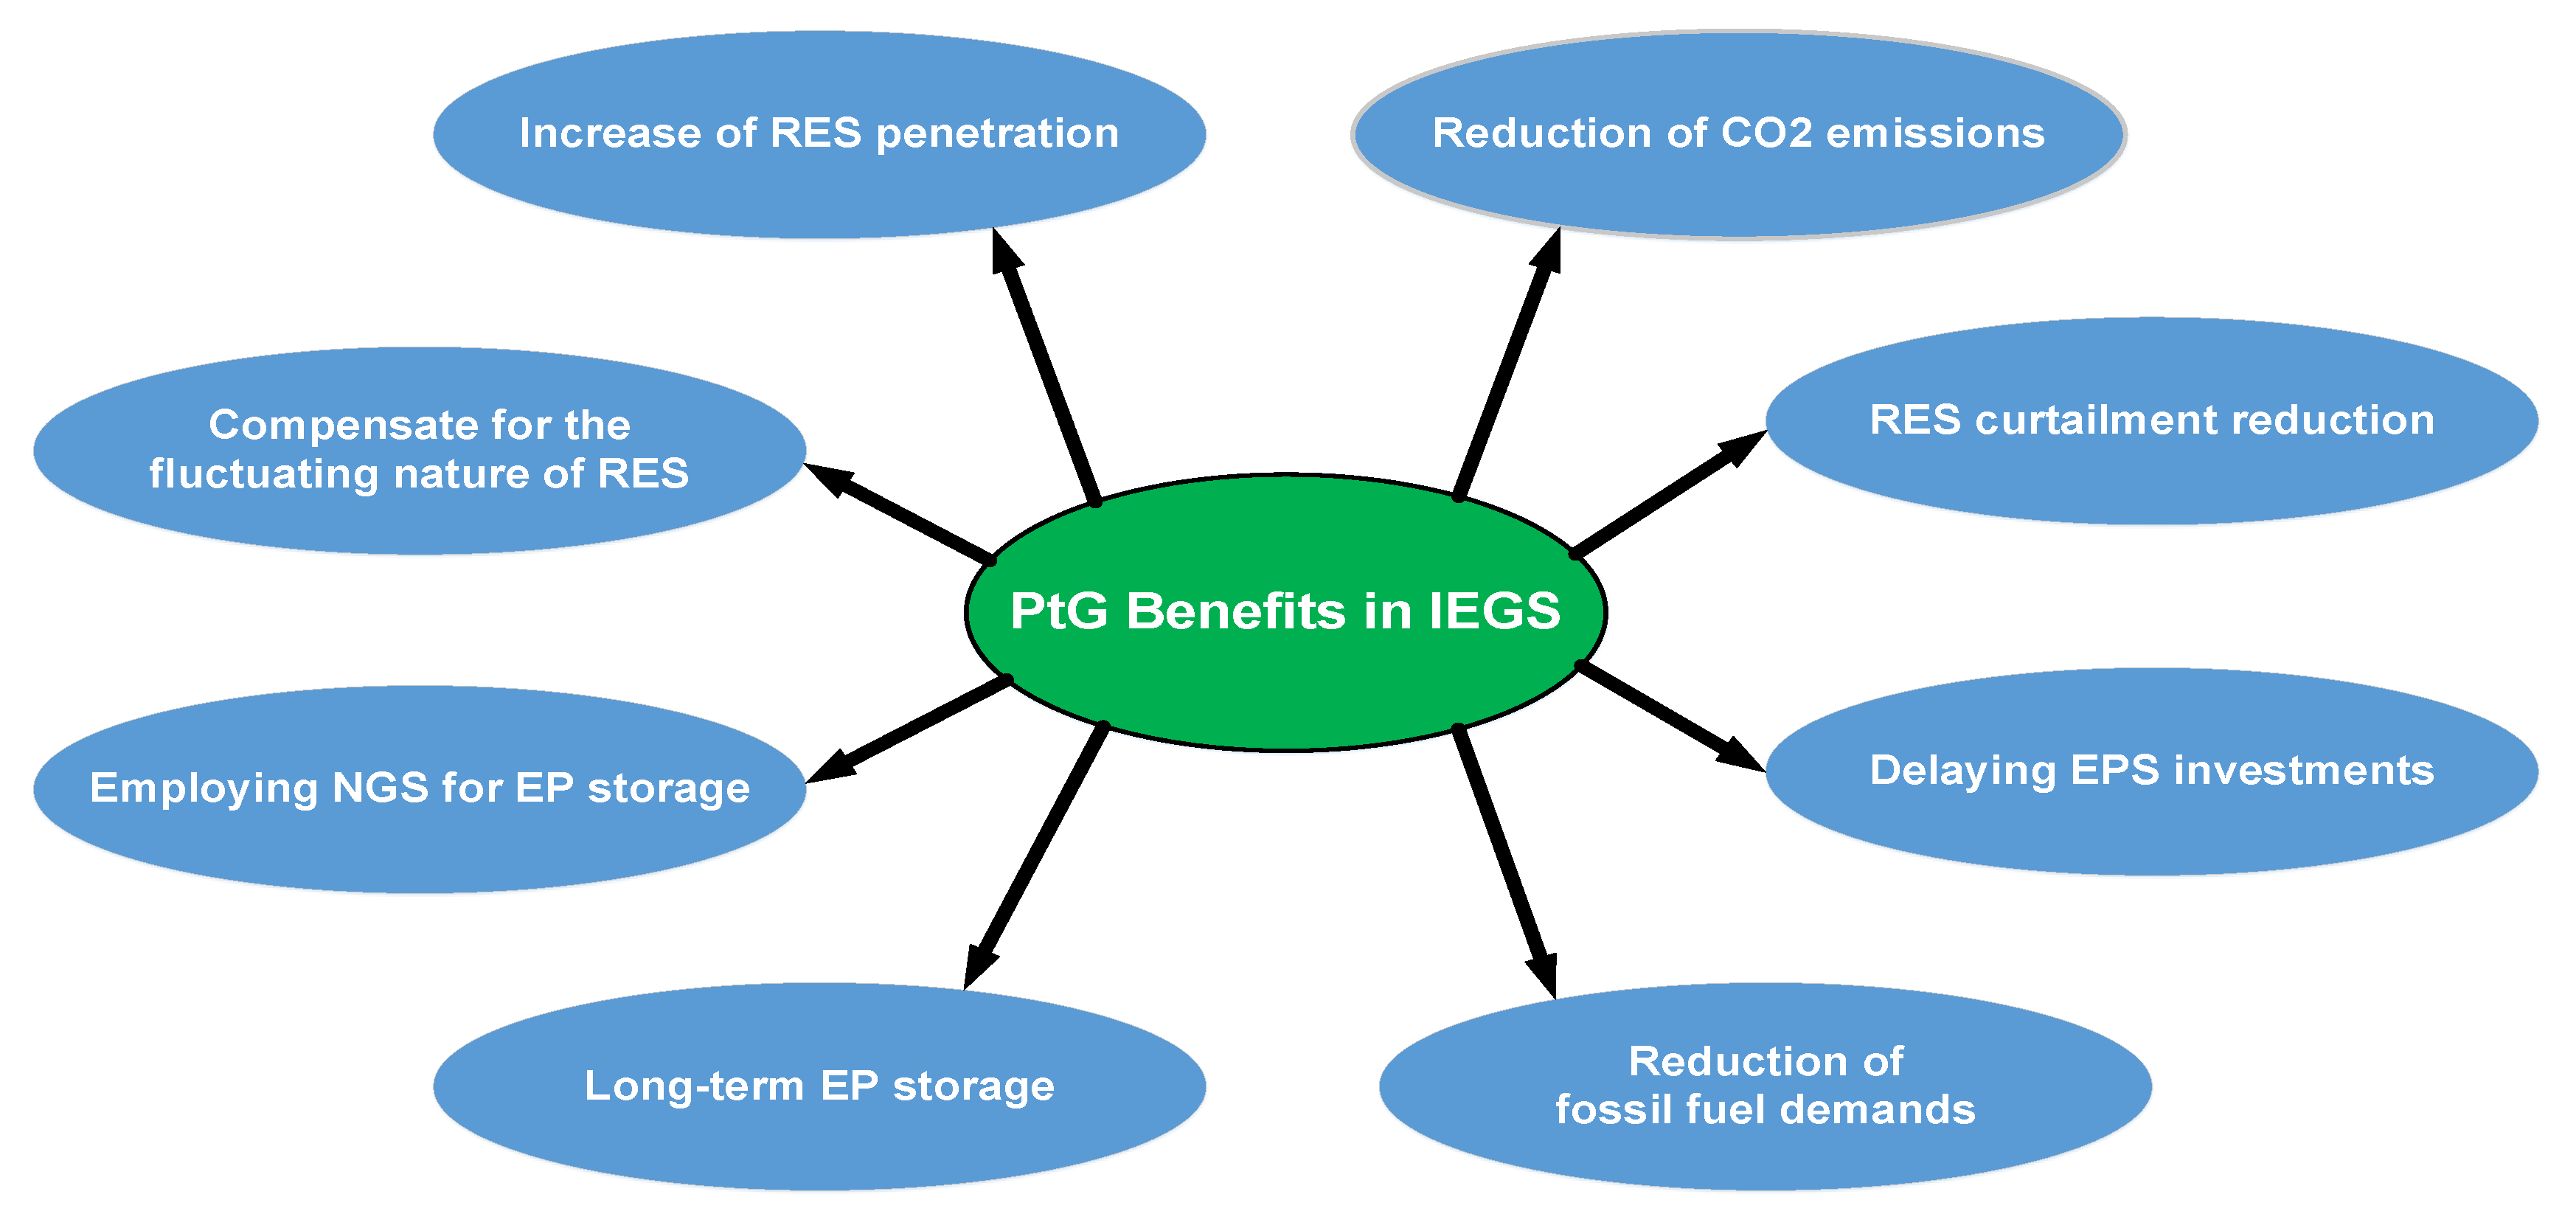
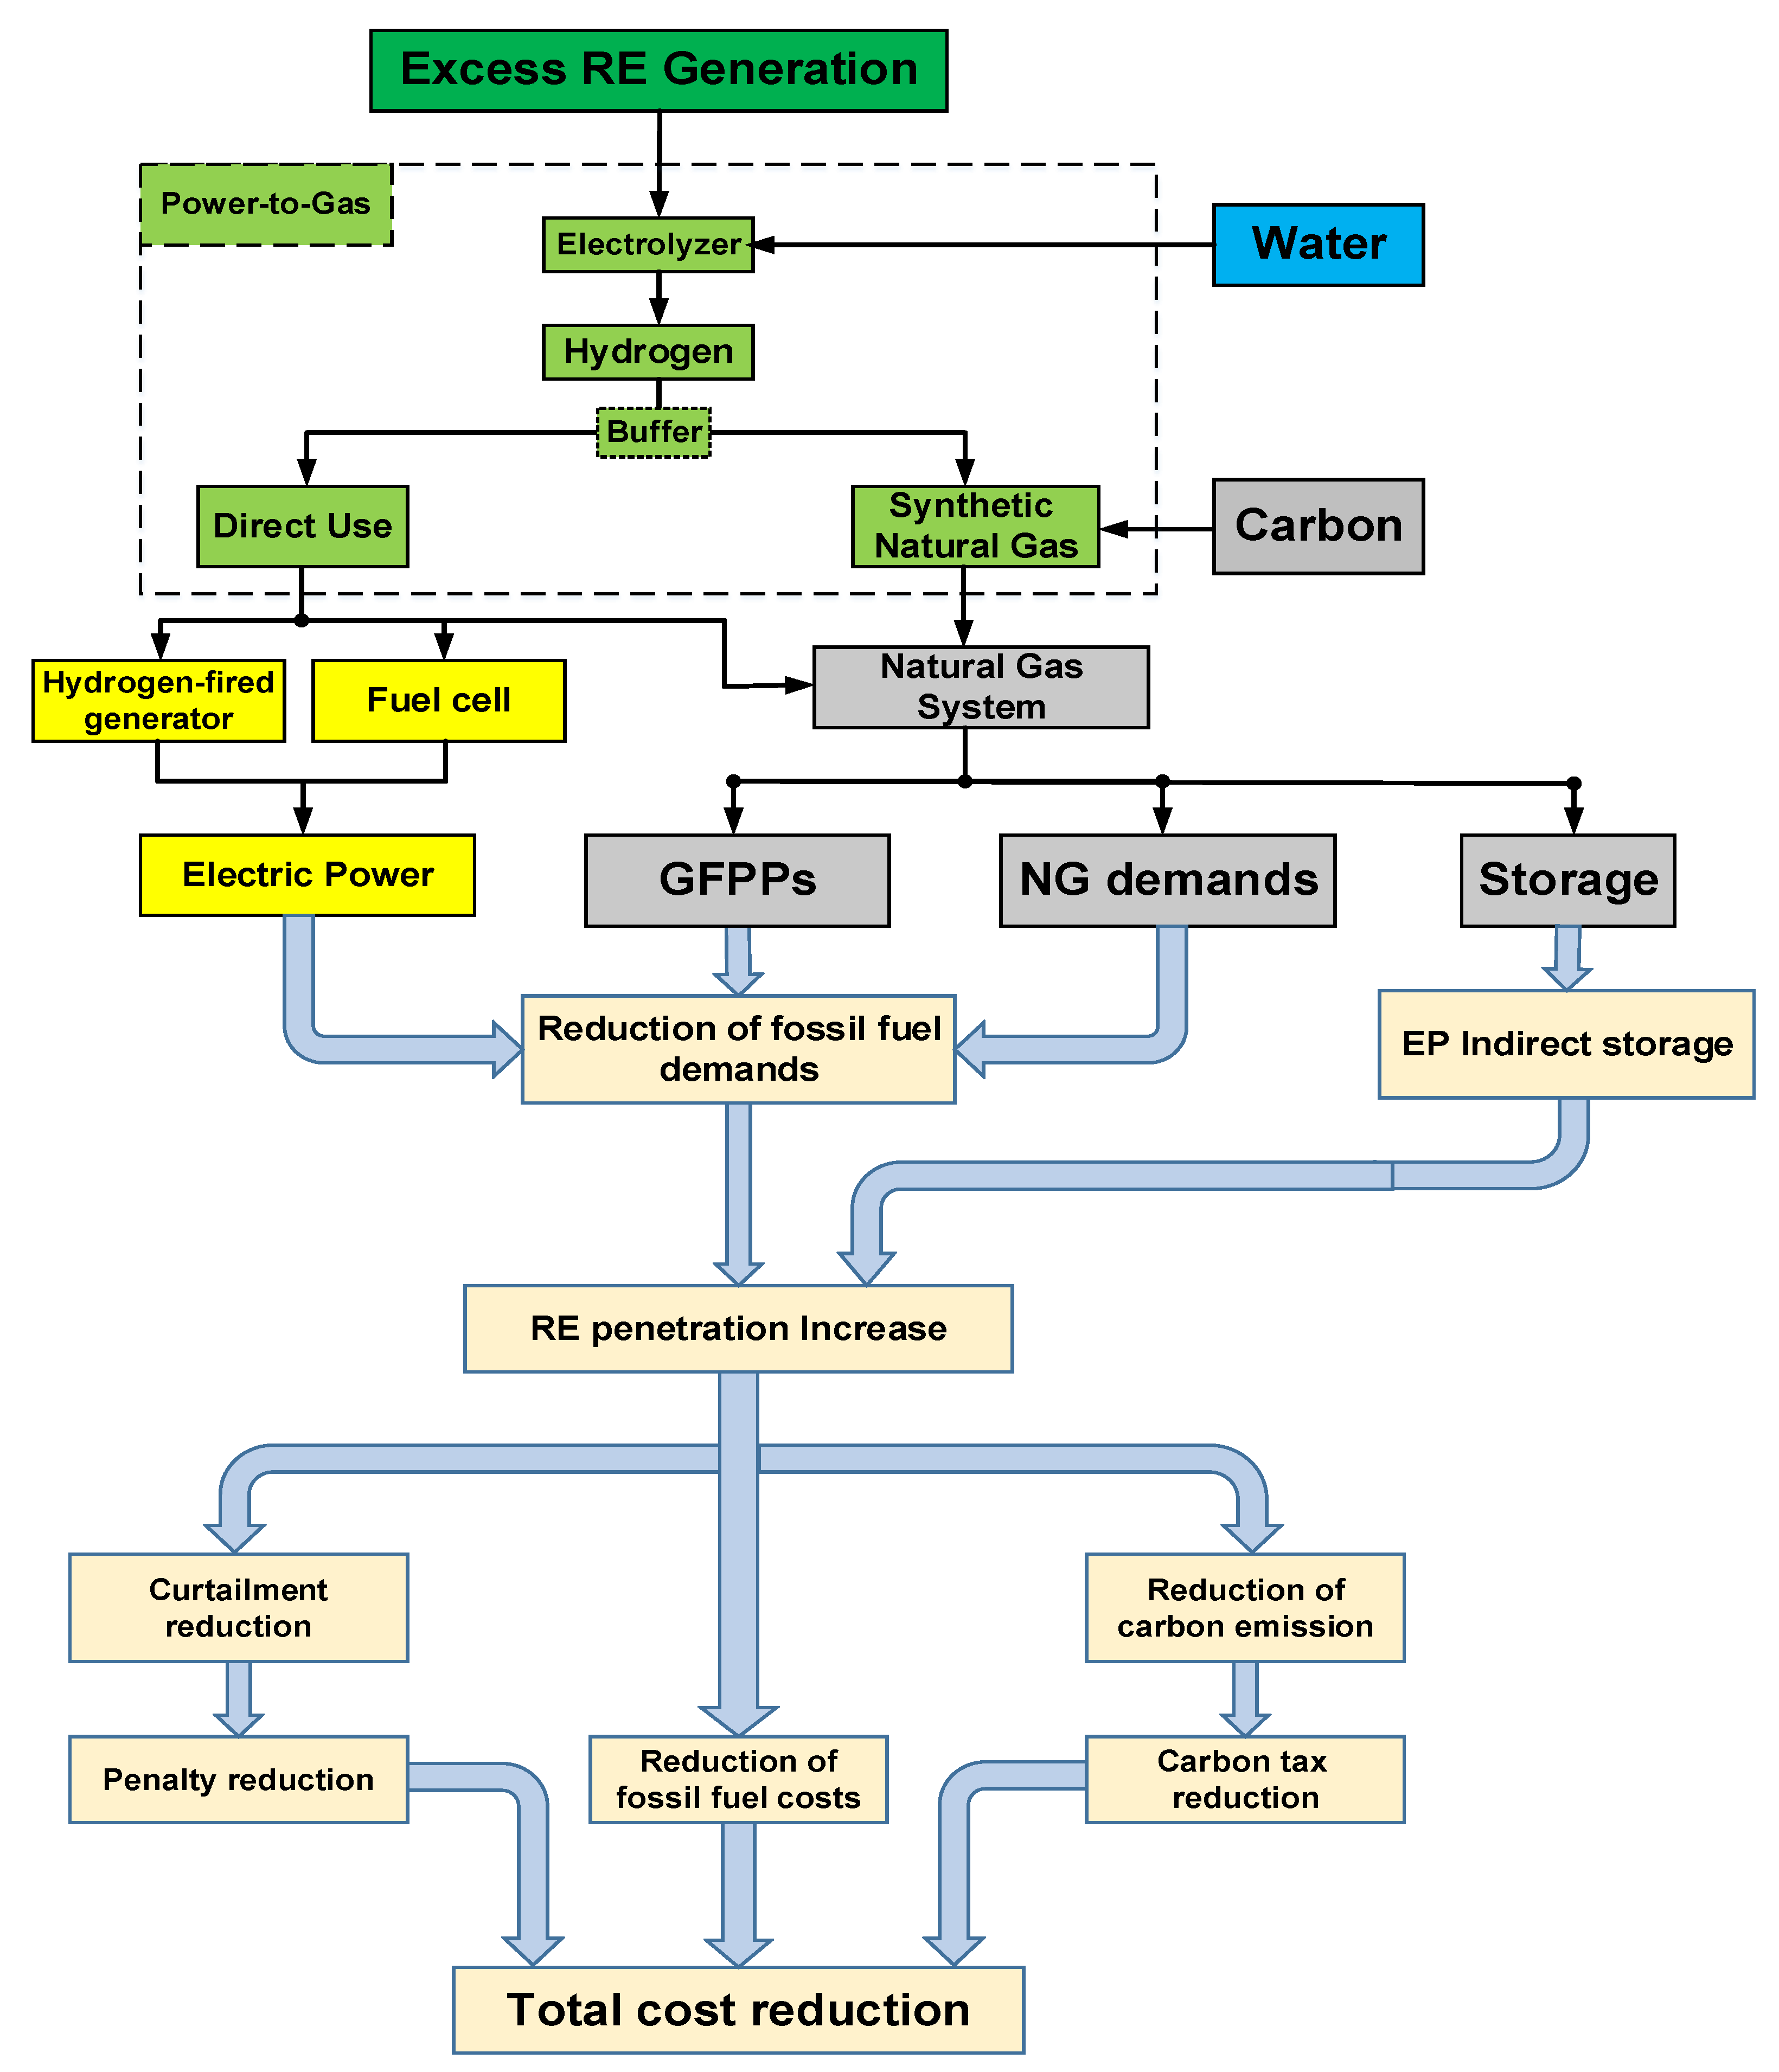
3.8. Impact of Power-to-Gas Units

As mentioned before, PtG units are the innovative linking components between EPS and NGS. The integration of these units in IEGS will have several benefits for both NGS and EPS as well as environmental welfare. The main advantages of employing PtG units in IEGS can be categorized as Figure 6. Based on these benefits, PtG units can reduce the total costs in several ways. Figure 7 illustrates the impacts of PtG on the IEGS costs via increasing the penetration of renewable energies in the IEGS. The reduction of carbon emissions (carbon tax), fossil fuel costs, and the curtailment penalty of renewable-based generation are the main issues of cost reductions resulted from the utilization of PtGs in the IEGS.
The main effect of PtG on saving IEGS costs is through the increase of RES penetration in several ways, including EP generation and other NG demands as well as the utilization of the NGS capacity for the long-term and large-scale indirect storage of RE-based EP [26]. Therefore, increasing the RES penetration through PtG will mainly lead to the reduction of fossil fuel costs, RES curtailment penalties, and carbon tax, which all together will result in total costs reduction and social welfare improvement. Furthermore, reducing fossil fuel demands, including NG, in countries where a portion or whole NG needs are imported, in addition to the economical aspect, will have other political and social benefits.
The employment of PtG in the IEGS planning at large scales, however, is faced with several issues [121], such as policymakers, regulators, participants of energy markets, and system operators, which should be carefully examined for better use of their advantages and flexibilities. One of the related issues is the CO2 source required for SNG production in the PtG units. Regarding the low purity of CO2 in the air, large-capacity PtG units need to use other sources of CO2, including exhaust gases from fossil-fueled power plants, the industrial sector, transportation sector, and biomass. Technical constraints and the costs of CC will affect the feasibility of PtG units and their impact on IEGS. In related research, the technical constraints and costs of CO2 supply generally have not been the focus; however, real systems will be affected by these constraints and expenses. The other issue is assessing the impact of the water supply required by PtG units for the electrolysis process to produce H2, which can affect the planning of PtG units, especially in dry and low water areas. To obtain one kilogram of hydrogen, about 9 L of ultrapure water are needed [151,152]. Hence, in large PtG units, the amount of required water will be significant. This constraint and its related costs have not been considered in the related literature. The direct use of H2 in H2-fired turbines or fuel cells [153] is a crucial topic in the use of PtG due to its advantages in increasing the efficiency of the PtG process.
Several studies have been performed regarding the impact of PtG units on IEGS. A multi-stage stochastic model is presented in [29] considering PtG for the long-term planning of IEGS to maximize the RES penetration. It has been shown that the economic viability of PtG highly depends on the penetration level of RES and carbon tax. A mixed-integer linear programming (MILP) model is proposed in [35] for the long-term planning of IEGS in the presence of PtG and GFPPs. Numerical studies demonstrate that when the PtG is not employed, the investment cost is increased due to the construction of new transmission lines. Moreover, PtG can increase the wind power penetration and reduce the total cost. In [73], a two-stage planning model is presented for IEGS planning. The real IEGS in western Denmark is studied, and CO2 pipelines from GFPPs to PtG units are also considered. It is shown that with the increase in wind power penetration, the capacity of coal-fired power plants and operational costs are reduced, but more investment in GFPPs and PtG units will be required to ensure a reliable energy supply. In addition, SNG storage helps to reduce daily operating costs and carbon emissions.
A MILP scenario-based model is formulated in [62] for IEGS planning in the presence of PtG units, which aims to minimize wind farm investment costs, NG storage, and the operating costs of the whole system. It is revealed that PtG units can be a significant source of SNG, and their integration with wind farms and NG storage can be an effective solution to reduce NG shortages. In addition, SNG storage plays an important role in balancing temporary energy needs in an IEGS. A long-term planning model is presented in [69] for the optimized planning of PtG-included IEGS. The results show that PtG can increase wind power penetration and delay the construction of new power transmission lines, and hence, reduce the total costs. In addition, investment options in both systems are highly interdependent. For example, the retirement of coal-fired power plants has led to the construction of more GFPPs, resulting in the construction of more pipelines and compressors.
Ref. [60] presents a two-level model for PtG planning to maximize the social welfare and increase the market profit. It is shown that due to the high investment costs of PtG, it is cost-effective in networks with a high-penetration of RES. Moreover, the optimal location of PtG units in the EPS as well as the direct sale of H2 will have a significant effect on the relevant income. The utilization of uncertain wind power generation to increase the revenue of PtG units has been investigated in [50]. The results show that the higher the uncertainty of wind farms, the more conservative their planning strategies are. In contrast, the PtG units can compensate for the negative impact of uncertainties. Finally, in [61], a quasi-static model for gas dynamics is used to solve the optimization problem with a low computational burden. The results verify that the bidirectional connection between EPS and NGS can replace or postpone the network expansions.

3.9. Reliability Assessment

Due to the importance of reliability in the optimal planning of IEGS, various reliability indices may be considered. A mixed-integer non-linear programming (MINLP) model for the multi-purpose planning of IEGS is presented in [53] to minimize the investment costs and improve the expected energy not supplied (EENS) as the reliability index using the optimal Pareto curve. A linear model is proposed in [77] to minimize total costs, considering the EENS reliability index. Ref. [55] presents a solution for the sequential planning of gas-fired distributed generations, NG grid, and capacitor banks in distribution networks to minimize the total costs in IEGS, considering the desired level of reliability. Moreover, sensitivity analysis has been performed for 96%, 97%, and 98% reliability levels. A reliability-based model for planning IEGS is presented in [154] to minimize the cost of constructing power transmission lines and NG pipelines while meeting the loss of load expectation (LOLE) as the reliability index. A multi-stage model is presented in [79] to minimize costs while meeting a certain level of reliability indices, including EENS and loss of energy probability (LOEP). The optimization results indicate that NG transmission constraints affect the planning of the EPS, especially in the candidate sites for constructing the GFPPs. In [52], an integrated planning model of EPS and NGS is formulated considering the reliability index of expected unserved energy (EUE) in order to minimize the total costs in both systems. In [67], a model is proposed for minimizing the total costs in the IEGS while meeting a desirable reliability level. It is demonstrated that considering the reliability of 98% to meet the EP and NG demands and a total level of 96% for the entire system increases the investment costs by 138%. On the other hand, the co-optimization of reliability levels in both systems has reduced the investment costs by 19.3%.

3.10. IEGS Planning Studies in Real Networks

Integrated planning studies of NGS and EPS are typically performed on relevant test systems. The IEEE 118-bus and IEEE 24-bus electrical test systems as well as the Belgian 20-node one are the most employed test systems in the literature. Furthermore, some researchers have implemented real IEGSs to better verify the results of their work. Table 5 summarizes the literature with real networks employment to study the relevant contributions.

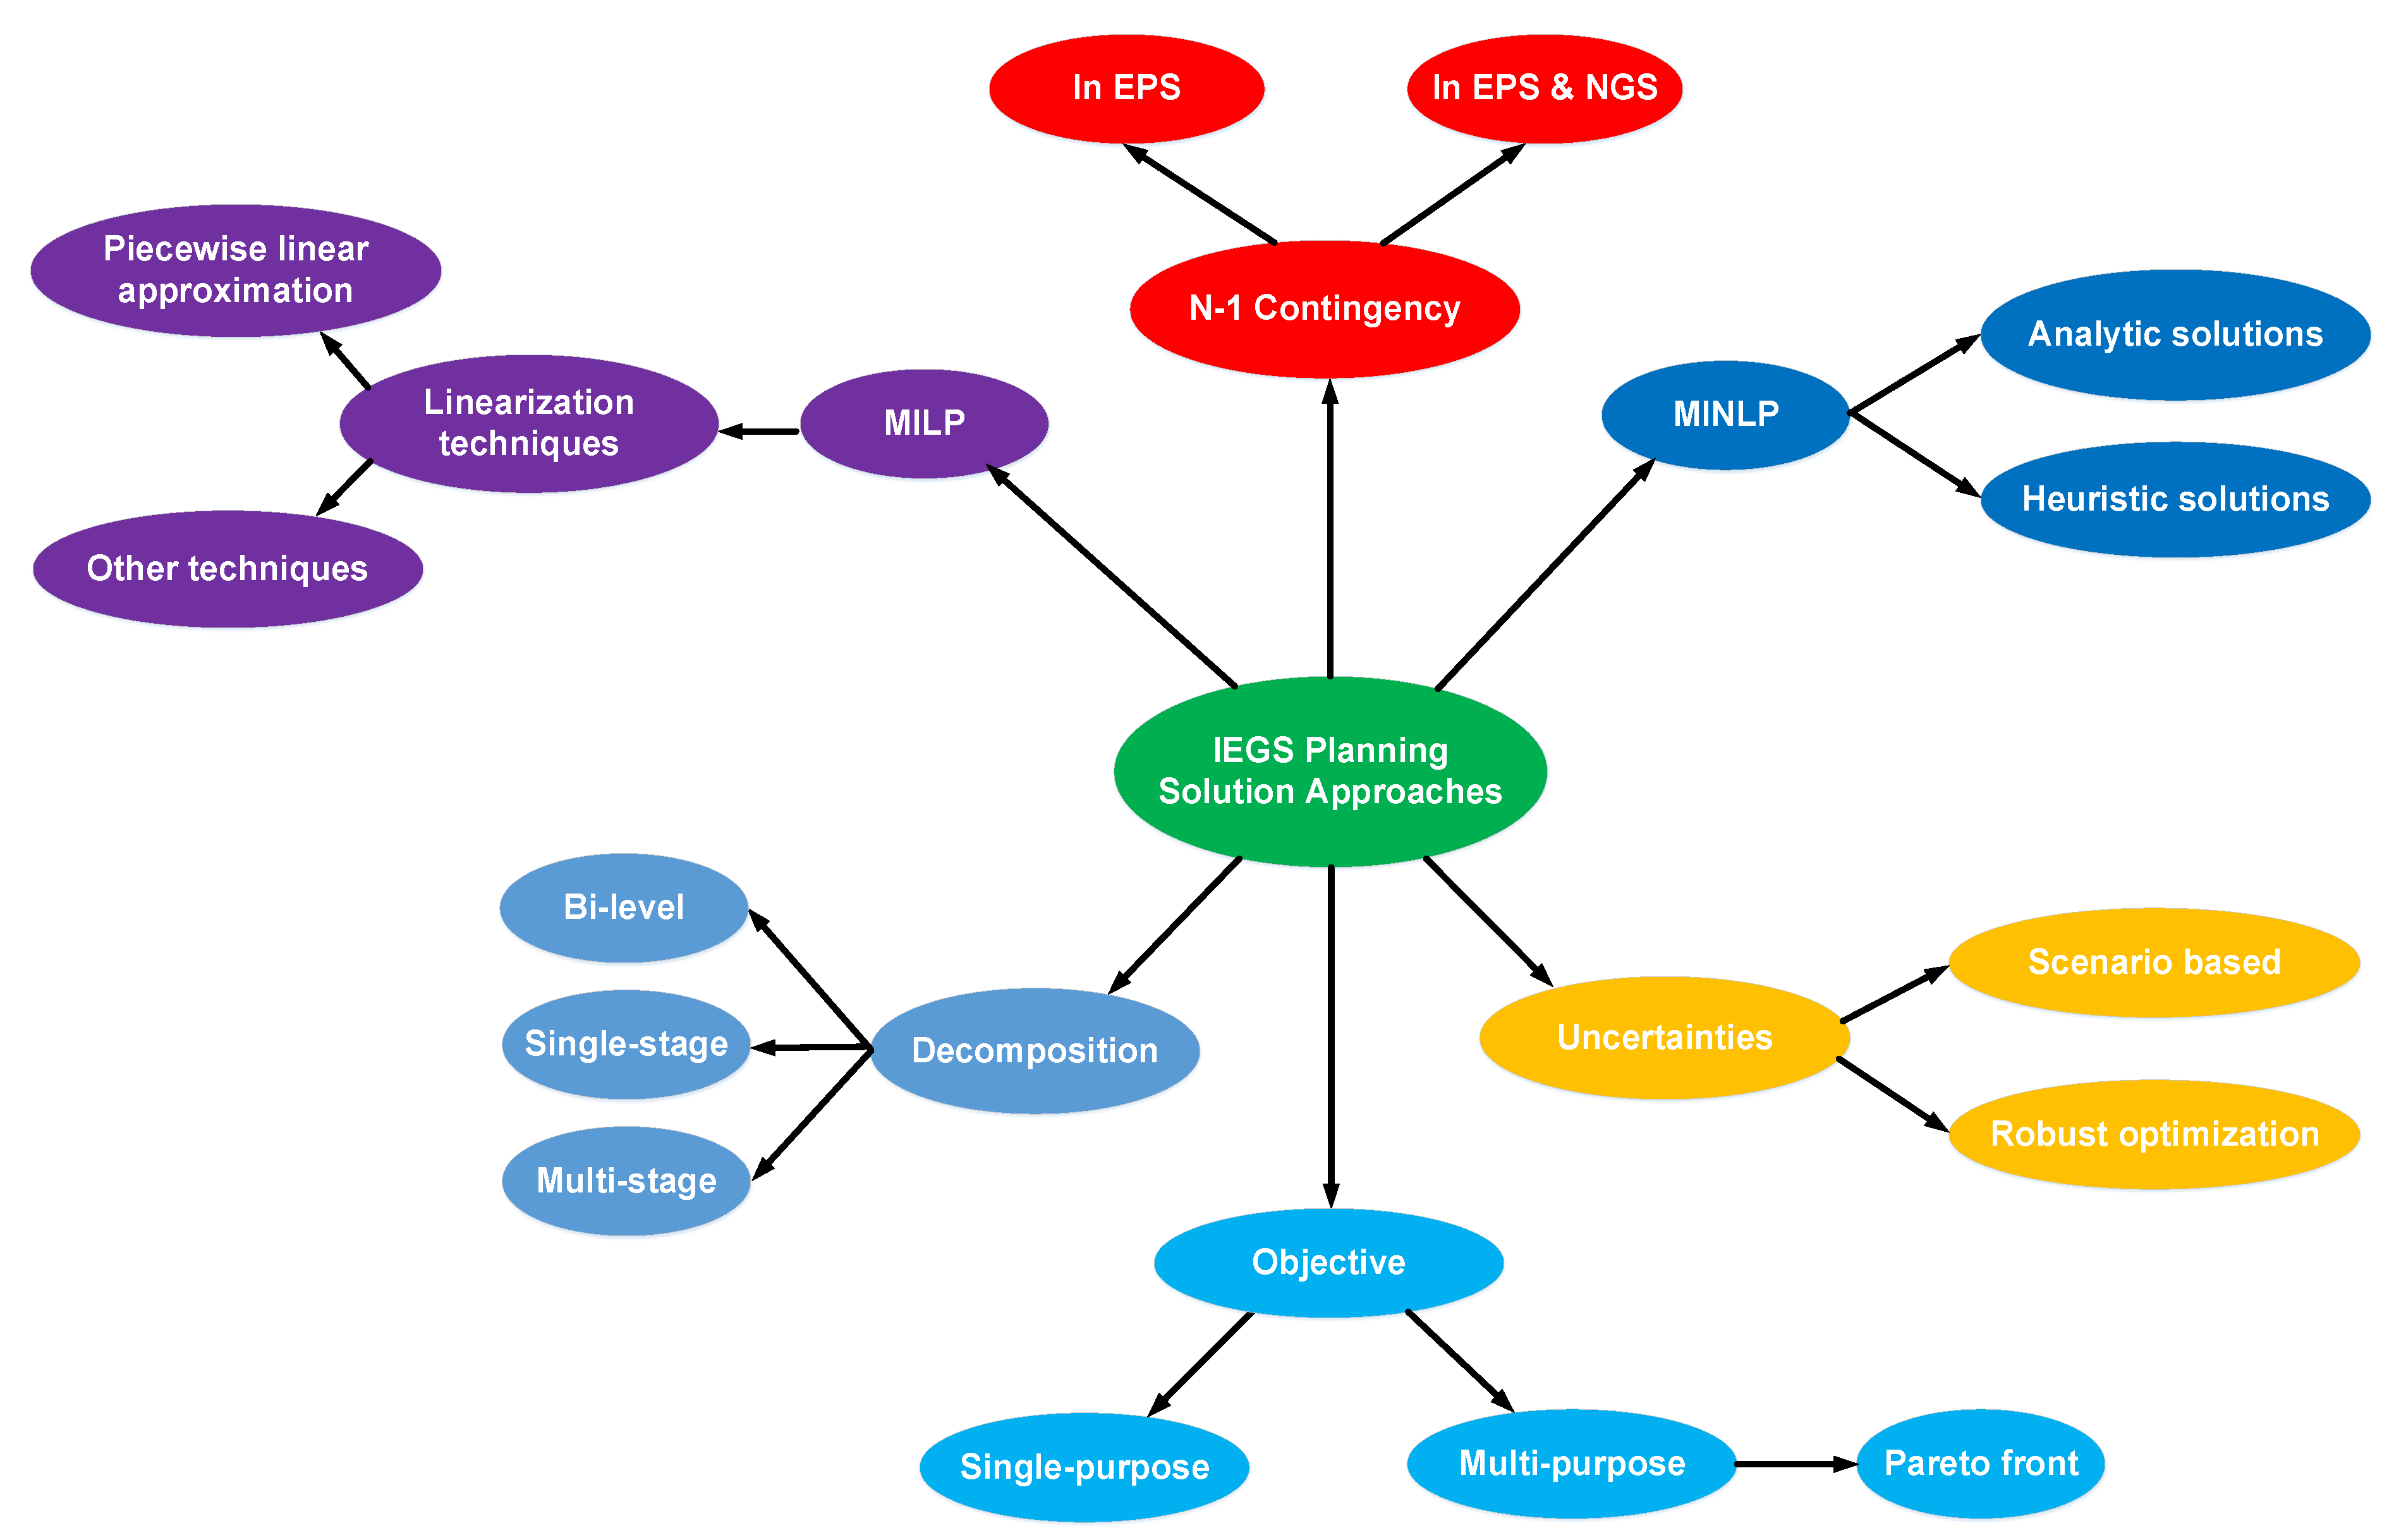
4. Solution Approaches

The solution of IEGS planning problems is faced with several challenges, the most important of which is the existence of non-linear and non-convex constraints in both EPS and NGS models, which makes the optimization model to be a MINLP problem with several challenges, especially its high computational burden. In some papers, the authors have employed various methods and algorithms, including non-linear solvers [55,63,67] or heuristic and meta-heuristic methods, such as the modified differential equation algorithm [52,54], Genetic Algorithm (GA) [76,78], Particle Swarm Optimization (PSO)-based algorithms [73,141], etc., for a direct solution of the non-linear problem. For example, a three-stage framework is presented in [78], where the GA is used to solve the MINLP problem.
Nevertheless, to reduce the computational burden, non-linear and non-convex equations are converted into linear equations using different simplifications and convex relaxation techniques. Consequently, the optimization problem is solved as a MILP problem. Piecewise linear approximation is a well-known method employed in numerous literature [51,56,61,62,65,66,68,69,70,75] for transforming the MINLP problem to MILP in which the non-convex and non-linear equations are approximated with piecewise linear segments. The first-order Taylor series approximation has been employed in [77] in addition to piecewise linear approximation to handle the non-linear equations in EPS and NGS. Moreover, the non-linear problem in [60] has been linearized using the duality theory and Karush-Kuhn-Tucker (KKT) optimality conditions. The classification of IEGS planning solution methods is summarized in Table 6, confirming that most of the research in the literature have employed MILP formulation and have utilized analytical techniques to solve the optimization problem. Various linear solvers, such as CPLEX in the General Algebraic Modeling System (GAMS) tool [155], are very common in this context. Figure 8 illustrates the issues related to the solution approaches of IEGS planning.
Another challenge in IEGS coordinated planning is the large-scale and complex nature of the problem, which needs a centralized and synchronized optimization in its different sectors. This issue may add to the problem complexity. The IEGS is associated with different markets, each with its policies and regulations, which can lead to difficulties in its coordinated planning [63]. The variety of markets, including electricity, NG, H2, SNG, CO2, and H2O, makes the IEGS planning problem a decentralized decision-making issue from the market viewpoint with a significant data exchange between them. In this case, the IEGS planning problem can be solved either from the perspective of a central planner or via distributed optimization approaches. The central planner should have an in-depth knowledge of the entire system to make the relevant decisions and supervise the sub-systems. In [71], a static planning model is presented, assuming that a central planner is responsible for planning the coordinated expansion of EPS and NGS while conserving their independence. The decision-making attitudes conflict with each other, and the presented method selects the best plan from the existing attitudes. In the distributed optimization approach, the main problem is decomposed into two or more subproblems via decomposition techniques. Therefore, these subproblems are easier to manage. Table 7 compares papers related to the integrated planning of EPS and NGS from various aspects, including uncertainties, the use of PtG units, the optimization model, test systems, solution methods, the planning horizon, and other contributions.

5. Conclusions and Future Research Guidelines

Increasing the penetration of RES in the generation mix is very crucial for various purposes, including the reduction of total costs and carbon emissions as well as meeting international agreements on climate changes. However, the uncertain and fluctuating nature of these resources poses significant challenges to their higher penetration. IEGSs can be considered a suitable solution to address these challenges, and their coordinated planning, while increasing the penetration of RES will reduce total costs and increase the efficiency of the overall system. On the other hand, the integrated planning of IEGS is influenced by the RES fluctuating nature, and will have a significant impact in achieving accurate results.
Employing PtG units in the IEGS planning is of particular importance in various aspects, including the increase of RES penetration, employing the storage capacity of the NG network for indirect storage of electricity, preventing or reducing the curtailment of renewable generations, and compensating for the drawbacks of RES intermittency. Regarding the different effects of PtGs in IEGS, multiple issues such as uncertainties, reliability, resilience, cost minimization, RES curtailment reduction, CO2 emissions, etc., have been studied. However, more research is needed in some other cases. In this regard, the impact of the constraints associated with PtG units on the optimized and accurate planning of IEGS is necessary to be examined more comprehensively. Based on the literature reviewed by this paper, the following aspects can be addressed as the guidelines for future research on the topic:
(1)
PtG units require high-purity CO2 sources, which can be supplied from various sources. Costs and technical constraints related to the CO2 supply in terms of multiple factors such as purity, distance from PtG units, etc., will play crucial roles in their optimal planning as well as their economic viability and technical feasibility. In the related research works, the impact of CO2 supply on the IEGS planning has not been considered. Moreover, the carbon capture cost is not included in the optimization models. Considering the impact of CO2 supply in the optimal planning of IEGS can be an attractive research line in the future.
(2)
Costs and technical constraints of water supply in PtG units may affect the optimal planning of PtG-included IEGS. In the literature, this issue has not been addressed by assuming that the required water is available without any limitations. Its supply cost has not been included in the problem formulations either.
(3)
The output of PtG units in IEGS planning is mainly considered SNG, which is injected into the NGS. However, the direct use of H2 in H2-fired gas turbines or fuel cells is an attractive alternative due to its advantages in increasing the efficiency of the PtG process.

Author Contributions

Conceptualization, M.K. and A.R.; methodology, M.K.; software, M.K.; validation, A.R. and A.B.; formal analysis, M.K., A.R. and A.B.; investigation, A.R. and A.B.; resources, A.B.; data curation, M.K. and A.R.; writing—original draft preparation, M.K.; writing—review and editing, M.K., A.R. and A.B.; visualization, M.K.; supervision, A.R. and A.B.; project administration, A.R. All authors have read and agreed to the published version of the manuscript.

Funding

This research received no external funding.

Conflicts of Interest

The authors declare no conflict of interest.

Abbreviations

CCCarbon capture
CO2Carbon dioxide
EENSExpected energy not supplied
EPElectric power
EPSElectric power system
GFPPGas-fired power plant
H2Hydrogen
IEGSIntegrated electricity and gas systems
MILPMixed-integer linear programming
MINLPMixed-integer non-linear programming
NGNatural gas
NGSNatural gas system
OFObjective function
PtGPower to Gas
RERenewable energy
RESRenewable energy sources
SNGSynthetic natural gas

References

  1. United Nations. Paris Agreement. 2015. Available online: https://unfccc.int/sites/default/files/english_paris_agreement.pdf (accessed on 15 July 2022).
  2. IRENA. Global Energy Transformation: A Roadmap to 2050 (2019 Edition). Available online: https://www.irena.org/publications/2019/Apr/Global-energy-transformation-A-roadmap-to-2050-2019Edition (accessed on 26 November 2020).
  3. European Commission. Climate & Energy Framework—Climate Action. 2030 Climate & Energy Framework. 2019. Available online: https://ec.europa.eu/clima/policies/strategies/2030_en (accessed on 10 July 2022).
  4. Federal Ministry for Economic Affairs and Energy (BMWi). The Energy of the Future, 8th Monitoring Report on the Energy Transition—Reporting Years 2018 and 2019. 2021. Available online: https://www.bmwk.de/Redaktion/EN/Publikationen/Energie/the-energy-of-the-future-8th-monitoring-report.pdf?__blob=publicationFile&v=6 (accessed on 22 May 2022).
  5. Financing and Investment Trends of the European Wind Industry in 2021; Windeurope.org: Brussels, Belgium, 2022; Available online: https://windeurope.org/intelligence-platform/product/financing-and-investment-trends-2021/ (accessed on 25 August 2022).
  6. REN21. Renewables 2022 Global Status Report. 2022. Available online: https://www.ren21.net/wp-content/uploads/2019/05/GSR2022_Full_Report.pdf (accessed on 14 September 2022).
  7. Raheli, E.; Wu, Q.; Zhang, M.; Wen, C. Optimal coordinated operation of integrated natural gas and electric power systems: A review of modeling and solution methods. Renew. Sustain. Energy Rev. 2021, 145, 111134. [Google Scholar] [CrossRef]
  8. Graditi, G.; Di Somma, M. (Eds.) Technologies for Integrated Energy Systems and Networks; Wiley: Hoboken, NJ, USA, 2022; ISBN 978-3-527-83362-7. [Google Scholar]
  9. BP. Statistical Review of World Energy. 2020. Available online: https://www.bp.com/content/dam/bp/business-sites/en/global/corpo-rate/pdfs/energy-economics/statistical-review/bp-stats-review-2020-full-report.pdf (accessed on 3 April 2022).
  10. BP. Statistical Review of World Energy, 70th ed. 2020. Available online: https://www.bp.com/content/dam/bp/business-sites/en/global/corporate/pdfs/energy-economics/statistical-review/bp-stats-review-2021-full-report.pdf (accessed on 3 April 2022).
  11. International Energy Agency, Data and Statistics. IEA Data Services. 2020. Available online: https://www.iea.org/data-and-statistics?country=USA&fuel=Electricityandheat&indicator=ElecGenByFueln (accessed on 10 April 2022).
  12. Bloess, A.; Schill, W.-P.; Zerrahn, A. Power-to-heat for renewable energy integration: A review of technologies, modeling approaches, and flexibility potentials. Appl. Energy 2018, 212, 1611–1626. [Google Scholar] [CrossRef]
  13. IRENA. Innovation landscape Brief: Renewable Power-to-Heat; International Renewable Energy Agency: Abu Dhabi, United Arab Emirates, 2019; Available online: www.irena.org/publications (accessed on 10 April 2022).
  14. Araya, S.S.; Cui, X.; Li, N.; Liso, V.; Sahlin, S.L. Power-to-X: Technology Overview, Possibilities and Challenges; Aalborg University, AAU Energy: Aalborg East, Denmark, 2022. [Google Scholar]
  15. Danish Ministry of Climate, Energy and Utilities, København K. Power-to-X Strategy. 2021. Available online: https://ens.dk/sites/ens.dk/files/ptx/strategy_ptx.pdf (accessed on 25 March 2022).
  16. Ince, A.C.; Colpan, C.O.; Hagen, A.; Serincan, M.F. Modeling and simulation of Power-to-X systems: A review. Fuel 2021, 304, 121354. [Google Scholar] [CrossRef]
  17. Sorrenti, I.; Rasmussen, T.B.H.; You, S.; Wu, Q. The role of power-to-X in hybrid renewable energy systems: A comprehensive review. Renew. Sustain. Energy Rev. 2022, 165, 112380. [Google Scholar] [CrossRef]
  18. Incer-Valverde, J.; Patiño-Arévalo, L.J.; Tsatsaronis, G.; Morosuk, T. Hydrogen-driven Power-to-X: State of the art and multicriteria evaluation of a study case. Energy Convers. Manag. 2022, 266, 115814. [Google Scholar] [CrossRef]
  19. Koj, J.C.; Wulf, C.; Zapp, P. Environmental impacts of power-to-X systems—A review of technological and methodological choices in Life Cycle Assessments. Renew. Sustain. Energy Rev. 2019, 112, 865–879. [Google Scholar] [CrossRef]
  20. Buchholz, O.S.; van der Ham, A.G.J.; Veneman, R.; Brilman, D.W.F.; Kersten, S.R.A. Power-to-Gas: Storing Surplus Electrical Energy. A Design Study. Energy Procedia 2014, 63, 7993–8009. [Google Scholar] [CrossRef] [Green Version]
  21. Parra, D.; Patel, M.K. Techno-economic implications of the electrolyser technology and size for power-to-gas systems. Int. J. Hydrogen Energy 2016, 41, 3748–3761. [Google Scholar] [CrossRef]
  22. Qadrdan, M.; Abeysekera, M.; Chaudry, M.; Wu, J.; Jenkins, N. Role of power-to-gas in an integrated gas and electricity system in Great Britain. Int. J. Hydrogen Energy 2015, 40, 5763–5775. [Google Scholar] [CrossRef]
  23. Blanco, H.; Nijs, W.; Ruf, J.; Faaij, A. Potential of Power-to-Methane in the EU energy transition to a low carbon system using cost optimization. Appl. Energy 2018, 232, 323–340. [Google Scholar] [CrossRef]
  24. Schiebahn, S.; Grube, T.; Robinius, M.; Tietze, V.; Kumar, B.; Stolten, D. Power to gas: Technological overview, systems analysis and economic assessment for a case study in Germany. Int. J. Hydrogen Energy 2015, 40, 4285–4294. [Google Scholar] [CrossRef]
  25. Li, Y.; Liu, W.; Shahidehpour, M.; Wen, F.; Wang, K.; Huang, Y. Optimal Operation Strategy for Integrated Natural Gas Generating Unit and Power-to-Gas Conversion Facilities. IEEE Trans. Sustain. Energy 2018, 9, 1870–1879. [Google Scholar] [CrossRef]
  26. Gorre, J.; Ortloff, F.; van Leeuwen, C. Production costs for synthetic methane in 2030 and 2050 of an optimized Power-to-Gas plant with intermediate hydrogen storage. Appl. Energy 2019, 253, 113594. [Google Scholar] [CrossRef]
  27. Tichler, R.; Bauer, S.; Böhm, H. 25—Power-to-Gas. In Storing Energy, 2nd ed.; Letcher, T.M., Ed.; Elsevier: Amsterdam, The Netherlands, 2022; pp. 595–612. [Google Scholar] [CrossRef]
  28. Clegg, S.; Mancarella, P. Integrated modeling and assessment of the operational impact of power-to-gas (P2G) on elec-trical and gas transmission networks. IEEE Trans. Sustain. Energy 2015, 6, 1234–1244. [Google Scholar] [CrossRef]
  29. Liang, J.; Tang, W. Stochastic multistage co-planning of integrated energy systems considering power-to-gas and the cap-and-trade market. Int. J. Electr. Power Energy Syst. 2020, 119, 105817. [Google Scholar] [CrossRef]
  30. Rabiee, A.; Keane, A.; Soroudi, A. Green hydrogen: A new flexibility source for security constrained scheduling of power systems with renewable energies. Int. J. Hydrogen Energy 2021, 46, 19270–19284. [Google Scholar] [CrossRef]
  31. Collet, P.; Flottes, E.; Favre, A.; Raynal, L.; Pierre, H.; Capela, S.; Peregrina, C. Techno-economic and Life Cycle Assessment of methane production via biogas upgrading and power to gas technology. Appl. Energy 2017, 192, 282–295. [Google Scholar] [CrossRef] [Green Version]
  32. Quarton, C.J.; Samsatli, S. Power-to-gas for injection into the gas grid: What can we learn from real-life projects, economic assessments and systems modelling? Renew. Sustain. Energy Rev. 2018, 98, 302–316. [Google Scholar] [CrossRef]
  33. Danish Energy Agency. Monthly Energy Statistics: Natural Gas. 2020. Available online: https://ens.dk/en/our-services/statistics-data-key-figures-and-energy-maps/annual-and-monthly-statistics (accessed on 16 May 2022).
  34. Robinius, M.; Raje, T.; Nykamp, S.; Rott, T.; Müller, M.; Grube, T.; Katzenbach, B.; Küppers, S.; Stolten, D. Power-to-Gas: Electrolyzers as an alternative to network expansion—An example from a distribution system operator. Appl. Energy 2018, 210, 182–197. [Google Scholar] [CrossRef]
  35. Hunsheng Zhou, H.; Zheng, J.H.; Li, Z.; Wu, Q.H.; Zhou, X.X. Multi-stage contingency-constrained co-planning for electricity-gas systems interconnected with gas-fired units and power-to-gas plants using iterative Benders decomposition. Energy 2019, 180, 689–701. [Google Scholar] [CrossRef]
  36. Ordoudis, C.; Pinson, P.; Morales, J.M. An Integrated Market for Electricity and Natural Gas Systems with Stochastic Power Producers. Eur. J. Oper. Res. 2019, 272, 642–654. [Google Scholar] [CrossRef] [Green Version]
  37. Moradi, A.; Salehi, J.; Ravadanagh, S.N. Risk-based optimal decision-making strategy of a Power-to-Gas integrated energy-hub for exploitation arbitrage in day-ahead electricity and Natural Gas markets. Sustain. Energy Grids Netw. 2022, 31, 100781. [Google Scholar] [CrossRef]
  38. Wang, J.; Xin, H.; Xie, N.; Wang, Y. Equilibrium models of coordinated electricity and natural gas markets with different coupling information exchanging channels. Energy 2021, 239, 121827. [Google Scholar] [CrossRef]
  39. Farrokhifar, M.; Nie, Y.; Pozo, D. Energy systems planning: A survey on models for integrated power and natural gas networks coordination. Appl. Energy 2020, 262, 114567. [Google Scholar] [CrossRef]
  40. Jiang, Y.; Xu, J.; Sun, Y.; Wei, C.; Wang, J.; Liao, S.; Ke, D.; Li, X.; Yang, J.; Peng, X. Coordinated operation of gas-electricity integrated distribution system with multi-CCHP and distributed renewable energy sources. Appl. Energy 2017, 211, 237–248. [Google Scholar] [CrossRef]
  41. He, C.; Zhang, X.; Liu, T.; Wu, L.; Shahidehpour, M. Coordination of Interdependent Electricity Grid and Natural Gas Network—A Review. Curr. Sustain. Energy Rep. 2018, 5, 23–36. [Google Scholar] [CrossRef]
  42. Patrick, D.R.; Fardo, S.W.; Fardo, B.W. Electrical Power Systems Technology, 4th ed.; River Publishers: New York, NY, USA, 2021. [Google Scholar] [CrossRef]
  43. Sadhu, P.K.; Das, S. Elements of Power Systems, 1st ed.; CRC Press: Boca Raton, FL, USA, 2015. [Google Scholar] [CrossRef]
  44. Weedy, B.M.; Cory, B.J.; Jenkins, N.; Ekanayake, J.B. Goran Strbac, Electric Power Systems, 5th ed.; Wiley: Hoboken, NJ, USA, 2012; ISBN 978-1-118-36108-5. [Google Scholar]
  45. Zabihian, F. Power Plant Engineering, 1st ed.; CRC Press: Boca Raton, FL, USA, 2021. [Google Scholar] [CrossRef]
  46. Powell, L. Power System Load Flow Analysis; McGraw-Hill: New York, NY, USA, 2005; ISBN 978-0-07-178261-6. [Google Scholar]
  47. Murty, P. Chapter 10—Power Flow Studies. In Power Systems Analysis, 2nd ed.; Butterworth-Heinemann: Oxford, UK, 2017; pp. 205–276. [Google Scholar] [CrossRef]
  48. Salam, A. Load Flow Analysis. In Fundamentals of Electrical Power Systems Analysis; Springer: Berlin/Heidelberg, Germany, 2020; pp. 317–377. [Google Scholar] [CrossRef]
  49. Glover, J.D.; Sarma, M.S.; Overbye, T. Adam Birchfield, Power System Analysis and Design, 7th ed.; Cengage Learning, Inc.: Boston, MA, USA, 2022. [Google Scholar]
  50. Li, D.; Gao, C.; Chen, T.; Guo, X.; Han, S. Planning strategies of power-to-gas based on cooperative game and symbiosis cooperation. Appl. Energy 2021, 288, 116639. [Google Scholar] [CrossRef]
  51. Jooshaki, M.; Abbaspour, A.; Fotuhi-Firuzabad, M.; Moeini-Aghtaie, M.; Lehtonen, M. Multistage Expansion Co-Planning of Integrated Natural Gas and Electricity Distribution Systems. Energies 2019, 12, 1020. [Google Scholar] [CrossRef] [Green Version]
  52. Wang, D.; Qiu, J.; Meng, K.; Gao, X.; Dong, Z. Coordinated expansion co-planning of integrated gas and power systems. J. Mod. Power Syst. Clean Energy 2017, 5, 314–325. [Google Scholar] [CrossRef] [Green Version]
  53. Qiu, J.; Dong, Z.Y.; Zhao, J.; Meng, K.; Luo, F.; Chen, Y. Expansion co-planning for shale gas integration in a combined energy market. J. Mod. Power Syst. Clean Energy 2015, 3, 302–311. [Google Scholar] [CrossRef] [Green Version]
  54. Qiu, J.; Dong, Z.Y.; Zhao, J.H.; Xu, Y.; Zheng, Y.; Li, C.; Wong, K.P. Multi-Stage Flexible Expansion Co-Planning Under Uncertainties in a Combined Electricity and Gas Market. IEEE Trans. Power Syst. 2014, 30, 2119–2129. [Google Scholar] [CrossRef]
  55. Odetayo, B.; MacCormack, J.; Rosehart, W.D.; Zareipour, H. A sequential planning approach for Distributed generation and natural gas networks. Energy 2017, 127, 428–437. [Google Scholar] [CrossRef]
  56. Safari, A.; Farrokhifar, M.; Shahsavari, H.; Hosseinnezhad, V. Stochastic planning of integrated power and natural gas networks with simplified system frequency constraints. Int. J. Electr. Power Energy Syst. 2021, 132, 107144. [Google Scholar] [CrossRef]
  57. Yamchi, H.B.; Safari, A.; Guerrero, J.M. A multi-objective mixed integer linear programming model for integrated electricity-gas network expansion planning considering the impact of photovoltaic generation. Energy 2021, 222, 119933. [Google Scholar] [CrossRef]
  58. Ansari, M.; Zadsar, M.; Zareipour, H.; Kazemi, M. Resilient operation planning of integrated electrical and natural gas systems in the presence of natural gas storages. Int. J. Electr. Power Energy Syst. 2021, 130, 106936. [Google Scholar] [CrossRef]
  59. Haghighat, H.; Zeng, B. Stochastic network investment in integrated gas-electric systems. Electr. Power Syst. Res. 2021, 197, 107219. [Google Scholar] [CrossRef]
  60. Sohrabi, F.; Vahid-Pakdel, M.; Mohammadi-Ivatloo, B.; Anvari-Moghaddam, A. Strategic planning of power to gas energy storage facilities in electricity market. Sustain. Energy Technol. Assess. 2021, 46, 101238. [Google Scholar] [CrossRef]
  61. Löhr, L.; Houben, R.; Moser, A. Optimal power and gas flow for large-scale transmission systems. Electr. Power Syst. Res. 2020, 189, 106724. [Google Scholar] [CrossRef]
  62. Wang, X.; Bie, Z.; Liu, F.; Kou, Y.; Jiang, L. Bi-level planning for integrated electricity and natural gas systems with wind power and natural gas storage. Int. J. Electr. Power Energy Syst. 2019, 118, 105738. [Google Scholar] [CrossRef]
  63. Khaligh, V.; Anvari-Moghaddam, A. Stochastic expansion planning of gas and electricity networks: A decen-tralized-based approach. Energy 2019, 186, 115889. [Google Scholar] [CrossRef]
  64. Rad, V.Z.; Torabi, S.A.; Shakouri, H. Joint electricity generation and transmission expansion planning under integrated gas and power system. Energy 2019, 167, 523–537. [Google Scholar]
  65. Saldarriaga-Cortés, C.; Salazar, H.; Moreno, R.; Jiménez-Estévez, G. Stochastic planning of electricity and gas networks: An asynchronous column generation approach. Appl. Energy 2019, 233–234, 1065–1077. [Google Scholar] [CrossRef]
  66. Ding, T.; Hu, Y.; Bie, Z. Multi-Stage Stochastic Programming with Nonanticipativity Constraints for Expansion of Combined Power and Natural Gas Systems. IEEE Trans. Power Syst. 2017, 33, 317–328. [Google Scholar] [CrossRef]
  67. Odetayo, B.; MacCormack, J.; Rosehart, W.; Zareipour, H.; Seifi, A.R. Integrated planning of natural gas and electric power systems. Int. J. Electr. Power Energy Syst. 2018, 103, 593–602. [Google Scholar] [CrossRef]
  68. Zhao, B.; Conejo, A.J.; Sioshansi, R. Coordinated Expansion Planning of Natural Gas and Electric Power Systems. IEEE Trans. Power Syst. 2017, 33, 3064–3075. [Google Scholar] [CrossRef]
  69. He, C.; Wu, L.; Liu, T.; Bie, Z. Robust Co-Optimization Planning of Interdependent Electricity and Natural Gas Systems with a Joint N-1 and Probabilistic Reliability Criterion. IEEE Trans. Power Syst. 2017, 33, 2140–2154. [Google Scholar] [CrossRef]
  70. Zhang, Y.; Hu, Y.; Ma, J.; Bie, Z. A Mixed-Integer Linear Programming Approach to Security-Constrained Co-Optimization Expansion Planning of Natural Gas and Electricity Transmission Systems. IEEE Trans. Power Syst. 2018, 33, 6368–6378. [Google Scholar] [CrossRef]
  71. Khaligh, V.; Buygi, M.O.; Anvari-Moghaddam, A.; Guerrero, J.M. A Multi-Attribute Expansion Planning Model for Integrated Gas–Electricity System. Energies 2018, 11, 2573. [Google Scholar] [CrossRef] [Green Version]
  72. Nunes, J.B.; Mahmoudi, N.; Saha, T.K.; Chattopadhyay, D. Stochastic Integrated Planning of Electricity and Natural Gas Networks for Queensland, Australia Considering High Renewable Penetration. Energy 2018, 153, 539–553. [Google Scholar] [CrossRef] [Green Version]
  73. Zeng, Q.; Zhang, B.; Fang, J.; Chen, Z. A bi-level programming for multistage co-expansion planning of the integrated gas and electricity system. Appl. Energy 2017, 200, 192–203. [Google Scholar] [CrossRef]
  74. Shao, C.; Shahidehpour, M.; Wang, X.; Wang, X.; Wang, B. Integrated Planning of Electricity and Natural Gas Transportation Systems for Enhancing the Power Grid Resilience. IEEE Trans. Power Syst. 2017, 32, 4418–4429. [Google Scholar] [CrossRef]
  75. Ojeda-Esteybar, D.M.; Rubio-Barros, R.G.; Vargas, A. Integrated operational planning of hydrothermal power and natural gas systems with large scale storages. J. Mod. Power Syst. Clean Energy 2017, 5, 299–313. [Google Scholar] [CrossRef] [Green Version]
  76. Hu, Y.; Bie, Z.; Ding, T.; Lin, Y. An NSGA-II based multi-objective optimization for combined gas and electricity network expansion planning. Appl. Energy 2016, 167, 280–293. [Google Scholar] [CrossRef] [Green Version]
  77. Qiu, J.; Yang, H.; Dong, Z.Y.; Zhao, J.H.; Meng, K.; Luo, F.J.; Wong, K.P. A Linear Programming Approach to Expansion Co-Planning in Gas and Electricity Markets. IEEE Trans. Power Syst. 2016, 31, 3594–3606. [Google Scholar] [CrossRef]
  78. Barati, F.; Seifi, H.; Sepasian, M.S.; Nateghi, A.; Shafie-Khah, M.; Catalao, J.P.S. Multi-Period Integrated Framework of Generation, Transmission, and Natural Gas Grid Expansion Planning for Large-Scale Systems. IEEE Trans. Power Syst. 2014, 30, 2527–2537. [Google Scholar] [CrossRef]
  79. Zhang, X.; Shahidehpour, M.; Alabdulwahab, A.S.; Abusorrah, A. Security-Constrained Co-Optimization Planning of Electricity and Natural Gas Transportation Infrastructures. IEEE Trans. Power Syst. 2014, 30, 2984–2993. [Google Scholar] [CrossRef]
  80. Xiang, Y.; Guo, Y.; Wu, G.; Liu, J.; Sun, W.; Lei, Y.; Zeng, P. Low-carbon economic planning of integrated electricity-gas energy systems. Energy 2022, 249, 123755. [Google Scholar] [CrossRef]
  81. Qadrdan, M.; Abeysekera, M.; Wu, J.; Jenkins, N.; Winter, B. Fundamentals of Natural Gas Networks. In The Future of Gas Networks: The Role of Gas Networks in a Low Carbon Energy System; Springer: Berlin/Heidelberg, Germany, 2019; pp. 5–22. [Google Scholar] [CrossRef]
  82. Menon, E.S. Gas Pipeline Hydrolics; CRC Press: Boca Raton, FL, USA, 2005. [Google Scholar]
  83. Rabiee, A.; Kamwa, I.; Keane, A.; Soroudi, A. Gas Network’s Impact on Power System Voltage Security. IEEE Trans. Power Syst. 2021, 36, 5428–5440. [Google Scholar] [CrossRef]
  84. Tran, T.H.; French, S.; Ashman, R.; Kent, E. Linepack planning models for gas transmission network under uncertainty. Eur. J. Oper. Res. 2018, 268, 688–702. [Google Scholar] [CrossRef] [Green Version]
  85. Correa-Posada, C.M.; Sanchez-Martin, P. Integrated Power and Natural Gas Model for Energy Adequacy in Short-Term Operation. IEEE Trans. Power Syst. 2014, 30, 3347–3355. [Google Scholar] [CrossRef]
  86. Shin, J.; Werner, Y.; Kazempour, J. Modeling gas flow directions as state variables: Does it provide more flexibility to power systems? Electr. Power Syst. Res. 2022, 212, 108502. [Google Scholar] [CrossRef]
  87. Kabirian, A.; Hemmati, M.R. A strategic planning model for natural gas transmission networks. Energy Policy 2007, 35, 5656–5670. [Google Scholar] [CrossRef]
  88. Dvorkin, V.; Mallapragada, D.; Botterud, A.; Kazempour, J.; Pinson, P. Multi-stage linear decision rules for stochastic control of natural gas networks with linepack. Electr. Power Syst. Res. 2022, 212, 108388. [Google Scholar] [CrossRef]
  89. Fang, X.; Craig, M.T.; Hodge, B.-M. Linear Approximation Line Pack Model for Integrated Electricity and Natural Gas Systems OPF. In Proceedings of the 2019 IEEE Power & Energy Society General Meeting (PESGM), Atlanta, GA, USA, 4–8 August 2019; pp. 1–5. [Google Scholar] [CrossRef]
  90. Chaudry, M.; Jenkins, N.; Strbac, G. Multi-time period combined gas and electricity network optimization. Electr. Power Syst. Res. 2008, 78, 1265–1279. [Google Scholar] [CrossRef]
  91. Chen, S.; Conejo, A.J.; Sioshansi, R.; Wei, Z. Unit Commitment with an Enhanced Natural Gas-Flow Model. IEEE Trans. Power Syst. 2019, 34, 3729–3738. [Google Scholar] [CrossRef]
  92. Mokhatab, S.; Poe, W.A.; Speight, J.G. (Eds.) Chapter 8—Natural Gas Compression. In Handbook of Natural Gas Transmission and Processing; Gulf Professional Publishing: Houston, TX, USA, 2006; pp. 295–322. [Google Scholar] [CrossRef]
  93. Chen, S.; Wei, Z.; Sun, G.; Sun, Y.; Zang, H.; Zhu, Y. Optimal Power and Gas Flow with a Limited Number of Control Actions. IEEE Trans. Smart Grid 2017, 9, 5371–5380. [Google Scholar] [CrossRef]
  94. Borraz-Sánchez, C.; Ríos-Mercado, R.Z. Improving the operation of pipeline systems on cyclic structures by tabu search. Comput. Chem. Eng. 2009, 33, 58–64. [Google Scholar] [CrossRef]
  95. Koch, T.; Hiller, B.; Pfetsch, M.; Schewe, L. (Eds.) Evaluating Gas Network Capacities; Society for Industrial and Applied Mathematics: Philadelphia, PA, USA, 2015. [Google Scholar]
  96. Wei, W.; Wang, J. Modeling and Optimization of Interdependent Energy Infrastructures; Springer: Cham, Switzerland, 2020. [Google Scholar] [CrossRef]
  97. Shabanpour-Haghighi, A.; Seifi, A.R. An Integrated Steady-State Operation Assessment of Electrical, Natural Gas, and District Heating Networks. IEEE Trans. Power Syst. 2015, 31, 3636–3647. [Google Scholar] [CrossRef]
  98. Byeon, G.; Van Hentenryck, P. Unit Commitment with Gas Network Awareness. IEEE Trans. Power Syst. 2019, 35, 1327–1339. [Google Scholar] [CrossRef] [Green Version]
  99. Chen, S.; Wei, Z.; Sun, G.; Cheung, K.W.; Sun, Y. Multi-Linear Probabilistic Energy Flow Analysis of Integrated Electrical and Natural-Gas Systems. IEEE Trans. Power Syst. 2016, 32, 1970–1979. [Google Scholar] [CrossRef]
  100. Thema, M.; Bauer, F.; Sterner, M. Power-to-Gas: Electrolysis and methanation status review. Renew. Sustain. Energy Rev. 2019, 112, 775–787. [Google Scholar] [CrossRef]
  101. Lehner, M.; Tichler, R.; Steinmüller, H.; Koppe, M. Power-to-Gas: Technology and Business Models; Springer: Berlin/Heidelberg, Germany, 2014. [Google Scholar] [CrossRef]
  102. Xing, X.; Tsinghua University; Lin, J.; Song, Y.; Zhou, Y.; Mu, S.; Hu, Q. Modeling and operation of the power-to-gas system for renewables integration: A review. CSEE J. Power Energy Syst. 2018, 4, 168–178. [Google Scholar] [CrossRef]
  103. Boudellal, M. Power-to-Gas: Renewable Hydrogen Economy for the Energy Transition; De Gruyter: Berlin, Germany; Boston, MA, USA, 2018. [Google Scholar] [CrossRef]
  104. De Iulio, R.; Roberto, R. Implementing Innovative Solutions for Sustainable Energy Systems. Interreg. 2019. Available online: https://www.enea.it/it/seguici/pubblicazioni/pdf-opuscoli/implementing_innovative_solutions_for_sustainable_energy_systems.pdf (accessed on 3 June 2022).
  105. Buttler, A.; Spliethoff, H. Current status of water electrolysis for energy storage, grid balancing and sector coupling via power-to-gas and power-to-liquids: A review. Renew. Sustain. Energy Rev. 2018, 82, 2440–2454. [Google Scholar] [CrossRef]
  106. Ursua, A.; Gandia, L.M.; Sanchis, P. Hydrogen Production from Water Electrolysis: Current Status and Future Trends. Proc. IEEE 2012, 100, 410–426. [Google Scholar] [CrossRef]
  107. Ajiwibowo, M.W.; Darmawan, A.; Aziz, M. A conceptual chemical looping combustion power system design in a power-to-gas energy storage scenario. Int. J. Hydrogen Energy 2018, 44, 9636–9642. [Google Scholar] [CrossRef]
  108. Mergel, J.; Carmo, M.; Fritz, D. Status on Technologies for Hydrogen Production by Water Electrolysis. In Transition to Renewable Energy Systems; Wiley-VCH Verlag GmbH & Co. KGaA: Weinheim, Germany, 2013. [Google Scholar] [CrossRef]
  109. Götz, M.; Lefebvre, J.; Mörs, F.; McDaniel Koch, A.; Graf, F.; Bajohr, S.; Reimert, R.; Kolb, T. Renewable Power-to-Gas: A technological and economic review. Renew. Energy 2016, 85, 1371–1390. [Google Scholar] [CrossRef] [Green Version]
  110. Mazza, A.; Bompard, E.; Chicco, G. Applications of power to gas technologies in emerging electrical systems. Renew. Sustain. Energy Rev. 2018, 92, 794–806. [Google Scholar] [CrossRef]
  111. Nielsen, S.; Skov, I.R. Investment screening model for spatial deployment of power-to-gas plants on a national scale—A Danish case. Int. J. Hydrogen Energy 2018, 44, 9544–9557. [Google Scholar] [CrossRef]
  112. Schmidt, O.; Gambhir, A.; Staffell, I.; Hawkes, A.; Nelson, J.; Few, S. Future cost and performance of water electrolysis: An expert elicitation study. Int. J. Hydrogen Energy 2017, 42, 30470–30492. [Google Scholar] [CrossRef]
  113. Gahleitner, G. Hydrogen from renewable electricity: An international review of power-to-gas pilot plants for stationary applications. Int. J. Hydrogen Energy 2013, 38, 2039–2061. [Google Scholar] [CrossRef]
  114. Carmo, M.; Fritz, D.L.; Mergel, J.; Stolten, D. A comprehensive review on PEM water electrolysis. Int. J. Hydrogen Energy 2013, 38, 4901–4934. [Google Scholar] [CrossRef]
  115. Rönsch, S.; Schneider, J.; Matthischke, S.; Schlüter, M.; Götz, M.; Lefebvre, J.; Prabhakaran, P.; Bajohr, S. Review on methanation—From fundamentals to current projects. Fuel 2016, 166, 276–296. [Google Scholar] [CrossRef]
  116. Saedi, I.; Mhanna, S.; Mancarella, P. Integrated electricity and gas system modelling with hydrogen injections and gas composition tracking. Appl. Energy 2021, 303, 117598. [Google Scholar] [CrossRef]
  117. Ditaranto, M.; Heggset, T.; Berstad, D. Concept of hydrogen fired gas turbine cycle with exhaust gas recirculation: Assessment of process performance. Energy 2020, 192, 116646. [Google Scholar] [CrossRef]
  118. Green Hydrogen for Industry: A Guide to Policy Making; International Renewable Energy Agency: Abu Dhabi, United Arab Emirates, 2022; Available online: https://www.irena.org/publications (accessed on 7 September 2022).
  119. International Energy Agency. Global Hydrogen Review 2022. 2022. Available online: https://www.iea.org/reports/global-hydrogen-review-2022 (accessed on 18 October 2022).
  120. McKenna, R.; Bchini, Q.; Weinand, J.; Michaelis, J.; König, S.; Köppel, W.; Fichtner, W. The future role of Power-to-Gas in the energy transition: Regional and local techno-economic analyses in Baden-Württemberg. Appl. Energy 2018, 212, 386–400. [Google Scholar] [CrossRef]
  121. Vandewalle, J.; Bruninx, K.; D’Haeseleer, W. Effects of large-scale power to gas conversion on the power, gas and carbon sectors and their interactions. Energy Convers. Manag. 2015, 94, 28–39. [Google Scholar] [CrossRef] [Green Version]
  122. Leung, D.Y.C.; Caramanna, G.; Maroto-Valer, M.M. An overview of current status of carbon dioxide capture and storage technologies. Renew. Sustain. Energy Rev. 2014, 39, 426–443. [Google Scholar] [CrossRef] [Green Version]
  123. Schiebahn, S.; Grube, T.; Robinius, M.; Zhao, L.; Otto, A.; Kumar, B.; Weber, M.; Stolten, D. Power to Gas. In Transition to Renewable Energy Systems; Stolten, D., Scherer, V., Eds.; Wiley: Hoboken, NJ, USA, 2013; pp. 813–848. [Google Scholar] [CrossRef]
  124. Fasihi, M.; Efimova, O.; Breyer, C. Techno-economic assessment of CO2 direct air capture plants. J. Clean. Prod. 2019, 224, 957–980. [Google Scholar] [CrossRef]
  125. Reiter, G.; Lindorfer, J. Evaluating CO2 sources for power-to-gas applications—A case study for Austria. J. CO2 Util. 2015, 10, 40–49. [Google Scholar] [CrossRef]
  126. Biliyok, C.; Yeung, H. Evaluation of natural gas combined cycle power plant for post-combustion CO2 capture integration. Int. J. Greenh. Gas Control. 2013, 19, 396–405. [Google Scholar] [CrossRef]
  127. Rabiee, A.; Keane, A.; Soroudi, A. Technical barriers for harnessing the green hydrogen: A power system perspective. Renew. Energy 2020, 163, 1580–1587. [Google Scholar] [CrossRef]
  128. Ahern, E.P.; Deane, P.; Persson, T.; Gallachóir, B.; Murphy, J.D. A perspective on the potential role of renewable gas in a smart energy island system. Renew. Energy 2015, 78, 648–656. [Google Scholar] [CrossRef]
  129. Sterner, M. Bioenergy and Renewable Power Methane in Integrated 100% Renewable Energy Systems: Limiting Global Warming by Transforming Energy Systems; Kassel University Press GmbH: Kassel, Germany, 2009. [Google Scholar]
  130. Eveloy, V.; Gebreegziabher, T. A Review of Projected Power-to-Gas Deployment Scenarios. Energies 2018, 11, 1824. [Google Scholar] [CrossRef] [Green Version]
  131. He, L.; Lu, Z.; Zhang, J.; Geng, L.; Zhao, H.; Li, X. Low-carbon economic dispatch for electricity and natural gas systems considering carbon capture systems and power-to-gas. Appl. Energy 2018, 224, 357–370. [Google Scholar] [CrossRef]
  132. Grond, L.; Schulze, P.; Holstein, J. System Analyses Power to Gas: Technology Review, Final Report; DNV KEMA Energy & Sustainability: Groningen, The Netherlands, 2013. [Google Scholar]
  133. Tomasgard, A.; Rømo, F.; Fodstad, M.; Midthun, K. Optimization Models for the Natural Gas Value Chain. In Geometric Modelling, Numerical Simulation, and Optimization; Springer: Berlin/Heidelberg, Germany, 2007; pp. 521–558. [Google Scholar]
  134. Wang, H.; Zhang, R.; Peng, J.; Wang, G.; Liu, Y.; Jiang, H.; Liu, W. GPNBI-inspired MOSFA for Pareto operation optimization of integrated energy system. Energy Convers. Manag. 2017, 151, 524–537. [Google Scholar] [CrossRef]
  135. Gong, J.; Li, Y.; Lv, J.; Huang, G.; Suo, C.; Gao, P. Development of an integrated bi-level model for China’s multi-regional energy system planning under uncertainty. Appl. Energy 2022, 308, 118299. [Google Scholar] [CrossRef]
  136. Qin, C.; Yan, Q.; He, G. Integrated energy systems planning with electricity, heat and gas using particle swarm optimization. Energy 2019, 188, 116044. [Google Scholar] [CrossRef]
  137. Saravi, V.S.; Kalantar, M.; Anvari-Moghaddam, A. Resilience-constrained expansion planning of integrated power–gas–heat distribution networks. Appl. Energy 2022, 323, 119315. [Google Scholar] [CrossRef]
  138. Zhang, X.; Chan, K.; Wang, H.; Hu, J.; Zhou, B.; Zhang, Y.; Qiu, J. Game-theoretic planning for integrated energy system with independent participants considering ancillary services of power-to-gas stations. Energy 2019, 176, 249–264. [Google Scholar] [CrossRef]
  139. Ríos-Mercado, R.Z.; Borraz-Sánchez, C. Optimization problems in natural gas transportation systems: A state-of-the-art review. Appl. Energy 2015, 147, 536–555. [Google Scholar] [CrossRef]
  140. Sharan, I.; Balasubramanian, R. Integrated generation and transmission expansion planning including power and fuel transportation constraints. Energy Policy 2012, 43, 275–284. [Google Scholar] [CrossRef]
  141. Qiu, J.; Dong, Z.Y.; Zhao, J.H.; Meng, K.; Zheng, Y.; Hill, D.J. Low Carbon Oriented Expansion Planning of Integrated Gas and Power Systems. IEEE Trans. Power Syst. 2014, 30, 1035–1046. [Google Scholar] [CrossRef]
  142. Cheng, Y.; Zhang, N.; Lu, Z.; Kang, C. Planning Multiple Energy Systems Toward Low-Carbon Society: A Decentralized Approach. IEEE Trans. Smart Grid 2018, 10, 4859–4869. [Google Scholar] [CrossRef]
  143. Jin, S.; Li, Y.; Xu, L. Development of an integrated model for energy systems planning and carbon dioxide mitigation under uncertainty—Tradeoffs between two-level decision makers. Environ. Res. 2018, 164, 367–378. [Google Scholar] [CrossRef] [PubMed]
  144. Odetayo, B.; Kazemi, M.; MacCormack, J.; Rosehart, W.D.; Zareipour, H.; Seifi, A.R. A Chance Constrained Programming Approach to the Integrated Planning of Electric Power Generation, Natural Gas Network and Storage. IEEE Trans. Power Syst. 2018, 33, 6883–6893. [Google Scholar] [CrossRef]
  145. Bai, L.; Li, F.; Cui, H.; Jiang, T.; Sun, H.; Zhu, J. Interval optimization based operating strategy for gas-electricity integrated energy systems considering demand response and wind uncertainty. Appl. Energy 2016, 167, 270–279. [Google Scholar] [CrossRef] [Green Version]
  146. Azad, A.; Rasul, M.; Alam, M.; Uddin, S.A.; Mondal, S.K. Analysis of Wind Energy Conversion System Using Weibull Distribution. Procedia Eng. 2014, 90, 725–732. [Google Scholar] [CrossRef]
  147. Carta, J.; Ramírez, P.; Velázquez, S. A review of wind speed probability distributions used in wind energy analysis: Case studies in the Canary Islands. Renew. Sustain. Energy Rev. 2009, 13, 933–955. [Google Scholar] [CrossRef]
  148. Birge, J.R.; Louveaux, F. Introduction to Stochastic Programming; Springer Science & Business Media: Berlin/Heidelberg, Germany, 2011. [Google Scholar]
  149. Conejo, A.J.; Carrión, M.; Morales, J.M. Decision Making under Uncertainty in Electricity Markets; Springer: New York, NY, USA, 2010. [Google Scholar] [CrossRef]
  150. DeCarolis, J.; Daly, H.; Dodds, P.; Keppo, I.; Li, F.; McDowall, W.; Pye, S.; Strachan, N.; Trutnevyte, E.; Usher, W.; et al. Formalizing best practice for energy system optimization modelling. Appl. Energy 2017, 194, 184–198. [Google Scholar] [CrossRef] [Green Version]
  151. Green Hydrogen: Cornerstone of a Sustainable Energy Future; Siemens Energy LLC: Munich, Germany, 2021; Available online: https://www.siemens-energy.com/global/en.html (accessed on 14 April 2022).
  152. Madsen, H.T. Hydrogen Tech World Magazine. 2022. Available online: https://hydrogentechworld.com/water-treatment-for-green-hydrogen-what-you-need-to-know (accessed on 19 April 2022).
  153. Klatzer, T.; Bachhiesl, U.; Wogrin, S. State-of-the-art expansion planning of integrated power, natural gas, and hydrogen systems. Int. J. Hydrogen Energy 2022, 47, 20585–20603. [Google Scholar] [CrossRef]
  154. Zhang, X.; Che, L.; Shahidehpour, M.; Alabdulwahab, A.S.; Abusorrah, A. Reliability-Based Optimal Planning of Electricity and Natural Gas Interconnections for Multiple Energy Hubs. IEEE Trans. Smart Grid 2015, 8, 1658–1667. [Google Scholar] [CrossRef]
  155. GAMS. Available online: https://www.gams.com/ (accessed on 20 March 2022).
Figure 1. Schematic of integrated planning of EPS and NGS with bidirectional coupling.
Sustainability 15 06602 g001
Figure 2. Various aspects of IEGS steady-state studies with the focus of this review in green.
Sustainability 15 06602 g002
Figure 3. Overview of an IEGS with a bidirectional connection between EPS and NGS.
Sustainability 15 06602 g003
Figure 4. Simple process and chemical reactions of a PtG unit.
Sustainability 15 06602 g004
Figure 5. Relevant costs in the optimal planning of IEGS.
Sustainability 15 06602 g005
Figure 6. Main benefits of employing PtG in IEGS.
Sustainability 15 06602 g006
Figure 7. Impact of PtG on the IEGS costs.
Sustainability 15 06602 g007
Figure 8. The issues related to the solution approaches of IEGS planning.
Sustainability 15 06602 g008
Table 3. Modeling approaches to uncertainties in IEGS planning.
Uncertainty Modeling ApproachRef.
Scenario-based stochastic approaches[29,35,52,54,55,56,57,58,59,62,63,65,66,67,68,71,72,76,95]
Robust optimization approaches[50,69,74]
Table 4. Considering N − 1 contingency in IEGS planning.
Considered SystemRef.
EPS[35,54,69,76,77,78]
EPS and NGS[56,57,70]
Table 5. IEGS planning studies in real networks.
Ref.Real EPS and NGS
[64,78]Iran
[63,71]Khorasan province in Iran
[66,76]Hainan Province in China
[73]Western Denmark
[62]Modified Northwestern China 62-bus EPS and 25-node NGS
[61]German 542-bus EPS and 524-node NGS
[72]Queensland in Australia
[111]Victorian in Australia
[75]Argentina
Table 6. Classification of IEGS planning-solution methods.
Problem Solving Method
Analytical TechniquesHeuristic Methods
MINLPNon-linear EPS & NGS[55][52,53,54,141]
Non-linear NGS[63,64,67,71,144][73,76,78]
MILP[29,35,50,57,58,59,60,61,62,65,66,68,69,70,72,74,75,75,77,79,80,138,142]---
Table 7. Comparison of the existing literature for the IEGS planning studies.
Ref.PtGUncertaintyOptimization ModelEPSNGSSolving MethodEPS ModelPlanning Interval (year)Additional
Contributions
[29]Wind power, load demand, gas price,
carbon tax
Multi-stage MILP6-Bus6-nodeCPLEX in
Python
DC20
(4-stage)
Considering wind curtailment as well as the carbon tax and employing branch and price method
IEEE
118-Bus
40-node
[35]Wind power and load
demand
Multi-stage MILPGarver 6-Bus7-nodeCPLEX in MATLABDC20
(5-stage)
Considering wind Curtailment and N-1 contingency
IEEE
118-Bus
14-node
[50]Wind powerStochastic MILPIEEE 33-Bus DPS14-NodeMOSEK in GAMSRelaxed AC1Considering wind power uncertainty in increasing the revenue of PtG units
[52]Gas price, FOR, demand response, load forecast errorMINLP6-Bus7-NodeModified Differential EvolutionACN.A.Various uncertainties and EUE
reliability as well as the impact of TOU plans
IEEE
118-Bus
14-Node
[53]Two-objective MINLPIEEE 24-Bus RTS12-NodeHDDEAC1Considering
minimum costs and EENS
reliability as OFs
[54]System load and market priceMulti-stage Stochastic MINLPIEEE 14-bus14-NodeModified Differential EvolutionAC12
(3-stage)
Considering social welfare as the OF and EUE reliability assessment
[55]EPS load
demand
Chanceconstrained MINLP9-Bus Radial distributionOne NG sourceBARON in GAMSAC10Sequentialapproach andsensitivity analysis for variousreliability levels
[56]Wind power and loaddemandStochastic MILP6-Bus5-NodeN/ADC1
(4-stage)
Considering
frequency
constraint and N-1
contingency in both systems
IEEE 24-Bus RTSBelgian 20-node
[57]Photovoltaic power and load demandTwo-objective MILP6-Bus5-NodeCPLEX in GAMSDC20
(4-stage)
Minimum costs and pollution as OFs and N-1
contingency in both systems
IEEE 24-Bus RTSBelgian 20-node
[58]Wind powerStochastic MILPIEEE 24-BusBelgian 20-nodeCPLEX in GAMSDC1 dayConsidering the resilience of both systems
[59]Renewable power and load demandBi-level
Stochastic MILP
2-Bus4-NodeGurobi in AMPLDC10 and 20
(Static)
IEGS planning considering
interconnection of EPS and NGS
IEEE 24-Bus RTSBelgian 20-node
[60]Bi-level
MILP
6-Bus---CPLEX in GAMSDC1Optimization of PtG to maximize the income in the electricity market
IEEE
118-Bus
[61]Successive
Linear
Programming
IEEE 24-BusBelgian 20-nodeGurobi in C++DCThe year 2030Quasi-static model for NGS and Successive linear programming to reduce calculations
IEEE
118-Bus
135-node
German
542-Bus
German 524-node
[62]Wind powerBi-level MILPIEEE 39-BusBelgian 20-nodeGurobi in MATLABDC5Scenario-based model by Bender’s decomposition considering the carbon tax
Northwestern China
62-bus and 25-node
[63]Wind power, load demand, interest rateMINLPKhorasan province in IranBARON in GAMSDC15Decentralized planning and
considering TOU plans and
penetration limits
[64]Multi-stage
dynamic MCP
Iran’s power and gas systemPATH in GAMSDC20
(4-stage)
Employing Nash-Cournot theory and social welfare improvement
[65]Location and size of wind power and load
demands
Multi-stage Stochastic MILP3-Bus3-NodeCPLEX and KNITRO in GAMSDC1Accurate modeling of NGS and applying
Danzig-Wolfe
decomposition method
IEEE 24-busBelgian 20-node
[66]Net load in EPSMulti-stage MILPIEEE 24-busN.A.CPLEX in GAMSDC3
(3-stage)
Non-anticipativity constraint and use of piecewise
linearization method for NGS
IEEE 118-bus
Hainan in China
[67]Gas and power load demandsMINLPIEEE 30-BusBelgian 20-nodeBARON in GAMSDC20Reliability-based planning using sequential and integrated approaches
[68]Gas and power load demandsTwo-stage MILPIEEE 118-bus14-nodeCPLEX in GAMSDCN.A.Investigating the impact of uncertainties on the IEGS planning
[69]Wind powerMulti-stage
Robust MILP
IEEE 24-bus12-nodeGurobiDC10Considering N-1 contingency and stochastic LOLE reliability
IEEE 118-busBelgian 20-node
[70]MILPGarver 6-Bus5-NodeCPLEX in GAMSDCN.A.Considering N-1 contingency in both systems and a new method for variable reduction
IEEE 24-Bus RTSBelgian 20-node
[71]Expansion plans in
different
attitudes
Stochastic MINLPKhorasan province in IranBonmin in GAMSDC15Employing a multi-attitude
decision-making method
[72]Wind and PV, gas price, load demandMulti-stage Stochastic MILPQueensland power and gas system,
Australia
IBM/CPLEX in GAMSDC15Investigating the impact of RES penetration levels
[73]Bi-level
multi-stage MINLP
Real Western
Denmark
BPSO and IPMDC9
(3-stage)
Considering line pack effect and CO2 pipelines
[74]Occurrence of severe natural eventsTri-level
Robust MILP
IEEE 24-Bus RTS17-nodeCPLEX in GAMSDC6Improving the EPS resilience
[75]Multi-stage MILP3-Bus3-NodeAMPL in MATLABDC3
(dynamic)
Considering the line pack effect and various
storage facilities
Argentina power and gas system
[76]Wind powerMulti-objective Stochastic MINLPIEEE 24-Bus12-NodeNSGA-IIDC1Considering the carbon tax and
N-1 contingency in EPS
Hainan in China
[77]MILP6-Bus7-NodeCPLEXDC10
(Annually)
Considering N-1 contingency and EENS reliability
IEEE
118-Bus
14-Node
[78]Multi-stage MINLP6-Bus7-nodeGADC6
(3-stage)
Considering N-1 contingency in EPS
Iran power and gas system
[79]Multi-stage MILPIEEE
118-Bus
14-NodeBendersDC20
(dynamic)
LOEP and EENS assessment and use of Bender’s
decomposition
[80]MILPA modified 24-bus12-NodeGurobi in MATLABDC20Integrating the carbon tax and CC technology to
reduce carbon emissions and wind curtailment
Disclaimer/Publisher’s Note: The statements, opinions and data contained in all publications are solely those of the individual author(s) and contributor(s) and not of MDPI and/or the editor(s). MDPI and/or the editor(s) disclaim responsibility for any injury to people or property resulting from any ideas, methods, instructions or products referred to in the content.

