Article

A Comprehensive Evaluation and Empirical Research on Dual Carbon Emission Reduction under Digital Empowerment

1
College of Humanities and Social Sciences, Macao Polytechnic University, Macao 999078, China
2
School of Education, Fuzhou University of International Studies and Trade, Fuzhou 350202, China
3
School of Economics and Management, East China Jiaotong University, Nanchang 330013, China
*
Author to whom correspondence should be addressed.
Sustainability 2023, 15(8), 6598; https://doi.org/10.3390/su15086598
Submission received: 16 February 2023 / Revised: 22 March 2023 / Accepted: 28 March 2023 / Published: 13 April 2023

Abstract

:
Through in-depth analysis of the background and connotation of carbon peaking and carbon neutral development goals, this paper constructs a comprehensive evaluation system of carbon neutral development goals from five secondary indicators of innovation, coordination, green, open and shared development and 15 tertiary indicators. By collecting characteristic indicator data of 10 typical provinces in China in the period of 2016–2020, using the entropy weight method, the analytic hierarchy process and the TOPSIS model, to provide research and a comprehensive analysis on the carbon neutral development level of each province. The research results show that: in terms of time series distribution, it can be observed from the index trends of five secondary indicators’ closeness and comprehensive closeness that the development of the 10 typical provinces screened in this paper is generally in a rising trend year by year, but there are different development differences in a small part of the regions. In terms of spatial distribution, due to the geographical location of various regions and resource allocation and other factors, the economic development is unbalanced. With the rapid development of the digital economy, the investment in 5G, big data technology and artificial intelligence can be increased to achieve the development goal of carbon neutrality. Cloud computing can be used to predict the development trend, provide a guarantee for quantitative tracking of carbon neutrality, and monitor and optimize carbon emissions. Based on the research results, this paper draws the corresponding conclusions and puts forward constructive suggestions to achieve the goal of carbon neutral development.

1. Introduction

After experiencing the surging tide from industrialization to informatization, the new world pattern that has not changed in a century has opened, and the economy and society are making great strides forward. However, various major risks and challenges are also coming one after another. The excessive dependence of human beings on fossil energy and material resources has led to a rapid increase in carbon emissions and intensified global climate warming, leading to a series of serious ecological problems such as glacier melting and sea level rise, which have a great impact on human production activities and biodiversity. In order to address the major challenges of climate change, on 22 September 2020, President Xi formally proposed ‘peak carbon neutralization’ at the 75th United Nations General Assembly and emphasized that ‘peak carbon neutralization’ is a multi-dimensional, three-dimensional and integrated system. We must adhere to the principle of ‘one board of chess and concerted efforts’ across the country and strive to reach peak carbon by 2030 and achieve carbon neutralization by 2060 [1,2,3]. With the rapid development of artificial intelligence technology, coupled with the continuous improvement of its computing power and R&D technology, the application scenarios of artificial intelligence in life and production have been continuously expanded, playing an important role in achieving the goals of carbon peaking and carbon neutralization [4,5,6].
As is already known, the research on carbon peaking and carbon neutralization mainly focuses on the energy industry, the automobile industry, the construction industry and other fields [7,8,9]. From the perspective of discipline distribution, research on dual carbon mainly focuses on environmental science and resource utilization, industrial economy, power industry, economic restructuring, power engineering, building science and engineering, etc. [10,11,12]. In terms of the content of the “dual carbon” research, the research mainly focuses on the challenges faced by various industries under the “double carbon” target and its countermeasures, the research on the green transition of various industries, the research on the low-carbon development paths of various industries, the research on emission reduction technologies, and there are also a few studies on “dual-carbon” policies and legislation [13,14].

2. Materials and Methods

2.1. Realization of the Connotation of Carbon Neutral Development Goal

Carbon neutralization has become a programmatic goal for sustainable development in China and even the world. Therefore, it is necessary to formulate a phased emission reduction plan to gradually achieve and promote the emission reduction goal. The implementation and development of the goal of carbon neutrality is the principle of energy conservation, emission reduction, low carbon and environmental protection under the premise of stable development of the national economic aggregate and material base. As a result, carbon neutrality is closely related to industrial integration, coordination of resource allocation, innovative technology, shared services, green ecological construction and industrial structure, and has become an important application scenario of artificial intelligence. Carbon neutralization is a global revolution in the concept of green, low-carbon energy transformation, ecological science and technology, AI technology revolution, and science and technology change, which will set off a wave of revolution and new profound changes for the development of human society and the economy. It is a major practice to achieve sustainable development. Under the goal of promoting carbon neutrality, human beings will link social economy with the ecological environment and step into the ecological civilization of harmonious coexistence between man and nature. Carbon neutrality promotes the transformation of human dependence from energy on resources to technology, promotes profound changes in the structure of energy production and consumption, and ensures the stability of national energy security. In order to achieve the goal of carbon neutrality, it is necessary to adhere to the scientific concept of development and the concept of green development, respect nature and conform to the harmony between nature and nature in order to promote the green transformation of energy and the progress and development of green and low-carbon technologies. Therefore, this paper proposes the following hypothesis:
H1. 
Carbon neutrality is closely related to technological innovation, industrial coordination, ecological environment, openness and inclusiveness, and shared development.

2.2. Carbon Neutralization Evaluation Index Feature Extraction

Achieving carbon neutrality is a win-win situation. The realization of carbon neutrality is not only based on the five ecological concepts of innovation, coordination, green, openness and sharing, but also a rapid economic leap. The promotion of carbon neutrality has brought high-quality development and opportunities to relevant industries in the low-carbon field, promoting the application of green technology models. All evaluation indicators interact and are closely related to each other to jointly build a comprehensive evaluation system for achieving the goal of carbon neutral development.
Innovative development is the first power to achieve the goal of carbon neutral development. Energy is the material basis for rapid economic and social development and the main source of carbon emissions. Increasing energy innovation, scientific and technological innovation and policy innovation is an effective way to reduce carbon emissions. Adjust the energy structure, promote the development and utilization of new energy, and build a green, low-carbon, safe and efficient energy system [15,16,17]. On the premise of ensuring energy supply, we should control the use and consumption of traditional energy, rationally develop natural gas and nuclear energy, vigorously develop non-fossil energy such as wind power and solar energy, deepen energy system reform, build a new system with new energy as the main body, and implement the replacement action of renewable energy. At the same time, the energy utilization mode should be changed to achieve carbon emission reduction and zero emissions. Therefore, the relevant energy enterprises should increase investment, upgrade machinery and equipment, reduce energy conversion losses, improve energy utilization, and form an efficient and green energy implementation. The government should strengthen innovation, promote 5G, big data, cloud computing and artificial intelligence technologies through the application of new industrial technologies, invest them in the application of various industries, accelerate the integration and development with the internet, and use artificial intelligence and big data to calculate and predict the future development trend of carbon peak and carbon neutralization [18,19,20], and effectively formulate policies and measures. Give full play to the advantages of the new national system, strengthen institutional and theoretical innovation, actively introduce more preferential policies, attract and train professional talents for carbon peak carbon neutral academic research, technology research and development, achievement transformation, application and promotion, and orderly promote carbon neutral work [21].
Coordinated development is the only way to achieve the goal of carbon neutral development. In order to gradually promote the realization of carbon neutrality, we should accelerate the full integration of the three industries with carbon neutrality. According to the actual situation, 5G, artificial intelligence, big data and other new technologies can be invested in various industries to promote the digital application and large-scale use of production and lifestyle, improve industrial production and processing efficiency, improve automation level, and achieve low-carbon production and living benefits. The realization of carbon neutrality is closely related to the agriculture, forestry, animal husbandry and fishery of the primary industry. By directly observing the growth rate of their gross output value, we can intuitively understand the trend change degree under the carbon neutral implementation policy, and promote common development through a corresponding coordinated improvement in order to reduce carbon emissions and increase the gross agricultural output value. The investment in energy industry is the investment in technological innovation of renewable energy. It will strengthen the upgrading of industrial machinery and equipment, strengthen the emission reduction technology of the process and improve production efficiency. We will vigorously develop the new energy industry, control the demand for non-renewable energy such as oil and coal and build a clean energy market to promote China’s energy transformation. The degree of integration of carbon neutralization and the tertiary industry is dominated by the logistics industry. Through the investment of transportation funds, make full use of logistics resources and use of advanced technology, promote diversified logistics methods, and promote transportation methods such as transit from public transport to rail transport and transit from public transport to water transport in order to reduce the carbon emissions generated by trucks.
Green development is the source of strength to achieve the goal of carbon neutral development. Forests are the best carbon sink containers endowed by nature. We should correctly understand and give full play to the advantages of forest carbon sink as “low cost and high efficiency” in offsetting emission reduction, mitigating climate change and achieving the goal of carbon neutrality, enhance the awareness of protecting natural reserves, natural protected forests and human-made forests, control desertification, wetland restoration and other major projects, and expand forest coverage. It can also provide sites for carbon emission research pilots in carbon capture and storage [22,23]. Cities are the regions with the most concentrated population activities and large carbon emissions, while urban parks are an effective carrier for carbon reduction. Build green low-carbon cities and towns, promote green urban construction, strengthen green design and construction management, promote ultra-low energy consumption and near zero energy consumption buildings, promote the application of clean energy in transportation, and integrate green low-carbon development into all aspects of urban and rural planning and construction. Sewage discharge is also an important aspect of carbon reduction. Untreated or nonstandard sewage will damage the carbon fixation capacity of the soil. Proper sewage treatment is an important step for effective emission reduction. The traditional idea in the past has been to convert water quality with high energy consumption, but it requires a lot of electricity, which indirectly increases carbon emissions. Therefore, we should promote technological innovation of sewage treatment methods, increase investment, and upgrade the accuracy and intelligence of equipment. Optimize the performance of facilities and reduce energy consumption [24].
Open development is an important way to achieve the goal of carbon neutral development. Openness is not only the opening of people’s minds, but also the policy opening of the government and relevant institutions. The process of opening up has closely linked to the implementation of resource allocation and economic trade among provinces, and gradually promoted the realization of carbon neutrality. The penetration rate of urban natural gas is an effective consideration in the process of energy conversion, that is, the proportion of provincial urban residents. Due to the role of natural gas in meeting peak load and flexibly responding to the fluctuation of fluctuating renewable energy power generation, the high penetration rate of natural gas in cities provides convenience and the possibility for mixing low emission fuels without retrofitting existing equipment in the future. The experimental research and base investment reflect the province’s emphasis on the development of energy industry technology. The experimental research and base investment promote energy development and technological innovation, and greatly reduce carbon dioxide emissions by developing renewable energy and deepening the reform of industrial structure. Transparent and open experimental research can enhance the public’s awareness of environmental protection. The environmental protection expenditure of local finance is a reflection of the open system and plays an indispensable role in clean energy, ecological protection and other aspects. As an important support for the development of the environmental protection industry in traditional industries, it provides capital, technology, human resources and other support for green ecological construction. At the same time, it can transform the ecological environment into production factors and integrate into the market economy system, mobilizing all parties to actively participate in green ecological construction [25,26].
Shared development is an efficient ladder to achieve the goal of carbon neutral development. Sharing is the essential requirement of socialism with Chinese characteristics, that is, joint construction and sharing. The operation of public electric vehicles is a manifestation of the country’s purposeful promotion of low-carbon travel, which is used to replace the high carbon dioxide emissions caused by fossil fuels. The reduction of cost and the improvement of performance are both the result of the increase in the degree of electrification of global road transport and its driving force. The number of people sharing services, that is, the number of people participating in the environmental protection consensus on green development, most directly reflects the public’s awareness of responding to the call for energy conservation and emission reduction. Through the joint action of the government, enterprises and individuals, it drives the low-carbon environmental protection of daily life. The supply side focuses on the energy revolution and the structural adjustment of high energy consuming industries, and the demand side focuses on the promotion of environmental awareness to contribute to “carbon peaking and carbon neutralization”. Sharing economic benefit is one of the components of sharing economy, which refers to the regional per capita GDP and is an important indicator to measure the degree of economic prosperity. With the rapid development of the shared services industry, it has driven the economic development of the three major industries. The economic growth is coordinated with the reduction of carbon emissions, providing a direction for the high-quality development of China’s economy and society. Therefore, the following hypotheses are provided, on the basis of hypothesis H1:
H2. 
The high-quality development of carbon neutrality is positively correlated with the indicators proposed by H1 and has a corresponding weights influence.
H3. 
The high-quality development of carbon neutrality needs to be evaluated by quantitative analysis and the three-level index should be extracted according to the specific development situation of different regions.

2.3. Construction of Carbon Neutralization Evaluation Indicator System

The establishment of an indicator system is the premise and basis for the comprehensive evaluation of carbon neutrality, and the process of analyzing and studying the relevant indicator systems with corresponding weights. Based on the development strategy of carbon neutrality and the relevant literature, this paper constructs a comprehensive evaluation system combining industrial development and environmental protection, mainly from five parts: innovation, coordination, green, openness and sharing as secondary indicators. For the relevance of each secondary indicator, the corresponding characteristic indicators are extracted as comparative parameters, which are divided into 15 tertiary indicators. The comprehensive analysis and discussion of the relevant characteristics of the province’s status analysis and influencing factors is as shown in Table 1.

2.4. Design of Carbon Neutralization Research Method

Based on data and research problems, this paper determines the weight of each index from the entropy weight method and hierarchical analysis method. The entropy weight method is an objective evaluation index for the dispersion degree of the entropy value. The entropy value is calculated, compared and analyzed. Because the calculation of entropy weight method relies on objective index values, the relationship between indexes is ignored. AHP is subjective expert scoring and then determining the weight of indicators, ignoring the numerical proportion of indicators. In order to ensure the accuracy and rationality of the final results and eliminate the subjective and objective bias of the two methods, the combined weight is calculated by the comprehensive integration assignment method. The TOPSIS method is used to calculate the closeness, make full use of the data, and accurately reflect the gap between indicators at all levels.
(1)
The weight of each index is calculated by entropy weight method.
Suppose there are m evaluation objects and n evaluation indicators. Standardize the original data:
G i j = x i j i = 1 m x i j   i = 1 , 2 , , m ;   j = 1 , 2 , n ,
where the original data xij denotes the j-th index of the i-th sample, Gij denotes the normalized value of xij.
(a)
Calculating information entropy Z j :
Z j = i = 1 m G i j ln G i j ln m ,   j = 1 , 2 , n ,
where m denotes the number of indicators.
(b)
Calculate the weight of each index W ^ j :
W ^ j = 1 Z j n j = 1 n Z j ,   j = 1 , 2 , n ,
(2)
On the other hand, the weight is calculated by the analytic hierarchy process, and the degree of each index is scored by experts. In this paper, SPSSPRO software is used to pass the consistency test of the judgment matrix and obtain the weight of the index W ¯ j .
(3)
The combination weight is solved by the comprehensive integration assignment method. The comprehensive integration weighting method is a commonly used method of comprehensive evaluation, which combines the characteristics of the subjective weighting method and objective weighting method to determine the index weight coefficient. There are also the addition integration weighting method and the multiplication integration weighting method. In this paper, we use the multiplication integration weighting method and combine the two methods above to obtain the weight values W ^ j and W ¯ j , so as to obtain more scientific and accurate combination weights.
W j = W ^ j W ¯ j j = 1 n W ^ j W ¯ j ,   j = 1 , 2 , n ,
(4)
TOPSIS method is used to calculate the closeness. By establishing a comprehensive evaluation index, we can measure the degree of the comparison sequence close to the positive ideal sequence and far from the negative ideal sequence, and then calculate the closeness, which can accurately reflect the gap between the indicators.
First, the original data is preprocessed by the extreme value method to obtain the decision matrix K = [kij]nxm. Then, the data standardization formula is as follows:
k i j = x i j min i , j { x i j } max i , j { x i j } min i , j { x i j } ,   i = 1 , 2 , m ;   j = 1 , 2 , n .
Set a weighted decision matrix:
P m × n = ( p i j ) m × n = ( w 1 k 11 w 2 k 12 w n k 1 n w 2 k 21 w 2 k 22 w n k 2 n w 1 k m 1 w 2 k m 2 w n k m n ) .
Calculate the distance to the maximum ideal value P+, and to the minimum ideal value P from each index.
P + = { max   p i j | i = 1 , 2 , , m } = { p 1 + , p 2 + , , p m + } ,
P = { max   p i j | i = 1 , 2 , , m } = { p 1 , p 2 , , p m } .
In fact, the closer the indicator is to the positive ideal value P+, the better the effect will be.
Closeness is a concept of fuzzy mathematics, an information measure commonly used by interval fuzzy sets, which reflects interval valued fuzzy sets. Calculate closeness as follows:
F i = j = 1 n ( p j p i j ) 2 j = 1 n ( p j + p i j ) 2 + j = 1 n ( p j p i j ) 2 .
The measure of closeness can be used to optimize the index weight in comprehensive evaluation. The larger the F value is, the closer the target scheme is to the optimal scheme, the farther it is to the worst scheme. On the contrary, the smaller the F value. The farther the standard scheme is from the best scheme, the closer it is to the worst scheme.

2.5. Carbon Neutralization Data Sources

In this paper, 10 typical provinces in China are taken as examples to conduct empirical research. The sample range is 2016–2020. According to regional development status, 10 provinces and their relevant indicator data in 2016–2020 are selected to reflect the development trend of carbon neutral targets in this region. The data collected in this paper are from the statistical yearbooks of Western Province, Fujian Province, Jiangsu Province, Heilongjiang Province, Liaoning Province, Henan Province, Hunan Province, Guangdong Province, Zhejiang Province, Shaanxi Province, the official website of the National Bureau of Statistics, and relevant economic and social development announcements and news reports of 10 provinces.

3. Assessment and Analysis of Carbon Neutralization Level

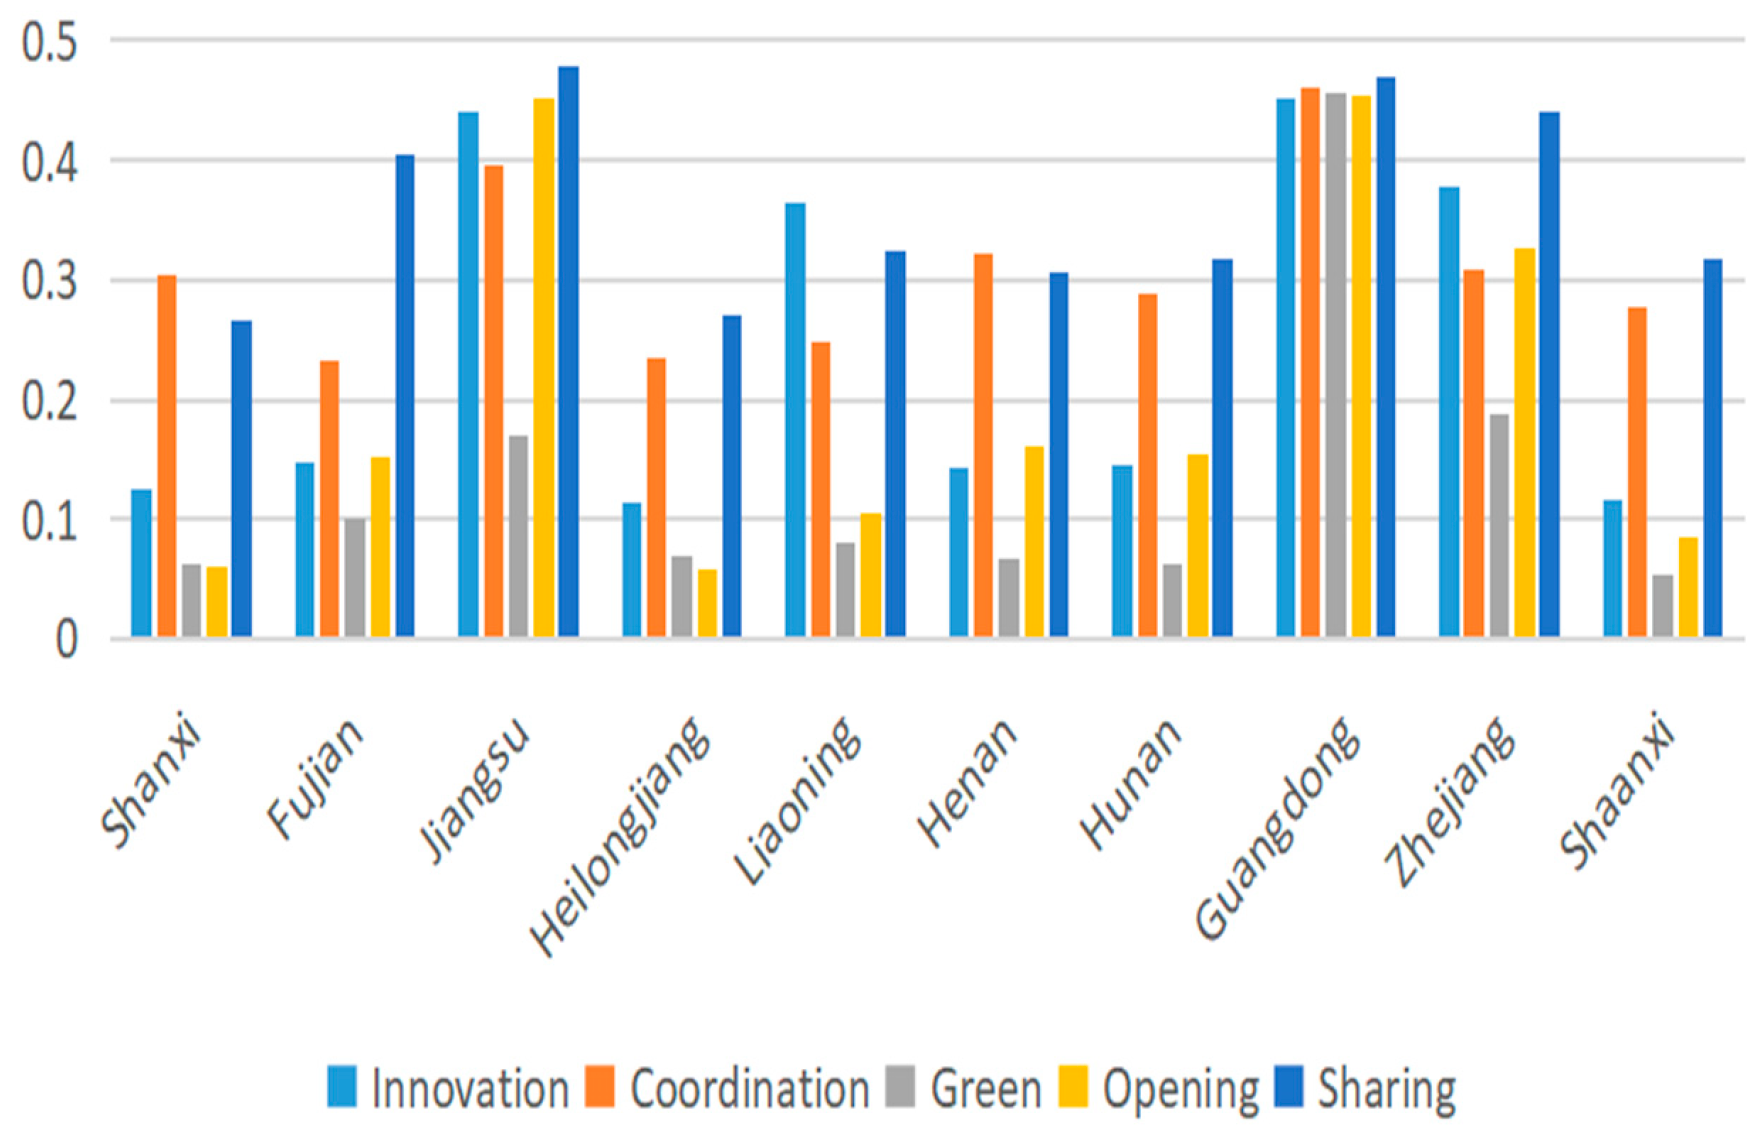
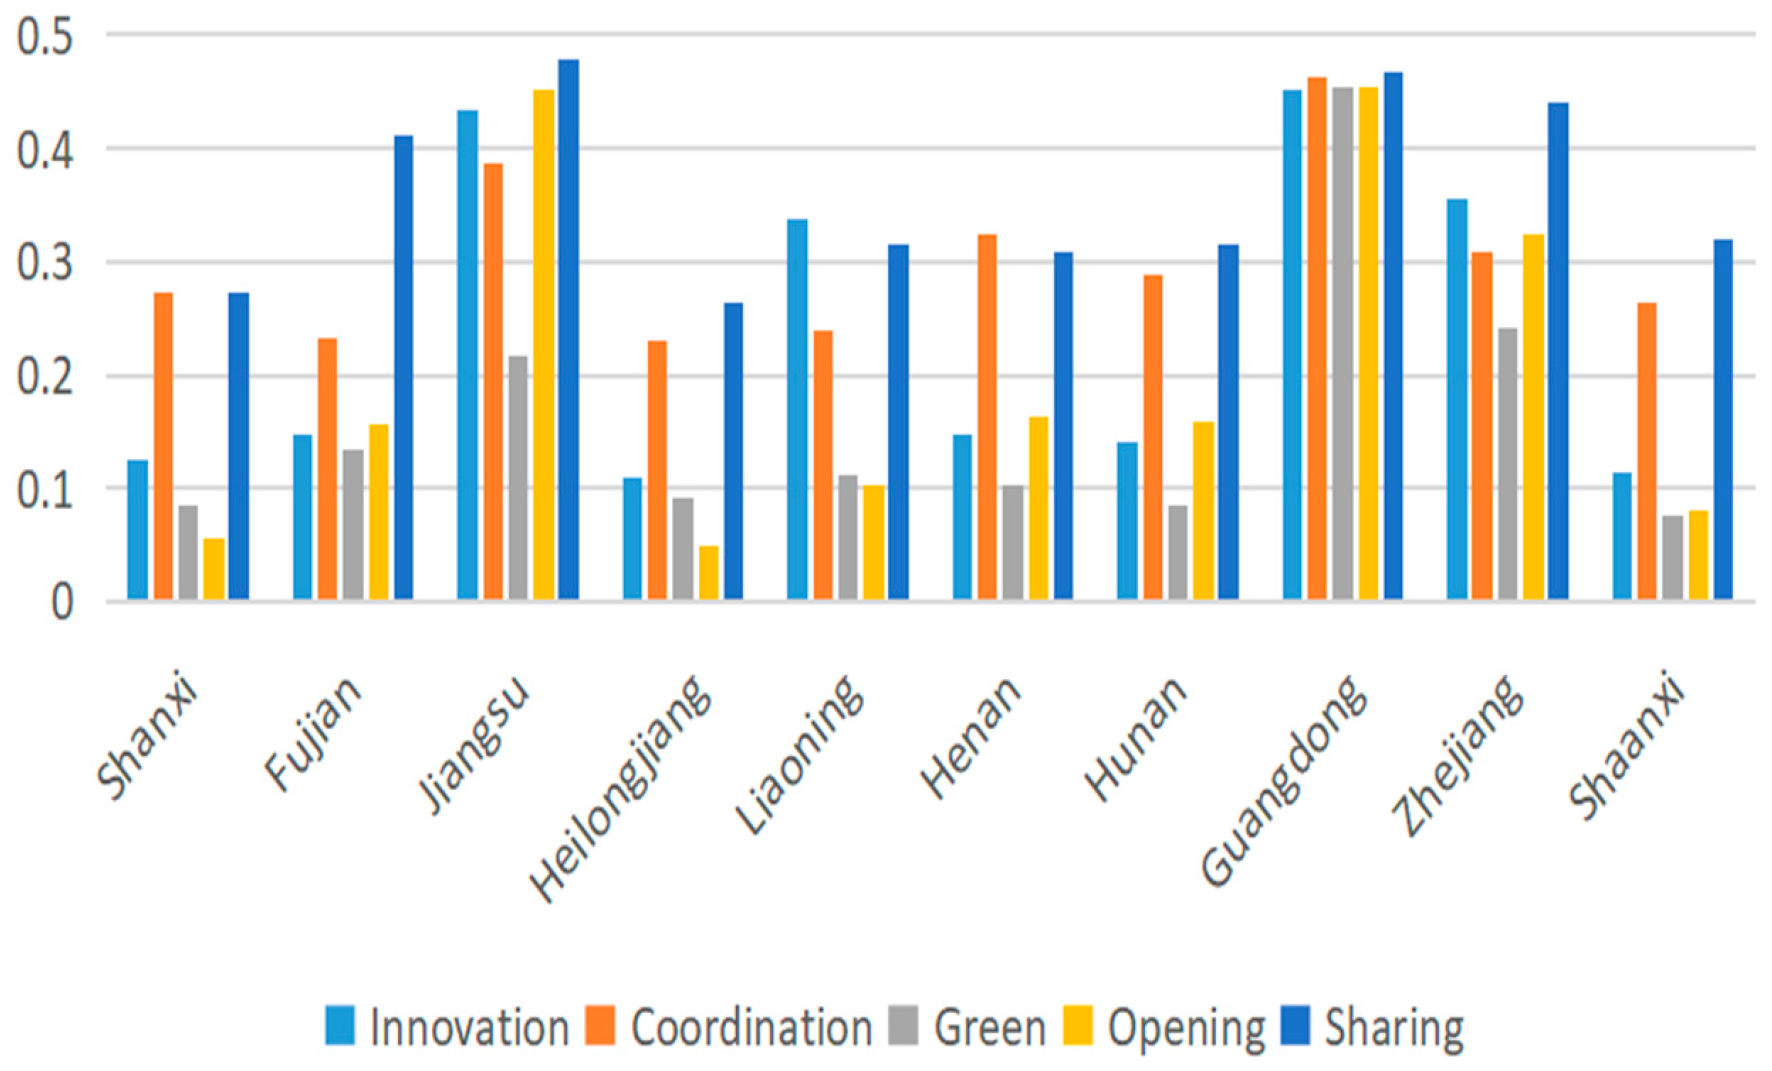
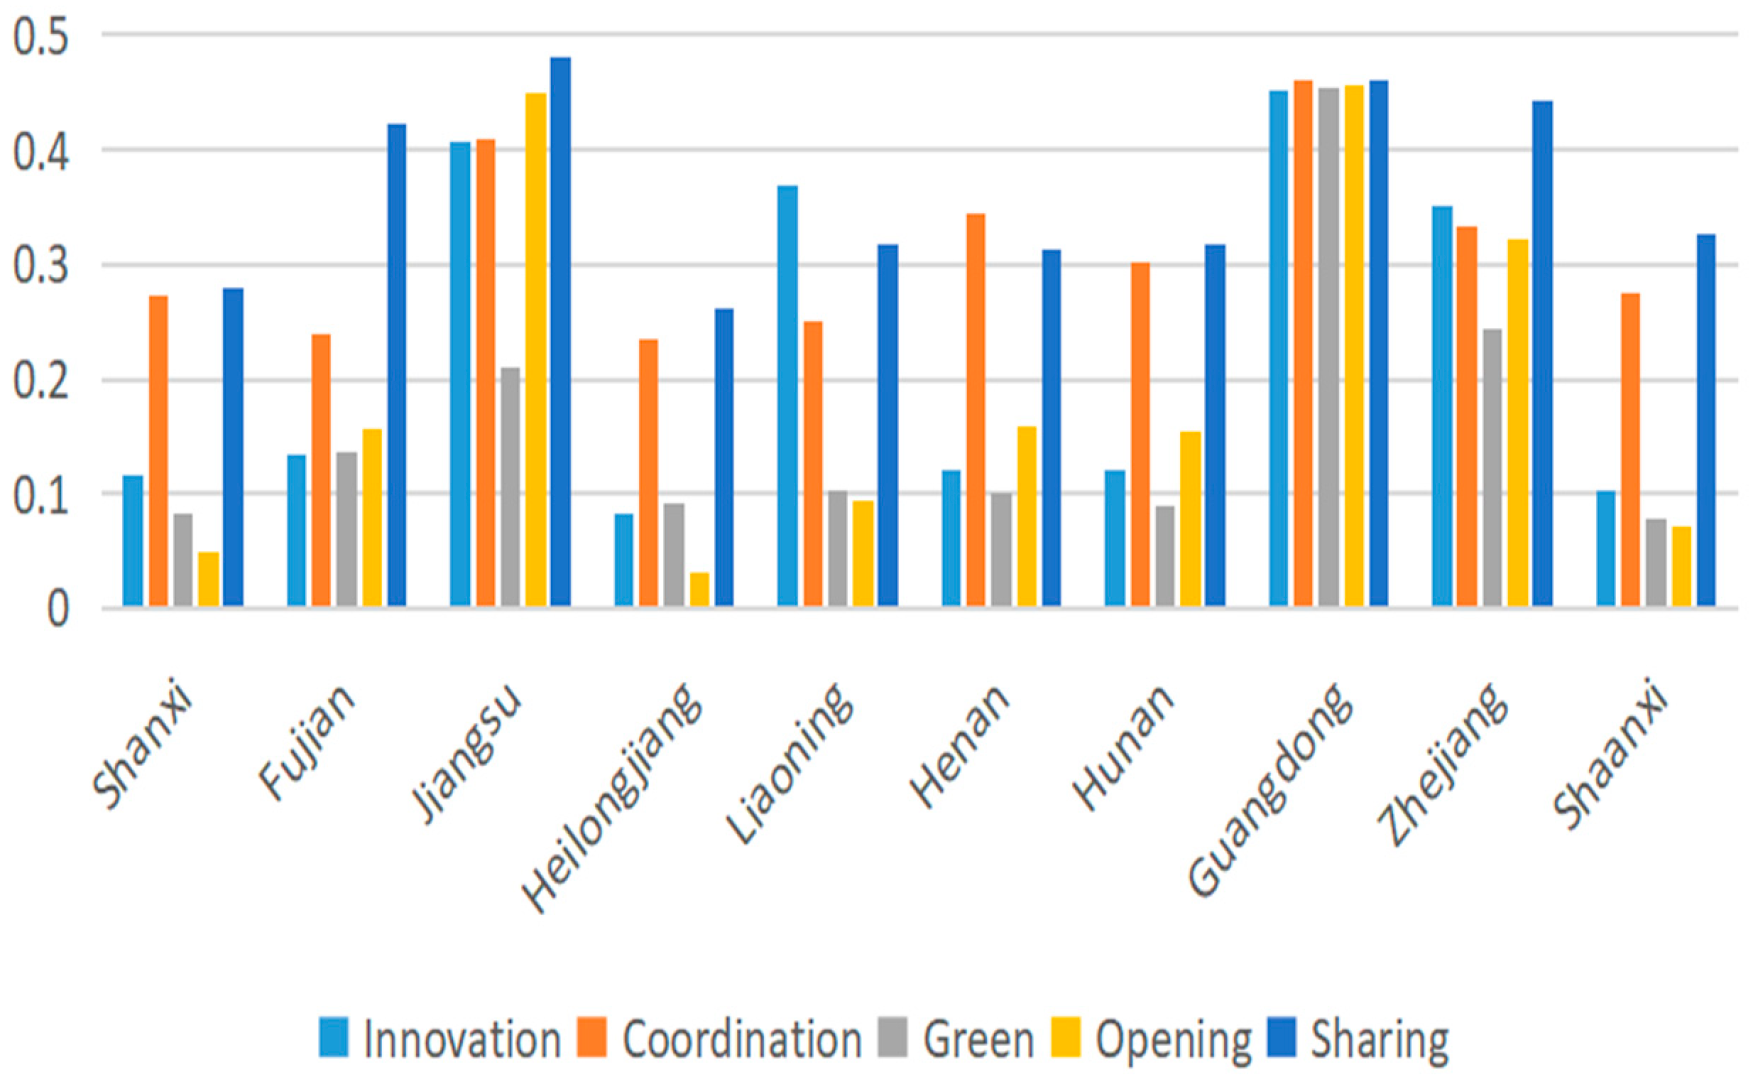
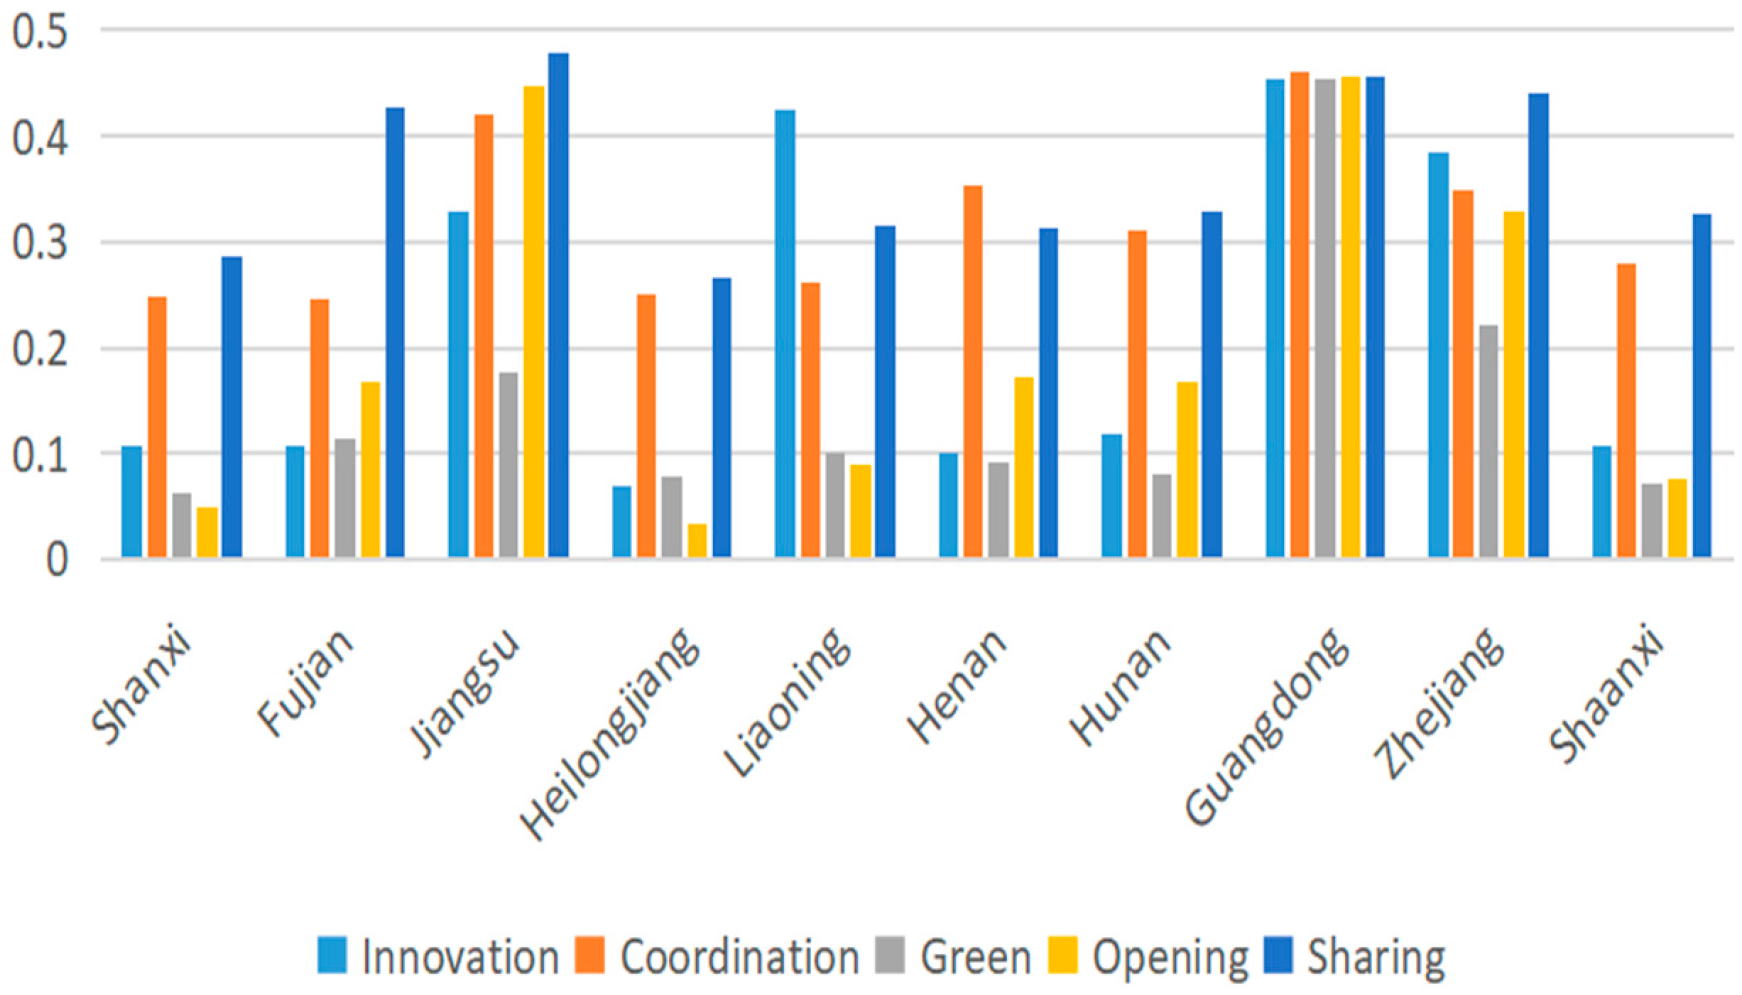
3.1. Analysis of Proximity Evaluation Based on Time Change from 2016 to 2020

According to the Table 2 and Figure 1, Figure 2, Figure 3, Figure 4 and Figure 5, Guangdong, Jiangsu and Zhejiang are the top three provinces with high carbon neutral development capacity, and the progress of each secondary indicator has reached more than 0.4000. Guangdong is the province with the best carbon neutral development, and the peak of the progress has reached 0.4110, and the secondary indicators have reached above 0.4500, which shows that Guangdong Province has developed comprehensively in the five aspects of innovation, coordination, green, openness and sharing, promoting each other and developing together. However, Heilongjiang Province and Shaanxi Province have slightly insufficient implementation of carbon neutral development, with the highest sticking rate reaching 0.0596 and 0.0611. During the development period from 2016 to 2020, the closeness of innovation and development in Heilongjiang Province has been decreasing year by year in comparison among provinces and is also at the bottom of the closeness ranking. During this period, the innovation and development of Liaoning Province has become a trend of outstanding development year by year, second only to the stable development of Guangdong Province. For coordinated development, there is no obvious difference in changes among provinces, and the development closeness of Guangdong Province ranks first. Shanxi Province, Heilongjiang Province and Shaanxi Province are at the bottom of the list in terms of green development, open development and shared development, while Jiangsu Province, Guangdong Province and Zhejiang Province are at the top of the list in terms of open development and shared development. Fujian Province, Hunan Province and Zhejiang Province rank in the middle of the comprehensive development closeness. There are advantages and disadvantages in all aspects. It needs to be promoted in many ways to achieve common promotion and development.
In terms of shared development, Guangdong Province ranked the first in the period from 2016 to 2017. Through specific analysis, it was found that Guangdong Province was outstanding in sharing economic benefits. It will implement the task of carbon neutrality, drive the development of carbon neutralization-related industries and improve economic benefits, and then significantly increase the per capita GDP. In view of coordinated development, Guangdong Province has a prominent development in the period from 2018 to 2020, and has an advantage in energy industry investment. Guangdong Province belongs to South China, which is the development area of China’s manufacturing industry, with many manufacturing and processing manufacturers and electronic equipment manufacturers, and the adjustment of energy structure is relatively complete. During the development period from 2016 to 2020, the opening and sharing development of Heilongjiang Province is relatively backward, which is reflected in the insufficient investment in the base of carbon neutralization experimental research. Northeast China is a traditional industrial development area in China. It is located in Angang, Shenyang No.1 Machine Tool Plant, Daqing Oilfield and other industrial energy plants. Therefore, energy consumption and carbon emissions in Northeast China are also serious. Experimental research and base investment reflect the importance that the province attaches to the development of energy industry technology. We should vigorously promote the development and technological innovation of low-carbon energy and optimize the energy structure.

3.2. Closeness Analysis Based on Provincial Changes from 2016 to 2020

As shown in Table 3, in the carbon neutral assessment index system from 2016 to 2020, each province will increase its innovation, coordination, green, development and shared development correspondingly. Jiangsu, Liaoning, Guangdong, Zhejiang and Shaanxi provinces have achieved good results in the process of increasing year by year. Fujian has the most obvious increase in the comprehensive closeness from 2016 to 2020, while Heilongjiang has unstable fluctuations in the comprehensive closeness. From 2016 to 2018, it was in a downward trend, and from 2018 to 2020, it began to rise, and the trend gradually reversed. At the end of the statistics in 2020, all provinces have reached more than 0.4600, and Liaoning Province has achieved remarkable results. At the beginning of the same period as other provinces, it has obtained an evaluation close to 0.4700. Further, Table 3 shows the trend change of secondary indicators, from which we can see that Liaoning Province, Guangdong Province, Zhejiang Province and Shaanxi Province were relatively weak in 2016 at the initial stage of innovation and development, but they have achieved steady growth in recent years. On the other hand, Heilongjiang Province and Zhejiang Province have a relatively good foundation in terms of opening up, which has decreased for Heilongjiang Province and increased for Zhejiang Province in 2020. The other indicators are relatively flat. The outstanding ones are the development of innovation in Hunan Province, Guangdong Province, Zhejiang Province, Liaoning Province and Shaanxi Province, the development of sharing in Fujian Province, and the development of green in Henan Province.
In general, the provinces of Western China, Hunan Province and Shaanxi Province have achieved good results, while Heilongjiang Province has shown a downward trend in some of them. Through specific analysis, Jiangxi Province belongs to North China, which has always been the main coal production area in China. Industry is the second largest emission source of carbon dioxide, accounting for about 35% of the total emission of the national energy system. Shanxi province is the most developed province in the industrial economy and a major coal production province. The air pollution is serious, water pollution and water resource destruction are also serious, and the concentration of sulfur dioxide ranks first, which is the focus of energy conservation and emission reduction. Hunan Province belongs to Central China and is an important building materials production area in China. Its factories are widely distributed and have great carbon emission pressure. The global demand for China’s steel and chemical products will continue to grow, and it is an important territory to guide the conversion of traditional energy to clean energy. It is necessary to significantly reduce the emission intensity of production by popularizing innovative technologies that are not yet commercialized, especially in steel, cement and other fields to achieve the goal of carbon neutralization. Northeast China is a traditional industrial development area and a large province of medium industry size in China. Therefore, the problem of energy consumption and carbon emissions in Northeast China is also relatively serious. It may be that the problem of the traditional coal burning industry leads to the low penetration rate of natural gas, which leads to a decline in openness.
At present, the whole country and even the world are faced with the problem of how to achieve the carbon neutral development goal. The proposal of “double carbon” has pointed out the direction for all parts of China. We are accelerating green development and ecological civilization construction to accelerate overtaking and strive to build a green, environment-friendly and low-carbon home. This paper constructs a comprehensive and scientific evaluation index system for carbon neutral development, and combines the entropy weight method, the analytic hierarchy process, the TOPSIS method and other comprehensive evaluation methods to directly and accurately reflect the carbon neutral development process of each province. Combined with the in-depth analysis of the connotation of “dual carbon”, this paper constructs a carbon neutral evaluation index system from the five aspects of innovation, coordination, green, openness and sharing, and evaluates and analyzes the carbon neutral development level of 10 typical provinces in 2016–2020 by measuring the closeness of secondary indicators. According to the results obtained, the following conclusions can be drawn: due to the different geographical locations and distribution regions of provinces, the distribution of energy and resources in the region is uneven, and the regional economic development among provinces is unbalanced and insufficient, which leads to the imbalance of the carbon neutral development level in each province. The imbalance in regional development is mainly manifested in the imbalance between the east and west, and between the north and south. The economy of the Northeast is far superior to that of the West, and there are differences between the North and the South. As a result, in terms of spatial distribution, East China, South China, Central China, North China and Northeast China are in a situation of decreasing area by area in terms of the degree of progress. In terms of time distribution, the closeness of each province is generally increasing year by year, but the development of each province in the five aspects of innovation, coordination, green, development and sharing is not balanced, resulting in small fluctuations or a downward trend in closeness.

4. Conclusions

Based on the results obtained from the above research and analysis, according to the influencing factors to achieve the carbon neutral development goal, the selected characteristic indicators with greater relevance are evaluated and analyzed. In order to promote the high-quality development of carbon neutral goals in all provinces, detailed analysis and research are made from the actual problems, and the following suggestions are put forward:
Strengthen innovation. Strengthen theoretical and institutional innovation. Strengthen scientific and technological innovation, the promotion and application of green and low-carbon technologies, reduce energy consumption, and improve energy utilization. Innovation is not only reflected in the innovation of technology, but also in the innovation of ideas and policies, seeking the way of innovation for the country and society. With the strong policy support of the state, we will provide more policies conducive to sustainable development through the ideological innovation of talents, so as to promote the work of environmental protection and environmental governance. Based on the table results of time series changes with provinces, it can be seen that in 2016–2020, Guangdong’s innovation and development rank first among the 10 provinces selected in this paper, and the development of each secondary indicator is in a balanced development. Heilongjiang Province, Jiangxi Province and Shaanxi Province are always in a weak position in terms of innovation and development. Therefore, in the northeast and north China, we should promote new breakthroughs in innovation-driven development, implement the principles and policies of clean energy according to local conditions, optimize the new energy structure, and promote low-carbon and environment-friendly production methods.
Strengthen ecological environment governance and expand green ecological space. For green development, Shaanxi Province, Heilongjiang Province, Hunan Province, Shaanxi Province and Henan Province are all at the edge. As a result, Northeast China, North China and Central China, centering on the goal of “carbon peaking and carbon neutralization”, have carried out green land actions, promoted the construction of natural protection systems, improved the carbon sink capacity of ecosystems, and adhered to and created a new high-quality development path with ecological priority and green development as the guidance. For open development, the proximity indicators of Jiangxi Province, Liaoning Province and Jiangxi Province are at the bottom. The region should increase the publicity of clean energy, accelerate the deepening reform of energy transformation, increase green research and development technology, promote the implementation of foreign cooperation and trade development and other policies, and promote the role of pollution reduction and carbon reduction.
The carbon neutral development goal and the development of the three pillar industries are promoted in coordination. For coordinated development, although the differences among provinces fluctuate, the gap is not obvious, and Guangdong ranks first.
(1)
From the agricultural perspective, China’s agricultural green development has made phased progress in terms of materials, technology and policies. With the “double carbon” goal as the strategic orientation of green development, we should optimize and adjust the industrial structure of agricultural development, transform the high consumption model of factor dependence into the low consumption model of productivity improvement, reduce the use of chemical fertilizers and pesticides, improve the recovery rate of agricultural film, and improve the conversion rate of livestock and poultry manure. Through agricultural emission reduction measures, we can help achieve carbon peak, and achieve carbon neutralization through agricultural foreign exchange increase.
(2)
From the industrial point of view, the imbalance of regional development in China has led to the imbalance of economic development in various provinces. To achieve industrial carbon emissions, we need to follow the inherent laws of economy and carbon emissions, adapt to local conditions, and plan and implement by region. Increase the continuous optimization of the industrial chain, improve factor efficiency, and establish a new mechanism to support China’s industrial carbon neutral development and low-carbon emission reduction. By increasing the use of digital technology, we will promote the technology input of new information industries such as 5G, big data, cloud computing, artificial intelligence into industrial applications, accelerate the integration and development of industry and the internet, promote the digital application and large-scale use in industrial production, improve the automation level, improve the efficiency of industrial production and processing, and finally achieve a low-carbon industry.
(3)
From the perspective of the tertiary industry, transportation, as an important field supporting China to achieve the goal of carbon peak, has the greatest potential for low-carbon emission reduction, while the coefficient of difficulty is the highest. In order to promote and realize the carbon peak and carbon neutral targets of transportation, promote the reform of energy consumption structure and realize the “decarbonization” of transportation energy. Increase road planning, improve the comprehensive efficiency of road freight transport, actively promote railway electrification, and promote the application of clean energy. Through diversified logistics transportation, the rapid increase of railway and waterway cargo transportation volume can be achieved while reducing carbon emissions. We will increase policy support, introduce and cultivate talents, and make transportation more meticulous and rational in dealing with carbon emission reduction.

Author Contributions

Conceptualization, G.X. and C.U.I.W.; methodology, G.X.; software, G.X.; validation, G.X. and C.U.I.W.; formal analysis, G.X. and C.U.I.W.; investigation, G.X.; resources, G.X. and C.U.I.W.; data curation, G.X.; writing—original draft preparation X.X. and G.X.; writing—review and editing, X.X. and G.X.; visualization, G.X.; supervision, G.X.; project administration, G.X.; funding acquisition, G.X. All authors have read and agreed to the published version of the manuscript.

Funding

The work is supported by Fujian Province Natural Science Foundation of China (Grant No. 2022J01378), Fujian Province Key Reform in Education of China (Grant No. FBJG20200310) and Fujian Province University Key Laboratory of Digital Technology and Intelligent Computing.

Institutional Review Board Statement

Not applicable.

Informed Consent Statement

Not applicable.

Data Availability Statement

The data that support the findings of this study are available from the corresponding author upon reasonable request.

Conflicts of Interest

The authors declare no conflict of interest.

References

  1. Wang, F.; Harindintwali, J.D.; Yuan, Z.; Wang, M.; Li, S.; Yin, Z.; Huang, L.; Fu, Y.; Li, L.; Chang, S.X.; et al. Technologies and perspectives for achieving carbon neutrality. Innovation 2021, 2, 100180. [Google Scholar] [CrossRef]
  2. Zhou, J. Analysis and Countermeasures of Green Finance Development under Carbon Peaking and Carbon Neutrality Goals. Open J. Soc. Sci. 2022, 10, 147–154. [Google Scholar] [CrossRef]
  3. Chen, L.; Msigwa, G.; Yang, M.; Osman, A.I.; Fawzy, S.; Rooney, D.W.; Yap, P.-S. Strategies to achieve a carbon neutral society: A review. Environ. Chem. Lett. 2022, 20, 2277–2310. [Google Scholar] [CrossRef]
  4. Wei, Y.-M.; Han, R.; Wang, C.; Yu, B.; Liang, Q.-M.; Yuan, X.-C.; Chang, J.; Zhao, Q.; Liao, H.; Tang, B.; et al. Self-preservation strategy for approaching global warming targets in the post-Paris Agreement era. Nat. Commun. 2020, 11, 1624. [Google Scholar] [CrossRef] [PubMed] [Green Version]
  5. Chen, J.M. Carbon neutrality: Toward a sustainable future. Innovation 2021, 2, 100127. [Google Scholar] [CrossRef] [PubMed]
  6. Wang, Y.; Guo, C.-H.; Du, C.; Chen, X.-J.; Jia, L.-Q.; Guo, X.-N.; Chen, R.-S.; Zhang, M.-S.; Chen, Z.-Y.; Wang, H.-D. Carbon peak and carbon neutrality in China: Goals, implementation path, and prospects. China Geol. 2021, 4, 720–746. [Google Scholar] [CrossRef]
  7. Hast, A.; Syri, S.; Lekavičius, V.; Galinis, A. District heating in cities as a part of low-carbon energy system. Energy 2018, 152, 627–639. [Google Scholar] [CrossRef]
  8. Berndes, G.; Abt, B.; Asikainen, A.; Cowie, A.; Dale, V.; Egnell, G.; Lindner, M.; Marelli, L.; Paré, D.; Pingoud, K.; et al. Forest biomass, carbon neutrality and climate change mitigation. Sci. Policy 2016, 3. Available online: https://efi.int/sites/default/files/files/publication-bank/2018/efi_fstp_3_2016.pdf (accessed on 15 February 2023).
  9. Schoedel, A.; Ji, Z.; Yaghi, O.M. The role of metal–organic frameworks in a carbon-neutral energy cycle. Nat. Energy 2016, 1, 16034. [Google Scholar] [CrossRef]
  10. Selman, P. Learning to Love the Landscapes of Carbon-Neutrality. Landsc. Res. 2010, 35, 157–171. [Google Scholar] [CrossRef]
  11. Liu, Z.; Guan, D.; Moore, S.; Lee, H.; Su, J.; Zhang, Q. Climate policy: Steps to China’s carbon peak. Nature 2015, 522, 279–281. [Google Scholar] [CrossRef] [PubMed] [Green Version]
  12. Nakajima, K.; Hara, M.; Hayashi, S. Environmentally Benign Production of Chemicals and Energy Using a Carbon-Based Strong Solid Acid. J. Am. Ceram. Soc. 2007, 90, 3725–3734. [Google Scholar] [CrossRef]
  13. Rogelj, J.; Schaeffer, M.; Meinshausen, M.; Knutti, R.; Alcamo, J.; Riahi, K.; Hare, W. Zero emission targets as long-term global goals for climate protection. Environ. Res. Lett. 2015, 10, 105007. [Google Scholar] [CrossRef]
  14. Dahal, K.; Juhola, S.; Niemelä, J. The role of renewable energy policies for carbon neutrality in Helsinki Metropolitan area. Sustain. Cities Soc. 2018, 40, 222–232. [Google Scholar] [CrossRef] [Green Version]
  15. An, R.; Yu, B.; Li, R.; Wei, Y.-M. Potential of energy savings and CO2 emission reduction in China’s iron and steel industry. Appl. Energy 2018, 226, 862–880. [Google Scholar] [CrossRef]
  16. Liu, W. EKC test study on the relationship between carbon dioxide emission and regional economic growth. Carbon Manag. 2020, 11, 415–425. [Google Scholar] [CrossRef]
  17. Li, X.; Yu, B. Peaking CO2 emissions for China’s urban passenger transport sector. Energy Policy 2019, 133, 110913. [Google Scholar] [CrossRef]
  18. Liu, Z.; Deng, Z.; He, G.; Wang, H.; Zhang, X.; Lin, J.; Qi, Y.; Liang, X. Challenges and opportunities for carbon neutrality in China. Nat. Rev. Earth Environ. 2022, 3, 141–155. [Google Scholar] [CrossRef]
  19. Zhao, X.; Ma, X.; Chen, B.; Shang, Y.; Song, M. Challenges toward carbon neutrality in China: Strategies and countermeasures. Resour. Conserv. Recycl. 2022, 176, 105959. [Google Scholar] [CrossRef]
  20. Grainger, A.; Smith, G. The role of low carbon and high carbon materials in carbon neutrality science and carbon economics. Curr. Opin. Environ. Sustain. 2021, 49, 164–189. [Google Scholar] [CrossRef]
  21. Wu, X.; Tian, Z.; Guo, J. A review of the theoretical research and practical progress of carbon neutrality. Sustain. Oper. Comput. 2022, 3, 54–66. [Google Scholar] [CrossRef]
  22. Shi, R.-J.; Fan, X.-C.; He, Y. Comprehensive evaluation index system for wind power utilization levels in wind farms in China. Renew. Sustain. Energy Rev. 2017, 69, 461–471. [Google Scholar] [CrossRef]
  23. Zhang, C.-Y.; Yu, B.; Chen, J.-M.; Wei, Y.-M. Green transition pathways for cement industry in China. Resour. Conserv. Recycl. 2021, 166, 105355. [Google Scholar] [CrossRef]
  24. Tang, B.; Wu, Y.; Yu, B.; Li, R.; Wang, X. Co-current analysis among electricity-water-carbon for the power sector in China. Sci. Total Environ. 2020, 745, 141005. [Google Scholar] [CrossRef] [PubMed]
  25. Zhang, Z.; Hu, G.; Mu, X.; Kong, L. From low carbon to carbon neutrality: A bibliometric analysis of the status, evolution and development trend. J. Environ. Manag. 2022, 322, 116087. [Google Scholar] [CrossRef]
  26. Huang, X.; Feng, C.; Qin, J.; Wang, X.; Zhang, T. Measuring China’s agricultural green total factor productivity and its drivers during 1998–2019. Sci. Total Environ. 2022, 829, 154477. [Google Scholar] [CrossRef] [PubMed]
Figure 1. Closeness level in 2016.
Sustainability 15 06598 g001
Figure 2. Closeness level in 2017.
Sustainability 15 06598 g002
Figure 3. Closeness level in 2018.
Sustainability 15 06598 g003
Figure 4. Closeness level in 2019.
Sustainability 15 06598 g004
Figure 5. Closeness level in 2020.
Sustainability 15 06598 g005
Table 1. Carbon neutralization evaluation index system and weight.
Indicators of
Level One
Indicators and Weights
of Level Two
Indicators of
Level Three
Entropy WeightAnalytic Hierarchy ProcessCombination WeightRank
High
Quality
Development
of
Carbon
Neutralization
Innovative developmentWind power generation
(100 million kWh)
0.08000.05110.07356
Energy processing conversion
efficiency (%)
0.16600.07460.12791
Environmental protection
invention patents
0.03600.03950.043313
Coordinated developmentGrowth rate of total output value of agriculture, forestry, animal husbandry and fishery (%)0.06900.07460.08254
investment in energy industry
(CNY 100 million)
0.02600.06320.046611
Transportation investment
(CNY 100 million)
0.02900.06890.05149
High
Quality
Development
of
Carbon
Neutralization
Green developmentForest coverage (%)0.09000.07600.09503
Number of parks0.03200.03080.036114
Sewage treatment
rate (%)
0.01730.04130.030715
Open developmentUrban natural gas penetration rate (%)0.08500.06030.08235
Local fiscal expenditure on environmental protection
(CNY 100 million)
0.02900.06740.050810
Experimental
research and
base investment
(CNY 10,000)
0.02900.10190.06258
Shared developmentOperating volume
of bus and
trolley bus (vehicles)
0.02900.05350.045312
number of people
in shared
service industry
0.09800.09210.10922
Sharing economic benefits
(CNY 100 million)
0.02900.10380.06317
Table 2. Closeness based on time from 2016 to 2020.
YearProvinceInnovation DrivenCoordinationGreenOpeningSharingComprehensive
2016Shanxi0.12450.30440.06230.05990.26610.0611
Fujian0.14700.23320.10010.15290.40470.1311
Jiangsu0.43990.39520.17050.45230.47880.4093
Heilongjiang0.11370.23540.06960.05740.27170.0596
Liaoning0.36490.24870.08000.10430.32430.0907
Henan0.14290.32210.06810.16010.30600.1377
Hunan0.14480.28890.06330.15450.31710.1326
Guangdong0.45120.46150.45520.45400.47000.4110
Zhejiang0.37770.30940.18780.32760.44020.2948
Shaanxi0.11570.27780.05350.08580.31760.0776
2017Shanxi0.12520.27370.08450.05600.27390.0548
Fujian0.14820.23320.13400.15580.41130.1311
Jiangsu0.43280.38730.21620.45190.47890.4081
Heilongjiang0.11060.23020.09180.04850.26360.0503
Liaoning0.33740.23870.11140.10270.31620.0861
Henan0.14800.32400.10270.16310.30780.1377
Hunan0.13990.28770.08610.15990.31530.1347
Guangdong0.45130.46220.45400.45460.46810.4108
Zhejiang0.35660.30750.24060.32500.43970.2909
Shaanxi0.11440.26400.07530.07960.31900.0695
2018Shanxi0.1155 0.2727 0.0838 0.0491 0.2790 0.0427
Fujian0.1352 0.2395 0.1355 0.1572 0.4235 0.1272
Jiangsu0.4068 0.4091 0.2103 0.4493 0.4799 0.4040
Heilongjiang0.0838 0.2347 0.0922 0.0319 0.2622 0.0331
Liaoning0.3688 0.2497 0.1021 0.0945 0.3168 0.0731
Henan0.1206 0.3444 0.1011 0.1584 0.3136 0.1282
Hun an0.1198 0.3020 0.0894 0.1549 0.3169 0.1250
Guangdong0.4528 0.4614 0.4537 0.4557 0.4612 0.4104
Zhejiang0.3500 0.3331 0.2431 0.3215 0.4430 0.2848
Shaanxi0.1037 0.2750 0.0785 0.0716 0.3268 0.0568
2019Shanxi0.10860.27030.06410.04880.28360.0437
Fujian0.11240.24130.11910.16330.42870.1336
Jiangsu0.38420.41040.18910.44780.47800.4027
Heilongjiang0.07240.23620.07670.03420.26730.0355
Liaoning0.37280.25140.09380.09030.31030.0709
Henan0.09560.35010.09700.16590.31600.1361
Hunan0.10830.30290.07910.16190.32760.1323
Guangdong0.45350.46400.45450.45560.45930.4104
Zhejiang0.33210.35150.22240.32430.44210.2878
Shaanxi0.10940.27820.06920.07320.33270.0589
2020Shanxi0.10710.24760.06340.05030.28590.0446
Fujian0.10810.24650.11320.16820.42640.1383
Jiangsu0.32920.41970.17630.44780.47920.4026
Heilongjiang0.06830.25000.07790.03430.26630.0356
Liaoning0.42570.26110.10000.09040.31460.0710
Henan0.10040.35240.09210.17260.31220.1425
Hunan0.11790.31140.08150.16760.32850.1377
Guangdong0.45380.46040.45450.45560.45570.4104
Zhejiang0.38490.34880.22220.32790.43990.2912
Shaanxi0.10790.27950.07130.07510.32740.0602
The
average
of
Closeness
from
2016
to
2020
Shanxi0.42130.44560.47510.44220.45120.4417
Fujian0.45840.47580.47380.43310.45640.4326
Jiangsu0.48190.46260.48650.45510.46690.4549
Heilongjiang0.47720.46940.47630.45450.47200.4538
Liaoning0.37770.47250.45230.46030.47800.4601
Henan0.46240.45910.44330.43550.46770.4353
Hunan0.43210.46460.44270.43500.46400.4345
Guangdong0.42420.46920.46250.45060.47620.4503
Zhejiang0.41150.45490.46550.44990.46960.4498
Shaanxi0.39460.47110.42760.45190.46530.4521
Table 3. Closeness based on provinces from 2016 to 2020.
ProvinceYearInnovation DrivenCoordinationGreenOpeningSharingComprehensive
Shanxi20160.38390.45520.47530.42170.42920.4266
20170.40490.44700.47830.43280.44590.4349
20180.42640.44700.47830.44590.45500.4445
20190.43630.45420.47010.45020.46100.4476
20200.45520.42480.47360.46030.46510.4551
Fujian20160.44400.46970.46870.40710.44090.4132
20170.45680.47470.47210.41980.45000.4228
20180.46490.47540.47480.43460.45920.4338
20190.45870.47920.47580.44720.46510.4430
20200.46750.47980.47750.45700.46670.4503
Jiangsu20160.47890.45010.48530.44270.45640.4459
20170.48260.45480.48600.44920.46300.4506
20180.48300.46350.48640.45570.46850.4553
20190.48330.46950.48710.46140.47200.4594
20200.48170.47520.48750.46630.47480.4631
Helongjiang20160.47620.46480.47390.46530.46630.4617
20170.48100.46810.47520.46060.46920.4583
20180.47600.46650.47660.43960.47190.4428
20190.47460.47040.47540.45070.47570.4510
20200.47830.47720.48040.45620.47700.4551
Liaoning20160.33430.46770.44350.44950.47150.4522
20170.33970.46950.45220.45700.47560.4576
20180.37380.47120.44580.46230.48000.4615
20190.39210.47320.45330.46420.47890.4628
20200.44840.48070.46660.46870.48400.4662
Henan20160.45480.44560.41780.41250.45400.4182
20170.46320.45260.44040.42460.46280.4273
20180.46620.46070.44150.43480.47060.4348
20190.45620.46750.45710.44770.47520.4442
20200.47160.46920.45960.45810.47610.4520
Huanan20160.41480.45490.42700.41040.45130.4162
20170.42540.46020.43370.42430.45840.4267
20180.42920.46540.44210.43470.46400.4344
20190.43160.46980.44880.44760.47170.4438
20200.45940.47290.46200.45780.47450.4513
Guangdong20160.39360.4 6010.46590.43560.46880.4394
20170.40960.46670.45400.44300.47410.4448
20180.42540.46920.45720.45180.47690.4512
20190.43760.47460.46480.45860.48000.4562
20200.45470.47540.47050.46400.48110.4601
Zhejiang20160.38800.43780.45960.43560.46000.4393
20170.39530.44430.46190.44220.46580.4442
20180.40790.45560.46550.45000.47130.4499
20190.41240.46810.46780.45760.47470.4554
20200.45380.46850.47290.46400.47620.4601
Shaanxi20160.34310.46390.40080.44030.45360.4436
20170.36280.46620.41510.44440.46080.4467
20180.38960.47100.42650.45100.46750.4515
20190.42790.47640.43890.45820.47220.4568
20200.44980.47810.45670.46550.47250.4621
Disclaimer/Publisher’s Note: The statements, opinions and data contained in all publications are solely those of the individual author(s) and contributor(s) and not of MDPI and/or the editor(s). MDPI and/or the editor(s) disclaim responsibility for any injury to people or property resulting from any ideas, methods, instructions or products referred to in the content.

