1. Introduction
Channels with vegetative linings have been used for agricultural drainage for years [
1]. Well-designed vegetative channels prevent flooding without causing erosion, protect the soil, avoid the formation of gullies, improve water quality, and reduce the generation of sediments [
2]. They are a cost-effective way of erosion control on roads and highway projects [
3,
4]. The vegetative cover protects critical areas such as levees, pond banks, and gullies in agricultural fields.
Flow resistance and stability are two primary considerations for good channel design. Flow resistance is related to friction and form stresses generated between water and vegetative cover, and stability refers to the prevention of channel degradation due to erosion. Fulfilling both conditions in grass lining is a challenging problem because the grass is flexible and bends according to the flow conditions [
5]. The presence of vegetation in waterways generates turbulence and, consequently, dissipation of energy and flow retardance [
6]. Flow resistance coefficients will not remain constant in cases where a grass boundary is present. For grass-lined channels, the drag force on the vegetal elements dominates resistance to flow. If the flow depth is less than the deflected grass height, the velocity mainly depends on vegetation density, spacing, type, and quality. When water depth overtops, the vegetal elements tend to align with the flow, and waving action is present. An increase in flow depth results in less influence from the bottom roughness, and flow resistance decreases. The number and length of stems seem to impact these conditions significantly. For large flows, the depth of water is much higher than the deflected height of the vegetation, the influence of vegetation reduces drastically, and the flow resistance due to grass remains constant. The size and bulk of vegetation near the bed dominate the resistance. Flows in the intermediate zone are essential for erosion and stability. Shallow flows cannot generate significant erosion, and high flows are not frequent [
7]. There is a need for resistance relations for shallow and very high flows over vegetative channels.
As early as 1949, Ree and Palmer [
8] found that Manning’s coefficient of resistance is a function of the product of the mean flow velocity, V, and the hydraulic radius, R. The hydraulic radius is the ratio of the wetted area, A, divided by the wetted perimeter, P, of the channel. A series of experiments developed between 1937 and 1953 by the Soil Conservation Service, now named the Natural Resources Conservation Service, NRCS, enabled the development of the first empirical correlations between retardance and flow conditions [
7]. Those experiments arrived at a classification or degree of retardance [
1] depending on the species, percent of cover, and vegetation height. Species classification refers to five classes: A, B, C, D, and E. The degree of resistance diminishes as the class moves from A to E. Generally, taller and abundant vegetation corresponds to retardances A and B. In contrast, shorter and scarce vegetation refers to C, D, and E. Retardance also varies with the degree of bending, which correlates with the flow velocity and depth. The National Engineering Handbook, Part 650, Chapter 7 [
9] contains the degree of retardance for grasses tested by the NRCS for the continental USA.
Forage production in Puerto Rico includes tropical species, some available in southern Florida, and other native species. In the humid northern region, the predominant species are Pangola grass (
Digitaria eriantha), guinea grass (
Panicum maximum), and star grass (
Cynodon nlemfuensis). Other grass species for vegetative lining in waterways in highway projects, cattle feed, and soil erosion control include Zoysia Grass (
Zoysia sp.) and Bermuda Grass (
Cynodon dactylon) [
2]. Bahía Grass, found in coastal areas, is resistant to drought and can survive in various soils from sandy to clay.
The USDA-NRCS Caribbean Area identified sixteen (16) species as vegetative lining for waterways in Puerto Rico [
2] and proposed a classification according to the degree of retardance. However, according to SCS-TP-61 [
1], the relations accepted by NRCS were developed “primarily for use in the Western Gulf Region” and recommended for general use in the Caribbean region. This research proposes a method for validating the retardance classification for submerged grass species in Puerto Rico. Four grass species from the Caribbean served to test the new procedure, which included the following steps:
- (a)
Measure and fit particle velocity distributions to a modified logarithmic law;
- (b)
Develop numerical simulations for adjusting the energy gradient;
- (c)
Solve Manning’s equation and the momentum equation to obtain the roughness coefficient and the retardance classification.
This section presents a summary of the scientific background used for this research.
1.1. Recent Advances in Vegetative Channel Design
Research on vegetative channels has made significant progress since the proposal of the retardance classification; however, retardance classification continues to be a design parameter in vegetative channel design. Two important steps to improve vegetative channel designs included the use of the Permissible Tractive Force instead of the Permissible Velocity as the design criterion [
10,
11,
12] and the incorporation of biomechanical properties and their relationship with the determination of the retardance classification promoted mainly by Kouwen [
4,
13,
14,
15,
16]. The main biomechanical properties of the vegetation are the longitudinal modulus of elasticity E, the moment of inertia I of the plant stems, and the vegetation concentration M. The product EI is the bending stiffness. However, the experiments used artificial vegetation with a constant stiffness value and predetermined patterns. Carolo et al. [
17] reviewed Kouwen’s method and concluded that it systematically overestimates the flow resistance and that the overestimation increases with the concentration of vegetal cover. These authors proposed a new resistance law that includes Reynold’s number parameter using the friction velocity and the bent vegetation height, which compares better with Kouwen’s and their experimental results.
Stephan and Gutknecht [
18] studied the influence of roughness resistance due to submerged macrophytes in a laboratory flume. These plants are flexible and have different behavior depending on the flow conditions. For the aquatic species tested, the deflected plant height is an essential parameter for describing the influence of roughness and hydraulic resistance; however, the wavy motion of the plants does not increase hydraulic resistance. Several studies have been made in laboratory flumes to study the effect of vegetation on flow resistance. According to Järvelä [
19], significant variations in the friction factors with the relative roughness, defined as the ratio of the deflected height of the vegetation and the flow depth, were observed, even when combined with stiffer leafless willows. The roughness characteristics in the presence of foliage are a combination of shape, size, arrangement, and concentration of the elements [
17]. Evaluating flow resistance for flexible vegetation requires considering the height of the bent vegetation for different hydraulic conditions and the influence of vegetation concentration. Kouwen and Unny [
16] suggested this behavior for grasses. The previous authors did not use the retardance class as a parameter in their research. More recently, other authors proposed the relation of Manning’s “n” with the Froude number [
20]. However, their data are limited and only apply to relatively small discharges (<0.06 m
3/s). Research on vegetative waterways continues gaining importance because vegetative cover in channels and ditches helps reduce the transport of pollutants into rivers and creeks, reducing environmental impacts [
21]. D’Ippolito et al. [
22] comprehensively reviewed flow resistance due to vegetation in open channels. Ahmad et al. developed laboratory experiments using Cow Grass and Pearl Grass to determine Manning’s
n-values [
23]; however, their
n-values were very low, probably due to a lack of precision in their measurements. Numerical modeling of vegetative cover accounting for the plant morphology and other characteristics of submerged vegetation under flow conditions is advancing [
24,
25]. Limitations in experimental channel size, slope, and pumping capacity make most of the proposed methods of limited use for general agricultural applications. The
n-VR method is extensively used as a design method [
26] in practical applications.
1.2. Flow Resistance of Vegetative Beds
Flow resistance is the opposition exerted by the bed and lateral lining in a channel, river, or overland waterway. The shear stress between the water and the waterway bed or side material quantifies resistance. Bed shear resistance relates to the velocity profile formed from the bed surface to the water surface. The velocity profile shows the change in velocity starting from zero at the bottom to the velocity at the water surface. Yen [
27] did a comprehensive review of flow resistance in open channels, including vegetated channels. The author establishes a general functional relation where Manning’s coefficient and Darcy–Weisbach friction factor for vegetated channels depend on nine parameters and points out the need for research to understand resistance in vegetated channels.
1.3. Prandtl-von Karman Logarithmic Law
Previous works demonstrated that the velocity profile is described mathematically using the logarithmic law (log law) proposed by Prandtl-von Karman and Nikuradse [
28]. Several researchers have modified the log law to fit specific experimental data from submerged vegetation. Stephan and Gutknecht [
18] summarize the different versions of Prandtl’s log law used to estimate velocity distributions and shear stress on submerged vegetation. In their review of ten publications, including experimental data associated with vegetative resistance, these authors show that only two researchers used live aquatic vegetation or submerged grass. Others used PVC or rigid rods to replace vegetation.
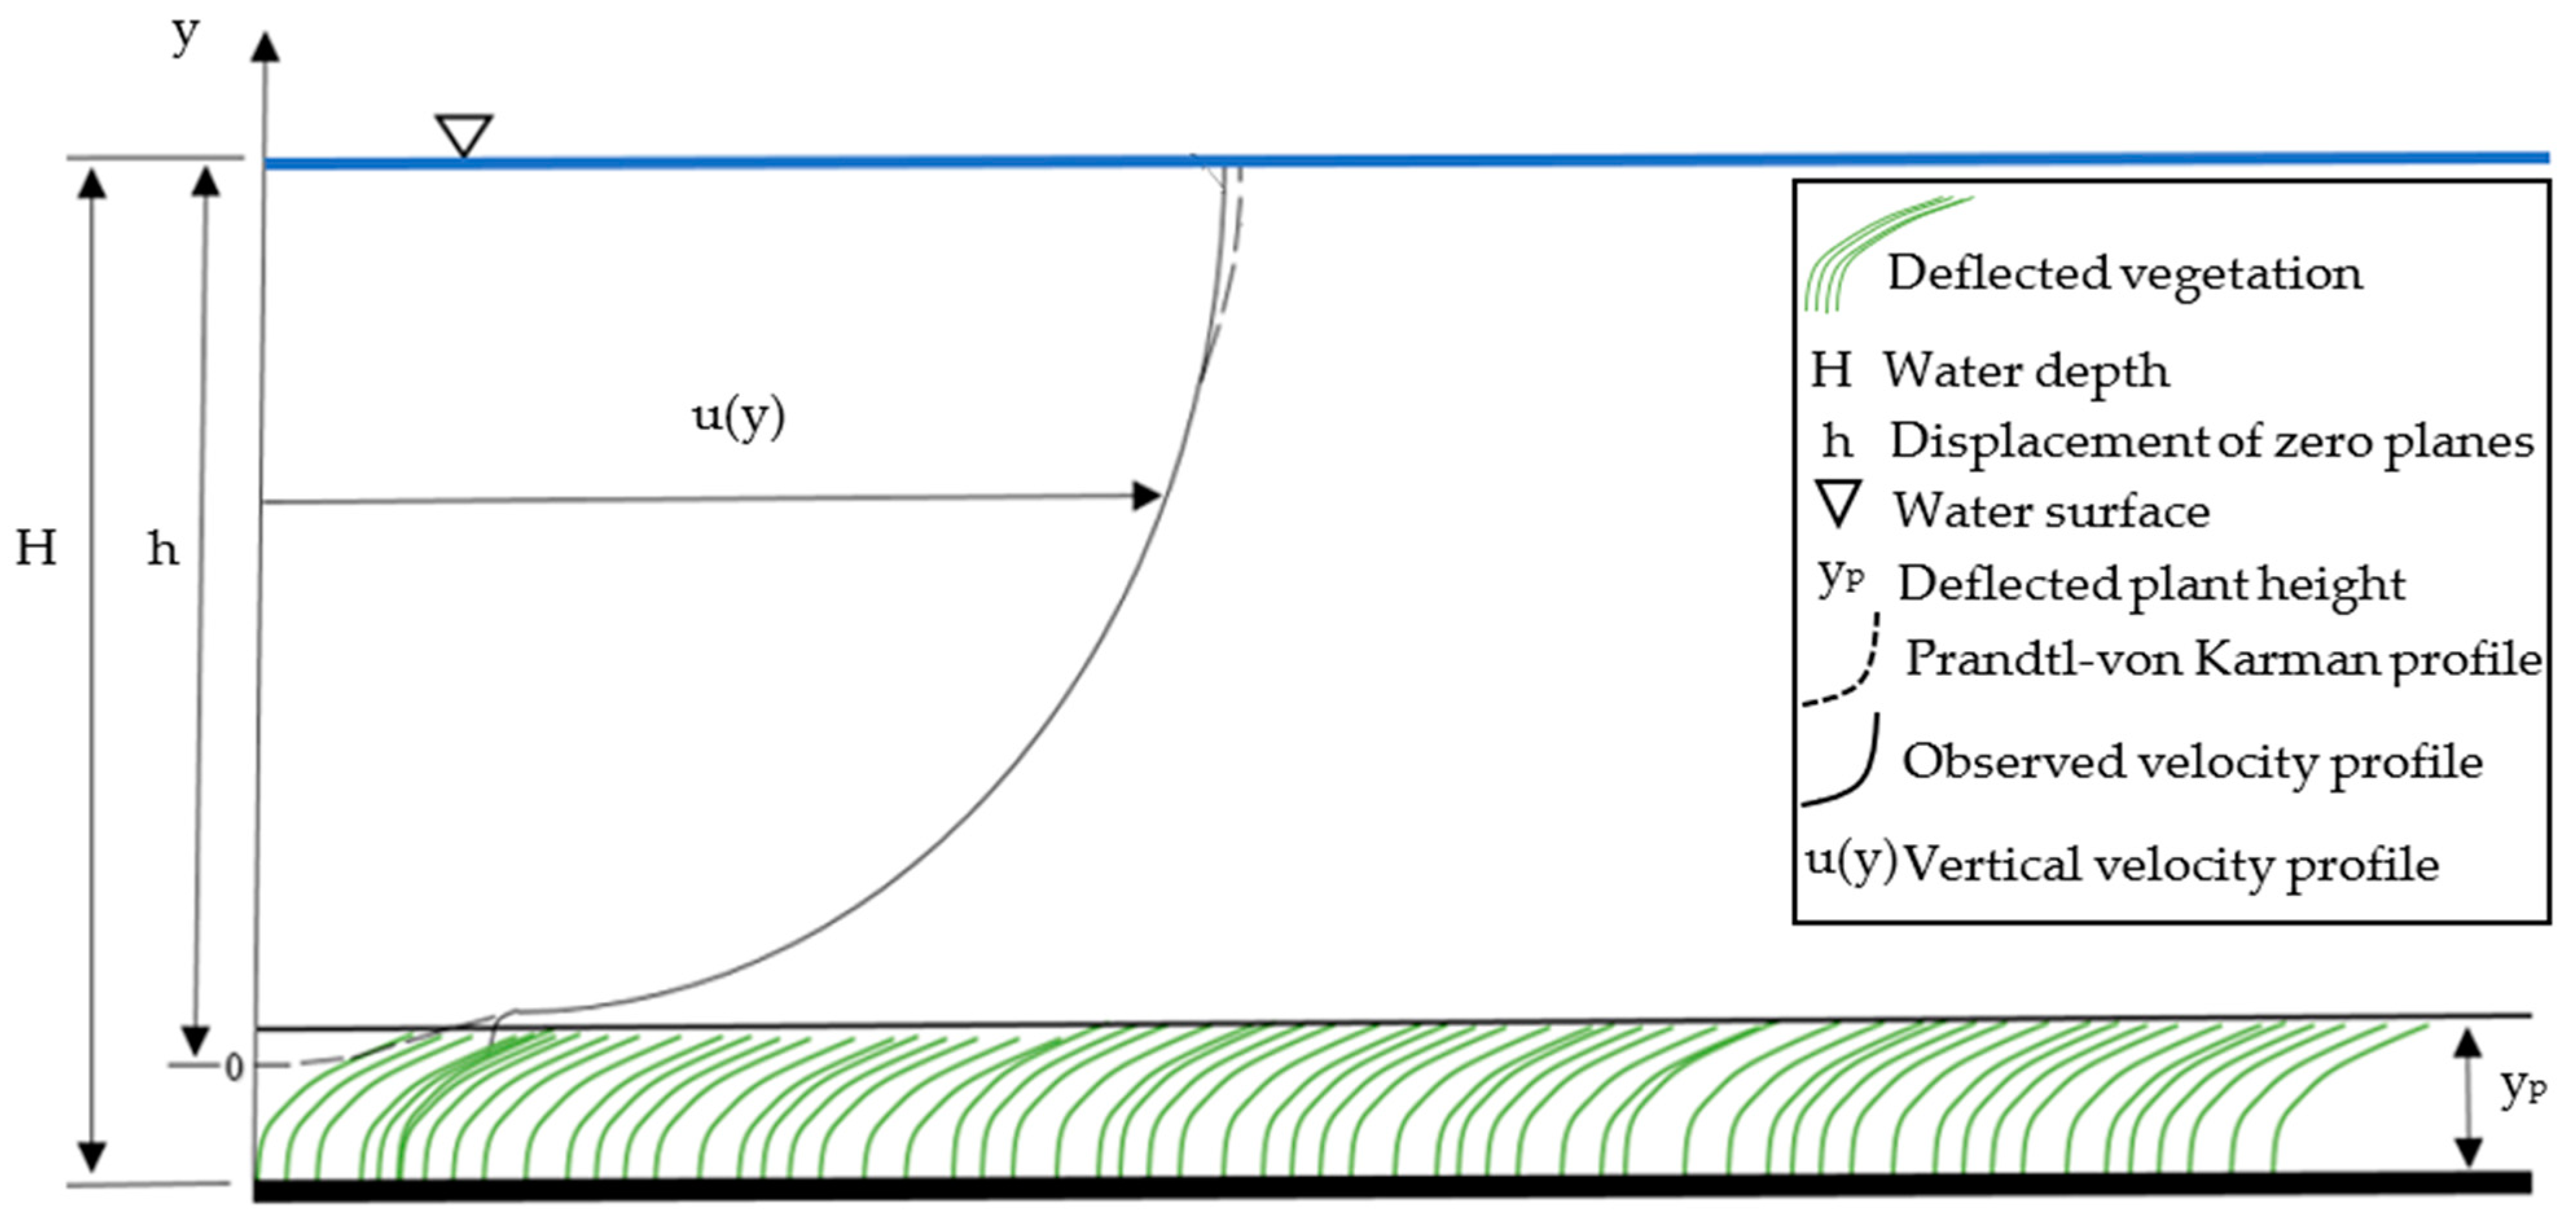
Moreover, the variations in the proposed relations for the velocity distribution reflect that vegetative resistance is subject to several conditions that make it challenging to find an exact “law” for all situations. One common observation in all experiments is that vegetation deflects due to water velocities, and its resistance below the deflected height is such that the flow velocities are almost zero. Consequently, a logarithmic velocity profile starts near the deflected vegetation’s top.
Figure 1 shows a schematic, adapted from Christensen [
29], comparing the typical log profile with the Prandtl-von Karman equation with the observed profile with dense vegetation. Notice the displacement of the zero planes in the velocity profile at a distance 𝑦
𝑝 from the channel bottom. This depth corresponds approximately to the deflected plant height. Negligible velocities occur below a depth 𝑦
𝑝.
The net effect is a displacement of the origin of the velocity profile. Christensen’s low profile considers the origin’s displacement, introducing the vegetation’s deflected height. His adjustments are well documented and valuable with live aquatic vegetation. Furthermore, parameters for the equation are easily measured to solve for the shear stress over vegetation. Equation (1) presents the log profile proposed by Prandtl-von Karman, and Equation (2) shows the formula proposed by Christensen.
Equation (3) is the log profile equation proposed by Christensen in 1985.
where 𝑢 is the particle velocity at a distance 𝑦 measured from the channel bottom, and 𝑦
𝑑 is the distance from the channel bottom to the height of deflected vegetation. Both equations include two constants. The von Karman’s constant, 𝜅, is equal to 0.40, and the constant C, which, for the fully rough regime, takes values between 8.0 and 8.5. 𝑘
𝑠 is an equivalent sand grain roughness with different values in vegetated channels. 𝑢
∗ is the friction velocity given in Equation (3).
Equation (3) contains the mass density of the fluid ϱ and the shear stress at the surface of deflected vegetation. Shear stress is a significant contributor to friction force in vegetated waterways.
1.4. Momentum Equation for Open-Channel Flow
In a gradually varied open-channel flow, the friction force caused by the shear stress balances the resultant gravity force along a channel reach. Gravity force combines the water’s specific weight and volume. Equating these two forces results in Equation (4):
R is the hydraulic radius defined as the ratio of the wetted cross-sectional area and the wetted cross-sectional perimeter, 𝑆𝑓 is the slope of the energy grade line, and g is the acceleration of gravity.
1.5. Manning’s Equation
Equation (5) is Manning’s equation for gradually varied flow:
where 𝑉 is the average flow velocity in the channel cross-section, 𝑛 is Manning’s coefficient, 𝑅 is the hydraulic radius, and 𝑆
𝑓 is the slope of the energy grade line. Experimental velocity profiles on the vegetated channel bottom allowed us to solve Equations (1) to (5) to obtain Manning’s coefficient and other flow resistance characteristics explained next.
2. Materials and Methods
Experimental data are necessary for obtaining relevant results for engineering design calculations. The empirical character of hydraulics of vegetative channels is a complex problem due to the dynamic nature of submerged vegetation and several possible plant configurations affected by flow velocity, flow depth, vegetation density, and plant morphology and structure. Any methodology involving experimental results with live vegetation, such as the one presented here, must consider three factors:
Lack of scaling. Vegetation cannot be modeled at small scales because each plant is unique, requiring tests with actual plant sizes. Many experiments in the literature use artificial rigid or flexible elements simulating grass-like behavior. However, researchers have shown that artificial elements do not reproduce the behavior of natural vegetation [
17];
Range of values in n-VR curves. Experiments performed in narrow flumes cannot reproduce the combination of velocities and hydraulic radius expected in natural waterways used for agricultural purposes. They aim to develop other relationships regarding the Froude and Reynolds number or bioengineering applications;
Risk of failure due to stability. A controlled flow velocity is required to avoid excessive shear stress causing soil erosion and removing plants from the bottom. Therefore, the maximum velocity should be kept below the threshold value that exceeds the maximum permissible shear stress.
The investigation described next used live vegetation. Plant density and root strength protected the soil during the experiments in these cases. Therefore, factors 1 and 3 were not an issue; however, the range of n-VR values was small due to the limited size of the flume.
2.1. Materials
2.1.1. Experimental Flume
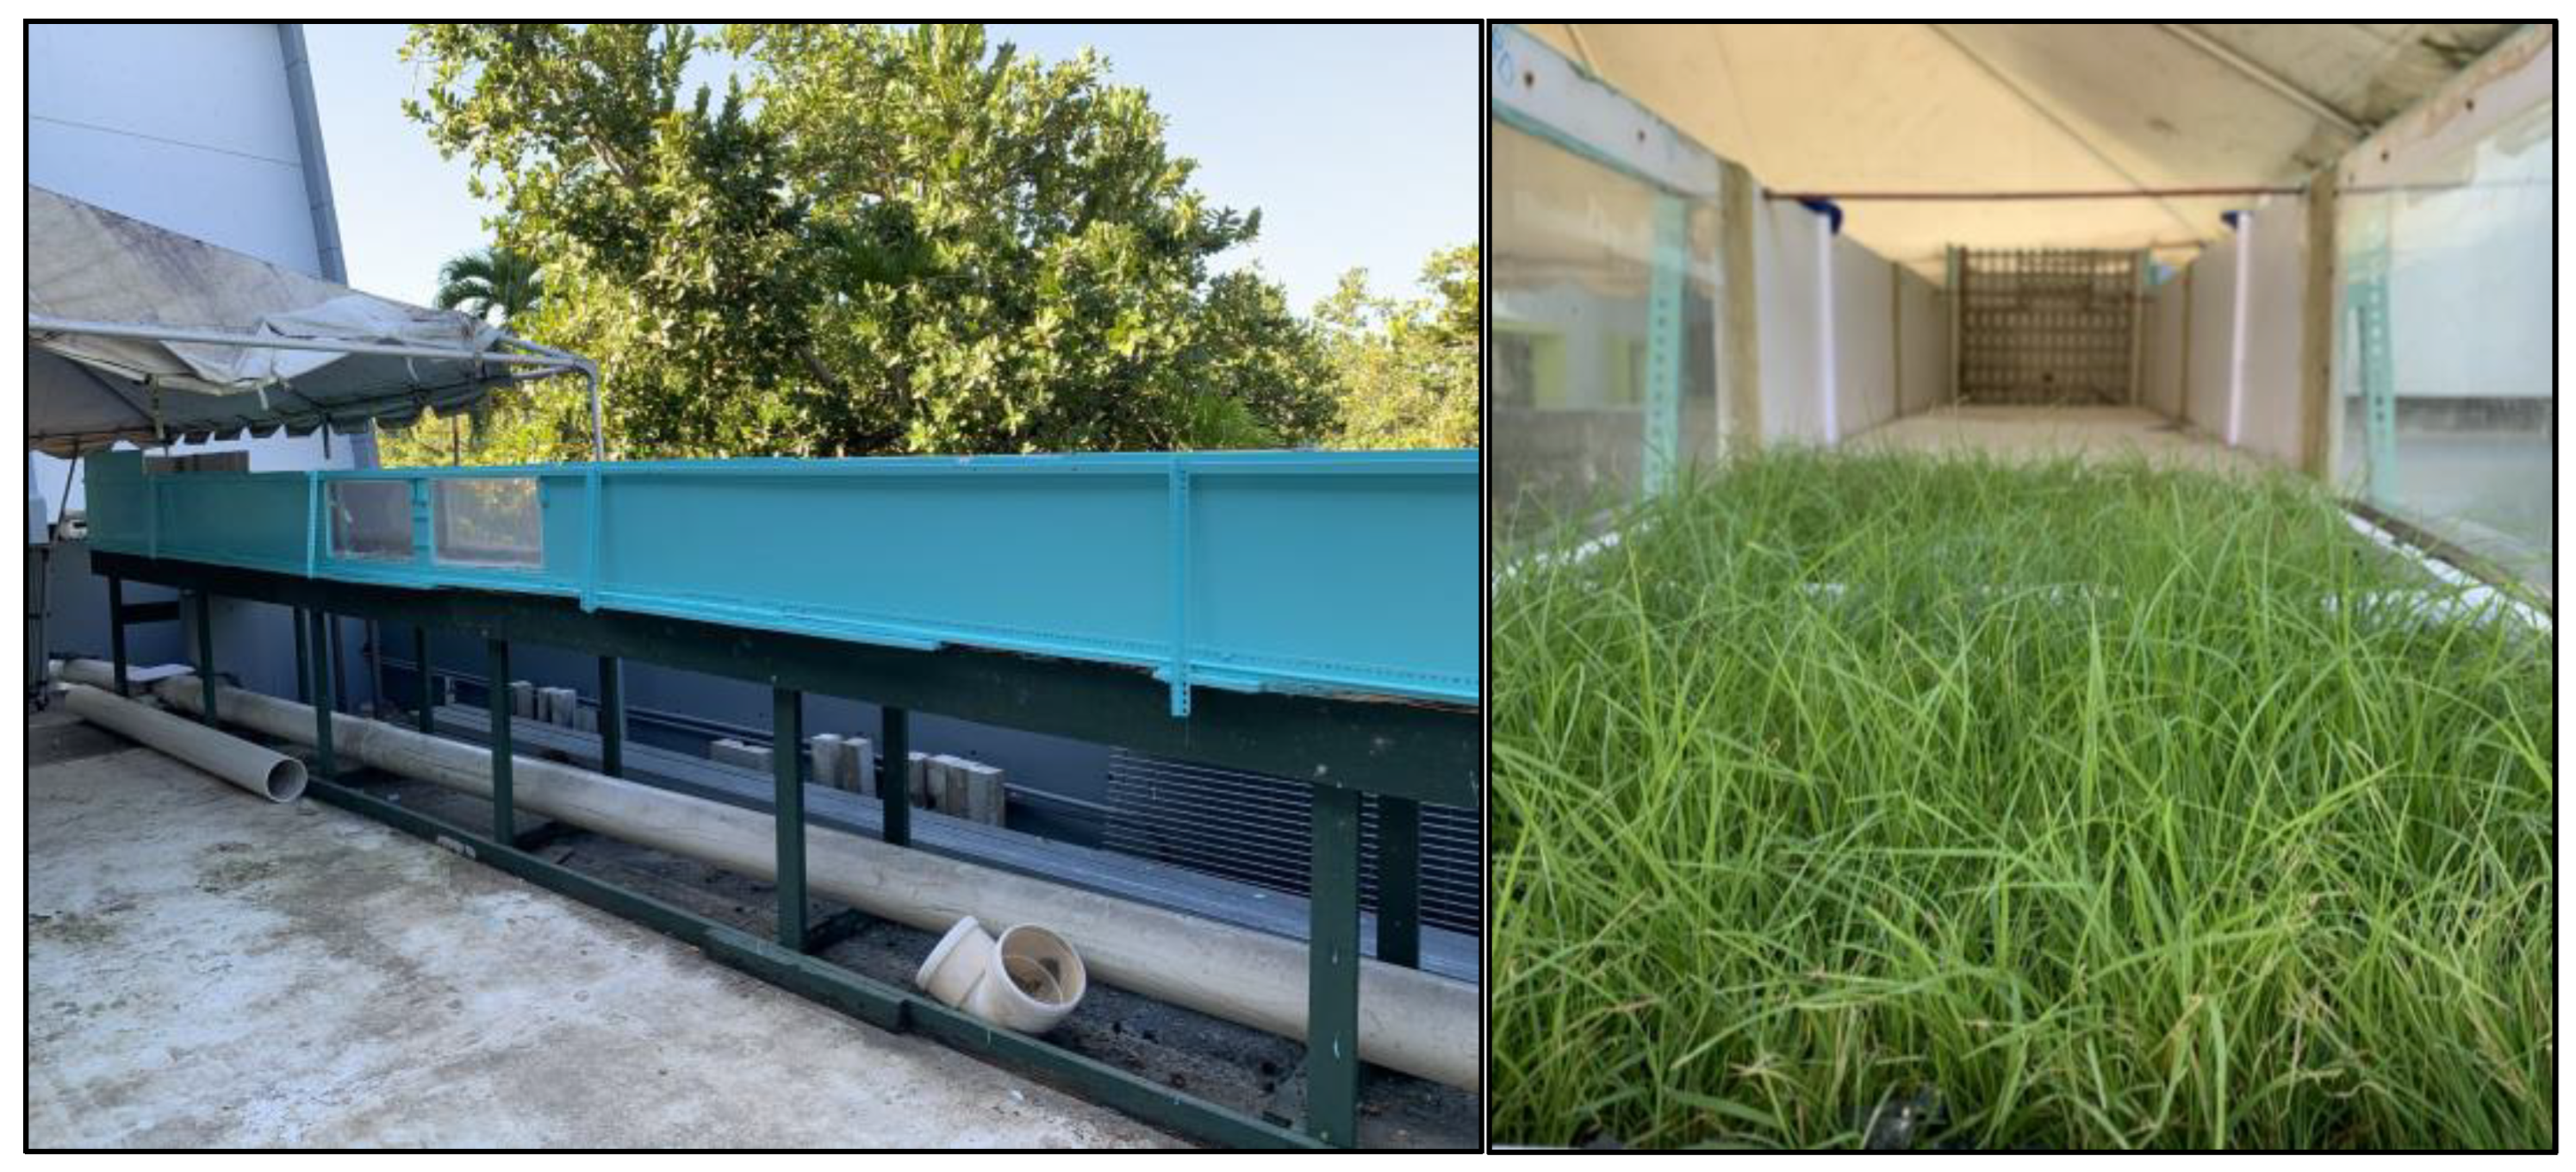
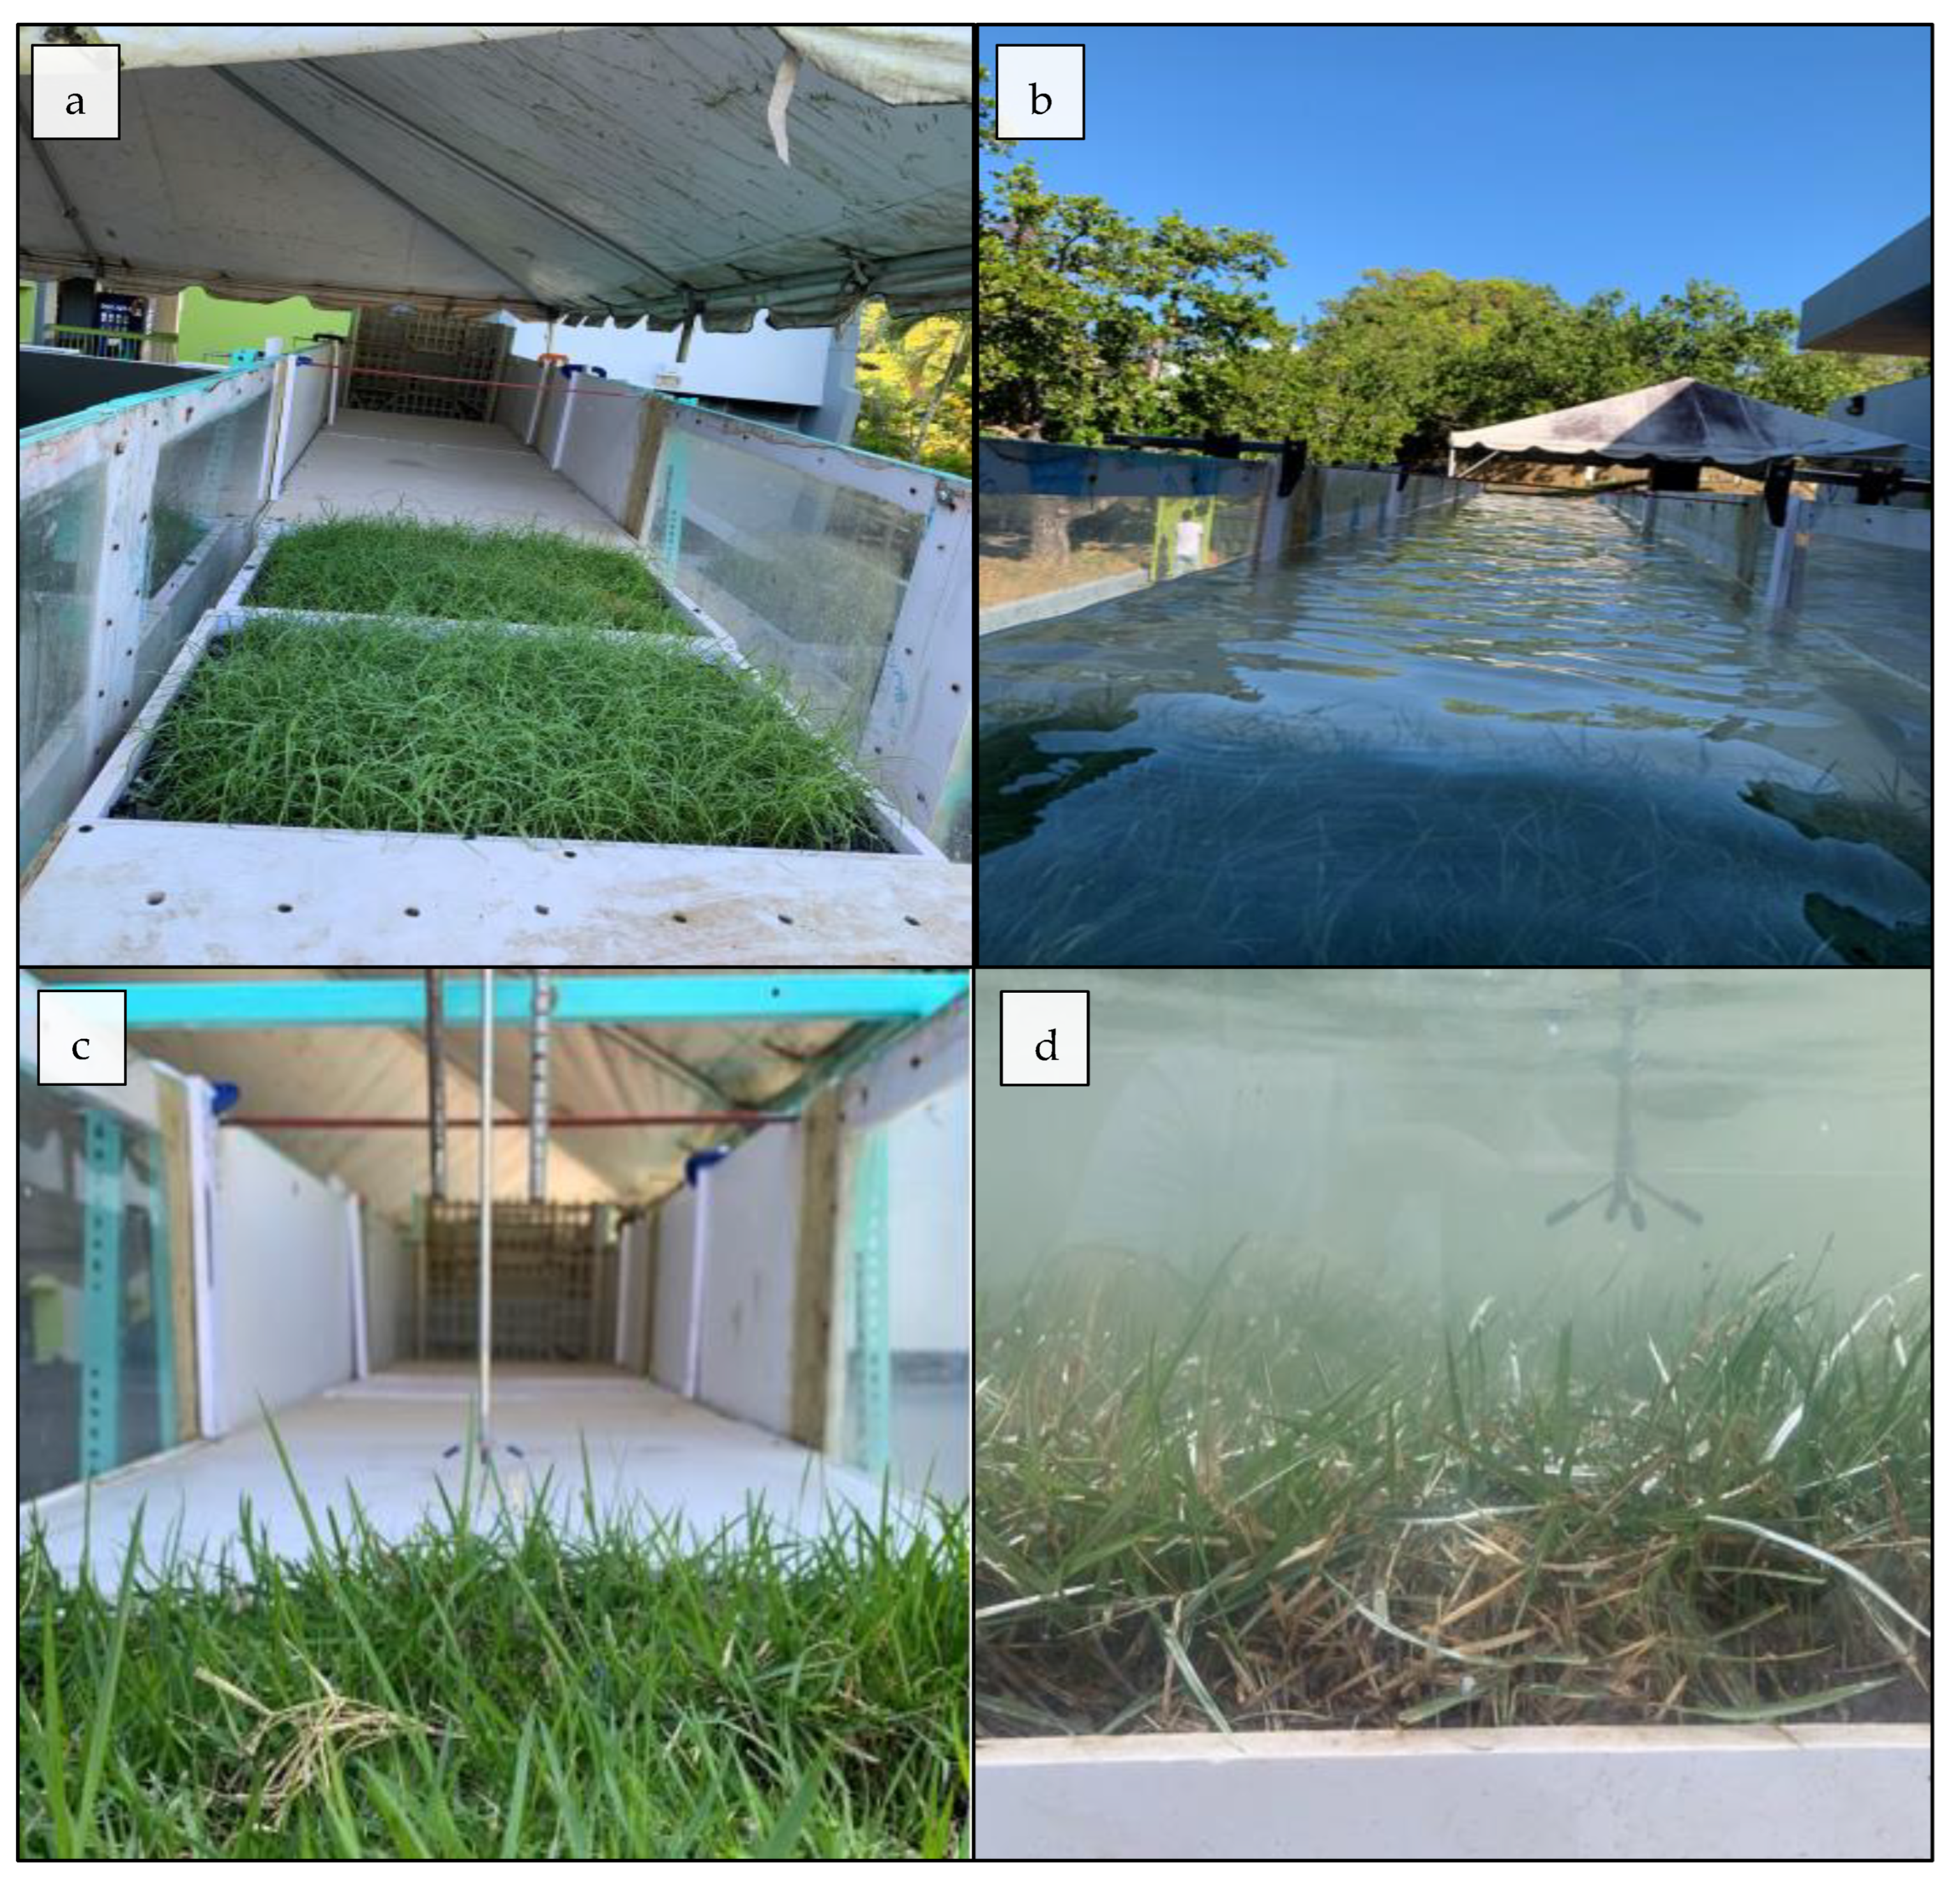
The flume used in this research had a total length of 10 m (33 ft) and was 0.61 m (2.0 ft) wide and 0.46 m (1.5 ft) tall. Due to the flume construction over a rigid frame, the slope value remained at 2.3% for all experiments. Each grass species was grown in trays 0.61 m × 0.46 m × 0.13 m (2.0 ft × 1.5 ft × 5 in). A testing reach consisted of two trays accommodated side by side, forming a measurement length of 0.96 m (3.0 ft). This array prevented the perturbation of soil and roots and allowed more control of cover density and plant selection. Velocity profiles far from the tray connection were measured. The rest of the channel bottom remained raised to the elevation of the planting boxes, 0.13 m (5 in), so the smooth bottom surface and vegetated soil bottom were at the same height. A transparent acrylic window on each side of the measurement distance allowed visual observation of the plant conditions during the experiments. Rectangular weirs at the downstream end permitted experiments at different water depths and discharges. All channel construction used PVC. A pump discharged water from a 1000 gal inflow tank into the flume. The flume released water into a tank connected to a return pipe for recirculation. Flow discharge was measured using a sharp-edged weir.
Figure 2 shows the flume with vegetation before starting the experiment.
2.1.2. Instrumentation
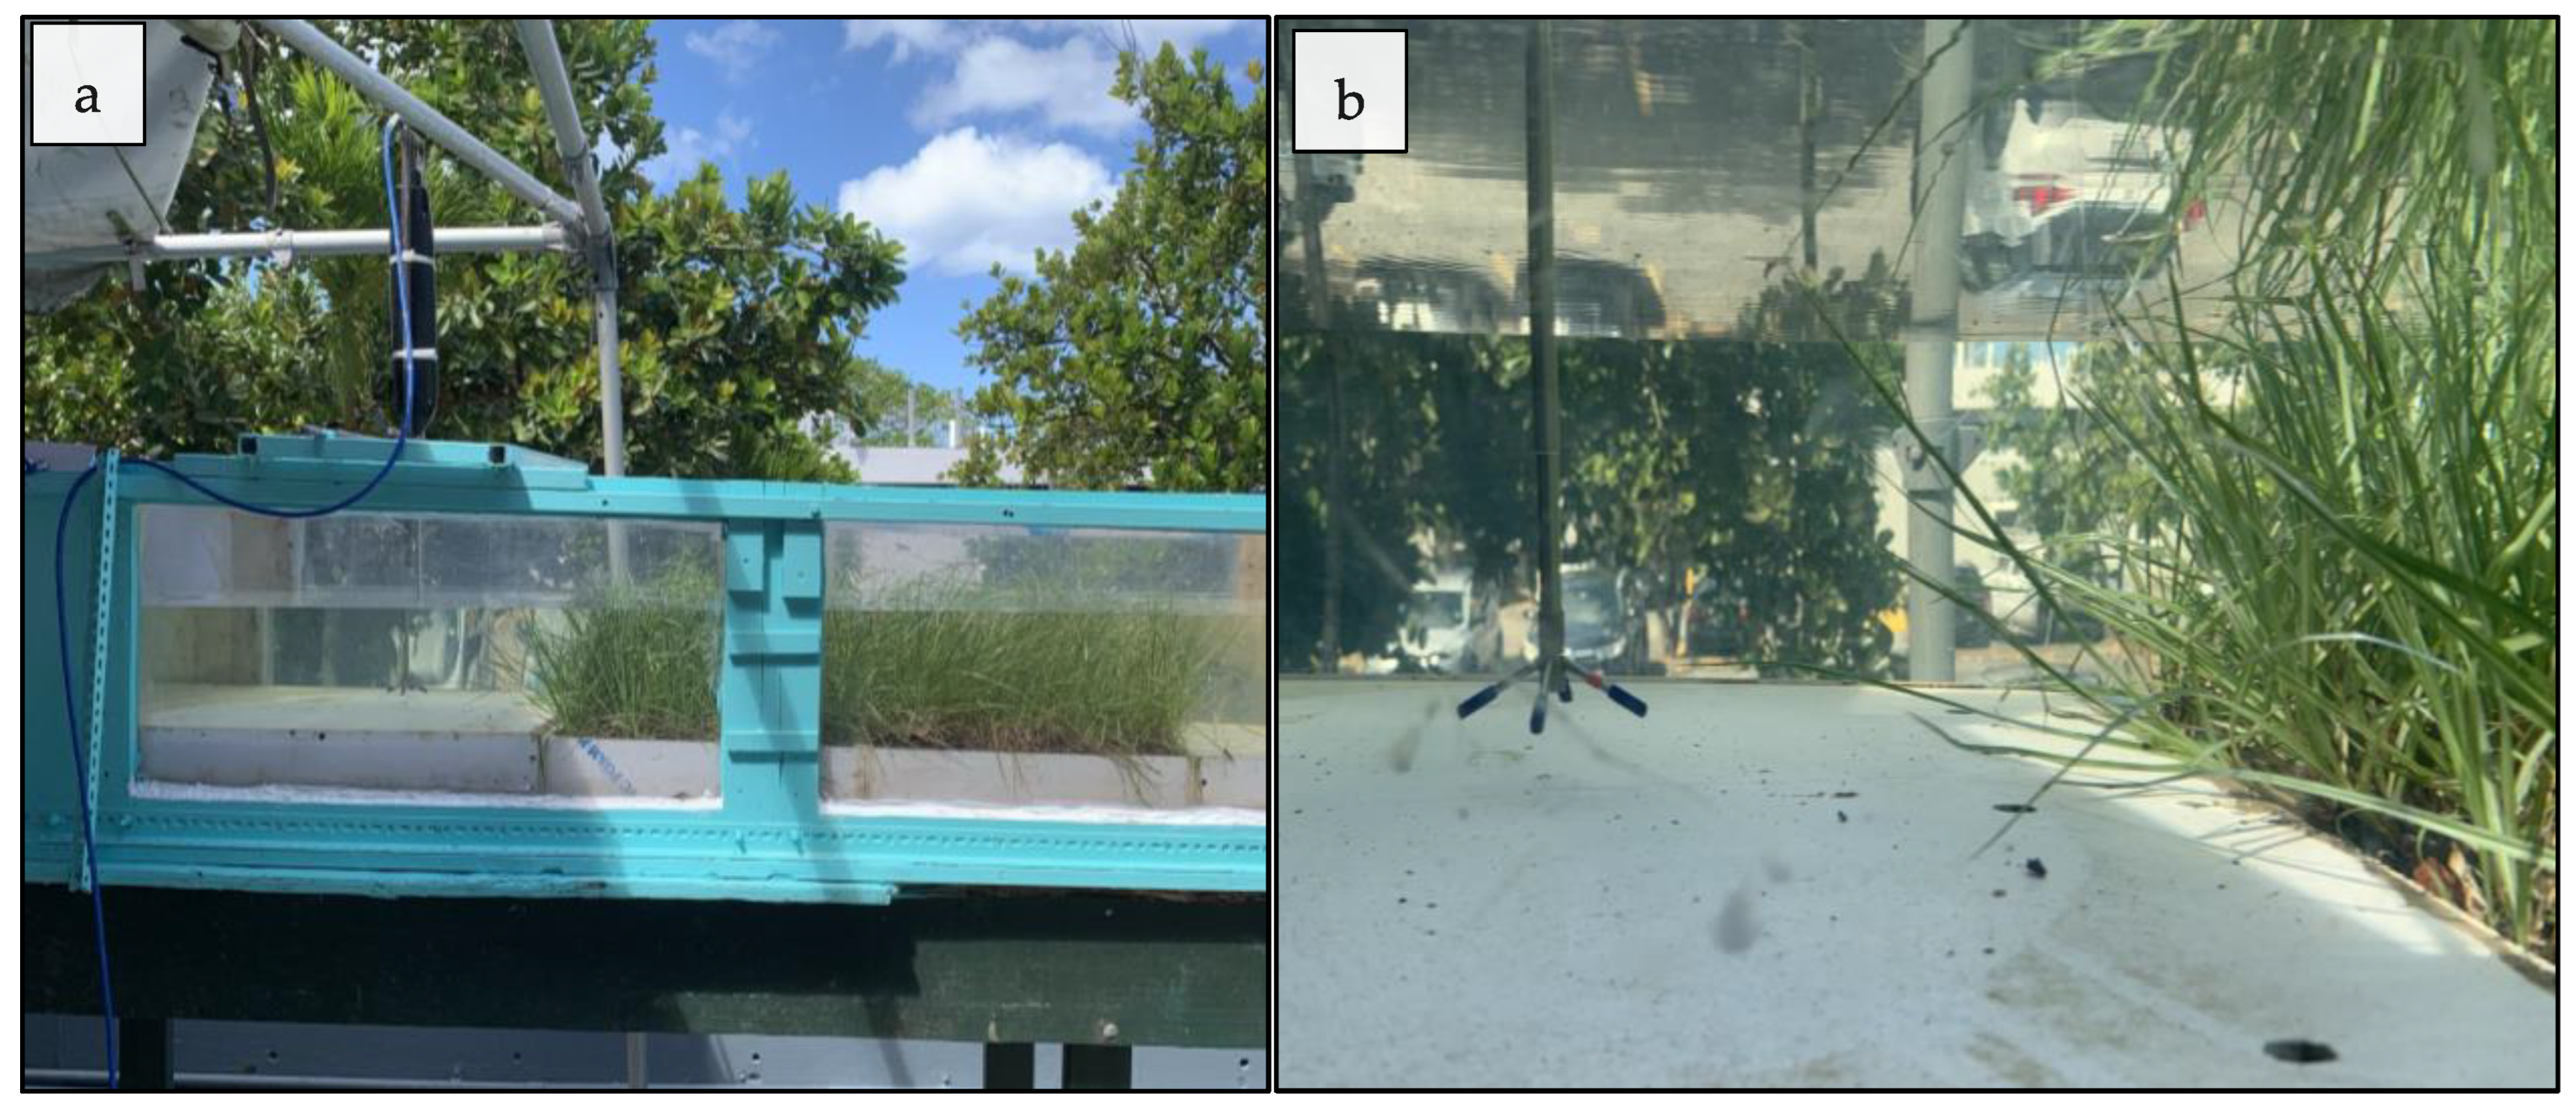
Velocity profiles across the measurement sections were acquired using an Acoustic Doppler Velocimeter (ADV). A control valve at the flume entrance regulated the discharge. The weir height regulated the water depth at the downstream end of the flume.
Figure 3 shows the ADV installed inside the flume and the sensors submerged near the vegetation. The height between the channel bottom and the crest was 0.41 m, 0.36 m, and 0.32 m (16, 14, and 12.5 in), respectively.
2.1.3. Soil Properties
Soil characterization included the grain size distribution and the Atterberg limits. Soil for all species, except Bermuda, was from nearby Hacienda Blanca Margarita in San Germán, Puerto Rico. Bermuda grass grew on a selected soil commercially available. According to the Unified Soil Classification, soils are High Plasticity Silt (MH) and resist shear stress without stability problems; therefore, soil particles did not erode during the experiments, avoiding stability problems.
2.1.4. Grass Species and Density
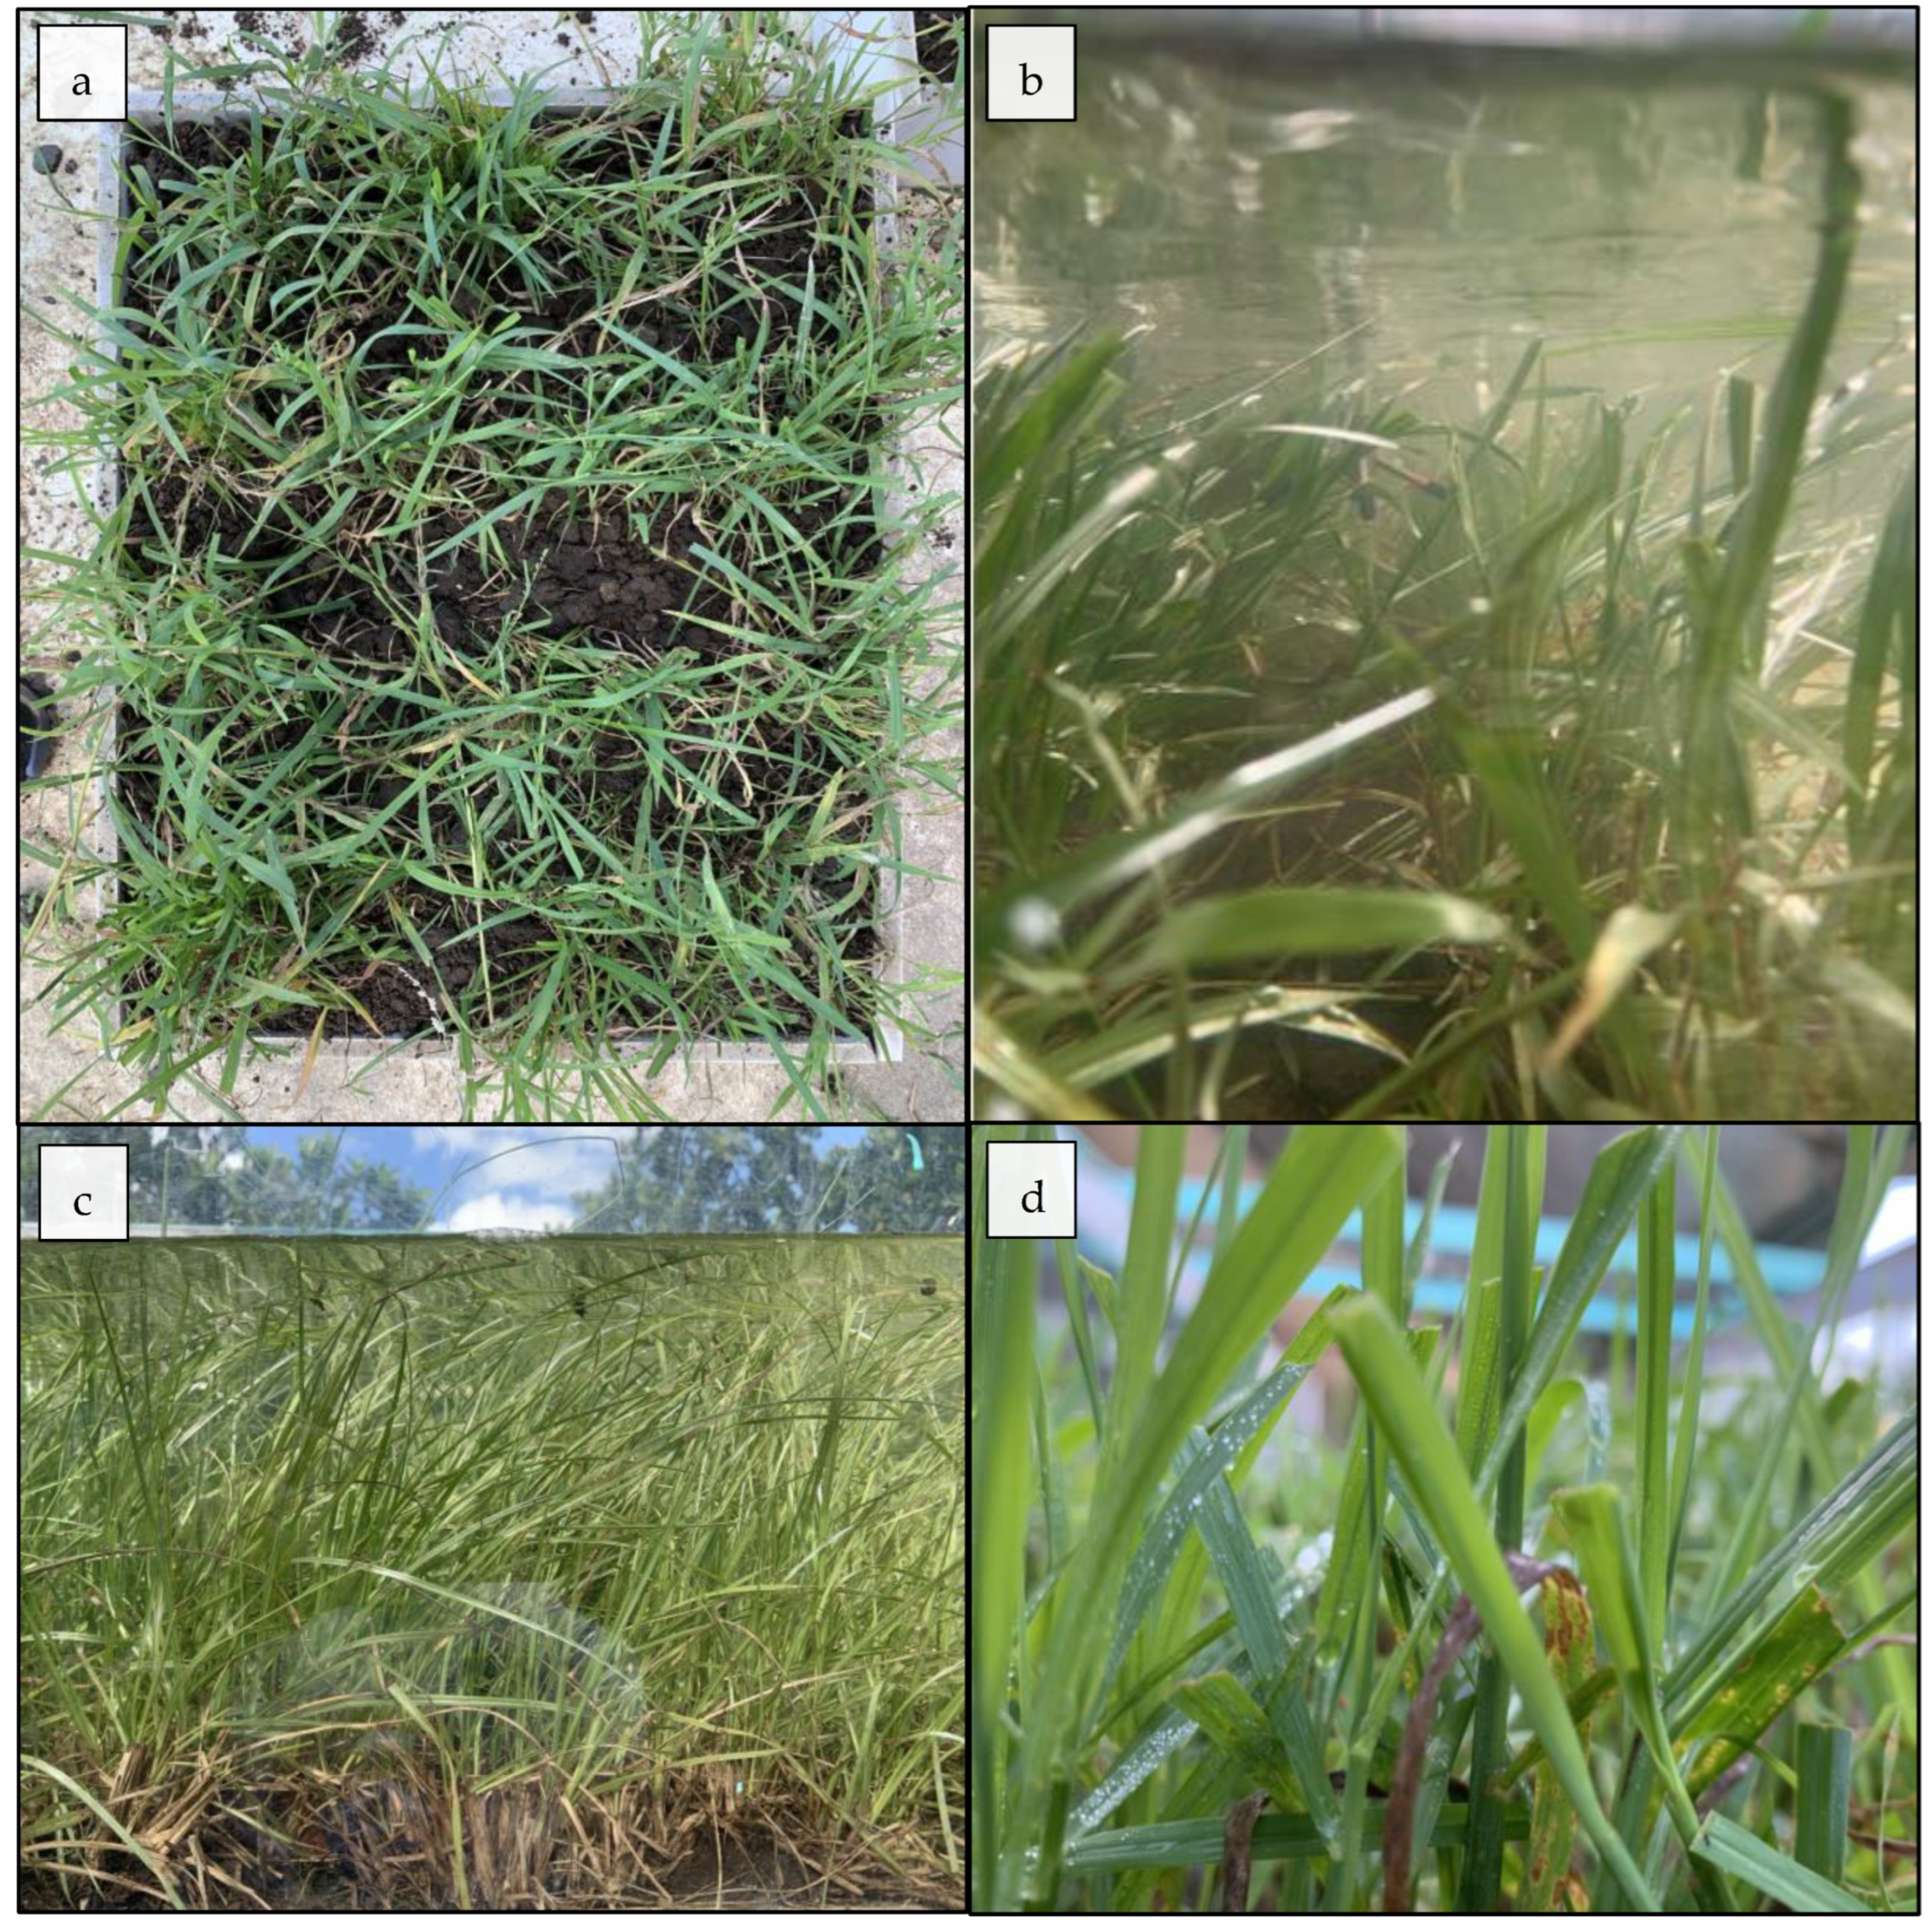
Table 1 describes the 14 experiments performed with fully submerged vegetation. Species height varied between 7.2 cm for Zoysia and 17.5 cm in Bahía. Vegetation cover in the experiments was between 93% and 87%, except for Pangola. This species was difficult to reproduce in trays.
Figure 4 and
Figure 5 show pictures of the grass species during the experimental runs. To the authors’ knowledge, there is no unique procedure to measure the density of vegetative species; however, density is usually associated with the percent of cover. This parameter determines the degree of retardance during the hydraulic classification of vegetative covers. The root and leaf system affect the estimation of density. The percentage cover was estimated by dividing the vegetation area by the tray’s total area. If the grass spreads by underground stems, such as Bermuda, Bahía, and Zoysia, it tends to have a higher percentage of cover.
2.2. Methodology
2.2.1. Experimental Procedure, Data Processing, and Calculations
The methodology required the following five steps:
- (1)
Raw data processing;
- (2)
A nonlinear optimization subroutine to obtain the modified logarithmic profiles that fit the measured data;
- (3)
Integration of the velocity profiles to estimate average velocities above the deflected vegetation height;
- (4)
Computer modeling to obtain the energy grade line;
- (5)
Solutions to Equations (5) and (6) to determine the value of Manning’s roughness coefficients.
Particle velocity values were obtained at depth intervals of 1.27 cm (0.5 inches) at three positions within the samples. Measurements were taken at the centerline of the flume bottom to avoid wall effects at a rate of 25 values per second. At least 4000 instantaneous velocity values at each measurement point were collected. The ADV can measure velocity in three dimensions; however, only the mainstream direction was used. The number of data points for forming the velocity profiles varies with the vegetation height and type. Each experiment consisted of measurements in three locations: upstream of the vegetation sample, at 0.30 m (1.0 ft) downstream of the beginning of the vegetation trays, and at 0.76 m (2.5 ft) upstream from the start. Sometimes the location moved a short distance to avoid excessive obstructions from the live vegetation during the experiments. Between 6 and 10 measurement positions describe the velocity profile. The deflected plant height was measured during the experiments. The channel walls limited the discharge capacity to avoid overflowing.
2.2.2. Chauvenet’s Criterion to Eliminate Dubious Data
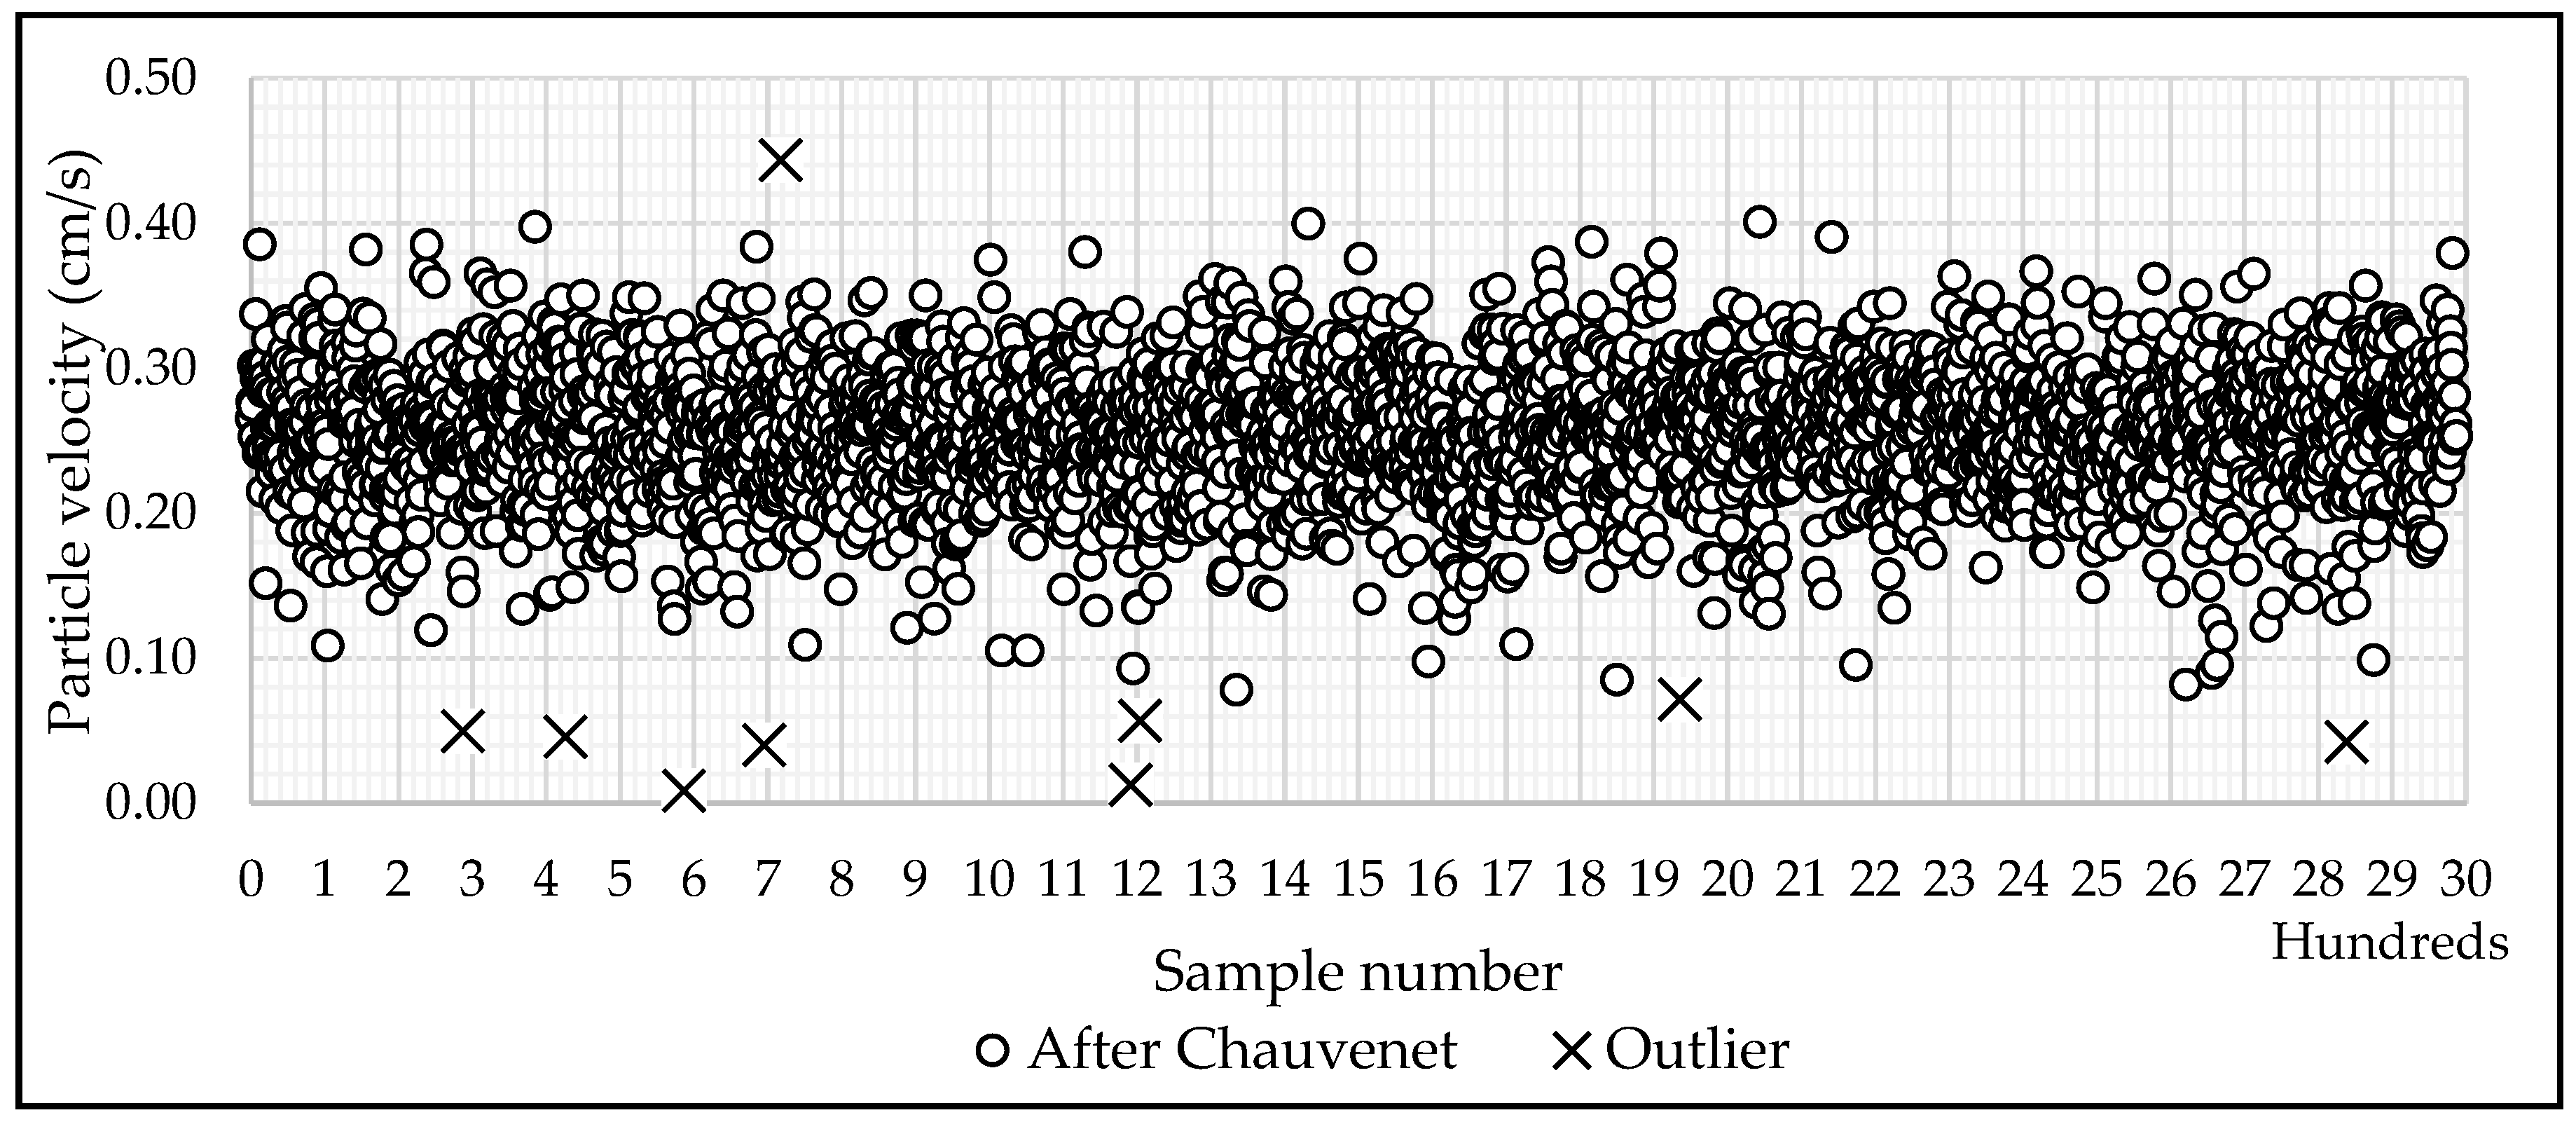
Instantaneous velocity measurement presents outlier values due to the dynamic nature of live vegetation and turbulent eddies inside the dense submerged plants. The Chauvenet test enables the detection of data on the extreme sides (values too high or too low) and eliminates values that might be affected beyond the expected range.
Figure 6 shows a sample of 3000 data points obtained during one experiment before and after applying the Chauvenet test. Values outside the horizontal lines indicated with an x are outliers. The non-parametric test only depends on the sample size and the standard deviation [
30]. All the instantaneous velocity series obtained in the experiments were subject to the test.
2.2.3. Velocity Profiles
Once the extreme data values were eliminated using Chauvenet’s criterion, the mean value of particle velocities at each measurement point was used to obtain an average velocity profile at three different sites along the experimental sample.
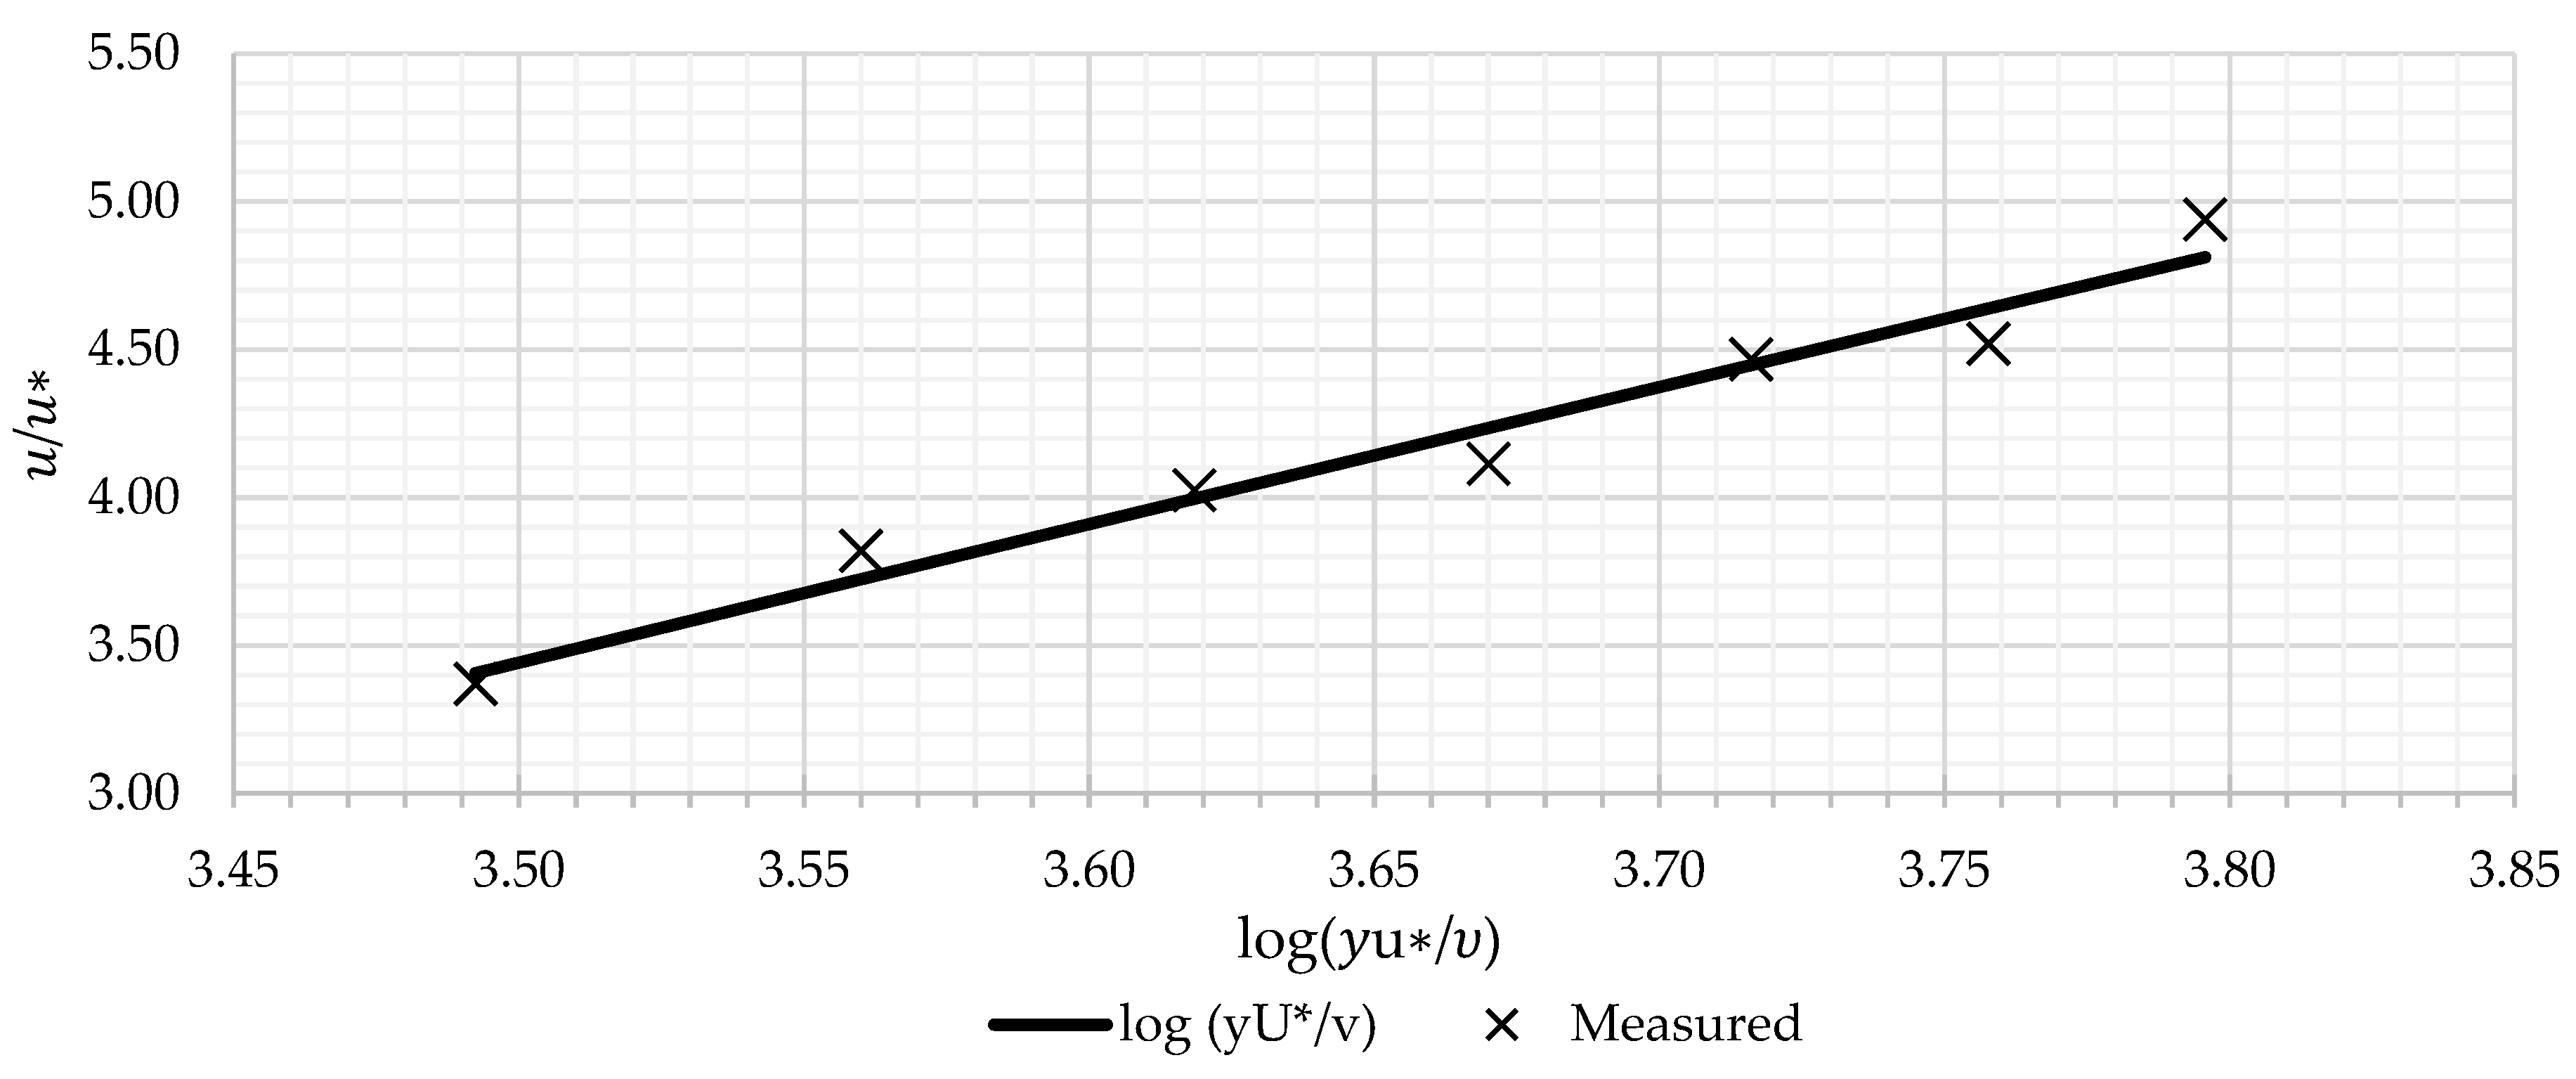
Figure 7 shows the velocity profile corresponding to the flow upstream of the vegetation. The data points fit a logarithmic velocity profile on a fully rough surface with a nondimensional roughness parameter
[
31].
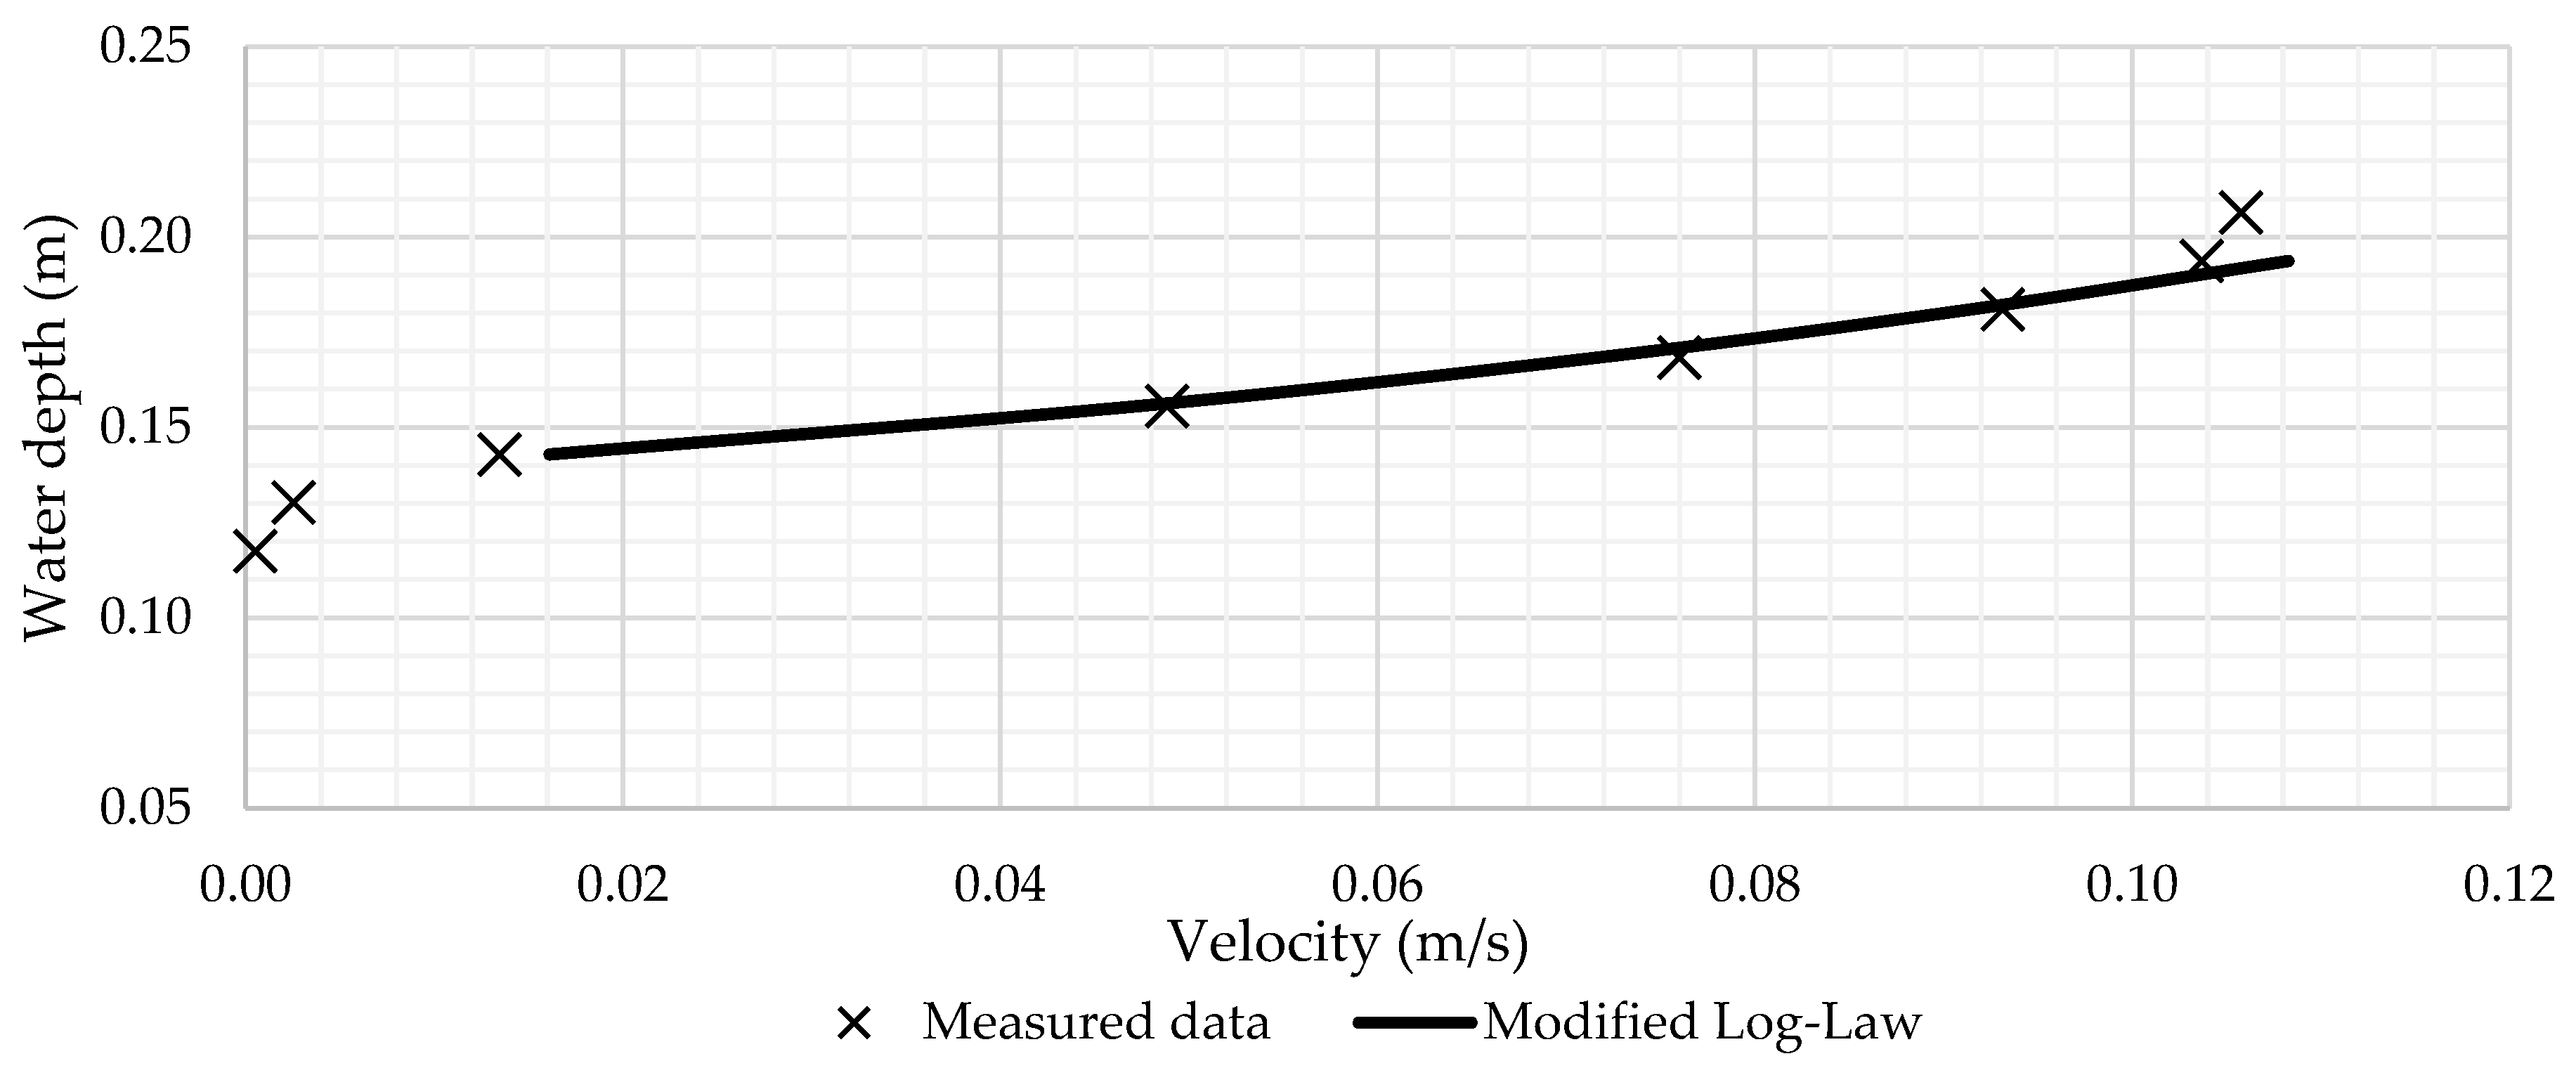
The velocity profile over deflected vegetation comprises two parts, a minimal velocity below the deflected plant and a modified logarithmic profile above this height. This has been observed by other researchers also (Christensen [
29]; Stephan and Gutknecht [
18]; and Temple [
32]). These profiles fit the modified log law presented in Equation (2). The sum of squared differences between the measured particle velocity and the modified logarithmic law velocities from Equation (2) was used as an objective function and minimized using the Generalized Reduced Gradient (GRG) optimization method [
33]. The shear velocity 𝑢
∗ and the equivalent sand roughness 𝑘
𝑠 in Equation (2) were the optimization variables.
Figure 8 presents a typical velocity profile. Notice that the profile starts close to the top of the deflected vegetation and not from the channel bottom. The height between the channel bottom and the deflected vegetation has negligible velocity. The line represents the fitted logarithmic velocity profile. Similar computations were performed for all experimental runs.
2.2.4. Computation of Energy Grade Line Slope and Manning’s Roughness Coefficient
The channel had a supercritical uniform flow. In all cases, the weir height created an S1 backwater curve, which required a gradually varied flow water surface calculation. The slope of the energy grade line was obtained by calibrating a hydraulic model created in HEC-RAS [
34] with the water surface elevations measured during the experiments. A value of Manning’s coefficient,
n= 0.011, was assumed for the channel reach without vegetation [
10]. Manning’s coefficient over vegetation was found iteratively using the HEC-RAS model and Equation (6). This equation results from substituting Equation (4) into Equation (5)
An estimated value of Manning’s coefficient for the grass sample was introduced in the portion of the channel corresponding to the vegetation bed in the HEC-RAS model. The model provided a value of the slope of the energy grade line Sf at those locations. The shear stress and the average velocity were obtained from the velocity profile analysis, and a new value of n was computed using Equation (6). The new value was introduced in HEC-RAS to get an improved value of the energy grade line. The procedure was repeated until n and 𝑆𝑓 did not change in two consecutive iterations. In most cases, the method converged in four iterations.
4. Discussion
The results show that the modified log law proposed by Christensen [
29] described the velocity profile above the deflected vegetation. This profile raises the zero plane of Prandtl-von Karman’s classic profile (Equation (1)), as Stephan and Gutknecht found [
18]. As Yen suggested, the modified log law fitted to the measured data allowed us to obtain the shear velocity and shear stress near the deflected vegetation’s surface [
27]. Yen also suggests that, under low submergence, the shear stress on vegetative channels could be obtained directly using the velocity profile. The nonlinear optimization method using the minimum sum of squares as an objective function proved efficient in determining the parameters for the modified log law. The roughness Reynolds number obtained with Nikuradse’s equivalent sand roughness varies between 15,593 and 89,093, indicating higher values than usually found in pipes. Stephan and Gutknecht [
18] suggested that the equivalent roughness correlates with deflected plant height. These authors experimented on macrophytes, which are longer and highly flexible aquatic species. The experiments with grass species and shallow water indicate that equivalent sand roughness is independent of deflected height. A relatively constant value of 0.96 m was obtained as equivalent sand roughness from all experiments when deflected plant heights were between 0.08 m and 0.14 m. The results show that, for vegetation roughness, the equivalent sand roughness proposed in Christensen’s modified log law for fully rough surfaces should be considered a calibration parameter instead of having a definite physical meaning, at least for the range of experiments performed. Values are usually high compared to other rigid, non-vegetated surfaces.
The iterative procedure using a calibrated numerical model and Equation (6) to match the energy slope and Manning’s roughness coefficient allowed us to use the flume under the influence of a gradually varied flow. This fact is important because this situation is normal for flume experiments, even though this is not mentioned in technical publications. A discrepancy exists when using a uniform flow analysis such as the one used to derive Equation (4) and the gradually varied flow approximation; however, the error is minimal [
6]. The interval of Manning’s coefficients obtained in the experiments is between 0.115 and 0.282, representing a small but as-expected interval for a small hydraulic radius. The channel dimensions and shallow water depth above the deflected vegetation produced a small hydraulic radius and low average flow velocities compared to actual-size waterways. Interestingly, Stephan and Gutknecht [
18] pointed to the need for experimental data in the range of these experiments.
Considering that the experiments used shallow water depths, the results were within the limit of
n values for channel and overland flow. Overland flow values were higher than those for open-channel flow. Values of Manning’s coefficients for grass in overland flow varied between 0.15 and 0.24 [
35], which are very similar to those obtained in the experiments. Therefore, they are also valid for this purpose.
Manning’s
n values were also compared with retardance curves developed by USDA-NRCS as proposed by HEC-15 [
36]. Retardance curves for SI units are approximated by Equation (7) [
5]:
where
R is the hydraulic radius in the vegetated channel cross-section in meters,
Sf is the slope of the energy grade line above the vegetation, and 𝑎
𝑜 is a constant equal to 40.0 for a degree of retardance D and 42.7 for a degree of retardance E. The experimental values correspond to those obtained with Equation (7) for retardances E and D. Other retardance is impossible for the available results. Vegetative retardance was assigned using the observed value closest to the value obtained from Equation (7) based on the minimum difference between the computed value and the value obtained from the experimental data. Only one reliable result was obtained for Pangola grass. The height used for this species was 0.127 m. This value is smaller than those published previously [
2]. The results indicate that short Pangola should have a degree of retardance D. The experiments validate the values published by USDA-NRCS in the Puerto Rico Erosion and Sediment Control Handbook for Developing Areas [
2] for Bermuda, Zoysia, and Bahia grasses.
Table 3 summarizes the results.
Three experiments were not successful in providing reliable data. The stage of growth of Pangola was too tall for the experimental facility, and the rigidity of its sheath altered the particle velocities. The small flow velocities and shallow depth above the plant height did not allow reliable measurements with the ADV. Measurements were affected by wakes generated by the vegetation, producing inconsistent results. A similar situation occurred with the one experiment with Bermuda grass.
5. Conclusions
This research developed a method to validate Manning’s roughness coefficient and determine the retardance index using three Caribbean Area grass species, namely Zoysia, Pangola, and Bahia. Bermuda grass uses local soils with seeds imported from the USA.
A new procedure to determine Manning’s coefficient on submerged vegetation was developed using hydrodynamic and mechanical vegetation characteristics. The experimental data confirmed the application of the modified universal log law when estimating velocity profiles and shear stresses on the submerged vegetative lining. The procedure allowed the assignment of a degree of retardance to the species used in the experiments. The results show that retardance degrees published in the Puerto Rico Erosion and Sedimentation Control Handbook for Developing Areas apply to the species tested in this project. A new retardance degree for Pangola grass is recommended when the plant height is less than 0.15 m. The experimental values for Manning’s coefficient are recommended for use also in overland flow conditions. There is a need for resistance relations for shallow and very high flows over vegetative waterways. Experimental verification of vegetative retardance in tall, partially submerged vegetation using real flexible species is necessary, particularly for grass species in the Caribbean region. The study of hydraulic resistance for vegetation types in tropical and coastal climates is beginning. Further experiments with different plant species and at other degrees of submergence and density are recommended.
