Abstract
The proper management of soil, in order to improve ecosystem services, requires knowledge of how different fractions of carbon respond to land use/land cover changes. This study aimed to evaluate the responses of total soil organic carbon, and its fractions, to reforestation age and land use changes in an Ultisol in the Posses catchment, a pilot area of the Brazilian program of Payment for Environmental Services, located in Southeastern Brazil. The study was conducted using field plots with various treatments, including native forest, old and young reforestation, well-managed pasture, subsistence farming, degraded pasture, and bare soil. Results showed that soil organic carbon increased with reforestation age and that original soil carbon stocks were restored after eight years of reforestation. Short-time pasture management increased the carbon pool by 10% compared to degraded pasture. The Carbon Management Index (CMI) was able to distinguish the effects of converting degraded pasture to either subsistence farming or bare soil. The CMI is a useful tool for determining the effects of land use/land cover changes, reforestation age, and native forest preservation on soil quality. Adequate management of soil fertilization is an immediate option for restoring the quality of Ultisols under degraded pastures in the Posses sub-basin.
1. Introduction
There is valid concern about the impact of changes in land conditions on soil-provided ecosystem services. Maintaining soil organic carbon (SOC) is crucial for ensuring soil, water, and food security, as it plays a major role in regulating climate, water storage, water supply, and biological activities [1,2]. Despite this, SOC has been significantly impacted by land-use changes, such as agriculture replacing native vegetation and intensifying soil management [3,4,5]. Although several studies have focused on the effects of reforestation on SOC in tropical regions, there is a need to study the specificities of each tropical ecosystem and land use scenario [6,7,8,9] to understand the dynamics of different organic C fractions in soils as affected by land-use changes and reforestation age.
Land-use management is a crucial factor in soil C dynamics, particularly deforestation and conversion of native forests to croplands or grasslands, and conversion of pastures to croplands, which often results in a decline in SOC stocks. On the other hand, conversion to pasture and better pasture management have been proposed as effective ways to store atmospheric C in soils [2,4,9,10,11,12,13]. According to Araújo et al. [14], conversion of forests to pastures affects soil chemical and physical properties, increases greenhouse gas emissions from forest burning, and alters C pool and fraction distribution in the soil. Studies have shown that the conversion of native vegetation to agricultural land typically results in a 20–45% average loss of SOC in the top 0.30 m of soil [15,16,17].
According to Wei et al. [16], the largest decrease in SOC stocks occurs in temperate regions (52%), followed by tropical regions (41%) and boreal regions (31%). In Brazil, Cherubin et al. [4] found a decrease of 40% in natural SOC after conversion of tropical rainforest to cropland. However, soil cultivation does not always lead to strong declines in SOC, as practices such as no-tillage, agroforestry, organic agriculture, and well-managed pastures have been successful in maintaining or increasing organic C in soils [2,5,17,18,19,20,21,22,23]. Furthermore, reforestation of degraded lands tends to restore SOC values in soils under native vegetation [12,24,25,26].
Soil organic carbon (SOC) is the most complex and least understood component of soils [27]. To study C dynamics in response to land use changes, Cambardella and Elliott [28] proposed dividing SOC into two fractions with distinct residence times. The more recalcitrant fraction, non-labile C (C from soil organic matter < 53 μm in size), constitutes the majority of SOC and is less affected by land use. A labile C fraction, on the other hand, cycles faster in the soil and is more sensitive to soil management practices and recent land use changes [2,5,29,30,31]. To assess soil quality and changes in response to land use, the Carbon Management Index (CMI) has been widely adopted globally, incorporating both total SOC and its lability [32]. This is especially relevant for the Brazilian Atlantic rainforest, an important national biome that has seen a drastic reduction in native forest cover to less than 8% of its original area over the past 500 years [33].
The growing need for carbon sequestration has led to increased efforts to monitor the effects of land use changes on soil organic carbon (SOC) dynamics [34]. This need is particularly pressing in tropical forests—such as the Brazilian rainforest—which not only sequester large amounts of atmospheric carbon [35], but also store about 30% of the world’s carbon in their soils, which is more than in the atmosphere [36,37].
To encourage the adoption of conservation practices, incentive programs have emerged globally. One such program is the Low Carbon Emission Program—ABC Program, part of Federal Law No. 12,187 [38], decreed by the Brazilian government, to encourage the adoption of agricultural best practices, such as the recovery of degraded pastures and reforestation, to reduce carbon emissions from agriculture. Another example is Payment for Environmental Services (PES), a pioneering Brazilian program that is still being evaluated in terms of its effectiveness in promoting ecosystem functions [39,40].
The CMI has great potential to be used in the calculation of financial subsidies—currently, the amount paid for ecosystem services is determined without technical-scientific criteria—and as a tool for monitoring the effects of land use changes on soil quality and the improvements offered by the adoption of PES [41,42]. Despite the presence of the PES program in Brazil, and the increasing need for carbon sequestration, there have been few studies that evaluate the use of the Carbon Management Index (CMI) as a response to changes in land use in the region. There is a knowledge gap in how these changes in land use affect the soil’s capacity to store carbon and provide ecosystem services, and this study aims to fill that gap by analyzing the changes in soil organic carbon over time in response to these changes. The focus is on the replacement of degraded pasture with reforestation and understanding the impact of these practices on soil quality and the capacity of the soil to provide ecosystem services. Thus, the hypothesis being tested is that short and mid-term reforestation and the replacement of degraded pasture can lead to an increase in soil organic carbon levels and ecosystem functions.
Overall, the main objective of this study is to assess the impact of land use changes, specifically reforestation and the replacement of degraded pasture, on the dynamics of total soil carbon and its fractions in a pilot sub-basin of the Payment for Environmental Services (PES) program in Brazil.
2. Materials and Methods
2.1. Study Area
The study was conducted in the southeastern section of the Posses sub-basin, located between latitudes 22°53′38″ S to 22°49′53″ S and longitudes 46°15′45″ W to 46°13′28″ W in the State of Minas Gerais, Brazil (Figure 1). This sub-basin has a catchment area of 1250 ha, with altitude values ranging from 947 m to 1456 m. The climate of this region is classified as Humid subtropical, with dry winter and temperate summer (Cwb) according to Köppen classification, with an average annual air temperature of 16 °C and average annual rainfall of 1450 mm [43]. This sub-basin is tributary of the Jaguari River and is associated with the Greater São Paulo Water Conservation project [44,45], as the Jaguari River is the main source of water for about 10 million inhabitants of the São Paulo metropolitan area [44]. Furthermore, this study area has also served as testbed for the implementation and assessment of a municipal initiative in Payments for Environmental Services [39].
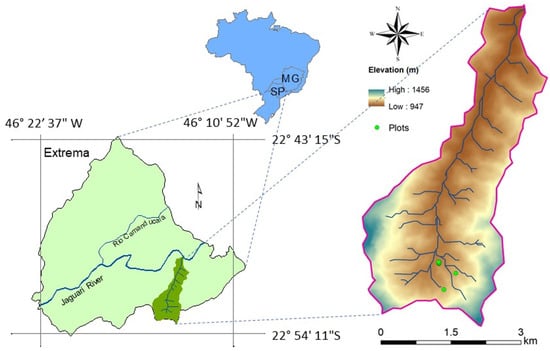
Figure 1.
Map of the Posses sub-basin, a study area involved in the Greater São Paulo Water Conservation project and the Brazilian program of Payment for Environmental Services. It is located in the Municipality of Extrema, Minas Gerais, Brazil.
The dominant soil orders in the Possess sub-basin are Ultisols, Entisols, and Oxisols [46]; however, most soils are Typic Rhodudult [47]. Before implementation of the Greater São Paulo Water Conservation project, the land use/land cover of the Possess sub-basin was mainly pasture (Figure 2) [48,49,50,51], and it has slowly become more diverse by including reserved areas for conservation purposes [39].
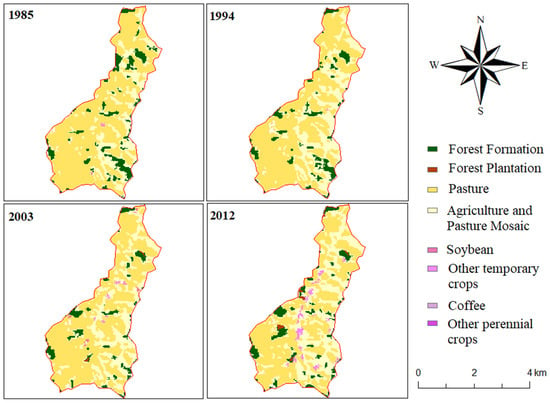
Figure 2.
Evolution of the Land Use/Land Cover (LULC) of the Posses sub-basin using data provided by the MapBiomas project based on LANDSAT at a 30-m spatial resolution, built into a representative one-year mosaic.
2.2. Land Use/Land Cover Treatments
This study is part of a long-term experiment conducted in 96 m2 field plots located in the southeastern region of the Possess sub-basin to assess the effects of LULC changes on various soil parameters. A brief description of LULC treatments and the associated management practices for each field plot is given in Table 1.

Table 1.
Description of Land Use/Land Cover (LULC) treatments and associated management practices.
Most of the LULC experimental field plots were located near each other (Figure 3), except for the reference area of native forest and the old reforested area, which were located within 500 m of the other plots and in similar landscape positions.
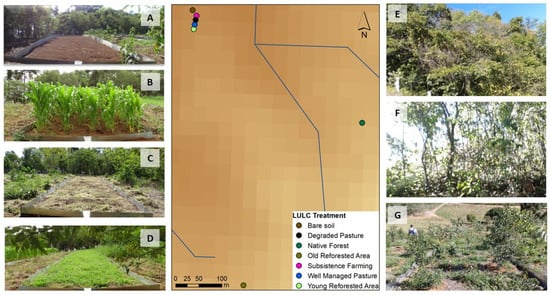
Figure 3.
Localization of experimental field plots within the Posses sub-basin. Ground-level photographs show the following Land Use/Land Cover treatments: bare soil (A), subsistence farming (B), degraded pasture (C), well-managed pasture (D), native forest (E), old reforestation (F), and young reforestation (G).
2.3. Sampling and Laboratory Analyses
Soil sampling was performed in November 2014 to characterize the soil at three locations within each experimental plot at depths 0–0.05 m, 0.05–0.10 m, 0.10–0.20 m, and 0.20–0.30 m (Figure 4). Undisturbed samples were taken, using rings (0.067 m in diameter and 0.081 m in height), to measure bulk density (Table 2) according to Blake and Hartge [52]. Particle size distribution was measured using the hydrometer method in composite samples for each plot (Table 3). Soils within the experimental plots were classified as Ultisols, although occurrence of minor inclusions of Entisols were expected in regions of the LULC with treatments: (a) Native Forest, and (b) Old Reforested Area [47]. A summary of the methods involved in this work are presented in Figure 5.
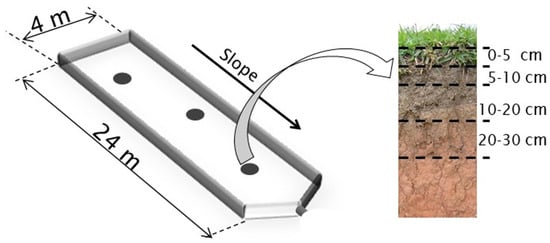
Figure 4.
Schematic of a 96 m2 experimental field plot in the Posses sub-basin showing an approximation of the sampling points. Soil samples were collected at depths 0–0.05 m, 0.05–0.10 m, 0.10–0.20 m, and 0.20–0.30 m for soil characterization (November 2014), and C content measurements (April 2016).

Table 2.
Bulk density values for each Land Use/Land Cover treatment at depths 0–0.10 m, 0.10–0.20 m, and 0.20–0.30 m.

Table 3.
Soil texture data for each Land Use/Land Cover treatment at depths 0–0.05 m, 0.10 m, 0.10–0.20 m, and 0.20–0.30 m.
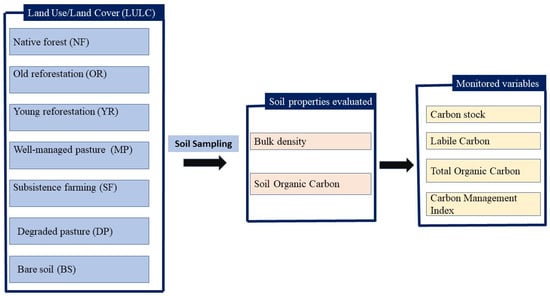
Figure 5.
Flowchart summarizing the methodology used in this study.
Soil sampling for C content measurements occurred in April 2016. Three composite samples per LULC treatment were collected at depths 0–0.05 m, 0.05–0.10 m, 0.10–0.20 m, and 0.20–0.30 m (Figure 4). The soil samples were air dried, mixed, and sieved through a 2 mm mesh. The total organic C (TOC) was determined by wet oxidation methodology [53]. To compare treatments, C stocked in 0–0.30 m was computed as the weighed sum of C stocked in each of the four sampled soil depths. Bulk density (Bd) values were used to convert C contents to mass per soil area within each soil depth (Equation (1)). Due to the size of the volumetric rings used to measure Bd (Table 2), the corresponding value of Bd at depth 0.0–0.10 m was used to compute C stocks at depths 0–0.05 m and 0.05–0.10.
Labile C (LC) contents were determined using 50 g soil samples (<2 mm). Each sample was dispersed with 200 mL of 0.1 mol L−1 NaOH and shaken for 16 h. The soil suspension was poured over a 53 μm mesh under a flow of distilled water to ensure separation. All material retained in the 53 μm mesh was considered particulate organic matter [28]. Samples were oven-dried at 60 °C and the amount of soil organic carbon, assumed to be LC, was quantified by wet oxidation method [53]. TOC and LC contents of each LULC treatment were used to compute the C Management Index (CMI), using either NF or DP as reference treatments (Equation (2)), C Pool Index (CPI) (Equation (3)), the Lability Index (LI) (Equation (4)), and the C Lability (L) (Equation (5)) [32]:
where:
2.4. Statistical Analysis
The statistical analyses were performed considering a completely randomized design. Treatment effects, within each soil depth, were analyzed using analysis of variance (ANOVA), and mean comparisons consisted of the Scott-Knott test (p < 0.05), using the R environment [54].
3. Results and Discussion
3.1. Effects of Reforestation Age and Land Use Changes on Total Soil Organic Carbon
The results showed a general trend of decreasing total organic C (TOC) content with soil depth. This trend is in accordance with what other authors have reported [23,24,55]. The TOC contents in the OR treatment did not significantly differ from those measured in the NF treatment and were consistently part of the same statistical group (Figure 6). Significant differences in TOC values were, however, computed for other land use/land cover treatments, with BS showing the lowest C accumulation. These results demonstrate that after eight years of reforestation using native vegetation species, it is possible to significantly increase soil organic C contents. These findings are consistent with those of Shao et al. [56], who observed a significant accumulation of TOC across a reforestation chronosequence.
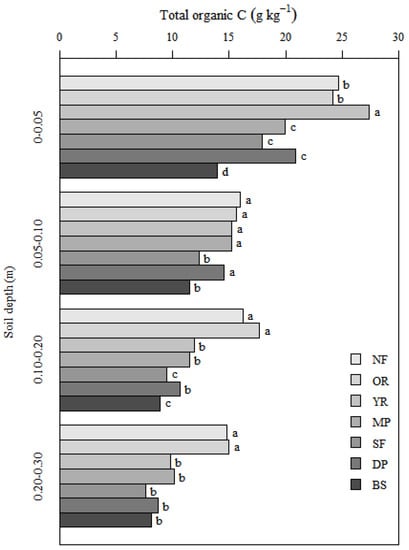
Figure 6.
Total organic carbon (TOC) contents in an Ultisol submitted to different Land Use/Land Cover treatments in the Posses sub-basin, Minas Gerais, Brazil. Different letters depict significant differences among treatments within each soil depth according to the Scott-Knott test (p < 0.05). NF: native forest; OR: old reforestation; YR: young reforestation; MP: well-managed pasture; SF: subsistence farming; DP: degraded pasture; BS: bare soil.
The contents of TOC in the topsoil layer of YR were the greatest. However, at depths below 10 cm, TOC contents were significantly lower than OR and NF (Figure 6). This may have been due to a high production of aerial dry matter, which accumulates at the soil surface and is more susceptible to being incorporated into soil organic matter (SOM). It is important to note that these results also take into account the effect of the biomass added by the remnants of grass desiccated during set-up (Table 1). Given the early stages of tree development, these remnants of grass are likely to be the main source of organic residues. Depending on the quality of this SOM, it can be quickly decomposed—as with materials rich in labile C (discussed in the next section)—and therefore not contribute significantly to increasing soil C stocks (Figure 7). After 2.5 years of reforestation over degraded pasture (i.e., YR treatment), the TOC accumulation was significant in the topsoil layer; however the overall soil C stock was statistically lower than NF and OR (Figure 7). As observed by Primieri et al. [57], soil C contents naturally vary with the amount of organic material deposited in the soil and its rate of decomposition. This leads to significant variations in the biomass deposited on forest soils. In plots where vegetation was already well established, such as NF, biomass deposition tended to be more stable, and soil C increments were less variable over time considering different age of reforestation. Therefore, reforestation of degraded pasture areas can significantly increase TOC contents, after eight years, even at depths ≥ 0.10 m, and consequently the C stocks. These results support both hypotheses that continuous deposition of organic inputs increases soil organic carbon [3], and that below-ground roots contribute to the accumulation of carbon in soil, especially in deeper layers [58,59]. Roots typically have a higher conversion rate of carbon added to the soil organic pool compared to above-ground biomass [60,61], and thus are considered the main source of organic matter input into the deepest soil layers [62].
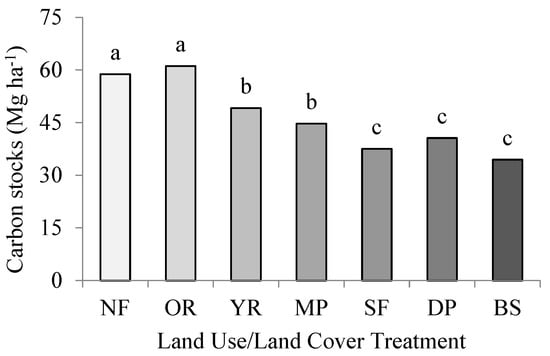
Figure 7.
Soil C stocks in a 0.0 to 0.3 m Ultisol profile submitted to different Land Use/Land Cover treatments in the Posses sub-basin, Minas Gerais, Brazil. Different letters depict significant differences among treatments according to the Scott-Knott test (p < 0.05). NF: native forest; OR: old reforestation; YR: young reforestation; MP: well-managed pasture; SF: subsistence farming; DP: degraded pasture; BS: bare soil.
C stocks in the top 0.30 m of the soil profile were 51 Mg ha−1 and 61 Mg ha−1 for treatments YR and OR, respectively (Figure 7). These values represent 21% and 51% greater C stocked as compared to the degraded pasture (DP) treatment, over which the reforestations were established 2.5 years and 8 years, respectively, before C contents measurements occurred. The increases of C stocks in YR (4.3 Mg ha−1 yr−1) and OR (2.6 Mg ha−1 yr−1) were higher than those reported by Mello et al. [63], who recorded values ranging from 0 to 1.63 Mg ha−1 yr−1 of C accumulated within the top 0.20 m of the soil in studies conducted in the same Brazilian biome (i.e., Atlantic Forest). Thus, results showed that a new stage of C equilibrium –within the top 0.30 m of the soil profile– can be achieved after 8 years of reforestation of degraded soils utilizing native forest species.
Moreover, differences in TOC contents among degraded (DP) and well-managed (MP) pasture treatments were not observed at any soil depth, while they were significantly lower than NF except for depth 0.05–0.10 m (Figure 6). This can be a result of the removal of biomass by grazing (MP) and burning (DP), as described in Table 1. Removal of biomass can drastically decrease the amount of C to be incorporated as soil organic matter [64,65]. These results are consistent with the findings of Souza et al. [66], who reported large losses of C (about 33 Mg ha−1 yr−1) due to intensive grazing. Conversely, high TOC contents measured at 0.05–0.10 m (MP and DP statistically equal to NF) can be associated to the abundant and aggressive radicular systems of grasses. Grass root residues may become mineralized as soil organic carbon physically protected inside stable aggregates [31,67], since these treatments were not plowed. Furthermore, C stocks in MP (0–0.3 m) were higher than in DP (Figure 7), associated to a C storage rate of 2.1 Mg ha−1 yr−1 for MP (10% higher than the measured C storage rate of DP). Therefore, adequate management practices of pasture areas (e.g., mineral fertilization) can promote C storage [3,11,65]. Carvalho et al. [18] found similar C sequestration rates of 2.7 Mg ha−1 yr−1 in soils under degraded pastures converted to well-managed pasture within the Atlantic Forest biome, and 2.7 to 6.0 Mg ha−1 yr−1 in soils under well-managed pasture systems within the Amazon Forest biome.
Regarding the conversion of DP to either SF or BS, there were significant differences in TOC contents among treatments in depths 0.05–0.20 m (SF < DP) and 0–0.20 m (BS < DP). These results confirm that the conversion of pastures, even degraded ones, to cropland leads to a decrease in TOC. Although incorporation of plant residues in soil after harvest was performed in SF, TOC content within the topsoil layer (Figure 6), and C stocks (Figure 7) were significantly lower than other treatments, except for DP and BS.
Considering that approximately 936 ha (78%) of the Posses sub-basin is under a LULC of degraded pasture, achievement of the objectives of the ABC Program [38] and the Brazilian PES [39,40] program is subject to the recovery of soil ecosystem functions under degraded pastures. If adequate management practices of grazing areas occurred (i.e., conversion from DP to MP), C stock rates of 1966 Mg yr−1 in this sub-basin could be expected. Well-managed pasture areas can store even more C in soils than areas under native forest [68,69], providing additional benefits associated with improved ecosystem functions (e.g., soil and water quality), and consequently reducing greenhouse gas emissions [3]. Thus, adequate fertilization of DP areas can be an immediate option for recovering ecosystem functions, as soils under conservationist management can promote high C sequestration rates in a short period [18]. However, we must stress the importance of restoring and maintaining native vegetation areas. Overall, these LULC treatments (OR and NF) presented the highest C stocks in an Ultisol at the Posses sub-basin (Figure 7).
Based on an ecosystem services approach and considering that Ultisols at the Posses sub-basin are highly suitable for grasslands [70], our results regarding the potential for C sequestration in each system can serve as reference values for calculating payments for environmental services (i.e., C storage is directly related to concomitant soil ecosystem services). The valuation strategy could consider plant growth rate, plant height, number of plants per area, or any other relevant factors that various stakeholders consider useful for the decision-making and planning processes.
3.2. Effects of Reforestation Age and LULC Changes on Soil Carbon Quality
The quality of soil organic matter (SOM) can be associated with the portion of readily available carbon for microorganisms to decompose, i.e., labile carbon (LC). Results of LC contents across different LULC treatments are presented in Table 4. LC proved to be more effective in distinguishing the LULC treatments than TOC contents and C stocks. This outcome aligns well with earlier research that highlights the high sensitivity of LC to changes in LULC, even over a short period of time [30,71]. Thus, the results of this study lend further support to the notion that LC is a valuable indicator of soil quality and may be a useful tool for evaluating the impact of LULC changes on soil health.

Table 4.
Labile carbon (LC) contents at different depths in an Ultisol submitted to different Land Use/Land Cover (LULC) treatments in the Posses sub-basin, Minas Gerais, Brazil.
Ecosystem functions associated to C flows within the water-soil-plant system (e.g., biological activity, water and nutrient availability, aggregate structure and stability) require an adequate amount of soil LC to ensure provision of various soil ecosystem services. LC contents at different soil depths of treatment of NF is probably the best representation of an adequate amount of LC (Table 4). In sequence, LC contents of treatments OR, YR, MP, DP, SF and BS followed. The worst-case scenario was found under treatment BS which involved plowing and continuous deterioration under subtropic climatic conditions. Our findings were consistent with those reported by Carter et al. [72]. They found that soils under pasture and forest LULC had higher levels of LC as compared to arable soils. The continuous input of above and below-ground biomass and the improvement of soil aggregation that provides physical protection to the SOC from fast decomposition are the primary reasons for these findings [2,23,59,62]. Once organic matter saturates the bonding surfaces of soil mineral colloids, additional C inputs must be stabilized, mainly in the LC fraction [73,74,75,76]. These results indicate a high production of plant residues in treatments NF, OR, and YR, together with a lower rate of decomposition and greater physical protection of the SOC. The presence of higher levels of TOC (Figure 6) and C stocks (Figure 7) in the NF and reforested treatments are likely to be associated to high LC contents as well [55,77].
Since LC is a fast-cycling fraction of organic carbon that responds rapidly to changes in LULC [2,5,30], our results suggest that treatments that accumulated the least of LC were SF and BS, in which almost all soil organic carbon is associated with soil minerals, as measured by the difference between TOC and LC. However, low C stocks (Figure 7) and low biomass yields (as confirmed by the low LC) in DP, SF, and BS indicate that soil under these LULC are in an advanced stage of degradation, particularly in the upper soil layer (Table 4). The lack of SOC replacement via plant residues in DP and BS, as well as soil plowing in SF and BS, can further reduce soil quality over time, making soils more susceptible to external impacts such as water erosion [72].
3.3. CMI Responses to Reforestation Age and LULC Changes
Weighted average values of total organic carbon (TOC) and labile carbon (LC) were computed for the soil profile (0–0.30 m) to calculate C lability (L) (Table 5) and Carbon Management Index (CMI) (Figure 8). C lability results indicated that LULC treatments (NF > YR > OR = MP) in which soil conservation management practices are followed presented high L values (≥0.09). Conversely, degraded soil conditions are associated to the lowest L values (≤0.3) in LULC treatments DP and BS. These findings are consistent with those presented by other studies in which the authors reported that soils under LULC contributed the greatest with vegetative residues to soil organic carbon (SOC) present high L values [55,77]. High L values indicate increased nutrient availability for plant growth and soil microbial activity, leading to improvements in soil aggregation, cation exchange capacity, and soil pore distribution, among other ecosystem functions [75,76,77,78,79]. An intermediary condition was observed under treatment SF. Perhaps the frequency of soil plowing accelerated the decomposition of stored SOC by oxidation after the breaking of soil aggregates, thereby reducing the impact of organic inputs [23].

Table 5.
Total Organic Carbon (TOC), Labile Carbon (LC), and Carbon Lability (L) in a 0–0.3 m Ultisol profile submitted to different Land Use/Land Cover (LULC) treatments in the Posses sub-basin, Minas Gerais, Brazil.
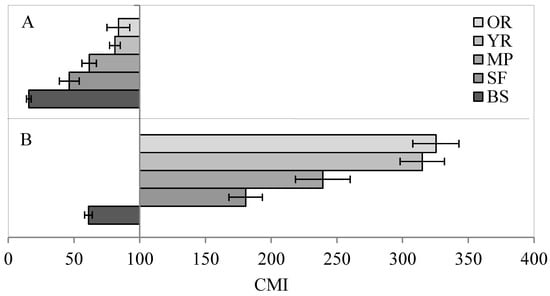
Figure 8.
Carbon Management Index (CMI) from a Southeastern Brazilian Ultisol under different management systems using native forest (A) and degraded pasture (B) as reference treatments. OR: old reforestation; YR: young reforestation; MP: well-managed pasture; SF: subsistence farming; BS: bare soil.
CMI values computed using NF as reference treatment (Figure 8A) may suggest that no positive effects were observed due to LULC treatments, since every CMI value was <100 [32]. Although TOC seemed to be restored within eight years after converting a degraded pasture area into a reforested area with native species (Figure 6), treatment OR failed to achieve the C levels of NF (IMCOR/NF < 100). This emphasizes the importance of promoting the conservation of native forest areas in the sub-basin. Conversely, CMI values computed using DP as reference treatment (Figure 8B) depict the outstanding effects of reforestations.
Treatments OR and YR exhibited the highest values of CMI, followed by MP, which confirms the positive impact of converting DP to better managed LULC treatments on soil quality. These results also suggest that although YR had a greater annual input of plant residues than OR (where L was YR > OR), the latter was more efficient in C recycling than the former. According to Sahu et al. [8], high values of L indicate a predominance of C susceptible to decomposition by soil microorganisms (labile C). This supports the statement that the soil under the treatment with the lowest L value (OR) has the highest C storage capacity (most efficient SOC cycling). Nevertheless, the increase in CMI from YR to OR indicates a tendency for C dynamics in reforestation to eventually match native forest conditions, emphasizing the need for conservation practices that aim to bulk soil carbon while ensuring a dynamic balance of this element in the environment. Contrarywise, the negative effects of BS on SOC, and consequently soil quality, are evinced. Treatment SF is again in a middle position regarding CMI, but it presents a trend towards decreasing soil quality as compared to better-managed systems (e.g., MP, YR, and OR). These findings underscore the importance of maintaining plant cover and correctly managing soil fertilization in pastures to preserve soil quality [3,77], as well as the soil associated ecosystem functions that could ensure the provision of relevant ecosystem services.
Comparing the results of CMI using different reference treatments highlights the importance of selecting an appropriate reference system for CMI calculation to accurately interpret the effects of LULC changes on soil quality. These findings are crucial because the absence of native forests in a given area does not impede the calculation of CMI, and neither does it prevent the use of this index as a tool to monitor LULC changes. Additionally, the discussed results provide valuable insights regarding how to estimate the financial return time based on the ecosystem services associated with the conversion of DP into a well-managed LULC treatment such as MP or YR. The Posses sub-basin can still serve as a testbed to assess the benefits of adopting a PES program, as well as studying the long-term effects of LULC changes on a landscape scale.
4. Conclusions
The study investigated the effects of reforestation age and land use/land cover changes on the dynamics of soil organic carbon. It was found that after eight years of reforestation using native vegetation species, it is possible to significantly increase soil organic C contents. Reforestation of degraded pasture areas can significantly increase TOC contents, even at depths ≥ 0.10 m, and consequently, the C stocks also. Moreover, it was observed that removal of biomass by grazing and burning can drastically decrease the amount of C to be incorporated as soil organic matter. Thus, adequate management practices of pasture areas, conversion to reforested areas, and preservation of native forests can promote C storage.
Finally, usage of SOC parameters such as TOC, C lability, and CMI can serve as baseline values for calculating payments for environmental services based on the ecosystem services provided by a native forest (positive reference) or the absence of ecosystem services in a degraded pasture (negative reference). Further research is recommended to assess what valuation method of ecosystem services would be adequate for the local conditions of the Posses sub-basin.
Author Contributions
Conceptualization, D.F.A.B.; writing-original draft preparation, D.F.A.B., D.V.G., A.B. and S.F.A.-G.; writing-review and editing, D.F.A.B., D.V.G., J.J.G.d.S.e.M.M., M.L.N.S., A.B., S.F.A.-G. and N.C.; supervision, M.L.N.S. Funding acquisition and project administration, M.L.N.S. All authors have read and agreed to the published version of the manuscript.
Funding
This research was funded by CNPq, National Council for Scientific and Technological Development grant number [150.698/2017-8 and 306.511/2017-7 processes], FAEPMIG [CAG-APQ01053-15 process]; and the Extrema City administration.
Institutional Review Board Statement
Not applicable.
Informed Consent Statement
Not applicable.
Data Availability Statement
Not applicable.
Conflicts of Interest
The authors declare no conflict of interest.
References
- Benbi, D.K.; Brar, K.; Toor, A.S.; Singh, P. Total and labile pools of soil organic carbon in cultivated and undisturbed soils in northern India. Geoderma 2015, 237, 149–158. [Google Scholar] [CrossRef]
- Yu, P.; Han, K.; Li, Q.; Zhou, D. Soil organic carbon fractions are affected by different land uses in an agro-pastoral transitional zone in Northeastern China. Ecol. Indic. 2017, 73, 331–337. [Google Scholar] [CrossRef]
- Bhattacharya, S.S.; Kim, K.H.; Das, S.; Uchimiya, M.; Jeon, B.H.; Kwon, E.; Szulejko, J.E. A review on the role of organic inputs in maintaining the soil carbon pool of the terrestrial ecosystem. J. Environ. Manag. 2016, 167, 214–227. [Google Scholar] [CrossRef] [PubMed]
- Cherubin, M.R.; Tormena, C.A.; Karlen, D.L. Soil quality evaluation using the soil management assessment framework (SMAF) in Brazilian oxisols with contrasting texture. Rev. Bras. Cienc. Solo 2017, 41, 1–18. [Google Scholar] [CrossRef]
- Oliveira, D.M.S.; de Lima, R.P.; Barreto, M.S.C.; Verburg, E.E.J.; Mayrink, G.C.V. Soil organic matter and nutrient accumulation in areas under intensive management and swine manure application. J. Soils Sedim. 2017, 17, 1–10. [Google Scholar] [CrossRef]
- Leul, Y.; Assen, M.; Damene, S.; Legass, A. Effects of land use types on soil quality dynamics in a tropical sub-humid ecosystem, western Ethiopia. Ecol. Indic. 2023, 147, 110024. [Google Scholar] [CrossRef]
- Menezes, R.S.C.; Sales, A.T.; Primo, D.C.; Albuquerque, E.R.G.M.; Jesus, K.N.; Pareyn, F.G.C.; Santana, M.S.; Santos, U.J.; Martins, J.C.R.; Althoff, T.D.; et al. Soil and vegetation carbon stocks after land-use changes in a seasonally dry tropical forest. Geoderma 2021, 390, 114943. [Google Scholar] [CrossRef]
- Sahu, C.; Mishra, R.; Basti, S. Land-use change affects carbon storage and lability in tropical soil of India. Geoderma Reg. 2023, 32, e00621. [Google Scholar] [CrossRef]
- Toriyama, J.; Imaya, A.; Hirai, K.; Lim, T.K.; Hak, M.; Kiyono, Y. Effects of forest conversion to rubber plantation and of replanting rubber trees on soil organic carbon pools in a tropical moist climate zone. Agric. Ecosyst. Environ. 2022, 323, 107699. [Google Scholar] [CrossRef]
- Lal, R.; Negassa, W.; Lorenz, K. Carbon sequestration in soil. Curr. Opin. Environ. Sustain. 2015, 15, 79–86. [Google Scholar] [CrossRef]
- Ryals, R.; Kaiser, M.; Torn, M.S.; Berhe, A.A.; Silver, W.L. Impacts of organic matter amendments on carbon and nitrogen dynamics in grassland soils. Soil Biol. Biochem. 2014, 68, 52–61. [Google Scholar] [CrossRef]
- Mackay, J.E.; Cunningham, S.C.; Cavagnaro, T.R. Riparian reforestation: Are there changes in soil carbon and soil microbial communities? Sci. Total Environ. 2016, 566–567, 960–967. [Google Scholar] [CrossRef] [PubMed]
- Oertel, C.; Matschullat, J.; Zurba, K.; Zimmermann, F.; Erasmi, S. Greenhouse gas emissions from soils—A review. Chemie der Erde 2016, 76, 327–352. [Google Scholar] [CrossRef]
- de Araújo, E.A.; Ker, J.C.; de Sá Mendonça, E.; da Silva, I.R.; Oliveira, E.K. Impacto da conversão floresta—Pastagem nos estoques e na dinâmica do carbono e substâncias húmicas do solo no bioma Amazônico. Acta Amaz. 2011, 41, 103–114. [Google Scholar] [CrossRef]
- Wang, Q.; Zhang, L.; Li, L.; Bai, Y.; Cao, J.; Han, X. Changes in carbon and nitrogen of Chernozem soil along a cultivation chronosequence in a semi-arid grassland. Eur. J. Soil Sci. 2009, 60, 916–923. [Google Scholar] [CrossRef]
- Wei, X.; Shao, M.; Gale, W.; Li, L. Global pattern of soil carbon losses due to the conversion of forests to agricultural land. Sci. Rep. 2014, 4, 6–11. [Google Scholar] [CrossRef]
- Wiesmeier, M.; von Lützow, M.; Spörlein, P.; Geuß, U.; Hangen, E.; Reischl, A.; Schilling, B.; Kögel-Knabner, I. Land use effects on organic carbon storage in soils of Bavaria: The importance of soil types. Soil Tillage Res. 2015, 146, 296–302. [Google Scholar] [CrossRef]
- Carvalho, J.L.N.; Avanzi, J.C.; Silva, M.L.N.; de Mello, C.R.; Cerri, C.E.P. Potential of soil carbon sequestration in different biomes of Brazil. Rev. Bras. Cienc. Solo 2010, 34, 277–289. [Google Scholar] [CrossRef]
- Eclesia, R.P.; Jobbagy, E.G.; Jackson, R.B.; Biganzoli, F.; Piñeiro, G. Shifts in soil organic carbon for plantation and pasture establishment in native forests and grasslands of South America. Glob. Chang. Biol. 2012, 18, 3237–3251. [Google Scholar] [CrossRef]
- Wang, Q.; Wang, Y.; Wang, Q.; Liu, J. Impacts of 9 years of a new conservational agricultural management on soil organic carbon fractions. Soil Tillage Res. 2014, 143, 1–6. [Google Scholar] [CrossRef]
- Figueiredo, C.C.; de Oliveira, A.D.; dos Santos, I.L.; Ferreira, E.A.B.; Malaquias, J.V.; de Sá, M.A.C.; de Carvalho, A.M.; dos Santos, J.L.; dos Santos, J.d.D.G., Jr. Relationships between soil organic matter pools and nitrous oxide emissions of agroecosystems in the Brazilian Cerrado. Sci. Total Environ. 2018, 618, 1572–1582. [Google Scholar] [CrossRef] [PubMed]
- Sá, J.C.M.; Séguy, L.; Tivet, F.; Lal, R.; Bouzinac, S.; Borszowskei, P.R.; Briedis, C.; dos Santos, J.B.; da Cruz Hartman, D.; Bertoloni, C.G.; et al. Carbon Depletion by Plowing and its Restoration by No-Till Cropping Systems in Oxisols of Subtropical and Tropical Agro-Ecoregions in Brazil. Land Degrad. Dev. 2015, 26, 531–543. [Google Scholar] [CrossRef]
- Dhaliwal, J.; Kukal, S.S.; Sharma, S. Soil organic carbon stock in relation to aggregate size and stability under tree-based cropping systems in Typic Ustochrepts. Agrofor. Syst. 2018, 92, 275–284. [Google Scholar] [CrossRef]
- Coutinho, R.P.; Urquiaga, S.; Boddey, R.M.; Alves, B.J.R.; Abreu Torres, A.Q.; Jantalia, C.P. Estoque de carbono e nitrogênio e emissão de N2O em diferentes usos do solo na Mata Atlântica. Pesqui. Agropecu. Bras. 2010, 45, 195–203. [Google Scholar] [CrossRef]
- Nave, L.E.; Swanston, C.W.; Mishra, U.; Nadelhoffer, K.J. Afforestation Effects on Soil Carbon Storage in the United States: A Synthesis. Soil Sci. Soc. Am. J. 2013, 77, 1035–1047. [Google Scholar] [CrossRef]
- Bárcena, T.G.; Kiær, L.P.; Vesterdal, L.; Stefánsdóttir, H.M.; Gundersen, P.; Sigurdsson, B.D. Soil carbon stock change following afforestation in Northern Europe: A meta-analysis. Glob. Change Biol. 2014, 20, 2393–2405. [Google Scholar] [CrossRef]
- Blanco-Moure, N.; Gracia, R.; Bielsa, A.C.; López, M.V. Soil organic matter fractions as affected by tillage and soil texture under semiarid Mediterranean conditions. Soil Tillage Res. 2016, 155, 381–389. [Google Scholar] [CrossRef]
- Cambardella, C.A.; Elliott, E.T. Particulate Soil Organic-Matter Changes across a Grassland Cultivation Sequence. Soil Sci. Soc. Am. J. 1992, 56, 777–783. [Google Scholar] [CrossRef]
- Chen, S.; Huang, Y.; Zou, J.; Shi, Y. Mean residence time of global topsoil organic carbon depends on temperature, precipitation and soil nitrogen. Glob. Planet. Chang. 2013, 100, 99–108. [Google Scholar] [CrossRef]
- Li, S.; Zhang, S.; Pu, Y.; Li, T.; Xu, X.; Jia, Y.; Deng, O.; Gong, G. Dynamics of soil labile organic carbon fractions and C-cycle enzyme activities under straw mulch in Chengdu Plain. Soil Tillage Res. 2016, 155, 289–297. [Google Scholar] [CrossRef]
- Yuan, Y.; Zhao, Z.; Li, X.; Wang, Y.; Bai, Z. Characteristics of labile organic carbon fractions in reclaimed mine soils: Evidence from three reclaimed forests in the Pingshuo opencast coal mine, China. Sci. Total Environ. 2018, 613–614, 1196–1206. [Google Scholar] [CrossRef] [PubMed]
- Blair, G.J.; Lefroy, R.D.; Lisle, L. Soil carbon fractions based on their degree of oxidation, and the development of a carbon management index for agricultural systems. Aust. J. Agric. Res. 1995, 46, 1459–1466. [Google Scholar] [CrossRef]
- Colombo, A.F.; Joly, C.A. Brazilian Atlantic Forest lato sensu: The most ancient Brazilian forest, and a biodiversity hotspot, is highly threatened by climate change. Braz. J. Biol. 2010, 70, 697–708. [Google Scholar] [CrossRef]
- Lal, R. Soil carbon sequestration to mitigate climate change. Geoderma 2004, 123, 1–22. [Google Scholar] [CrossRef]
- Alamgir, M.; Campbell, M.J.; Turton, S.M.; Pert, P.L.; Edwards, W.; Laurance, W.F. Degraded tropical rain forests possess valuable carbon storage opportunities in a complex, forested landscape. Sci. Rep. 2016, 6, 30012. [Google Scholar] [CrossRef] [PubMed]
- Jobbágy, E.G.; Jackson, R.B. The vertical distribution of soil organic carbon and its relation to climate and vegetation. Ecol. Appl. 2000, 10, 423–436. [Google Scholar] [CrossRef]
- van Straaten, O.; Corre, M.D.; Wolf, K.; Tchienkoua, M.; Cuellar, E.; Matthews, R.B.; Veldkamp, E.; Vitousek, P.M. Conversion of lowland tropical forests to tree cash crop plantations loses up to one-half of stored soil organic carbon. Proc. Natl. Acad. Sci. USA 2015, 112, 9956–9960. [Google Scholar] [CrossRef]
- Federal Law, No. 12,187; Brazilian National Policy on Climate Change. National Congress: New Delhi, India, 29 December 2009.
- Zolin, C.A.; Folegatti, M.V.; Mingoti, R.; Paulino, J.; Sánchez-Román, R.M.; González, A.M.O. The first Brazilian municipal initiative of payments for environmental services and its potential for soil conservation. Agric. Water Manag. 2014, 137, 75–83. [Google Scholar] [CrossRef]
- Zanella, M.A.; Schleyer, C.; Speelman, S. Why do farmers join Payments for Ecosystem Services (PES) schemes? An Assessment of PES water scheme participation in Brazil. Ecol. Econ. 2014, 105, 166–176. [Google Scholar] [CrossRef]
- Oliveira, D.M.S.; Paustian, K.; Cotrufo, M.F.; Fiallos, A.R.; Cerqueira, A.G.; Cerri, C.E.P. Assessing labile organic carbon in soils undergoing land use change in Brazil: A comparison of approaches. Ecol. Indic. 2017, 72, 411–419. [Google Scholar] [CrossRef]
- Sá, J.C.M.; Gonçalves, D.R.P.; Ferreira, L.A.; Mishra, U.; Inagaki, T.M.; Furlan, F.J.F.; Moro, R.S.; Floriani, N.; Briedis, C.; Ferreira, A.O. Soil carbon fractions and biological activity based indices can be used to study the impact of land management and ecological successions. Ecol. Indic. 2018, 84, 96–105. [Google Scholar] [CrossRef]
- Alvares, C.A.; Stape, J.L.; Sentelhas, P.C.; de Moraes Gonçalves, J.L.; Sparovek, G. Köppen’s climate classification map for Brazil. Meteorol. Zeitschrift 2013, 22, 711–728. [Google Scholar] [CrossRef]
- Pereira, P.H. Conservador das Águas—12 Anos. Secretaria de Meio Ambiente; Prefeitura Municipal de Extrema: Extrema, Brazil, 2017. Available online: https://extrema.mg.gov.br/conservadordasaguas/wp-content/uploads/2019/10/CONSERVADOR-DAS-ÁGUAS-LIVRO-12-ANOS.pdf (accessed on 13 March 2023).
- Pereira, P.H. Projeto Conservador das Águas—Extrema. In Experiências de Pagamentos por Serviços Ambientais no Brasil; Pagiola, S., Von Glehn, H.C., Taffarello, D., Eds.; Secretaria do Meio Ambiente de São Paulo: São Paulo, Brazil, 2013; Available online: https://documents1.worldbank.org/curated/en/548371468021548454/pdf/864940WP0P088000PORTUGUESE0PSAlivro.pdf (accessed on 13 March 2023).
- Soil Survey Staff, Natural Resources Conservation Service, U.S. Department of Agriculture. Official Soil Series Descriptions. Available online: https://www.nrcs.usda.gov/resources/data-and-reports/official-soil-series-descriptions-osd (accessed on 13 March 2023).
- Silva, B.P.C.; Silva, M.L.N.; Avalos, F.A.P.; Menezes, M.D.; Curi, N. Digital soil mapping including additional point sampling in Posses ecosystem services pilot watershed, southeastern Brazil. Sci. Rep. 2019, 9, 13763. [Google Scholar] [CrossRef]
- MapBiomas Project—Collection 1985 of Annual Land Cover and Land Use Maps. Available online: https://storage.googleapis.com/mapbiomas-public/brasil/collection-6/LULC/coverage/brasil_coverage_1985.tif (accessed on 13 March 2023).
- MapBiomas Project—Collection 1994 of Annual Land Cover and Land Use Maps. Available online: https://storage.googleapis.com/mapbiomas-public/brasil/collection-6/LULC/coverage/brasil_coverage_1994.tif (accessed on 13 March 2023).
- MapBiomas Project—Collection 2003 of Annual Land Cover and Land Use Maps. Available online: https://storage.googleapis.com/mapbiomas-public/brasil/collection-6/LULC/coverage/brasil_coverage_2003.tif (accessed on 13 March 2023).
- MapBiomas Project—Collection 2012 of Annual Land Cover and Land Use Maps. Available online: https://storage.googleapis.com/mapbiomas-public/brasil/collection-6/LULC/coverage/brasil_coverage_2012.tif (accessed on 13 March 2023).
- Blake, G.R.; Hartge, K.H. Bulk Density. In Methods of Soil Analysis, Part 1: Physical and Mineralogical Methods, 2nd ed.; Klute, A., Ed.; Soil Science Society of America Book Series; John Wiley & Sons: Hoboken, NJ, USA, 2018. [Google Scholar] [CrossRef]
- Teixeira, P.C.; Donagemma, G.K.; Fontana, A.; Teixeira, W.G. Manual de Métodos de Análise de Solo; Solos, E., Ed.; Embrapa: Rio de Janeiro, Brazil, 2017; Available online: https://ainfo.cnptia.embrapa.br/digital/bitstream/item/181717/1/Manual-de-Metodos-de-Analise-de-Solo-2017.pdf (accessed on 13 March 2023).
- R Core Team. R: A Language and Environment for Statistical Computing; R Core Team: Vienna, Austria, 2019; Available online: https://www.R-project.org/ (accessed on 15 October 2022).
- Leite, L.F.C.; de Arruda, F.P.; Costa, C.N.; Ferreira, J.S.; Holanda Neto, M.R. Chemical quality of soil and dynamics of carbon under monoculture and intercroping of acrocomia palm and pasture. Rev. Bras. Eng. Agríc. Amb. 2013, 17, 1257–1263. [Google Scholar] [CrossRef]
- Shao, P.; Liang, C.; Lynch, L.; Xie, H.; Bao, X. Reforestation accelerates soil organic carbon accumulation: Evidence from microbial biomarkers. Soil Biol. Biochem. 2019, 131, 182–190. [Google Scholar] [CrossRef]
- Primieri, S.; Muniz, A.W.; de Melo Lisboa , H. Soil Carbon Dynamics in Native Ecosystems and Reforestation in Santa Catarina. Floresta Amb. 2017, 24. [Google Scholar] [CrossRef]
- Novara, A.; La Mantia, T.; Rühl, J.; Badalucco, L.; Kuzyakov, Y.; Gristina, L.; Laudicina, V.A. Dynamics of soil organic carbon pools after agricultural abandonment. Geoderma 2014, 235–236, 191–198. [Google Scholar] [CrossRef]
- Thomazini, A.; Mendonça, E.S.; Souza, J.L.; Cardoso, I.M.; Garbin, M.L. Impact of organic no-till vegetables systems on soil organic matter in the Atlantic Forest biome. Sci. Hortic. 2015, 182, 145–155. [Google Scholar] [CrossRef]
- dos Santos, C.A.; Rezende, C.P.; Machado Pinheiro, É.F.; Pereira, J.M.; Alves, B.J.R.; Urquiaga, S.; Boddey, R.M. Changes in soil carbon stocks after land-use change from native vegetation to pastures in the Atlantic forest region of Brazil. Geoderma 2019, 337, 394–401. [Google Scholar] [CrossRef]
- Vicente, L.C.; Gama-Rodrigues, E.F.; Gama-Rodrigues, A.C. Soil carbon stocks of Ultisols under different land use in the Atlantic rainforest zone of Brazil. Geod. Reg. 2016, 7, 330–337. [Google Scholar] [CrossRef]
- Deng, L.; Wang, K.; Tang, Z.; Shangguan, Z. Soil organic carbon dynamics following natural vegetation restoration: Evidence from stable carbon isotopes (δ13C). Agric. Ecosyst. Environ. 2016, 221, 235–244. [Google Scholar] [CrossRef]
- Mello, F.F.C.; Cerri, C.E.P.; Bernoux, M.; Volkoff, B.; Cerri, C.; Catarina, S.; Paulo, S. Potential of soil carbon sequestration for the Brazilian Atlantic Region. In Carbon Sequestration in Soils of Latin America; Lal, R., Cerri, C.C., Bernoux, M., Etchevers, J., Cerri, C.E.P., Eds.; CRC Press: New York, NY, USA, 2006. [Google Scholar] [CrossRef]
- Canellas, L.P.; Busato, J.G.; Dobbss, L.B.; Baldotto, M.A.; Rumjanek, V.M.; Olivares, F.L. Soil organic matter and nutrient pools under long-term non-burning management of sugar cane. Eur. J. Soil Sci. 2010, 61, 375–383. [Google Scholar] [CrossRef]
- Poeplau, C.; Zopf, D.; Greiner, B.; Geerts, R.; Korvaar, H.; Thumm, U.; Don, A.; Heidkamp, A.; Flessa, H. Why does mineral fertilization increase soil carbon stocks in temperate grasslands? Agric. Ecosyst. Environ. 2018, 265, 144–155. [Google Scholar] [CrossRef]
- Souza, E.D.; Costa, S.E.V.G.A.; Lima, C.V.S.; Anghinoni, I.; Meurer, E.J.; Carvalho, P.C.F. Organic carbon and microbial phosphorus in a no-till integrated crop-livestock system under different grazing intensities. Rev. Bras. Ciênc. Solo 2008, 32, 1273–1282. [Google Scholar] [CrossRef]
- Six, J.; Conant, R.T.; Paul, E.A.; Paustian, K. Stabilization mechanisms of SOM implications for C saturation of soils. Plant Soil 2002, 241, 155–176. [Google Scholar] [CrossRef]
- Braz, S.P.; Urquiaga, S.; Alves, B.J.R.; Jantalia, C.P.; Guimarães, A.P.; dos Santos, C.A.; dos Santos, S.C.; Machado Pinheiro, É.F.; Boddey, R.M. Soil Carbon Stocks under Productive and Degraded Brachiaria Pastures in the Brazilian Cerrado. Soil Sci. Soc. Am. J. 2013, 77, 914–928. [Google Scholar] [CrossRef]
- Maia, S.M.F.; Ogle, S.M.; Cerri, C.C.; Cerri, C.E.P. Changes in soil organic carbon storage under different agricultural management systems in the Southwest Amazon Region of Brazil. Soil Till. Res. 2010, 106, 177–184. [Google Scholar] [CrossRef]
- Silva, M.A.; De Freitas, D.A.F.; Silva, M.L.N.; Oliveira, A.H.; Lima, G.C.; Curi, N. Geographic information system on the land use planning. Rev. Bras. Cienc. Agrar. 2013, 8, 316–323. [Google Scholar] [CrossRef]
- Barreto, P.A.B.; Gama-Rodrigues, E.F.; Gama-Rodrigues, A.C.; Fontes, A.G.; Polidoro, J.C.; Moço, M.K.S.; Machado, R.C.R.; Baligar, V.C. Distribution of oxidizable organic C fractions in soils under cacao agroforestry systems in Southern Bahia, Brazil. Agrofor. Syst. 2011, 81, 213–220. [Google Scholar] [CrossRef]
- Carter, M.R.; Gregorich, E.G.; Angers, D.A.; Donald, R.G.; Bolinder, M.A. Organic C and N storage, and organic C fractions, in adjacent cultivated and forested soils of eastern Canada. Soil Tillage Res. 1998, 47, 253–261. [Google Scholar] [CrossRef]
- dos Reis, C.E.S.; Dick, D.P.; Caldas, J.S.; Bayer, C. Carbon sequestration in clay and silt fractions of Brazilian soils under conventional and no-tillage systems. Sci. Agric. 2014, 71, 292–301. [Google Scholar] [CrossRef]
- Feng, W.; Plante, A.F.; Six, J. Improving estimates of maximal organic carbon stabilization by fine soil particles. Biogeochemistry 2013, 112, 81–93. [Google Scholar] [CrossRef]
- Guimarães, D.V.; Silva, M.L.N.; Beiniach, A.; Bispo, D.F.A.; Contins, J.G.P.; Curi, N. Relationship between soil organic matter fractions and cover plants in Olive post planting. Rev. Bras. Frutic. 2018, 40, 1–12. [Google Scholar] [CrossRef]
- Guimarães, D.V.; Silva, M.L.N.; Beniaich, A.; Pio, R.; Gonzaga, M.I.S.; Avanzi, J.C.; Bispo, D.F.A.; Curi, N. Dynamics and losses of soil organic matter and nutrients by water erosion in cover crop management systems in olive groves, in tropical regions. Soil Till. Res. 2021, 209, 104863. [Google Scholar] [CrossRef]
- Vieira, F.C.B.; Bayer, C.; Zanatta, J.A.; Dieckow, J.; Mielniczuk, J.; He, Z.L. Carbon management index based on physical fractionation of soil organic matter in an Acrisol under long-term no-till cropping systems. Soil Tillage Res. 2007, 96, 195–204. [Google Scholar] [CrossRef]
- Bayer, C.; Dieckow, J.; Amado, T.J.C.; Eltz, F.L.F.; Vieira, F.C.B. Cover crop effects increasing carbon storage in a subtropical no-till sandy Acrisol. Commun. Soil Sci. Plant Anal. 2009, 40, 1499–1511. [Google Scholar] [CrossRef]
- Campos, B.H.C.; Amado, T.J.C.; Bayer, C.; Nicoloso, R.S.; Fiorin, J.E. Carbon stock and its compartments in a subtropical Oxisol under long-term tillage and crop rotation systems. Rev. Bras. Cienc. Solo 2011, 35, 805–817. [Google Scholar] [CrossRef]
Disclaimer/Publisher’s Note: The statements, opinions and data contained in all publications are solely those of the individual author(s) and contributor(s) and not of MDPI and/or the editor(s). MDPI and/or the editor(s) disclaim responsibility for any injury to people or property resulting from any ideas, methods, instructions or products referred to in the content. |
© 2023 by the authors. Licensee MDPI, Basel, Switzerland. This article is an open access article distributed under the terms and conditions of the Creative Commons Attribution (CC BY) license (https://creativecommons.org/licenses/by/4.0/).