Abstract
This study analyzes a high-rise building with B-level height (i.e., a total height of 146.5 m) and a shear wall structure. Since the project contains many plane irregularities (including 1a torsional irregularity, 1b eccentric arrangement, and 2a plane convex irregularity), it should be treated as a super high-rise building. This study introduces the main characteristics and overrun conditions of the project and describes the structural design of the foundation and the basement, upper structural layout, force conditions under frequent, fortified, and rare earthquake actions, and structural performance-based objectives in detail. The following measures can be adopted to address the overrun problem. First, the floor at the thin waist of the structure was thickened to 150 mm and reinforced in the bilayer and bidirectional patterns, with a reinforcement ratio of no less than 0.25%. The damage condition on the floors under a great earthquake was analyzed. The vertical components at the waist were reinforced to constrain the extension of the edge components toward the top. Second, the structure’s peripheral stiffness was strengthened to enhance the anti-torsional performance and minimize the adverse effects on torsional irregularities. Third, using two software programs, the performance-based envelope design under medium earthquake action and dynamic elastoplastic analysis under great earthquake action were analyzed to ensure structural safety. Fourth, the edge components were constrained for the shear wall columns with axial-to-compressive stress strength ratios exceeding 0.3. For the overall structure and critical parts, force conditions under frequent, fortified, and rare earthquake conditions were calculated and examined with the SATWE, MIDAS GEN, and SAUSAGE software packages. The calculation results revealed that the structure shows favorable anti-seismic performance, with an overall anti-seismic C-level and a safe and reliable structure. The structural design method introduced in this article can promote the sustainable development of structural design.
1. Introduction
With increasing building height, conventional structural parametric design methods need help meeting the seismic performance requirements of structural systems. Most previous studies have only analyzed the mechanical properties of the structural materials themselves or the single control objectives of the entire structure (such as the cycle ratio, stiffness ratio, displacement ratio, displacement angle, shear weight ratio, etc.) [1,2]. However, this paper first conducted an overrun analysis of a typical overrun high-rise building. Furthermore, the envelope design of dual software mode decomposition analysis and time history analysis under frequent earthquakes is performed for the structure. According to the structure’s overrun conditions, the analysis results of frequent earthquakes, and the set seismic performance goals, force analysis for fortified earthquakes and rare earthquakes is performed. The calculation results show that the overall seismic performance of the structure is good under frequent, fortified, and rare earthquakes. Although relatively novel, the performance-based design method has universal guiding significance for seismic force analysis and the practical engineering structural design of high-rise buildings beyond the limit.
This research method is helpful for solving the local or overall overrun problems of structures caused by plane irregularities, vertical irregularities, and local irregularities in design. For structural systems with poor seismic performance (such as single span frame structures, etc.), the method of performance-based objectives can also be referred to for design. The seismic design method studied in this paper is conducive to the sustainable and healthy development of the structural design industry. With the diversity of building schemes, there are more and more irregular building shapes and super high buildings. Performance based design methods provide a convenient and efficient design approach for the structural design of such buildings. The seismic design method studied in this article is conducive to the sustained and healthy development of the structural design industry.
2. Project Profile and Design Analysis Process
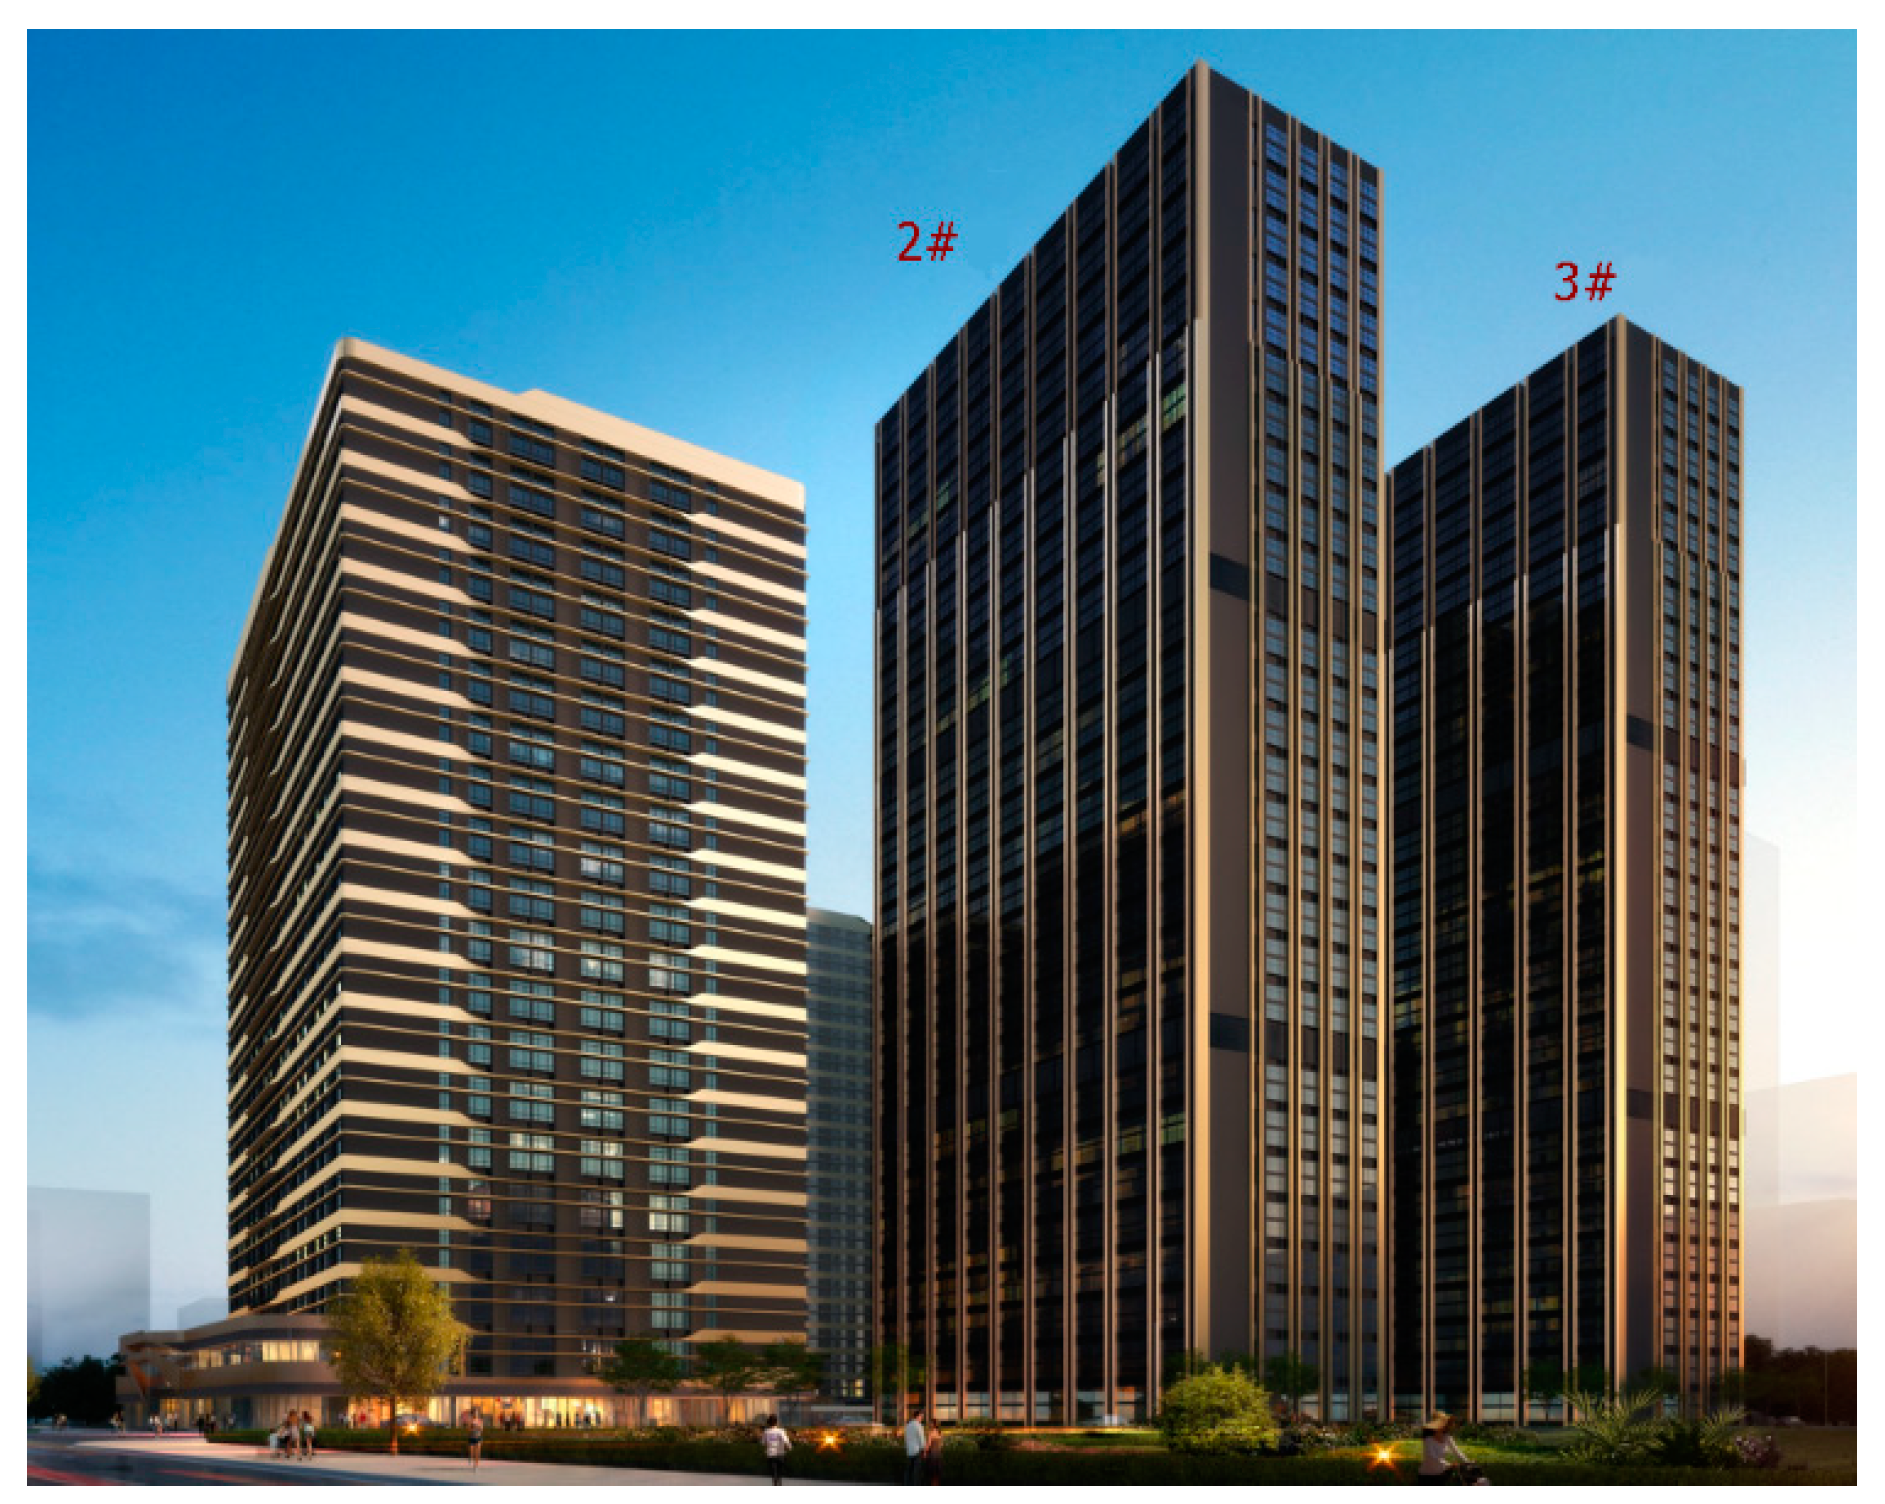
2.1. Project Profile
The project is located in Jiangning District, Nanjing, China. The project’s No. 2 and No. 3 buildings are identical structures. For every structure, the aboveground building area is approximately 34,000 m2, with a total height of 146.5 m. The project shows a U-shaped plane layout; the maximum and minimum equivalent widths are 69.23 m and 26.32 m, respectively. The maximum height-to-width ratio is 5.56. The 1st~10th floor, 12th~19th, and 21st~31st floors are 4.8 m in height, with the LOFT apartment function, while the remaining 11th and 20th floors, used for refuge, are 3.6 m in height. No structural joint is set between the single tower and the underground parking. The project’s location (II-type regarding site classification) corresponds to the seventh level of seismic intensity, and according to the seismic design, it can be classified into the first group. Based on geological exploration data, the characteristic period of ground motion is 0.39 s [3,4]. Figure 1 depicts the architectural rendering.
Figure 1.
Architectural rendering.
The project has a Level-II standard fortification category in structural safety, with a design working life of 50 years [5]. The building is at Level-7 of seismic fortification intensity and in the first group regarding design earthquake grouping. The basic seismic acceleration is 0.10 g. The standard snow load and fundamental wind pressure in the 50-year return period are 0.65 and 0.40 kN/m2, respectively. The ground roughness is classified as B-type, and the shape factor is 1.4.
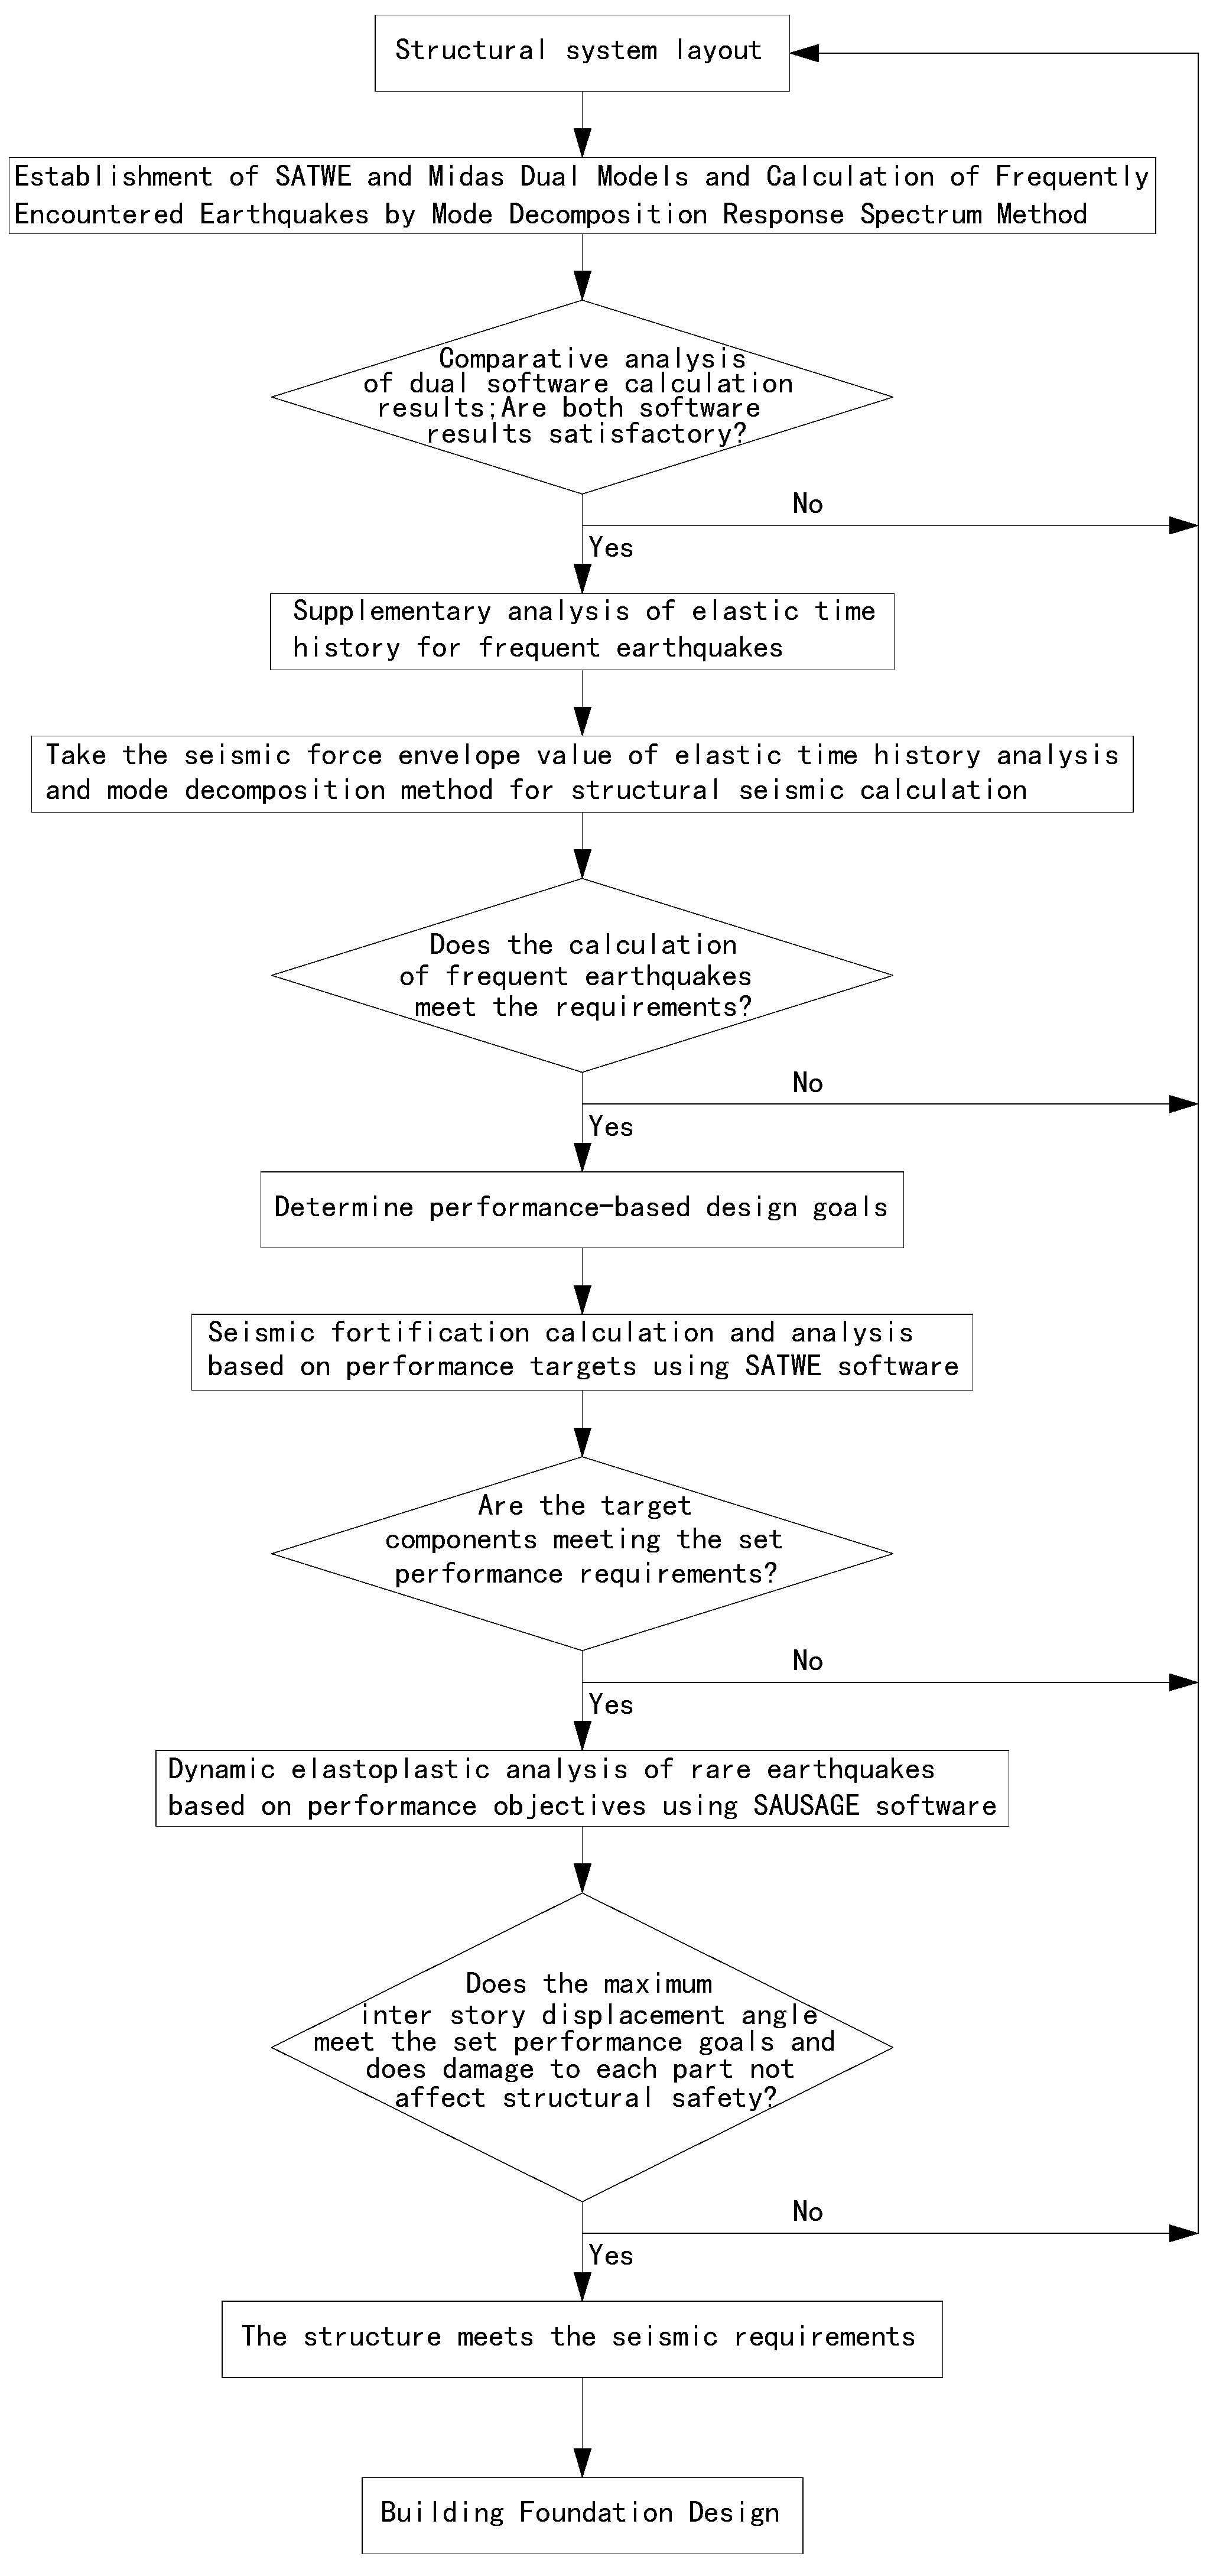
2.2. Design Analysis Process
In the elastic stage of structural design, this project adopts dual software comparative verification and conducts elastic time history supplementary analysis for frequent earthquakes for envelope design. For fortified earthquakes and rare earthquakes, the design method of setting performance targets for key parts can effectively control the damage situation of structural key components and prevent collapse under rare earthquakes [6,7]. The design process is shown in Figure 2.
Figure 2.
Flowchart for the structural design and analysis of super-high buildings.
3. Foundation Design Analysis
The building site under study is located in the river terrace geomorphic unit, with a stable distribution of various rock and soil layers. No fracture zone is observed in the base rock (base stratum). The site is stable under natural conditions. Some critical geological structures include the Long-Cang anticlinorium, Nanjing-Hushu fracture, fracture zone along the river, Chuhe fracture, fracture on the southern fringe of Longdong Mountain, Jiangpu-Liuhe fracture, and Pukou-Qiaolin fracture. No large-scale polluting enterprises are located around the site. The site is open and flat overall, and the environmental geological conditions do not affect engineering stability. Based on field exploration data, various rock and soil layers are uniformly distributed at the side, with overall stable properties. The field drilling data reveal that the covering layer of the site is about 30 m thick. The related regional data show that no active fractures pass through the site. The geological conditions are appropriate for the present project construction. The foundation uses cast-in-site bored piles with a diameter of 1000 mm and adopts intermediary-weathered sandstone as the boring course at the pile end. The effective pile length is approximately 36 m, and the insertion depth into the supporting layer is no less than 2 m. The pile concretes are C45 grade in strength. A single pile’s characteristic vertical compressive capacity is 8000 kN, and the embedded depth of the foundation is 15.7 m, satisfying the requirements in Item 12.1.8 of JGJ3-2010 [4]. Figure 3 displays the pile foundation layout.
Figure 3.
Layout chart of the pile foundation.
4. Main Structure Analysis
4.1. Underground Structure
The project has three underground floors, with a total underground depth of 15.8 m. Based on the stiffness ratio calculation results, the basement’s top slab satisfies the requirements of the embedded parts in the upper structure. The basement adopts a beam and slab structure within the three-span range outside the main building. The thickness of the top slab on the roof of the base of the main building is no less than 180 m. The overturning moment at the bottom of the structure under frequent earthquakes and the anti-overturning moment by the representative value of the gravity load of the structure itself are calculated by SATWE software, as shown in Table 1.
Table 1.
The overall anti-overturning calculation via SATWE.
No zero-stress zone exists on the bottom of the foundation, satisfying the requirements for overall anti-overturning in JGJ3-2010 [4].
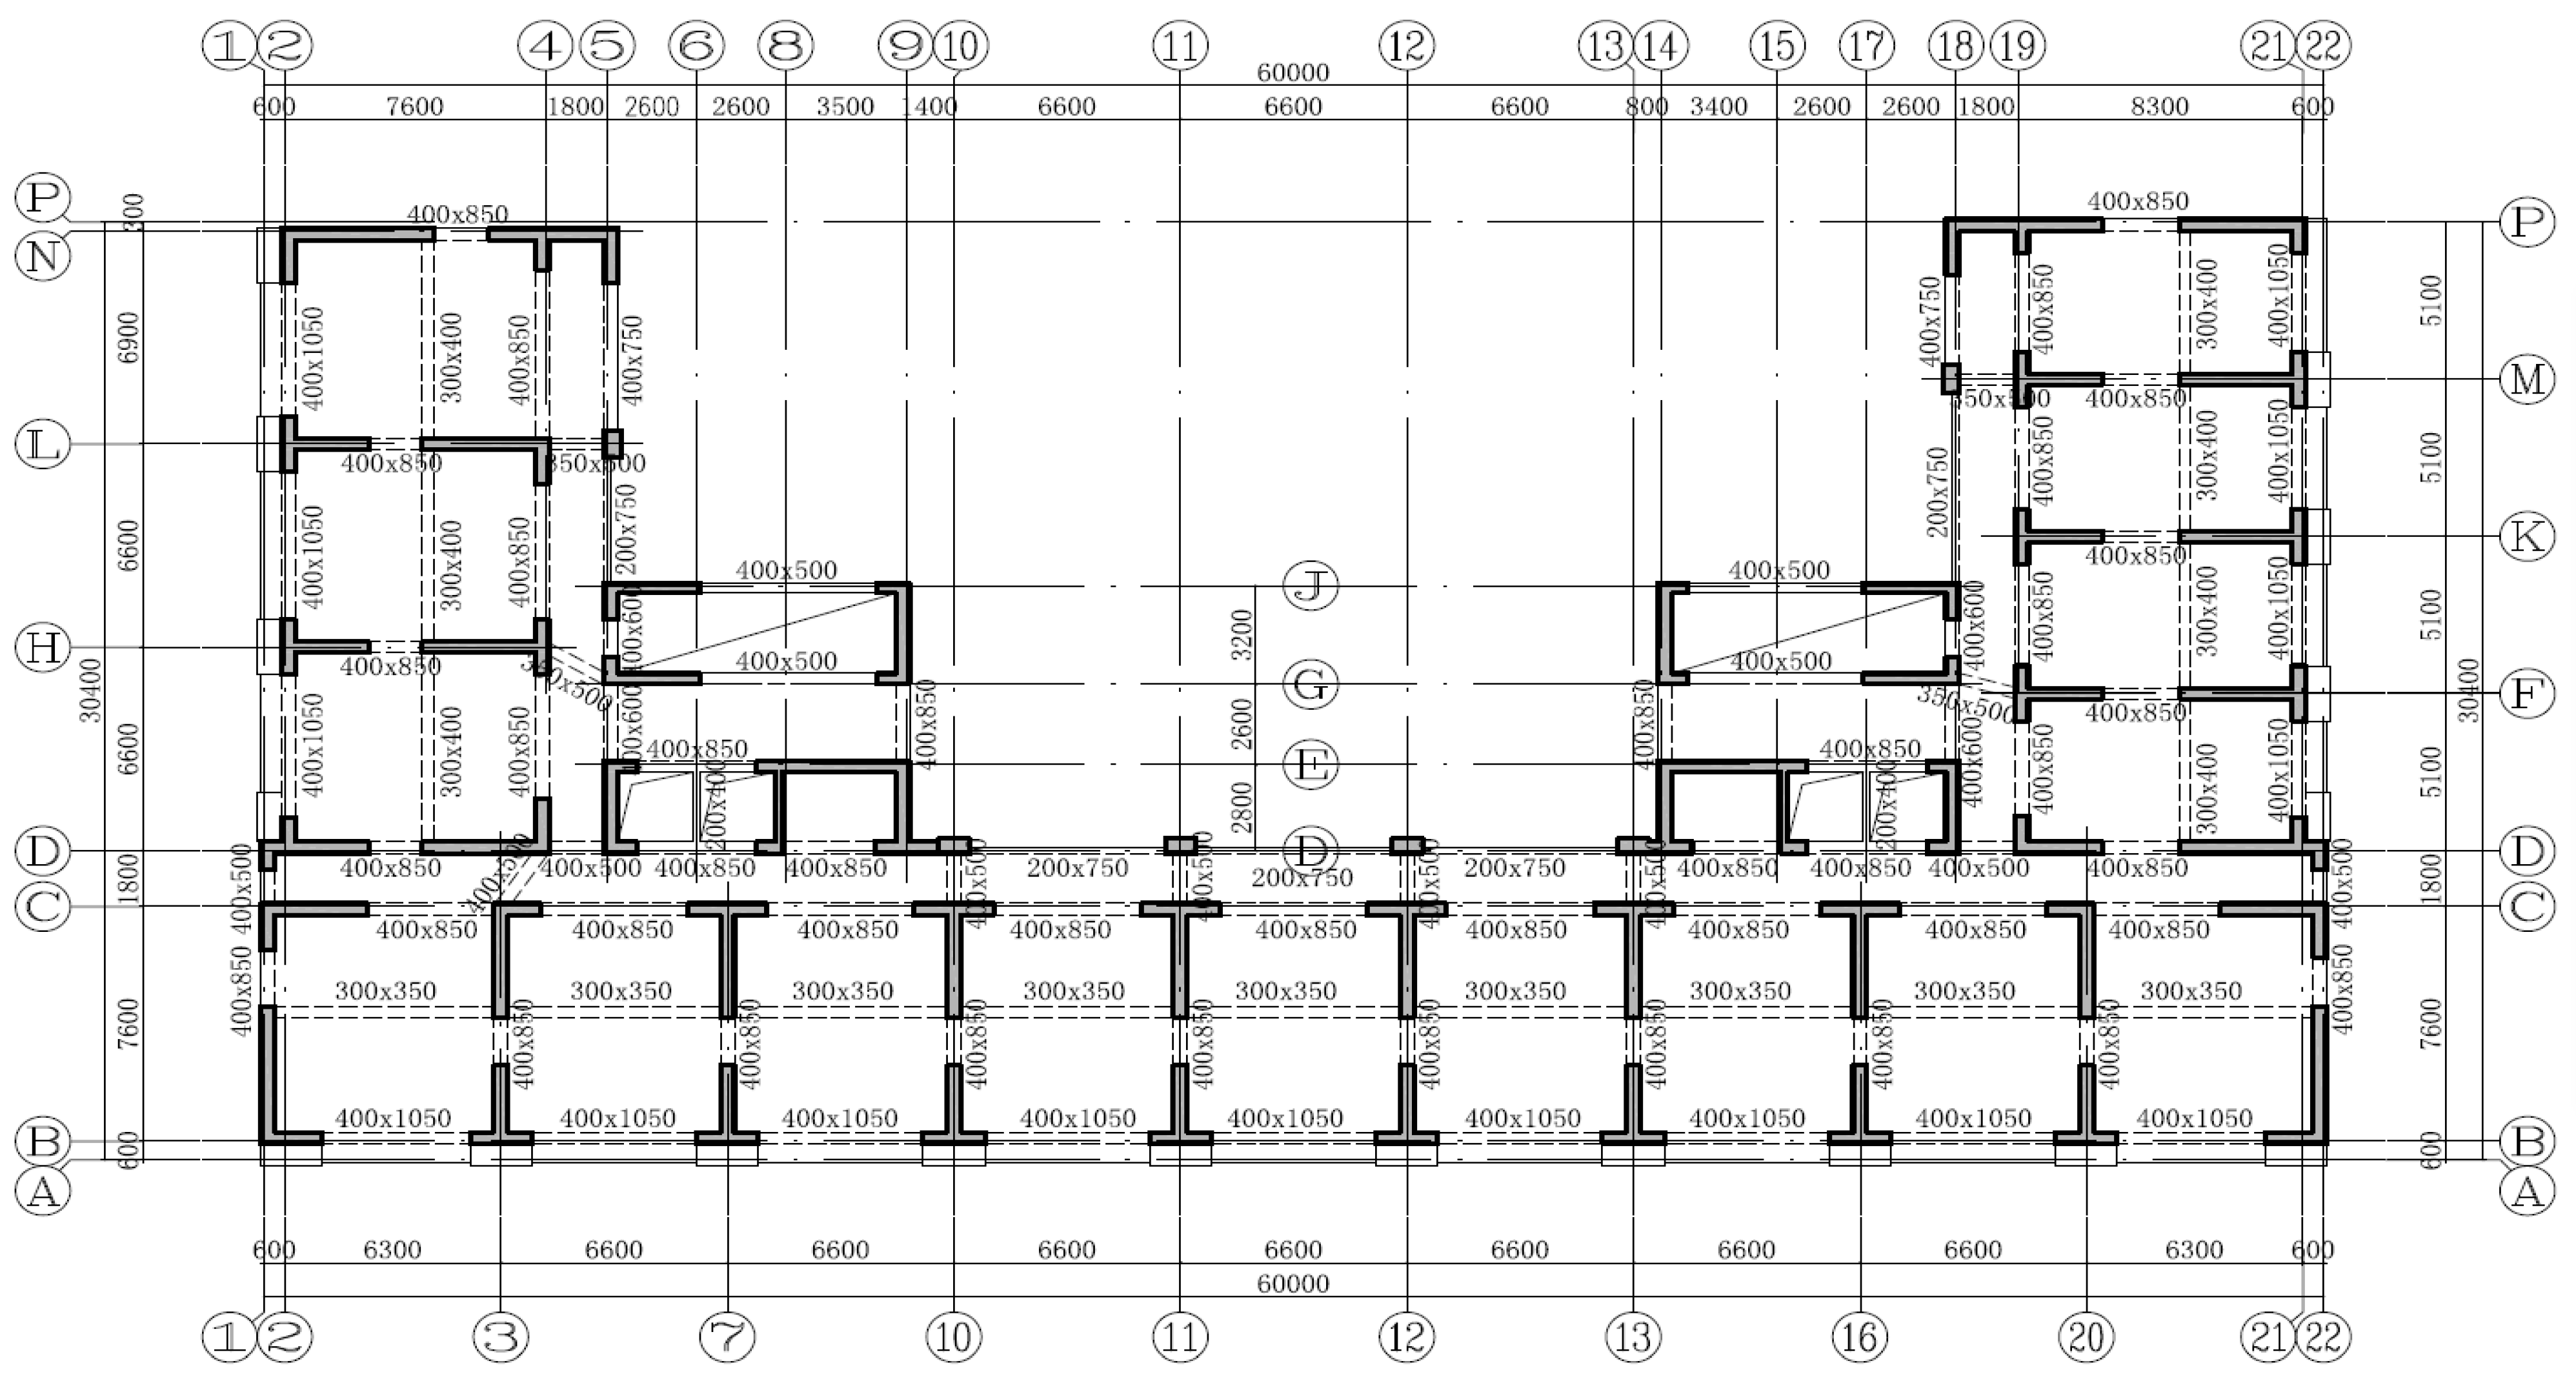
4.2. Aboveground Structure
The aboveground building is designed for LOFT apartments. By combining the functions and layout requirements of the building, all cast-in-place shear walls are used. The 1st~4th floors are the bottom reinforcement regions, while the 5th~7th floors form the transition layer. For the 1st~10th floors, the height of each floor is 4.8 m, and the thickness of the shear wall is 400 mm, while the wall, column, and coupling beams use concretes at the C60 level in strength. For the 11th layer, the height of each floor is 3.6 m, the shear wall thickness is 400 mm, and the wall, column, and coupling beams use concretes of C50 level in strength. For the 20th floor, the height of each floor is 3.6 m, the thickness of the shear wall is 300 mm, and the wall, column, and coupling beams use concretes of the C50 level in strength. For the 21st~31st floors, the height of each floor is 4.8 m, the thickness of the shear wall is 200 mm (the one-axis and 18-axis walls are 300 m in thickness), and the wall, column, and coupling beams use concretes of C50 level in strength. The bridge beam, secondary beam, and floors on the aboveground stories use concrete of the C30 level in strength. The floors at the slender waist and other positions are 150 and 110 mm thick, respectively. Figure 4 displays the structural layout of the 2nd~10th floors.
Figure 4.
The structural layout of the 2nd~10th floors.
4.3. Structural Overrun Analysis
Based on the structural analysis results obtained via SATWE and MIDAS GEN, the ratios of the first period dominated by structural torsion to the first period dominated by translation are 0.75 and 0.83, respectively, i.e., below 0.85. Under the specified horizontal force, by taking 5% accidental eccentricity into account, the ratio of the maximum interlayer horizontal displacement to the mean value of the vertical component is 1.21, indicative of torsional irregularity. The structure shows a U-shaped layout. The ratio of the mid-waist width to the maximum width is 66% (>35%), showing convex irregularity. The building is 146.45 m tall and can be classified as a grade-B high-rise building. The project can be comprehensively judged as a super high-rise building that requires special aseismic design [8,9,10].
5. Analysis of Frequent Earthquakes
5.1. Calculation Software and Model Based on the Mode-Superposition Response Spectrum Method
In this study, Finite Element Analysis and Design Software for Multistory and High-rise Buildings (SATWE, Version 3.1.6), compiled by the China Academy of Building Research, was used for calculation. In addition, MIDAS GEN (version 8.6), compiled by Beijing MIDAS Information Technology Co., Ltd. (Beijing MIDAS Information Technology Co., Ltd. is a wholly-owned subsidiary of Midas IT in Seoul, South Korea), was used for supplementary calculation. Figure 5a,b display the calculation models.
Figure 5.
Illustration of the calculation models via MIDAS (a) and SATWE (b).
In this study, by considering the effects of torsion under a bidirectional horizontal earthquake and the ±0.05 side length of the structure perpendicular to the direction of earthquake action accidental eccentricity under a unidirectional earthquake, the modal combination was obtained with the complete quadratic combination (CQC) [11]. During the analysis, the top slab of the basement was treated as the structurally embedded end. Table 2 lists the related adjustment parameters for the structural calculation.
Table 2.
Main input parameters of the calculation model.
5.2. Analysis of the Calculation Results Based on the Vibration Mode Decomposition Response Spectrum Method
5.2.1. Mass of the Structure
The total masses of the project in the SATWE and MIDAS GEN software programs are 749,000 and 734,000 tons, respectively. The calculation results obtained by these two software programs are consistent with each other, differing by only 2%. This difference is mainly attributed to the different principles of calculating the guiding load and the components’ weights at the beam, wall, and column nodes. In the MIDAS GEN-based calculations, the layer mass equals the sum of the beam and slab masses in this floor (story) and the vertical components in the upper and lower halves of the stories, leading to a significant difference in calculating the masses of the first, top, and transient stories.
5.2.2. Vibration Mode and Period
To achieve a sufficient modal mass participating coefficient, 21 vibration modes were involved in the SATWE and MIDAS GEN calculations. Table 3 lists the periods of the first 15 vibration modes. In the SATWE and MIDAS GEN results, the first ten orders’ modals are identical, with an accumulative mass participation coefficient of over 90%. Their ratios of the first torsional period to the first translational period are 0.75 and 0.83, i.e., below 0.85. It can also be observed from Table 3 that the translational period ratios along the two directions are 0.91 and 0.92, respectively, with a difference below 10%. This suggests that the structure has similar dynamic characteristics along two directions.
Table 3.
Structural period data using STAWE and MIDAS.
5.2.3. Displacement under Earthquake Action
Under frequent earthquake action, the maximum floor displacement angles are 1/1846 (on the 23rd floor along the X-direction, via SATWE), 1/1971 (on the 23rd floor along the X-direction, via MIDAS GEN), 1/1515 (on the 23rd floor along the Y-direction, via SATWE), and 1/1643 (on the 23rd floor along the Y-direction, using MIDAS GEN). These calculation results can satisfy the design requirement of a maximum floor displacement angle below 1/1000. The difference in the calculation results obtained via these two software programs mainly lies in MIDAS GEN considering the floor’s amplification on the beam’s stiffness. At the same time, SATEW only sets the amplitude coefficient of the stiffness of the beam according to the specifications. Under the specified horizontal force, by considering the effect of accidental eccentricity, the maximum ratio of the absolute displacements of the 1st~8th floors to their interlayer displacement ratio is 1.21 (i.e., only slightly exceeding 1.2). This suggests a few torsional irregularities.
5.2.4. Shear-Weight Ratio and Shear-Bearing Capacity of the Floor
According to Article 5.2.5 in GB50011-2010 [3] and Article 4.3.12 in JGJ3-2010 [4], the project’s minimum seismic shear force coefficient is 0.016. The calculation results using SATWE revealed that the shear-weight ratios of the first six floors above the ground along the X-direction fail to satisfy the requirement (specifically, the shear-weight ratios of the first six floors are 1.46, 1.51, 1.54, 1.57, 1.58, and 1.59%, respectively). The shear-weight ratios of the first and the second floors above the ground along the Y-direction cannot satisfy the requirement, with values of 1.52 and 1.57%, respectively. Using MIDAS, the shear-weight ratios of the first and second floors above the ground along the X-direction cannot satisfy the requirement, with values of 1.54 and 1.59%, respectively. The shear-weight ratio of the first floor above the ground along the Y-axis is 1.56%, failing to satisfy the requirement. The shear-weight ratios of the structure along two directions are slightly smaller than the required values. According to the specifications in Item 6, Article 2.7 of the Rules for Earthquake Fortification Review of Building Construction Projects in Jiangsu Province, China (the second edition), for a structure with a fundamental period below 5 s, when the calculated shear coefficient of the bottom is no less than 85% of the specified value, the bottom shear coefficient can be designed following the minimum specified value. Therefore, without changing the structural layout, the minimum shear force requirement can be satisfied with shear adjustment. The full-floor seismic shear adjustment coefficients along the X-axis and Y-directions are 1.09 and 1.05, respectively. The shear-bearing capacity of the floor should be no less than that of the adjacent upper floor.
5.2.5. Interlayer Stiffness and Stiffness-to-Gravity Ratio
The lateral stiffness ratio of the current layer to the adjacent upper layer is no less than 0.9, indicating no lateral stiffness irregularity. The stiffness-to-gravity ratios of the project (i.e., EJD/GH2) along the X- and Y-directions are 5.15 and 4.01, respectively, satisfying the stability requirement and ignoring the second-order gravity effect.
5.3. Elastic Time-History Analysis under Frequent Earthquake Action
This study performed the elastic time-history analysis with SATWE to validate the results with the mode-decomposition response spectrum method and ensure a safe and reliable structure. During the present time-history analysis, two sets of natural waves (TH4 and TH108) and a set of artificial waves (RH2) were used. The durations of these three sets of seismic waves were 40, 34, and 30 s, respectively, which exceeded the greater value between five times the structural natural vibration period (T1) and 15 s. The seismic wave was recorded at an interval of 0.02 s. The peak accelerations of frequent, fortified, and rare earthquake action were 35, 100, and 220 cm/s2, respectively. Figure 6 compares the seismic acceleration response spectrum and the standard response spectrum at the periodic points of the first three orders. The results satisfy the requirement of Article 4.3.5 in JGJ3-2010 [4].
Figure 6.
Comparison of the seismic acceleration response spectra and the standard spectra.
Table 4 lists the calculated results of the bottom shear force using time-history analysis and the vibration mode response spectrum. The bottom shear force of the structure calculated by each time-history curve is not less than 65% of the value calculated with the vibration mode decomposition response spectrum, and the mean shear force of the bottom calculated by the three time-history curves exceeds 80% of the bottom shear force with the vibration mode response spectrum.
Table 4.
Calculation results with elastic time-history analysis.
Figure 7 and Figure 8 depict the story (floor) shear forces obtained via the elastic time-history analysis. The difference between the envelope value of the time-history shear forces of the three seismic waves and the value calculated with the vibration mode decomposition response spectrum method is below 15%. The envelope values using time-history analysis and the vibration decomposition response spectrum method should be taken to analyze the seismic force effect. The shear force amplification coefficient should be automatically considered for each floor (story) in the calculation program.
Figure 7.
The distribution of seismic shear force along the X-direction with the floor (story).
Figure 8.
The distribution of seismic shear force along the Y-direction with the floor (story).
6. Performance-Based Design of the Structure
6.1. Performance Design Objective
To address the overrun problem, the project adopted the anti-seismic performance design. The project is located at the seven-level seismic intensity (0.10 g), with C-class earthquake fortification. The location is in a district that could be better for building seismicity. By considering the functions and scale of the building, the anti-seismic performance of the structure should satisfy the C-class objective in Article 3.11.1 in JGJ3-2010 [4]. Table 5 lists the detailed performance states.
Table 5.
Performance states and damage degrees after fortified and rare earthquakes.
According to the specifications in Articles 3.7.5 and 3.11.3 in JGJ3-2010 [4], the limit value of the elastoplastic interlayer displacement angle of the structure under predicted rare earthquake action is 1/120, and the structure will be moderately damaged in terms of macroscopic failure.
6.2. Performance-Based Design Method
6.2.1. Examination of Equivalent Elasticity of the Component
Under the predicted fortified earthquake action, some of the components in the structure enter the elastoplastic state. However, an equivalent elastic algorithm was adopted for conservative purposes to achieve precise and straightforward calculation and easy quantification. The bearing force on the component was validated, during which the increase in structural damping and the high deduction of beam stiffness were appropriately considered (in this study, the fortified earthquake damping ratio and the deduction coefficient of beam stiffness were set as 0.06 and 0.4, respectively). Under rear earthquake action, most energy dissipation and some vertical components have already entered the elastoplastic state. The elastoplastic deformation and the damage degree of the components were analyzed and examined with dynamic elastoplastic analysis [12,13,14].
Under earthquake action with fortified intensity, the bearing capacity on the normal section of the vertical component should satisfy the specifications in Equation (1), the bearing capacity on the normal section of the vital component in the horizontally long cantilever structure and long-span structure should satisfy the specifications in Equation (2), and the shearing capacity should satisfy the requirement in Equation (3). Some energy-dissipating components have already entered the yield phase. The shearing capacity should satisfy the requirements in Equations (1)–(3) [4].
where sGE is the gravity load; and are the internal forces on the component under horizontal and vertical earthquakes, respectively, without consideration of the anti-seismic-related amplification coefficient; Rk is the limit bearing capacity on the section; Rd is the designed value of the component bearing capacity; and γRE denotes the anti-seismic adjustment coefficient of the bearing capacity.
6.2.2. Elastoplastic Analysis Method and Evaluation Criterion
In the project’s nonlinear seismic response analysis model, the structural components contributing to structural stiffness were simulated with actual conditions. The established nonlinear seismic response analysis model was subdivided into six levels: material model, component model, overall model, damping model, and seismic acceleration time history. The component model was obtained by combining the material’s constitutive characteristics with the component’s sectional geometrical parameters. Next, the overall model was constructed by taking the geometric connection of the component models [15,16,17].
- (1)
- Constitutive relationship of the materials used in structures
Figure 9 shows the dynamic hardening model of steel. The nonlinear material model of steel adopted a bilinear kinematic hardening model, which implied no stiffness hardening during the cyclic process, but considered the Bauschinger effect [18,19]. The ratio of tensile strength to yield strength of the steel used is 1.2, and the ratio of plastic deformation that occurs when the yield reaches the original size of the component is 0.025.
Figure 9.
Illustration of the dynamic hardening model of steel.
The one-dimensional (1D) model of concretes adopted the specified uniaxial constitutive model that reflected some characteristics of concretes, including hysteresis, stiffness degeneration, and strength degeneration. The axial compressive and tensile strengths were set as the standard values in Table 4.1.3 of GB50010-2020 [20], while the stress-strain curve of concretes under tension was calculated according to Equations C.2.3-1~C.2.3-4 in Appendix C [3].
Concrete stiffness dropped when entering the plastic state, as shown in the stress-strain curve and damage chart. The stiffness damage can be described by tensile damage parameter dt and compressive damage parameter dc. The values of dt and dc were determined by the degree of concrete entering the plastic state. The two-dimensional (2D) constitutive model of concretes adopted the elastoplastic damage model, which thoroughly considered the difference in tensile/compressive strengths, stiffness/strength degradation, and stiffness recovery induced by the closure of fractures in tension/compressive cycles [21,22]. As the load changed from tension to compression, the fractures in the concretes were closed, and the compressive stiffness recovered to the original value. When the load changed from compression to tension, the tensile stiffness of the concretes was not restored, as shown in Figure 10.
Figure 10.
Recovery of tensile stiffness and compressive stiffness of concretes.
- (2)
- Component model
As shown in Figure 11, the fiber bundle model was selected as the bar’s nonlinear model mainly for simulating components such as beams, columns, inclined struts, and trusses.
Figure 11.
1D fiber bundle unit.
The fiber bundle can be made of steel or concrete. Given k1, k2, and ε0, the strain of fiber bundle i can be written as ε1 = k1 × hi + ε0 + k2 × vi, and the sectional bending moment M and axial force N can be written as:
where is the stress on the fiber calculated based on the above-described constitutive relation.
It should be noted that the beam unit’s axial force action and axial extension/contraction are quite apparent when entering the plastic state. Accordingly, the coupling effect between bending and axial force should be considered for beams and columns.
- (3)
- Overall model
The finite element analysis of building structures generally adopts a rigid floor assumption to reduce the computational load. It constrains the relative distances of X and Y at each node in the same layer with node coupling. The assumption can be acceptable in small-deformation and elastic phases. However, in the elastoplastic phase with great deformation, particularly for super-high buildings, the top displacement generally exceeds 1 m, and the upper floor has already experienced apparent inclination. If various nodes in the same layer still adopt the relative horizontal distances of X and Y at the beginning, the nodes can deviate from their positions, resulting in a calculation error.
The floor will be cracked during the nonlinear process to reduce the in-plane stiffness. Accordingly, it can also generate specific effects on the stiffness distribution of various lateral-resisting components and shear transfer. Therefore, the rigid floor assumption was not adopted for the present nonlinear analysis, and various floors were uniformly divided into shell elements for further analysis.
- (4)
- Damping model
During the dynamic time-history analysis, the damping value can significantly affect the structure’s dynamic response amplitude. The mode damping ξ is generally selected to characterize the damping ratio. In contrast, immediate integration is used in the elastoplastic analysis, and both structural stiffness and vibration modes show altitude variation and cannot be directly substituted into the mode damping. Rayleigh damping, including mass damping and stiffness damping , is generally adopted for simulating mode damping [3]. Rayleigh damping and the conversion relation with mode damping have the following forms:
where [C] is the structure’s damping matrix; [M] and [K] are the structure’s mass and stiffness matrices, respectively; and ω1 and ω2 denote the first and second periods of the structure, respectively.
- (5)
- Seismic motion acceleration time history
According to the requirements of seismic design specifications, the waves used in the elastoplastic time-history analysis under rare earthquake action should comply with the following conditions.
The characteristic period is close to the site’s one characteristic period and can be prolonged by 0.5 s under rare earthquake action for safety purposes.
According to the requirements in the specifications, the duration should be 5~10 times greater than the structure’s first period.
The acceleration response spectrum corresponding to the time history wave should be identical to the specified response spectrum at the structure’s period point.
The maximum peak of the seismic wave should satisfy the requirements in the specifications and is set as 0.22 g in this study under rare earthquake action.
Based on the above requirements, this study selected a set of artificial waves and two sets of natural waves for elastoplastic dynamic time history analysis.
6.3. Analysis under Fortified Earthquake Conditions Based on Performance Objectives
The components under fortified earthquake action were examined via the equivalent elastic algorithm using the structure’s elastic calculation parameters listed in Table 6.
Table 6.
Elastic calculation parameters under fortified earthquake conditions.
Under the predicted fortified earthquake action, the oblique sections of all vertical components satisfied the medium-earthquake elastic requirement. The normal sections of all vertical components satisfied the medium-earthquake unyielding requirement. Meanwhile, some energy-dissipating components (such as the shear wall, even beams, and framed girders) have entered the yield state. Nevertheless, the oblique sections satisfied the medium earthquake unyielding requirement. The shear wall column from the 1st to the 13th floor showed a slight eccentric tensile state; however, the nominal tensile stress should be smaller than twice the standard value of the tensile strength of concretes. Structural steels were set for bearing tensile stress for the wall column, with the nominal tensile stress ranging between the standard value of the tensile strength of concretes and twice. All the remaining small-eccentricity tensile concrete components were constructed according to the special grade-one standard. The component reinforcement was designed following the envelope of frequent and medium earthquake action. The performed analysis revealed that the project exhibited excellent anti-seismic performance under the predicted fortified earthquake action.
6.4. Dynamic Elastoplastic Analysis under Rare Earthquake Action Based on Performance Objectives
Dynamic elastoplastic analysis under rare earthquake action was performed using the SAUSAGE program. The characteristic period increased by 0.05 s, and the value of Tg was set as 0.44 s. This study selected two natural waves (TH4 and TH09) and one artificial wave (RH2) for analysis. Under different earthquake actions, the maximum top displacements and the maximum interlayer displacement angles in the case of elastoplastic large earthquakes were calculated, as listed in Table 7.
Table 7.
Displacements and interlayer displacement angles under different working conditions.
According to the calculation results, the maximum interlayer displacement angles along the X- and Y-directions under rare earthquake action were 1/333 and 1/312, respectively. Being below 1/120, both values satisfied the anti-seismic requirement.
According to the dynamic elastoplastic analysis results, the vertical components in the bottom reinforcement parts and the transition layer were partly finely damaged, and some were only slightly damaged; the vertical components in the other floors were slightly damaged to varying degrees, and some were moderately damaged; and most of the coupling beams entered into the yield state, and some were severely damaged, suggesting that coupling beams significantly contributed to energy dissipation. The structure satisfied the anti-seismic action. Figure 12 shows the state of the shear wall under the RH2-x great earthquake, and Figure 13 illustrates the statistics on beam performance indices.
Figure 12.
Performance indices of RH2-x shear wall (from southeast view).
Figure 13.
Statistics on coupling beam performance indices.
In addition, under rare earthquake action, the floors were partly finely damaged, while some were slightly damaged. The floors in the mid-waist part were locally finely damaged, but no moderate damage appeared. This suggests that the structure did not affect safety and can satisfy anti-seismic performance. Conclusively, the structure satisfied the anti-seismic performance requirement under rare earthquake action.
7. Discussion
We obtained a simple and smooth performance-based design method for super high-rise buildings with reinforced concrete shear walls through the above structural calculation and analysis. The case introduced in the paper has been delivered for use. Currently, the foundation and superstructure conditions meet the design performance goals. The main structure will still be regularly monitored in the future to provide more data support for the design of similar buildings. For components or local floors with poor seismic performance encountered in the actual design process, it is also possible to strengthen the design by setting performance targets under moderate or large earthquakes to meet seismic safety issues, providing a safe and reliable design idea for solving this problem.
This article has good reference significance for the structural design of similar high-rise buildings beyond the limit in the future. Still, other structural systems’ corresponding calculation steps and performance-based objectives should be analyzed separately.
8. Conclusions
This study employed SATWE and MIDAS GEN software packages to perform frequent earthquake analysis and force conditions under fortified earthquake action. Using PKPM-SAUSAGE software (version 1.2), it also analyzed elastoplastic dynamic time history under rare earthquake conditions. The main conclusions were drawn as follows.
Under preset fortified earthquake action, the oblique sections of all vertical components satisfied the medium-earthquake elastic integrity requirement. In contrast, the normal sections of all vertical components satisfied the medium-earthquake unyielding requirement. Meanwhile, some energy-dissipating components (the coupling beams on the shear wall and the framed girders) entered the yield state; however, the oblique sections all satisfied the medium-earthquake unyielding requirement. Under the predicted fortified earthquake action, the shear wall columns of the structure from the 1st to 13th layers underwent a small-eccentricity tensile state; however, the nominal tensile stress should be smaller than double the standard value of the tensile strength of concretes. Structural steels should be arranged to bear the tensile forces of wall columns with nominal tensile stresses ranging between the standard tensile strength of concrete and its doubled value. The small-eccentricity tensile concrete components were constructed according to the special grade-one standard. The structure showed good anti-seismic performance under fortified earthquake action.
The structure remained upright under rare earthquake action. The maximum elastoplastic interlayer displacements along the X- and Y-directions were 1/333 and 1/312, respectively. Overall, the elastoplastic deformation indices satisfy the requirements. Only a few vertical components in the bottom reinforcement region were slightly damaged, satisfying the anti-seismic requirement. In contrast, the remaining ordinary vertical components were partly slightly damaged, and only a few were moderately damaged under rare earthquake action, satisfying the anti-seismic requirement. The coupling beams of the shear wall mostly entered the yield state under rare earthquake action. Some coupling beams were moderately or heavily damaged, suggesting they fully realized their potential in energy dissipation and protected vertical components. These coupling beams satisfied the anti-seismic requirements. The project was qualified in terms of anti-seismic design.
Conclusively, the structure showed excellent anti-seismic performance and complied with the preset anti-seismic performance index limits under fortified and rare earthquake actions. This study introduces a comprehensive and straightforward performance-based design method and process for high-rise concrete buildings that exceed the limits, and additionally verifies the safety and effectiveness of the design method through observation of the service state after completion. This performance-based structural design method not only adapts to the diverse development of building schemes and provides a sustainable path for the structural design industry, but also improves the reliability of human living building environments, thereby promoting the development of human living and well-being.
Author Contributions
Conceptualization, Q.L.; methodology, Q.L.; software, Q.L.; validation, Q.L.; formal analysis, Q.L.; investigation, Q.L.; resources, J.W.; data curation, G.L.; writing—original draft, J.W.; writing—review and editing, G.L.; visualization, Q.L.; supervision, J.H.; project administration, J.H.; funding acquisition, J.H. All authors have read and agreed to the published version of the manuscript.
Funding
The Innovative Research Team Project of Natural Science Foundation of Hainan Province, P. R. China (522CXTD511), and the High Technology Direction Project of the Key Research and Development Science and Technology of Hainan Province, China (ZDYF2021GXJS020).
Institutional Review Board Statement
This study does not involve research on humans or animals.
Informed Consent Statement
This study does not involve research on humans.
Data Availability Statement
The copyright of the detailed model data belongs to the design company.
Conflicts of Interest
The authors declare no conflict of interest. The funders had no role in the study’s design; in the collection, analyses, or interpretation of data; in the writing of the manuscript; or in the decision to publish the results.
References
- Choi, Y.; Hajyalikhani, P.; Chao, S.H. Seismic performance of innovative reinforced concrete coupling beam-double-beam coupling beam. ACI Struct. J. 2018, 115, 113–125. [Google Scholar]
- Almasabha, G.; Tarawneh, A.; Saleh, E.; Alajarmeh, O. Data-driven flexural stiffness model of FRP-reinforced concrete slender columns. J. Compos. Constr. 2022, 26, 04022024. [Google Scholar] [CrossRef]
- GB 50011-2010; Code for Seismic Design of Buildings. China Construction Industry Press: Beijing, China, 2010.
- JGJ 3-2010; Technical Regulations for Concrete Structures of High-rise Buildings. China Construction Industry Press: Beijing, China, 2011.
- GB50068-2018; Uniform Standard for Structural Reliability Design of Buildings. China Construction Industry Press: Beijing, China, 2018.
- Cao, X.Y.; Feng, D.C.; Beer, M. Consistent seismic hazard and fragility analysis considering combined capacity-demand uncertainties via probability density evolution method. Struct. Saf. 2023, 103, 102330. [Google Scholar] [CrossRef]
- Almasabha, G.; Chao, S.H. A new reinforcing configuration for achieving high-ductility and high-strength rectangular squat structural walls. ACI Struct. J. 2023, 120, 253–268. [Google Scholar]
- Technical Points for a Special Review of Seismic Protection of Super-High-Rise Building Projects: Building Quality [2015]; No. 67; Ministry of Housing and Urban-Rural Development of the People’s Republic of China: Beijing, China, 2015.
- Buitrago, M.; Calderón, P.A.; Moragues, J.J.; Alvarado, Y.A.; Adam, J.M. Load limiters on temporary shoring structures: Tests on a full-scale building structure under construction. J. Struct. Eng. 2021, 147, 04020345. [Google Scholar] [CrossRef]
- Su, J. Rules for Review of Seismic Provisions of Housing Construction Projects in Jiangsu Province, 2nd ed.; No. 302; China Construction Industry Press: Beijing, China, 2016. [Google Scholar]
- Cao, X.-Y.; Shen, D.; Feng, D.-C.; Wang, C.-L.; Qu, Z.; Wu, G. Seismic retrofitting of existing frame buildings through externally attached sub-structures: State of the art review and future perspectives. J. Build. Eng. 2022, 57, 104904. [Google Scholar] [CrossRef]
- De-La-Colina, J.; Valdes-Gonzalez, J. Forced-vibration tests of a reinforced concrete four-story building structure. J. Struct. Eng. 2021, 147, 04721004. [Google Scholar] [CrossRef]
- Wang, L.P.; Luo, W.W.; Liu, S.W.; Zhang, W.; Jiang, L.; Yang, S. Experimental study on the force mechanism and seismic performance of RC beam-column nodes considering the beam axial restraint effect. Eng. Mech. 2020, 37, 10. [Google Scholar] [CrossRef]
- Takagi, J.; Wada, A. High-performance seismic-resistant structures for advanced cities and societies. Engineering 2019, 5, 9–21. [Google Scholar] [CrossRef]
- Li, S.; Slomski, E.M.; Melz, T. Numerical uncertainty analysis of active and passive structures in the structural design phase. Procedia Eng. 2017, 199, 1240–1245. [Google Scholar] [CrossRef]
- Lin, P.-C.; Tsai, K.-C.; Wu, A.-C.; Chuang, M.-C.; Li, C.-H.; Wang, K.-J. Seismic design and experiment of single and coupled corner gusset connections in a full-scale two-story buckling-restrained braced frame. Earthq. Eng. Struct. Dyn. 2015, 44, 2177–2198. [Google Scholar] [CrossRef]
- Hu, S.Y.; Luo, J. Uncertainty quantification for structural optimal design based on evidence theory. J. Shanghai Jiaotong Univ. 2015, 20, 338–343. [Google Scholar] [CrossRef]
- Liu, J.F. Analysis of the causes of typical torsional irregularities and improvement measures. Build. Struct. 2020, S01, 7. [Google Scholar]
- Zand, J.P.; Sabouri, J.; Katebi, J.; Nouri, M. A new time-domain robust anti-windup PID control scheme for vibration suppression of building structure. Eng. Struct. 2021, 244, 112819. [Google Scholar] [CrossRef]
- GB 50010-2020; Code for Design of Concrete Structures. China Construction Industry Press: Beijing, China, 2020.
- Luo, K.H.; Bao, H.E.; Zuo, Q. Analysis of RC frame structures’ seismic design and control factors under different fortification intensities. J. Build. Struct. 2021, 42, 128–136. [Google Scholar]
- Buitrago, M.; Bertolesi, E.; Sagaseta, J.; Calderón, P.A.; Adam, J.M. Robustness of RC building structures with infill masonry walls: Tests on a purpose-built structure. Eng. Struct. 2021, 226, 111384. [Google Scholar] [CrossRef]
Disclaimer/Publisher’s Note: The statements, opinions and data contained in all publications are solely those of the individual author(s) and contributor(s) and not of MDPI and/or the editor(s). MDPI and/or the editor(s) disclaim responsibility for any injury to people or property resulting from any ideas, methods, instructions or products referred to in the content. |
© 2023 by the authors. Licensee MDPI, Basel, Switzerland. This article is an open access article distributed under the terms and conditions of the Creative Commons Attribution (CC BY) license (https://creativecommons.org/licenses/by/4.0/).