Article

A Comparative Examination of the Electricity Saving Potentials of Direct Residential PV Energy Use in European Countries

by
Henrik Zsiborács
,
András Vincze
,
Gábor Pintér
* and
Nóra Hegedűsné Baranyai
Renewable Energy Research Group, University Center for Circular Economy, University of Pannonia Nagykanizsa, 8800 Nagykanizsa, Hungary
*
Author to whom correspondence should be addressed.
Sustainability 2023, 15(8), 6490; https://doi.org/10.3390/su15086490
Submission received: 26 February 2023 / Revised: 4 April 2023 / Accepted: 10 April 2023 / Published: 11 April 2023

Abstract

:
The increasing global penetration of photovoltaic (PV) technology creates not only enormous opportunities for clean energy production but also poses challenges that put energy systems to the test. Although there are many ways of dealing with the rising share of PV energy, most of these solutions require substantial funding, time, and effort to implement, which highlights the importance of solving some of the issues at their source, i.e., through the direct use of the electricity generated at PV power plants, many of which are owned and operated by households. In recent decades, PV technology has experienced an unprecedented growth in Europe due to a range of reasons, including the nations’ policies and supporting schemes. The goal of the present research was to determine the annual consumption of electricity per capita in the households of certain European countries and how much of this can be covered by the direct use of PV energy in the case of an on-grid PV system and to show what the annual potential of the direct use of PV energy is compared to the annual energy production of the PV systems. The significance and novelty of this research is justified by the lack of comparative scientific studies related to the annual potential of the direct household use of PV energy, which could alleviate some of the problems facing electricity networks with high shares of PV energy. The novel practical benefit of the study was determining, for the examined European countries, the extent to which direct household PV energy use could lower annual electricity consumption from the grid, in the case of on-grid PV systems of different capacities. In addition, these findings also provide information related to the grid’s macro-energy systems in terms of local network load effects related to given investment sizes.

1. Introduction

Energy transition, which is the process of transforming the world’s energy systems from the old, fossil-based ones to something fundamentally new [1,2], is primarily aimed at decreasing global carbon emissions to mitigate climate change [3,4]. The global effects of this change, and therefore decarbonization, are also manifest [5] in the growing proportion of renewable sources of energy used for producing electric energy [6,7]. This worldwide development is supported by a number of factors, including the falling expenses of renewable energy investments, thanks to encouraging energy policy measures and rapid technological advancements [8,9], which may even mean in certain cases that the costs associated with the newest technologies using renewable energy sources (RES) are lower than those of installations using fossil fuels [10].
Besides the above-mentioned climate policy goals, the shift to renewable energy (RE) systems also serves the more general objectives of achieving continuing sustainability [11,12], which is becoming a crucial aspiration of more and more governments all around the globe, involving various policies and actions to effectively transform the sectors of transportation, industry, and commerce in the foreseeable future [13]. A vital role in this current energy transition is played by solutions deploying solar photovoltaic (PV) technology [14], as PV technologies represent a favored solution for low-carbon power generation [15] in both decentralized and centralized systems [16] due to their numerous benefits, such as being plentiful and easily accessible with a comparatively low impact on the environment [17,18]. The efficiency of PV systems can be enhanced even further by connecting them to the grid, which is presently the most prevalent method of solar PV deployment [19]. Since such installations offer a long-term reduction in expenses coupled with a high level of reliability, little need for maintenance, and huge potentials for technological advancement [20], the spread of grid-connected PV systems has been unprecedented around the world [10,21]. These systems are normally available in a wide variety of capacities ranging from a couple of hundred watts with a solitary module to many megawatts in enormous, ground-mounted power plants. This, in turn, means that electricity companies need to tackle the challenges of coping with very different connection requirements with differing network connections and voltages. The great differences in the details of the elements of grid-connected PV systems resulting from different system sizes, however, do not affect the general concepts, which remain unchanged [22]. Furthermore, the dramatic drop in the global prices of PV technology over the past ten years or so has led to a situation in many countries where the prices of electricity generated by PV panels and those of power from the grid have become essentially the same [23].
The use of renewable energies, such as PV energy, is on the rise in households as a way to decrease energy costs [24,25,26]. Many EU countries have implemented policies to encourage the development of self-consumption of renewables, with a focus on PV. Among these countries, Germany, where PV also enjoys great popularity with the households, is in the leading position in Europe in terms of the adoption of this technology, thanks to its feed-in tariff policy [23,27]. Other nations, including Italy and Hungary, have provided support to PV self-consumption in the form of introducing net-metering schemes [28], while Portugal made it possible to sell excess PV power to the grid at wholesale prices in 2014 [29].
Besides the tremendous opportunities for producing clean, renewable electric energy that PV technologies offer, their dynamically growing worldwide penetration also creates difficulties for energy systems, mostly due to the variable nature of solar power itself. The intermittency of PV power generation and its variation throughout the year can lead to a discrepancy between the demand by end-users and the electricity supplied by PV power plants. As a result, the surplus has to be fed into the grid instead of self-consumption [30]. For all these reasons, integrating RES into various electricity systems is bound to pose a multitude of issues, which is further exacerbated by the growing number of grid-connected PV systems within the medium voltage network, leading to more and more difficulties related to reliability and stability [31,32,33]. Other negative consequences may include the increased presence of harmonics in the systems, resulting in a rise in the amount of total harmonic distortion (THD) [21], and the occurrence of reverse power flow when the PV power supply is greater than the demand [34]. The latter may cause instabilities in the network, such as fluctuations in voltage level and frequency due to more electricity flowing to the transmission system from the distribution. From all these, it follows naturally that the rising number of PV installations [35,36] will make new integrated control strategies indispensable for the management and operation of new electricity networks [21].
Inspired by the above insights, the aim of this research was to determine, in the context of several European countries, on the one hand, the amount of annual electricity per capita that can be saved in domestic consumption from the grid by the direct use of PV energy by means of on-grid PV systems of different capacities, and, on the other hand, to establish the annual potential of the direct use of PV energy compared to the annual energy production of the given PV systems. The fundamental importance and innovative novelty of the present study is that there is currently no available comparative scientific study regarding PV technology that determines the annual potentials of the direct use of PV energy in the context of European households. The significance of which, in turn, is that increasing the proportion of electric energy produced by household PV power plants and directly consumed by the households themselves can be seen as a way of alleviating the problems caused the presence of too much PV energy in the networks at times of peak production, benefitting both the prosumers and the networks, in general. The research results will also provide practical assistance to those designing or using PV systems, as there is currently a lack of knowledge on the extent to which direct PV energy use per capita could reduce households’ annual electricity consumption from the grid in the case of on-grid PV systems of different capacities.
The present paper follows the structure below: section two introduces the methods used in the study of the examined topic, while sections three and four present the results and related discussion and the conclusions, respectively.

2. Materials and Methods

The methodological solutions used to determine the electricity consumption characteristics of the countries studied as well as the modelling aspects are presented in two chapters. The methodology of the study followed the structure below:
  • Determining the annual electricity consumption per capita in the households of the European countries studied;
  • Determining the monthly quantity and percentage distribution of the annual household electricity consumption per capita of the European countries studied;
  • Determining the average European hourly household electricity consumption as a percentage of the daily consumption;
  • Establishing the average residential electricity consumption quantities in an hourly breakdown for the given months, expressed in terms of average power for the modeling software;
  • Defining PV capacities, importing temperature, orientation, and radiation data for the studied areas, and implementing modeling based on these.

2.1. Determining the Electricity Consumption Characteristics of the Countries Studied

2.1.1. Determining the Annual Electricity Consumption per Capita in the Households of the European Countries Studied

The research determined the annual household electricity consumption per capita for the year 2020 for the following 42 European countries:
ENTSO-E members:
Albania, Austria, Belgium, Bosnia and Herzegovina, Bulgaria, Croatia, Cyprus, Czech Republic, Denmark, Estonia, Finland, France, Germany, Greece, Hungary, Iceland, Ireland, Italy, Latvia, Lithuania, Luxembourg, Montenegro, Netherlands, Republic of North Macedonia, Norway, Poland, Portugal, Romania, Serbia, Slovakia, Slovenia, Spain, Sweden, Switzerland.
Non-ENTSO-E members:
England, Georgia, Kosovo, Malta, Moldova, Scotland, Turkey.
For most of these countries, the annual household electricity consumption per capita was determined based on the Eurostat database [37]. This database, however, contained no such information for England, Scotland, or Switzerland. In the cases of England and Scotland, these data were provided by the database Statista Inc. (New York, NY, USA) [38]. For Switzerland, the data could be inferred with the help of information from the Swiss Federal Statistical Office, using Austria as parallel, as annual electricity consumption per capita is very similar in the two countries [39] (Figure 1).
In the modelling program used in the research (Section 2.2), the average amount of residential electricity consumption was given as input data in an hourly breakdown, expressed in terms of average power for the given month. This information is not made available to the public by energy companies, so access to these figures is limited. These data were generated with the help of the ENTSO-E Transparency Platform [7] (hereinafter referred to as the Platform) and the research conducted by Kmetty et al. in 2016 [40]. The monthly percentage distribution of the annual electricity consumption by the populations of the countries studied was determined using the Platform [7], while the daily percentage distribution of the monthly quantities was based on the work of Kmetty et al. [40]. The research examined those countries (32 in total) for which it was possible to access information on their national electricity consumption, which, in the case of Europe, was available publicly only on the Platform. These countries were: Austria, Belgium, Bosnia and Herzegovina, Bulgaria, Croatia, Czech Republic, Denmark, England, Estonia, Finland, France, Germany, Greece, Hungary, Ireland, Italy, Latvia, Lithuania, Luxembourg, Montenegro, Poland, Portugal, Romania, Scotland, Serbia, Slovakia, Slovenia, Spain, Sweden, Switzerland, Netherlands, Norway.

2.1.2. Determining the Monthly Quantity and Percentage Distribution of the Annual Household Electricity Consumption per Capita of the European Countries Studied

The purpose of the ENTSO-E Transparency Platform is to make European electricity market data available to all users free of charge [7]. Based on the information provided by the Platform, it was possible to determine the monthly distribution of the annual electricity consumption of the countries examined. On the Platform, statistical data could be extracted regarding the monthly and intraday hourly distribution of the network loads from the total load data of the electricity grids of the individual European countries. Data from the year 2021 were used for the research, but in the case of the United Kingdom, 2020 data were used. This was due to the fact that the UK’s data provision on its electricity consumption to the Platform ceased after 14 June 2021. The UK’s annual electricity consumption distribution data were also taken into account for Scotland and England. The Platform’s measurement range varies from country to country, including hourly, half-hourly and quarter-hourly measurements. In the analyses, the calculations were made using energy (MWh) units instead of power (MW). In the case of half-hourly measurements, the MW values had to be divided by two, and in the case of the quarter-hourly ones, by four, so that instead of power, the power consumption for the given period was determined. However, for the hourly measurements, the power and the power consumption values were obviously the same. The electricity consumption figures were obtained from the country-specific database of the Platform [7] by using the method below:
  • The data from the Platform [7] and their monthly organization were downloaded;
  • From the national energy consumption data, country-specific electricity consumption values for each hour of the day were determined in a monthly breakdown, using data filtering;
  • The amount of energy produced during the month (Emonth) was prorated to the annual amount of energy produced (Eyear), the monthly percentage distributions of which were also expressed:
E m o n t h l y   e n e r g y   r a t e = E m o n t h E y e a r
E m o n t h l y   e n e r g y   r a t e   % = E m o n t h E y e a r × 100 %
The results were compared with data from Kmetty et al., 2016 [40], as the data on national network load included not only the residential segment, but also the non-residential sector (e.g., industry). It was, therefore, necessary to determine whether the monthly percentage distributions of the country-specific annual electricity consumption established with the help of the Platform adequately reflected the monthly characteristics of residential electricity consumption. This was performed on the basis of the research conducted by Kmetty et al., 2016 [40], which analyzed in detail the load profiles related to residential electricity consumption in the European Union using thousands of pieces of real data. Their work describes the distribution of electricity consumption in the households of four European countries. The monthly and daily analyses of the data show that there were no significant differences in the patterns of household consumption in the United Kingdom, Ireland, Italy, and Hungary. In addition, comparing their monthly results to the national monthly consumption patterns from the Platform, there appears to be no significant difference regarding the examined countries. The differences between the distributions of household energy consumption reported in the study by Kmetty and his colleagues [40] and the ratios of the Platform’s national energy consumption showed that the differences ranged from 0 to 1.9% on a monthly basis. For the four countries examined, it can be seen that, with the exception of the winter months, the differences in the monthly distributions did not even reach 1 percentage point. This suggests that the monthly household electricity consumption profiles may be well approximated by the national data from the ENTSO-E Platform (Table 1).

2.1.3. Determining the Average European Hourly Household Electricity Consumption as a Percentage of the Daily Consumption

The average hourly household electricity consumption values were then established as percentages of the daily consumption figures (100%) (Ehour, average%), based on the annual electricity consumption data following the study by Kmetty et al. [40] (Figure 2). The results showed that in the case of the four countries, changes in the total and household electricity consumption data over time showed similar trends, but there were differences of magnitude in the early morning and evening hours. Furthermore, the comparison of the hourly percentage distributions of the daily household electricity consumption in the four countries (Figure 2) showed that their consumption patterns did not differ significantly. This was also confirmed by the fact that the CV% of the average values calculated from the percentage of hourly electricity consumption in the four countries shows a value below 10% every hour (with the exception of the nighttime, but the CV% does not exceed 18% in these cases either). For the above reasons, bearing in mind the aim of approximating the characteristics of daily household consumption as best as it was possible in the absence of available data, the average hourly household consumption pattern, as defined above, was applied for the 32 countries examined.

2.1.4. Establishing the Average Residential Electricity Consumption Quantities in an Hourly Breakdown for the Given Months, Expressed in Terms of Average Power for the Modeling Software

Based on the above, we derived the monthly percentage distributions of the annual household electricity consumption per capita (Figure 1) for the countries studied using the data from the Platform (Table 1). The average daily electricity consumption (Emonthly daily average) for a given month was determined as the quotient of the total energy consumption of that month divided by the number of days:
E m o n t h l y   d a i l y   a v e r a g e = E m o n t h D a y s   o f   m o n t h s
The values of the hourly percentage distribution (Ehour, average%) were taken from the above-mentioned source [40], where the averages of the four examined countries were taken into account (Figure 2). The average consumption of a given hour of a given month was defined as the product of the average daily electricity consumption multiplied by the percent value of the day’s consumption in the given hour.
E m o n t h l y   a v e r a g e ,   g i v e n   h o u r   o f   t h e   d a y = E m o n t h l y   d a i l y   a v e r a g e × E h o u r ,   a v e r a g e   %

2.2. Description of the Aspects of Modelling Used in the Research

The following section describes the modelling platform used in the research, the PV capacities used for modelling, the imported temperature, orientation, and radiation data for the studied areas, and the modeling process.

2.2.1. Introducing the Modeling Platform

Among the many platforms, such as H2RES [41], EnergyPLAN [42], SOMES, Hybrid2, ARES, INSEL, and iHOGA [43], that are used for simulating standalone systems, together with all their elements and the connections between them [39], our choice for performing the modelling tasks in this investigation was HOMER Pro. HOMER (Hybrid Optimization Model for Multiple Energy Resources) is a popular solution for planning and optimizing energy systems [43,44], and HOMER Pro [45] is a software initially created at the National Renewable Energy Laboratory in the USA which was later further developed and distributed by HOMER Energy, specifically focusing on micro-grids for the optimization of microgrid design in a wide range of fields. HOMER is really versatile, as it combines several important functions, taking both economic and technical aspects into consideration. It is designed to simulate workable systems for every equipment configuration (Hybrid Optimization Model for Multiple Energy Resources). It is capable of simulating the whole annual operation of any hybrid micro-grid in various breakdowns ranging from one minute to sixty minutes [46]. The HOMER solution has been used in many scientific works to research energy problems, including [43,44,46,47,48,49,50,51], and it is proven to be able to estimate real energy situations with high accuracy [51]. These circumstances also justified the use of HOMER Pro in the current study.
This study examined household on-grid PV systems. A feature of such systems is that they are directly connected to the local utility network. If the PV system in a given location generates more electricity than the household’s own consumption, the excess is fed into the grid. These types of PV systems do not use an energy storage system. The following are the components of a common residential, grid-connected PV system:
  • PV modules;
  • Special switchgear and DC cable used to connect the PV modules to the inverter;
  • Inverter for converting DC current to AC current and for providing the necessary protection prescribed by the electricity companies;
  • Common AC wiring, switchgear, and metering equipment linking the PV generator to the consumer unit of the house and the incoming service [22].
The modelling tasks involved in the research were performed taking into account the indicated technical equipment.

2.2.2. Creating the Load Profile

In the first step in the modelling processes, the average residential electricity consumption quantities in an hourly breakdown had to be entered, expressed in terms of average power for the given month (Section 2.1), which formed the so-called load profile in the HOMER program. In Section 2.1, it was explained in detail how the data required for the load profile were obtained based on the Platform [7] and the work of Kmetty et al., 2016 [40]. The modelling software recommended random variability for the hourly data of the load profile performance values. The program also suggested values that were assumed to be 10% both for the variations in the power figures between days and within each day, due to the differences in residential energy consumption patterns.

2.2.3. Setting the Analyzed PV Capacities

In the second step of the modelling procedure, it was necessary to determine the size of the on-grid PV system that would be installed for a given household to reduce the annual electricity demand from the grid. On-grid PV systems of various capacities (0.5 kW, 1 kW, 2 kW, 3 kW, 4 kW, and 5 kW) were examined due to the differing electricity consumption patterns of the countries.
HOMER Pro has a detailed catalogue of the types and technical parameters of PV modules and inverters, and this database can be customized by expanding and specifying it if required. For the purposes of the research, concerning the technical parameters of the PV module, the temperature coefficient of Pmax was assumed to be −0.38%/°C and the efficiency 19%, while in the case of the inverter, the efficiency was defined as 97% [52]. During the modelling, the power values of the PV module as well as those of the inverter varied according to the capacity of the PV system. This posed no problem, as HOMER Pro allows users to modify the power values of the PV system easily.

2.2.4. Imported Radiation and Temperature Data

To determine the annual energy yield of a PV system, it is necessary to know the radiation and temperature characteristics of the given area. Therefore, the research results for the capitals of the European countries studied are presented. Although the climatic conditions of a given capital city are not always representative of a given country, since the investigations included several countries with large geographical areas, the proportion of the population living in the capital cities (including their metropolitan areas) and their economic and general significance justified the use of their data.
HOMER Pro is able to determine the solar global horizontal irradiance (GHI) for any location in the world using the NASA Prediction of Worldwide Energy Resources (POWER) database. The data were used to determine the average kWh/m2/day daily radiation value per year, and for a given month, for the area examined, as well as the average clearness index in a monthly breakdown. Based on the radiation conditions of the area, the program also suggested optimal slope and azimuth characteristics for the PV system, which were used as a basis for the research. In addition, the monthly average and annual temperature values were determined from the POWER database to simulate the temperature conditions of the PV modules. The annual average global horizontal irradiance, the temperature data, and the average annual energy that can be produced by a 1 kW on-grid PV system in each country are summarized in Table 2.

2.2.5. Relationships Connected to the Modelling

The annual energy production values of the PV systems were obtained from the simulation results of the HOMER program. The amount of direct PV energy use (Edirect PV) was given by the difference between the annual electricity consumption (Ehousehold) in Figure 1 and the annual amount of energy purchased from the grid (Epurchased) from the simulation results of the HOMER program.
E d i r e c t   P V = E h o u s e h o l d E p u r c h a s e d
The amount of unused energy (fed into the grid) (Esold) was the difference between the annual energy production of a PV system (EPV) of a given size and the direct PV energy use (Edirect PV).
E s o l d = E P V E d i r e c t   P V
The study calculated the annual distribution of direct PV energy use per household per capita for different PV capacities in relation to the annual energy production of the PV system. These results also provide information on the amount of unused PV energy. The amount of PV energy fed into the grid also gives an insight into the grid load effects associated with a given PV capacity.
The research also shows, for PV systems of different capacities, the share of annual household grid electricity consumption that could be saved by direct household PV energy use. These annual per capita per household percentages were calculated as the direct use of PV energy divided by grid electricity consumption.

3. Results

3.1. Monthly Percentage Distribution of the Annual Electricity Consumption in European Countries

Based on the information from the Platform, the monthly distributions of the annual electricity consumption of the countries studied were determined (Table 3). These results clearly illustrate the monthly patterns of electricity consumption in a given country. It can be seen that countries located further north, such as Norway, Sweden, and Finland, have lower electricity demand in the summer months and higher demand in the winter months. In contrast, countries further south show smaller differences in the monthly percentage distributions of electricity consumption. The results provided information for the formulation of the load profiles of the given countries (Section 2.1 and Section 2.2).
  • The greener the shade of green, the less electricity is used in the given month compared to the whole year. Dark green represents a difference of 6.3%, as this is the lowest value in the table.
  • The redder the value, the greater the amount of electricity used in a given month is relative to the whole year. Red represents a difference of 11.3%, as this is the highest value in the table.
  • The more the color of a value deviates from green to yellowish, orange, and then reddish, the higher the volume of electricity used in that month was relative to the whole year.

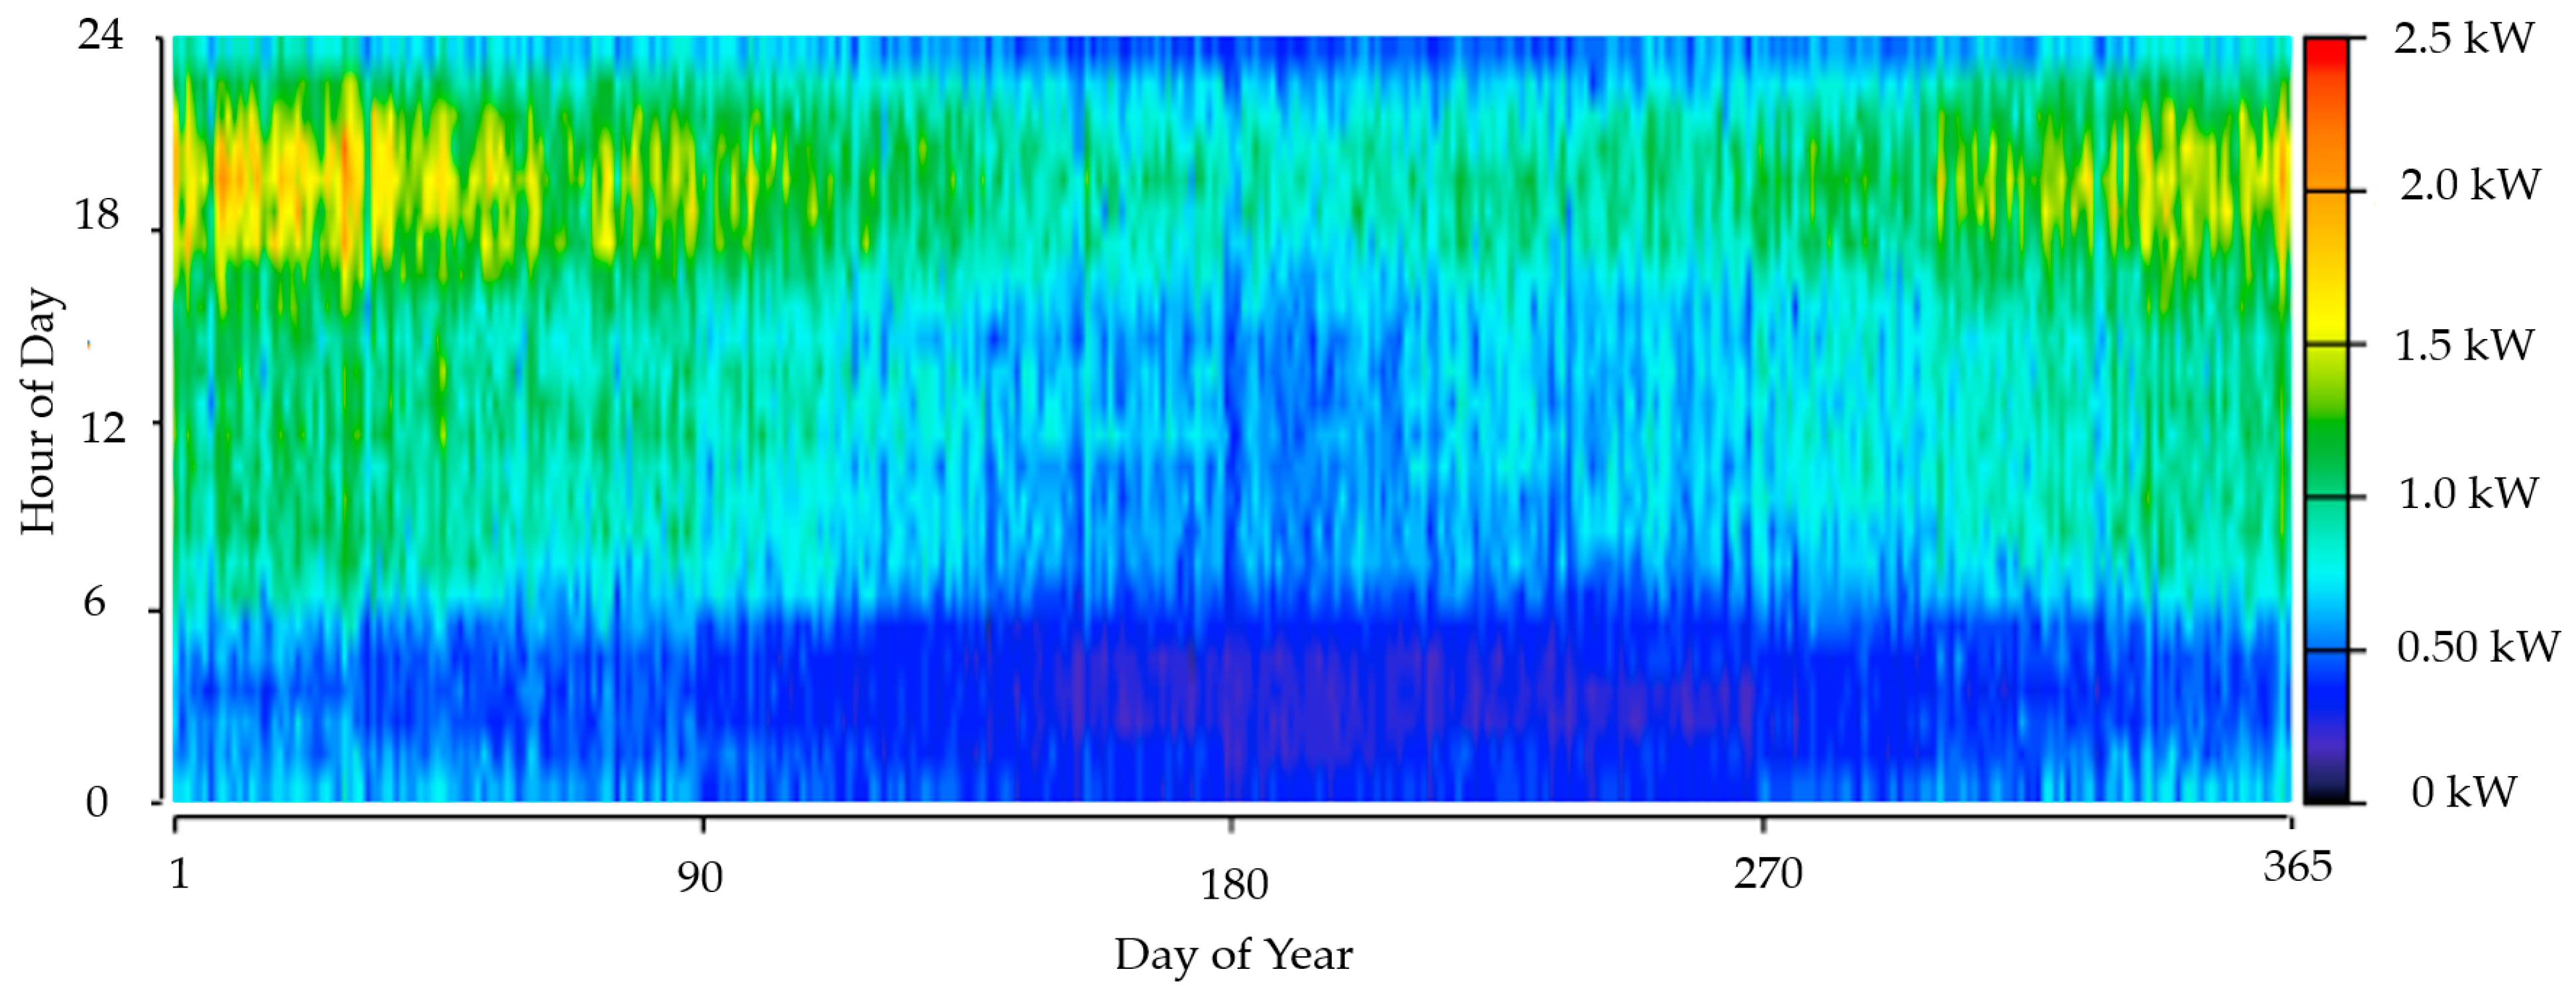
3.2. Demonstration of the Simulation Processes of the Research Results using Norway as an Example

Below, the example of Norway, which was selected to illustrate the simulation processes of the Homer program and their results, is introduced. This is meant to visually present the calculation methods used in the program for easier comprehension. It is important to note that, besides Norway, the other countries could have also been appropriate to illustrate the simulation processes; therefore, the logical essence of Figure 3, Figure 4 and Figure 5 was the same for all countries.
Section 2.2 described the meaning of the load profile and also explained that random variability was considered for the daily load profile power values as well as the intraday hourly data. Both of these were assumed in the research to be 10%. The visual representation of the load profile is shown in Figure 3 and Figure 4. Figure 3 and Figure 4 also provide the residential electricity consumption quantities, as the data are displayed in an hourly breakdown. The HOMER program interprets the results in terms of electricity amounts. Figure 3 does not include PV system usage, while Figure 4 does. The colors in the figures represent the average electricity use per capita from the grid as a function of time, as follows:
  • The dark blue shade indicates negligible use, while the red color shows significant electricity use.
  • The more vivid the shades of blue, green, yellow, orange, and red are, in this order, the more significant the use of electricity from the grid is.
It can be seen that, in Norway, electricity demand is higher in the evening hours of the winter months compared to the summer period. The results of the modelling show that during the winter period, power consumption of around 2 kW–2.5 kW per person can occur for several hours, which can mean up to 10 kWh of electricity per hour for a household of four people. Figure 4 also shows the change in residential per-capita electricity consumption using the example of a 5 kW PV system, also in Norway. It can be seen that areas of black also appear in the figure, indicating that the PV system’s power generation results in the elimination of electricity from the grid during those periods. The household then uses some of the PV energy directly.
Figure 5 illustrates the impact of the 5 kW PV system in the Norwegian example on the grid due to the PV electricity not used in the household consequently being fed into the network. The colors in Figure 5 show the amount of PV energy delivered to the grid as a function of time:
  • Dark blue indicates less PV energy, while red indicates significant PV energy being fed into the grid.
  • The more vivid the shades of blue, green, yellow, orange, and red are, the more significant the amount of PV energy fed into the grid is.
In this study, the amount of PV energy used directly and the amount of the energy not used (fed into the grid) was calculated as described in Section 2.2.

3.3. The Extent to Which PV Energy Can Be Directly Used

Over the course of this research, the annual distribution of direct PV energy use per household per capita in relation to the annual energy production of the given PV system was calculated for PV capacities between 0.5 kW and 5 kW (Table 4). The results show that the extent of this depends on a number of factors: the geographical location of the town/city in the given country, the annual global radiation and temperature characteristics of the environment, and the per-capita electricity consumption of a given household. This implies that, for example, a PV system with a capacity of 0.5 kW in England (London) would allow 96.8% direct PV energy use relative to the annual energy production of the PV system, while in Italy (Rome), it would allow 47.2%. It can be concluded for all countries that increasing the PV system size is associated with exponentially decreasing direct use of PV energy, the extent of which varies across countries (Table 4). These results also provide information on the amount of PV energy fed into the grid, indicating the grid load effects connected to a given PV capacity (Table 4). An increase in the size of the PV system is accompanied by a rise in the annual amount of PV energy fed into the grid. The colors in Table 4 help to interpret the data, with dark green indicating maximum direct PV energy use (96.8%) and dark red indicating significant PV energy fed into the grid, at 6.5%. The more vivid the shades of blue, green, yellow, orange, and red are, in this order, the more substantial the amount of PV energy fed into the grid.

3.4. The Amount of Electricity That Can Be Saved by Direct PV Energy Use

This study has determined the annual amount of grid electricity per capita that can be saved by the direct use of PV energy in household consumption in the case of on-grid PV systems of given sizes in the studied European countries (Table 5). The results show that the extent of this depends mainly on the factors already mentioned in Section 3.3 (geographical location of the town/city in the given country, annual global radiation and temperature characteristics, per-capita electricity consumption of the households). The data demonstrated, using the examples of the cities listed in Section 3.3, that a PV system with a capacity of 0.5 kW can save 11.3% of grid electricity consumption per year in England (London) and 32.5% in Italy (Rome) in the case of direct PV energy use. It can be concluded that, for all countries, increasing the PV system size allows for exponentially increasing electricity savings in the case of the direct use of PV energy. The above relationship also means that as the capacity of the PV system increases, the annual amount of electricity that can be saved per unit of PV capacity increases. For example, in the case of Germany (Berlin), an on-grid PV system with a capacity of 0.5 kW provides electricity savings of 25.3% per year, while one with a capacity of 5 kW allows for electricity savings of 48.1% annually if the PV energy is used directly. The extent of this varies from country to country. The color coding in Table 5 helps to interpret the data, with the dark green color representing annual electricity savings of 59.1%, the highest rate, and the dark red color signaling the lowest proportion, 7% per person per household, in the case of direct PV energy use. The more vivid the shades of green, yellow, orange, and red are, in this order, the higher the degree of electricity savings.

4. Discussion

Due to the complex energy challenges faced by many regions of the world today, numerous nations choose to include solar technologies in their energy plans for the future. This, however, involves difficulties of its own, resulting from the fact that producing electrical power by solar technologies on a large scale may have adverse effects on the reliability of the electricity networks and their power quality in general, due to the intermittent nature and the relatively low predictability of solar energy. In order to resolve these issues, it is necessary to continue the comprehensive and in-depth study of the many aspects of using solar technologies for power generation.
The present research dealt with residential direct PV utilization with a view to establishing, in the context of European countries and on-grid PV systems of different capacities, the extent to which direct household PV energy use could potentially decrease the annual amount of electricity that needs to be consumed from the grid. The findings of the study also supply information on the macro-energy systems in terms of local network load effects associated with given PV capacities. A further aspect of the subject matter of the research is that balcony solar module (plug-in) systems, which can cover part of a household’s energy needs during sunny periods by direct PV energy use, are becoming increasingly popular: for example, in Germany and Austria. In the event that the balcony solar module systems produce too much energy compared to the household’s current energy demand, the excess energy is fed into the grid, but the household does not receive any credit for this amount on their electricity bill. It needs to be noted here that this type of technological solution is not permitted in every country. For example, in Hungary, under the current regulations, the use of balcony solar module systems is not allowed, as the user would be in breach of contract by installing one. Only so-called household-sized PV systems (HMKEs) can be installed. However, in Hungary, from 1 November 2022, the possibility of connecting PV HMKE systems with a maximum capacity of 50 kW to the grid was temporarily suspended, mainly due to increasing local grid load effects. This means, for example, for a household, that a PV HMKE system installed after that date can only reduce its annual demand for electricity from the grid by using PV energy directly. The amount of PV energy that is not used in the household and could be fed into the grid is lost due to the new regulation. These market conditions increase the importance of the direct use of PV energy. Today, more and more technologies are becoming available to help increase the direct use of PV energy. One of the most obvious solutions is to store PV energy using batteries. In Germany, for instance, more than 300,000 household energy storage systems were built in 2020, with an average energy storage capacity of 8.5 kWh. Off-grid (e.g., Green Cell, Easun Power, Victron Energy, etc.) or hybrid (e.g., Growatt, Fronius Primo GEN24, etc.) inverters offer an excellent option for storing energy in batteries. The direct use of PV energy is also facilitated by systems that can be used for hot water production (e.g., Fothermo, AZO DIGITAL) or for certain types of electric heating (e.g., AZO DIGITAL).

5. Conclusions

The goal of the present research was to determine, on the one hand, the annual consumption of electricity from the grid per capita in the households of 32 European countries that could be saved by the direct use of PV energy produced by on-grid household PV systems of different capacities, and, on the other hand, to show what the annual potential of the direct use of PV energy was compared to the annual energy production of the PV systems.
The exploration of this information has great practical significance, as it has become very important nowadays to be aware of the extent of the potential of the direct use of PV energy in the case of on-grid household PV systems, as some of the problems caused by too much PV energy during times of peak production in the system can be dealt with in this way to a certain degree.
The innovative significance of this research lies in the fact that, so far, no comparative scientific study related to PV technology has been available to determine the annual potential of the direct use of PV energy for European households. This study showed that the annual amount of grid electricity that can be saved by using PV energy directly for on-grid PV systems varied between 7 and 59% per person per household, depending on PV capacity. In addition, the research determined the annual amount of the direct use of PV energy compared to the annual energy production of the on-grid PV system, per capita, which varied between 6.5 and 96.8% per household depending on PV capacity. Across the examined countries, it was found that increasing the size of PV systems allowed for exponentially increasing grid electricity savings from the direct use of PV energy, and at the same time, as the capacity of the PV system increased, the annual amount of electricity that could be saved per unit of PV capacity decreased. In addition, increasing the size of the PV system was associated with an exponentially decreasing direct use of PV energy relative to the annual energy production of the PV system, which varied from country to country, also providing information on the amount of PV energy fed into the grid.
As a continuation of the present research, a further objective is to determine the annual amount of electricity from the grid saved per capita per household (%) that can be achieved through the direct use of PV energy in the countries studied in the case of hybrid on-grid PV systems with energy storage.

Author Contributions

Conceptualization, H.Z.; methodology, H.Z. and N.H.B.; software, H.Z.; validation, H.Z. and N.H.B.; formal analysis, H.Z. and N.H.B.; writing—original draft preparation, H.Z.; writing—review and editing, H.Z., N.H.B., G.P. and A.V.; supervision, H.Z., N.H.B., G.P. and A.V.; project administration, H.Z.; funding acquisition, H.Z. All authors have read and agreed to the published version of the manuscript.

Funding

This research study has been funded of project number 2021-2.1.1-EK-2021-00001 and project no. RRF-2.3.1-21-2022-00009, titled National Laboratory for Renewable Energy. “Project no. RRF-2.3.1-21-2022-00009, titled National Laboratory for Renewable Energy, has been implemented with the support provided by the Recovery and Resilience Facility of the European Union within the framework of Programme Széchenyi Plan Plus”.

Institutional Review Board Statement

Not applicable.

Informed Consent Statement

Not applicable.

Data Availability Statement

The data presented in this study are available within the article.

Acknowledgments

We acknowledge the financial support of project number 2021-2.1.1-EK-2021-00001 and project no. RRF-2.3.1-21-2022-00009, titled National Laboratory for Renewable Energy. “Project no. RRF-2.3.1-21-2022-00009, titled National Laboratory for Renewable Energy, has been implemented with the support provided by the Recovery and Resilience Facility of the European Union within the framework of Programme Széchenyi Plan Plus”.

Conflicts of Interest

The authors declare no conflict of interest.

Abbreviations

The following abbreviations are used in this manuscript:
Edirect PVThe amount of direct household PV energy use (kWh)
Ehour, average %Average hourly household electricity consumption as a percentage of the daily consumption (%)
EhouseholdAnnual household electricity consumption (kWh)
EmonthAmount of electricity consumed in a given month at a national level (kWh)
Emonthly average, given hour of the dayThe average household energy consumption of a given hour of a given month (kWh)
Emonthly daily averageThe household average daily electricity consumption for a given month (kWh)
Emonthly energy rateThe ratio of the amount of energy consumed by the household in a given month to the amount of annual energy consumed
Emonthly energy rate %The ratio of the amount of energy consumed by the household in a given month to the amount of annual energy consumed, expressed as a percentage (%)
EpurchasedEnergy purchased from the grid per household (kWh)
EPVAnnual energy production of PV household system(s) (kWh)
EsoldThe amount of energy not used by the household(s) (fed into the grid) (kWh)
EyearThe amount of energy consumed by the household(s) per year (kWh)

References

  1. Yan, J. Energy Transition: Time Matters. Adv. Appl. Energy 2022, 5, 100082. [Google Scholar] [CrossRef]
  2. Apostu, S.A.; Panait, M.; Vasile, V. The Energy Transition in Europe—A Solution for Net Zero Carbon? Environ. Sci. Pollut. Res. 2022, 29, 71358–71379. [Google Scholar] [CrossRef] [PubMed]
  3. Sharma, S. The Energy Transition, Albeit Global in Nature, Is Handled at the Local Level in India. In Proceedings of the EAGE GET, The Hague, The Netherlands, 7–9 November 2022; pp. 1–4. [Google Scholar] [CrossRef]
  4. Guilbert, D.; Vitale, G.; Rodrigues, E.; Srinivasan, S.S. Hydrogen as a Clean and Sustainable Energy Vector for Global Transition from Fossil-Based to Zero-Carbon. Clean Technol. 2021, 3, 881–909. [Google Scholar] [CrossRef]
  5. Olczak, P.; Komorowska, A. An Adjustable Mounting Rack or an Additional PV Panel? Cost and Environmental Analysis of a Photovoltaic Installation on a Household: A Case Study in Poland. Sustain. Energy Technol. Assess. 2021, 47, 101496. [Google Scholar] [CrossRef]
  6. Pickl, M.J. The Renewable Energy Strategies of Oil Majors—From Oil to Energy? Energy Strategy Rev. 2019, 26, 100370. [Google Scholar] [CrossRef]
  7. European Network of Transmission System Operators for Electricity (ENTSO-E). ENTSO-E Transparency Platform. Available online: https://transparency.entsoe.eu/dashboard/show (accessed on 1 January 2022).
  8. Ding, H.; Zhou, D.; Zhou, P. Optimal Policy Supports for Renewable Energy Technology Development: A Dynamic Programming Model. Energy Econ. 2020, 92, 104765. [Google Scholar] [CrossRef]
  9. Mohd Chachuli, F.S.; Ahmad Ludin, N.; Md Jedi, M.A.; Hamid, N.H. Transition of Renewable Energy Policies in Malaysia: Benchmarking with Data Envelopment Analysis. Renew. Sustain. Energy Rev. 2021, 150, 111456. [Google Scholar] [CrossRef]
  10. Renewable Energy Policy Network for the 21st Century (REN21). In Renewables 2022 Global Status Report; REN21: Paris, France, 2022.
  11. Hafezi, R.; Alipour, M. Renewable Energy Sources: Traditional and Modern-Age Technologies. In Affordable and Clean Energy; Springer: Berlin/Heidelberg, Germany, 2021; pp. 1085–1099. [Google Scholar] [CrossRef]
  12. Ramos, V.; Giannini, G.; Calheiros-Cabral, T.; Rosa-Santos, P.; Taveira-Pinto, F. Legal Framework of Marine Renewable Energy: A Review for the Atlantic Region of Europe. Renew. Sustain. Energy Rev. 2021, 137, 110608. [Google Scholar] [CrossRef]
  13. Alipour, M.; Salim, H.; Stewart, R.A.; Sahin, O. Residential Solar Photovoltaic Adoption Behaviour: End-to-End Review of Theories, Methods and Approaches. Renew. Energy 2021, 170, 471–486. [Google Scholar] [CrossRef]
  14. Victoria, M.; Haegel, N.; Peters, I.M.; Sinton, R.; Jäger-Waldau, A.; del Cañizo, C.; Breyer, C.; Stocks, M.; Blakers, A.; Kaizuka, I.; et al. Solar Photovoltaics Is Ready to Power a Sustainable Future. Joule 2021, 5, 1041–1056. [Google Scholar] [CrossRef]
  15. Gil, G.O.; Chowdhury, J.I.; Balta-Ozkan, N.; Hu, Y.; Varga, L.; Hart, P. Optimising Renewable Energy Integration in New Housing Developments with Low Carbon Technologies. Renew. Energy 2021, 169, 527–540. [Google Scholar] [CrossRef]
  16. Odeh, S.; Ibrik, I. Performance Assessment of Standalone PV Systems for Rural Communities. Aust. J. Mech. Eng. 2019, 20, 131–140. [Google Scholar] [CrossRef]
  17. Peñaloza, D.; Mata, É.; Fransson, N.; Fridén, H.; Samperio, Á.; Quijano, A.; Cuneo, A. Social and Market Acceptance of Photovoltaic Panels and Heat Pumps in Europe: A Literature Review and Survey. Renew. Sustain. Energy Rev. 2022, 155, 111867. [Google Scholar] [CrossRef]
  18. Comodi, G.; Bevilacqua, M.; Caresana, F.; Paciarotti, C.; Pelagalli, L.; Venella, P. Life Cycle Assessment and Energy-CO2-Economic Payback Analyses of Renewable Domestic Hot Water Systems with Unglazed and Glazed Solar Thermal Panels. Appl. Energy 2016, 164, 944–955. [Google Scholar] [CrossRef]
  19. Al-Shetwi, A.Q.; Sujod, M.Z. Grid-Connected Photovoltaic Power Plants: A Review of the Recent Integration Requirements in Modern Grid Codes. Int. J. Energy Res. 2018, 42, 1849–1865. [Google Scholar] [CrossRef]
  20. Kabir, E.; Kumar, P.; Kumar, S.; Adelodun, A.A.; Kim, K.H. Solar Energy: Potential and Future Prospects. Renew. Sustain. Energy Rev. 2018, 82, 894–900. [Google Scholar] [CrossRef]
  21. Elomari, Y.; Norouzi, M.; Marín-Genescà, M.; Fernández, A.; Boer, D. Integration of Solar Photovoltaic Systems into Power Networks: A Scientific Evolution Analysis. Sustainability 2022, 14, 9249. [Google Scholar] [CrossRef]
  22. Jenkins, N.; Thornycroft, J. Grid Connection of Photovoltaic Systems: Technical and Regulatory Issues. In McEvoy’s Handbook of Photovoltaics: Fundamentals and Applications; Elsevier Ltd.: Amsterdam, The Netherlands, 2018; pp. 847–876. [Google Scholar] [CrossRef]
  23. Roldán Fernández, J.M.; Burgos Payán, M.; Riquelme Santos, J.M. Profitability of Household Photovoltaic Self-Consumption in Spain. J. Clean. Prod. 2021, 279, 123439. [Google Scholar] [CrossRef]
  24. Cao, W.; Pan, X.; Sobhani, B. Integrated Demand Response Based on Household and Photovoltaic Load and Oscillations Effects. Int. J. Hydrogen Energy 2021, 46, 39523–39535. [Google Scholar] [CrossRef]
  25. Baranyai, N.H.; Zsiborács, H.; Vincze, A.; Rodek, N.; Makai, M.; Pintér, G. Correlation Analysis of the Spread of Household-Sized Photovoltaic Power Plants and Various District Indicators: A Case Study. Sustainability 2021, 13, 482. [Google Scholar] [CrossRef]
  26. Baranyai, N.H.; Zsiborács, H.; Vincze, A.; Rodek, N.; Makai, M.; Pintér, G. Relationships between the Number and Power of Hungarian Household-Sized Photovoltaic Power Plants and Selected Indicators of the Settlements: A Case Study. Processes 2020, 9, 4. [Google Scholar] [CrossRef]
  27. Zsiborács, H.; Hegedűsné Baranyai, N.; Vincze, A.; Háber, I.; Pintér, G. Economic and Technical Aspects of Flexible Storage Photovoltaic Systems in Europe. Energies 2018, 11, 1445. [Google Scholar] [CrossRef] [Green Version]
  28. Pintér, G.; Zsiborács, H.; Hegedűsné Baranyai, N. Aspects of Determining the Energy Storage System Size Linked to Household-Sized Power Plants in Hungary in Accordance with the Regulatory Needs of the Electric Energy System. Sustainability 2022, 14, 2622. [Google Scholar] [CrossRef]
  29. Camilo, F.M.; Castro, R.; Almeida, M.E.; Pires, V.F. Economic Assessment of Residential PV Systems with Self-Consumption and Storage in Portugal. Sol. Energy 2017, 150, 353–362. [Google Scholar] [CrossRef]
  30. Lazzeroni, P.; Mariuzzo, I.; Quercio, M.; Repetto, M. Economic, Energy, and Environmental Analysis of PV with Battery Storage for Italian Households. Electronics 2021, 10, 146. [Google Scholar] [CrossRef]
  31. Yang, Y.; Zhou, K.; Blaabjerg, F. Current Harmonics from Single-Phase Grid-Connected Inverters-Examination and Suppression. IEEE J. Emerg. Sel. Top. Power Electron. 2016, 4, 221–233. [Google Scholar] [CrossRef] [Green Version]
  32. Phuangpornpitak, N.; Kumar, S. PV Hybrid Systems for Rural Electrification in Thailand. Renew. Sustain. Energy Rev. 2007, 11, 1530–1543. [Google Scholar] [CrossRef]
  33. Mandelli, S.; Barbieri, J.; Mereu, R.; Colombo, E. Off-Grid Systems for Rural Electrification in Developing Countries: Definitions, Classification and a Comprehensive Literature Review. Renew. Sustain. Energy Rev. 2016, 58, 1621–1646. [Google Scholar] [CrossRef]
  34. Hasheminamin, M.; Agelidis, V.G.; Salehi, V.; Teodorescu, R.; Hredzak, B. Index-Based Assessment of Voltage Rise and Reverse Power Flow Phenomena in a Distribution Feeder under High PV Penetration. IEEE J. Photovolt. 2015, 5, 1158–1168. [Google Scholar] [CrossRef]
  35. El-Khattam, W.; Salama, M.M.A. Distributed Generation Technologies, Definitions and Benefits. Electr. Power Syst. Res. 2004, 71, 119–128. [Google Scholar] [CrossRef]
  36. Ackermann, T.; Andersson, G.; Söder, L. Distributed Generation: A Definition. Electr. Power Syst. Res. 2001, 57, 195–204. [Google Scholar] [CrossRef]
  37. European Commission—Eurostat. Households Consumption of Electricity per Capita, 2020 (MWh per Capita). Available online: https://ec.europa.eu/eurostat/statistics-explained/index.php?title=File:Households_consumption_of_electricity_per_capita,_2020_(MWh_per_capita).png (accessed on 3 November 2022).
  38. Statista Inc. Average Domestic Electricity Consumption per Household in Great Britain in 2020, by Region. Available online: https://www.statista.com/statistics/517845/average-electricity-consumption-uk/ (accessed on 3 November 2022).
  39. Federal Department of Foreign Affairs FDFA. Energy—Facts and Figures. Available online: https://www.eda.admin.ch/aboutswitzerland/en/home/wirtschaft/energie/energie---fakten-und-zahlen.html (accessed on 3 November 2022).
  40. Kmetty, Z.; Bent, C.; Shreeve, G. D4.1 Load Profile Classification WP4—Classification of EU Residential Energy Consumers; European Commission: Brussels, Belgium, 2016.
  41. WordPress. H2RES Energy System Modelling Software. Available online: https://h2res.org/ (accessed on 3 November 2022).
  42. Lund, H.; Hvelplund, F.; Möller, B.; Vad Mathiesen, B.; Østergaard, P.A.; Andersen, A.N.; Sperling, K.; Connolly, D.; Nielsen, S.; Ridjan, I.; et al. EnergyPLAN. Available online: https://www.energyplan.eu/ (accessed on 3 November 2022).
  43. Chua, K.H.; Lim, Y.S.; Morris, S. Cost-Benefit Assessment of Energy Storage for Utility and Customers: A Case Study in Malaysia. Energy Convers. Manag. 2015, 106, 1071–1081. [Google Scholar] [CrossRef]
  44. Zahboune, H.; Zouggar, S.; Krajacic, G.; Varbanov, P.S.; Elhafyani, M.; Ziani, E. Optimal Hybrid Renewable Energy Design in Autonomous System Using Modified Electric System Cascade Analysis and Homer Software. Energy Convers. Manag. 2016, 126, 909–922. [Google Scholar] [CrossRef]
  45. HOMER Energy. HOMER Pro. Available online: https://www.homerenergy.com/products/pro/index.html (accessed on 3 November 2022).
  46. Deshmukh, M.K.; Singh, A.B. Modeling of Energy Performance of Stand-Alone SPV System Using HOMER Pro. Energy Procedia 2019, 156, 90–94. [Google Scholar] [CrossRef]
  47. Rousis, A.O.; Tzelepis, D.; Konstantelos, I.; Booth, C.; Strbac, G. Design of a Hybrid AC/DC Microgrid Using HOMER Pro: Case Study on an Islanded Residential Application. Inventions 2018, 3, 55. [Google Scholar] [CrossRef] [Green Version]
  48. Swarnkar, N.M.; Gidwani, L.; Sharma, R. An Application of HOMER Pro in Optimization of Hybrid Energy System for Electrification of Technical Institute. In Proceedings of the 2016 International Conference on Energy Efficient Technologies for Sustainability, ICEETS 2016, Nagercoil, India, 7–8 April 2016; pp. 56–61. [Google Scholar] [CrossRef]
  49. Khalil, L.; Liaquat Bhatti, K.; Arslan Iqbal Awan, M.; Riaz, M.; Khalil, K.; Alwaz, N. Optimization and Designing of Hybrid Power System Using HOMER Pro. Mater. Today Proc. 2021, 47, S110–S115. [Google Scholar] [CrossRef]
  50. Riayatsyah, T.M.I.; Geumpana, T.A.; Rizwanul Fattah, I.M.; Rizal, S.; Indra Mahlia, T.M. Techno-Economic Analysis and Optimisation of Campus Grid-Connected Hybrid Renewable Energy System Using HOMER Grid. Sustainability 2022, 14, 7735. [Google Scholar] [CrossRef]
  51. Bentouba, S.; Bourouis, M.; Zioui, N.; Pirashanthan, A.; Velauthapillai, D. Performance Assessment of a 20 MW Photovoltaic Power Plant in a Hot Climate Using Real Data and Simulation Tools. Energy Rep. 2021, 7, 7297–7314. [Google Scholar] [CrossRef]
  52. SecondSol GmbH. New and Used Inverter Prices. Available online: https://www.secondsol.com/de/marktplatzfilter/?kat2=40939&kategorie=17&sortierung=preiswp&langval=128&level4available=true&modul_alter=366&counterval=&level3=41118 (accessed on 4 December 2020).
Figure 1. Annual household electricity consumption per capita (Ehousehold) in the studied countries, 2020.
Sustainability 15 06490 g001
Figure 2. Average European hourly household electricity consumption as percentages of daily consumption (Ehour, average%), based on the annual electricity consumption following the study by Kmetty et al. [40].
Sustainability 15 06490 g002
Figure 3. Characteristics of the residential per capita load profile according to the example of Norway.
Sustainability 15 06490 g003
Figure 4. Changes in residential electricity consumption per capita in the case of a 5 kW on-grid PV system, using Norway as an example.
Sustainability 15 06490 g004
Figure 5. The impact of a 5 kW on-grid PV system on the grid due to the electricity not used by the households being fed into the network, using Norway as an example.
Sustainability 15 06490 g005
Table 1. Monthly percentage distributions of annual electricity consumption based on the Platform and Kmetty et al. [40].
MonthUnited KingdomIrelandItalyHungary
Platform,
National
Data
(%)
Household
Data
Based on [40]
(%)
Diff.
(p.p.)
Platform,
National
Data
(%)
Household
Data
Based on [40]
(%)
Diff.
(p.p.)
Platform,
National
Data
(%)
Household
Data
Based on [40]
(%)
Diff.
(p.p.)
Platform,
National
Data
(%)
Household
Data
Based on [40]
(%)
Diff.
(p.p.)
19.711.21.59.010.21.28.69.50.99.19.20.1
29.18.7−0.48.28.60.47.88.91.18.48.1−0.3
39.57.8−1.78.78.70.08.38.30.08.68.4−0.2
47.47.80.48.07.7−0.37.67.70.17.97.90.0
57.47.60.28.17.6−0.57.67.4−0.27.77.6−0.1
67.06.6−0.47.66.9−0.78.57.9−0.68.07.7−0.3
77.17.10.07.97.1−0.89.68.9−0.78.58.60.1
87.77.2−0.57.97.3−0.68.48.80.47.88.60.8
97.67.2−0.48.07.6−0.48.57.4−1.17.67.70.1
108.98.4−0.58.58.3−0.28.37.7−0.68.48.40.0
118.99.20.38.98.90.08.48.1−0.38.88.5−0.3
129.811.21.49.211.11.98.79.40.79.39.30.0
Table 2. The annual average global horizontal irradiance, temperature, and PV system energy production characteristics in the cities of the countries studied, based on HOMER Pro input information.
Country (City)Global Horizontal Irradiance,
Annual Average (kWh/m2/day)
Annual Average
Temperature (°C)
Average Energy Produced
by 1 kW On-Grid PV System in One Year (MWh)
Austria (Vienna)3.29.11.1
Belgium (Brussels)2.89.71.0
Bosnia and Herzegovina (Sarajevo)3.78.01.3
Bulgaria (Sofia)3.78.91.3
Croatia (Zagreb)3.510.11.2
Czech Republic (Prague)2.98.11.0
Denmark (Copenhagen)2.98.11.0
England (London)2.79.80.9
Estonia (Tallinn)2.95.41.0
Finland (Helsinki)2.74.91.0
France (Paris)3.110.51.1
Germany (Berlin)2.78.70.9
Greece (Athens)4.618.01.4
Hungary (Budapest)3.49.71.2
Ireland (Dublin)2.49.70.8
Italy (Rome)4.716.61.5
Latvia (Riga)2.95.81.1
Lithuania (Vilnius)2.85.61.0
Luxembourg (Luxembourg)3.08.51.0
Montenegro (Podgorica)3.912.81.3
Netherlands (Amsterdam)3.010.01.0
Norway (Oslo)2.74.91.0
Poland (Warsaw)2.97.91.0
Portugal (Lisbon)4.99.71.6
Romania (Bucharest)3.711.81.2
Scotland (Edinburgh)2.57.50.9
Serbia (Belgrade)3.611.61.2
Slovakia (Bratislava)3.29.71.1
Slovenia (Ljubljana)3.48.21.2
Spain (Madrid)4.413.71.4
Sweden (Stockholm)2.96.51.0
Switzerland (Bern)3.56.31.2
Table 3. The monthly percentage distributions of the annual electricity consumption in the examined countries, based on Platform results.
CountryThe Monthly Percentage Distributions of the Annual Electricity Consumption Based on Platform Results, by Month (%)
123456789101112
Austria 9.28.38.98.07.87.78.08.07.88.48.69.5
Belgium 9.58.48.78.28.07.97.77.87.98.48.68.9
Bosnia and Herzegovina9.37.98.57.87.07.98.58.87.78.99.08.9
Bulgaria 9.88.79.58.27.07.08.07.97.28.38.69.9
Croatia 9.08.08.67.97.47.99.18.97.88.18.29.3
Czech Republic9.69.09.38.38.07.67.47.47.58.38.89.1
Denmark 9.38.88.88.18.07.57.67.87.88.38.79.5
England9.79.19.57.47.47.07.17.77.68.98.99.6
Estonia 10.09.59.37.97.76.97.07.47.57.88.810.2
Finland 9.99.69.37.97.56.87.07.27.48.18.910.5
France 11.39.29.48.07.46.87.06.66.97.89.410.4
Germany 9.08.38.98.18.07.88.17.87.88.68.78.9
Greece 8.57.78.17.27.18.210.810.27.87.77.89.0
Hungary 9.18.48.67.97.78.08.57.87.68.48.89.3
Ireland 9.08.28.78.08.17.67.97.98.08.58.99.2
Italy 8.67.88.37.67.68.59.68.48.58.38.48.7
Latvia 9.18.58.87.97.87.68.17.98.08.38.59.6
Lithuania 9.28.68.57.57.77.68.07.88.08.48.710.0
Luxembourg 8.97.88.57.88.38.48.67.98.18.09.18.8
Montenegro9.58.38.87.56.37.19.69.97.68.08.19.4
Netherlands 9.58.48.67.67.77.78.07.78.08.59.09.4
Norway11.310.09.58.47.66.46.36.66.87.98.910.3
Poland 8.98.38.87.97.87.88.38.08.08.48.69.3
Portugal 10.18.18.27.67.97.88.48.08.18.18.79.1
Romania 9.28.49.08.27.67.78.58.17.68.28.49.1
Scotland9.79.19.57.47.47.07.17.77.68.98.99.6
Serbia 9.78.79.48.47.17.27.77.37.08.68.910.3
Slovakia 9.08.38.98.18.17.88.17.97.88.58.79.1
Slovenia 9.28.19.78.08.07.87.97.57.78.48.79.3
Spain 9.47.98.67.87.98.18.98.68.17.88.48.6
Sweden10.910.09.48.37.66.66.46.77.07.98.910.6
Switzerland9.88.58.38.18.27.66.97.57.68.49.210.0
The colors used in Table 3 help to interpret the data seasonally.
Table 4. The extent to which PV energy can be directly used in the cities of the countries studied.
CountryThe Annual Amount of the Direct PV Energy Use in Relation to the Annual Energy Production of the On-Grid PV System, per Capita per Household (%)
PV Capacity:
0.5 kW
PV Capacity:
1 kW
PV Capacity:
2 kW
PV Capacity:
3 kW
PV Capacity:
4 kW
PV Capacity:
5 kW
Austria (Vienna)84.757.935.826.020.516.9
Belgium (Brussels)80.655.233.924.619.416.0
Bosnia and Herzegovina (Sarajevo)56.834.719.813.910.78.7
Bulgaria (Sofia)77.649.828.820.315.712.8
Croatia (Zagreb)75.247.827.619.414.912.2
Czech Republic (Prague)75.750.330.221.717.013.9
Denmark (Copenhagen)81.054.133.124.118.915.6
England (London)96.885.060.446.538.032.2
Estonia (Tallinn)73.347.127.920.015.712.9
Finland (Helsinki)96.682.756.443.034.829.3
France (Paris)88.365.041.530.624.320.2
Germany (Berlin)79.754.032.823.618.515.2
Greece (Athens)76.947.827.018.814.411.7
Hungary (Budapest)64.639.822.716.012.310.0
Ireland (Dublin)84.060.438.828.923.119.2
Italy (Rome)47.227.315.110.48.06.5
Latvia (Riga)51.330.817.412.39.57.7
Lithuania (Vilnius)53.733.419.714.011.09.0
Luxembourg (Luxembourg)79.152.731.522.617.714.6
Montenegro (Podgorica)84.856.833.523.818.515.2
Netherlands (Amsterdam)75.849.129.120.916.313.4
Norway (Oslo)96.895.778.262.551.944.6
Poland (Warsaw)54.533.218.813.110.18.2
Portugal (Lisbon)61.235.819.513.510.38.4
Romania (Bucharest)50.529.316.011.08.46.8
Scotland (Edinburgh)96.885.661.447.639.033.1
Serbia (Belgrade)84.156.533.824.218.915.6
Slovakia (Bratislava)52.631.818.212.910.08.1
Slovenia (Ljubljana)78.951.930.721.917.013.9
Spain (Madrid)75.046.826.919.014.711.9
Sweden (Stockholm)96.783.056.042.133.928.5
Switzerland (Bern)82.955.733.624.219.015.7
Table 5. The amount of grid electricity that can be saved by direct PV energy use in the cities of the countries studied.
CountryThe Annual Amount of Grid Electricity That Can Be Saved by Direct PV Energy Use in the Case of On-Grid PV Systems, per Capita per Household (%)
PV Capacity:
0.5 kW
PV Capacity:
1 kW
PV Capacity:
2 kW
PV Capacity:
3 kW
PV Capacity:
4 kW
PV Capacity:
5 kW
Austria (Vienna)22.931.338.642.244.245.6
Belgium (Brussels)24.333.340.944.546.848.3
Bosnia and Herzegovina (Sarajevo)29.636.141.243.544.845.5
Bulgaria (Sofia)30.338.844.947.649.050.0
Croatia (Zagreb)31.339.845.948.449.850.7
Czech Republic (Prague)25.834.341.244.546.347.5
Denmark (Copenhagen)23.130.937.841.343.344.7
England (London)11.319.928.332.735.637.7
Estonia (Tallinn)25.733.039.242.144.045.3
Finland (Helsinki)12.220.928.532.635.237.0
France (Paris)19.428.636.540.342.844.4
Germany (Berlin)25.334.241.644.946.848.1
Greece (Athens)33.641.847.149.250.451.3
Hungary (Budapest)31.038.143.546.047.248.1
Ireland (Dublin)19.427.935.940.042.644.4
Italy (Rome)32.537.641.643.043.844.5
Latvia (Riga)29.735.640.442.744.044.7
Lithuania (Vilnius)25.431.737.239.941.542.6
Luxembourg (Luxembourg)27.736.944.147.549.651.0
Montenegro (Podgorica)26.735.842.244.946.747.8
Netherlands (Amsterdam)28.036.343.146.348.249.5
Norway (Oslo)7.013.822.527.029.932.1
Poland (Warsaw)33.941.246.748.950.150.7
Portugal (Lisbon)37.243.647.549.250.351.0
Romania (Bucharest)44.151.255.957.658.559.1
Scotland (Edinburgh)10.819.127.431.834.836.9
Serbia (Belgrade)24.933.339.842.944.746.0
Slovakia (Bratislava)26.832.437.239.440.641.5
Slovenia (Ljubljana)26.735.041.544.546.147.1
Spain (Madrid)34.042.448.851.753.254.1
Sweden (Stockholm)12.421.228.632.334.636.4
Switzerland (Bern)25.334.041.044.346.447.8
Disclaimer/Publisher’s Note: The statements, opinions and data contained in all publications are solely those of the individual author(s) and contributor(s) and not of MDPI and/or the editor(s). MDPI and/or the editor(s) disclaim responsibility for any injury to people or property resulting from any ideas, methods, instructions or products referred to in the content.

