
Building a University City Brand: Colombian University Students’ Perceptions


Abstract
1. Introduction
1.1. Cities and Knowledge
1.2. University City Brand Research
1.3. Aspects That Influence the Choice of a University
1.4. Measurement Index of the Concept of Colombian University Cities-ICU
2. Materials and Methods
Measurement Tool
3. Results
3.1. Sample
3.2. Reliability and Validity of the Measurement Tool
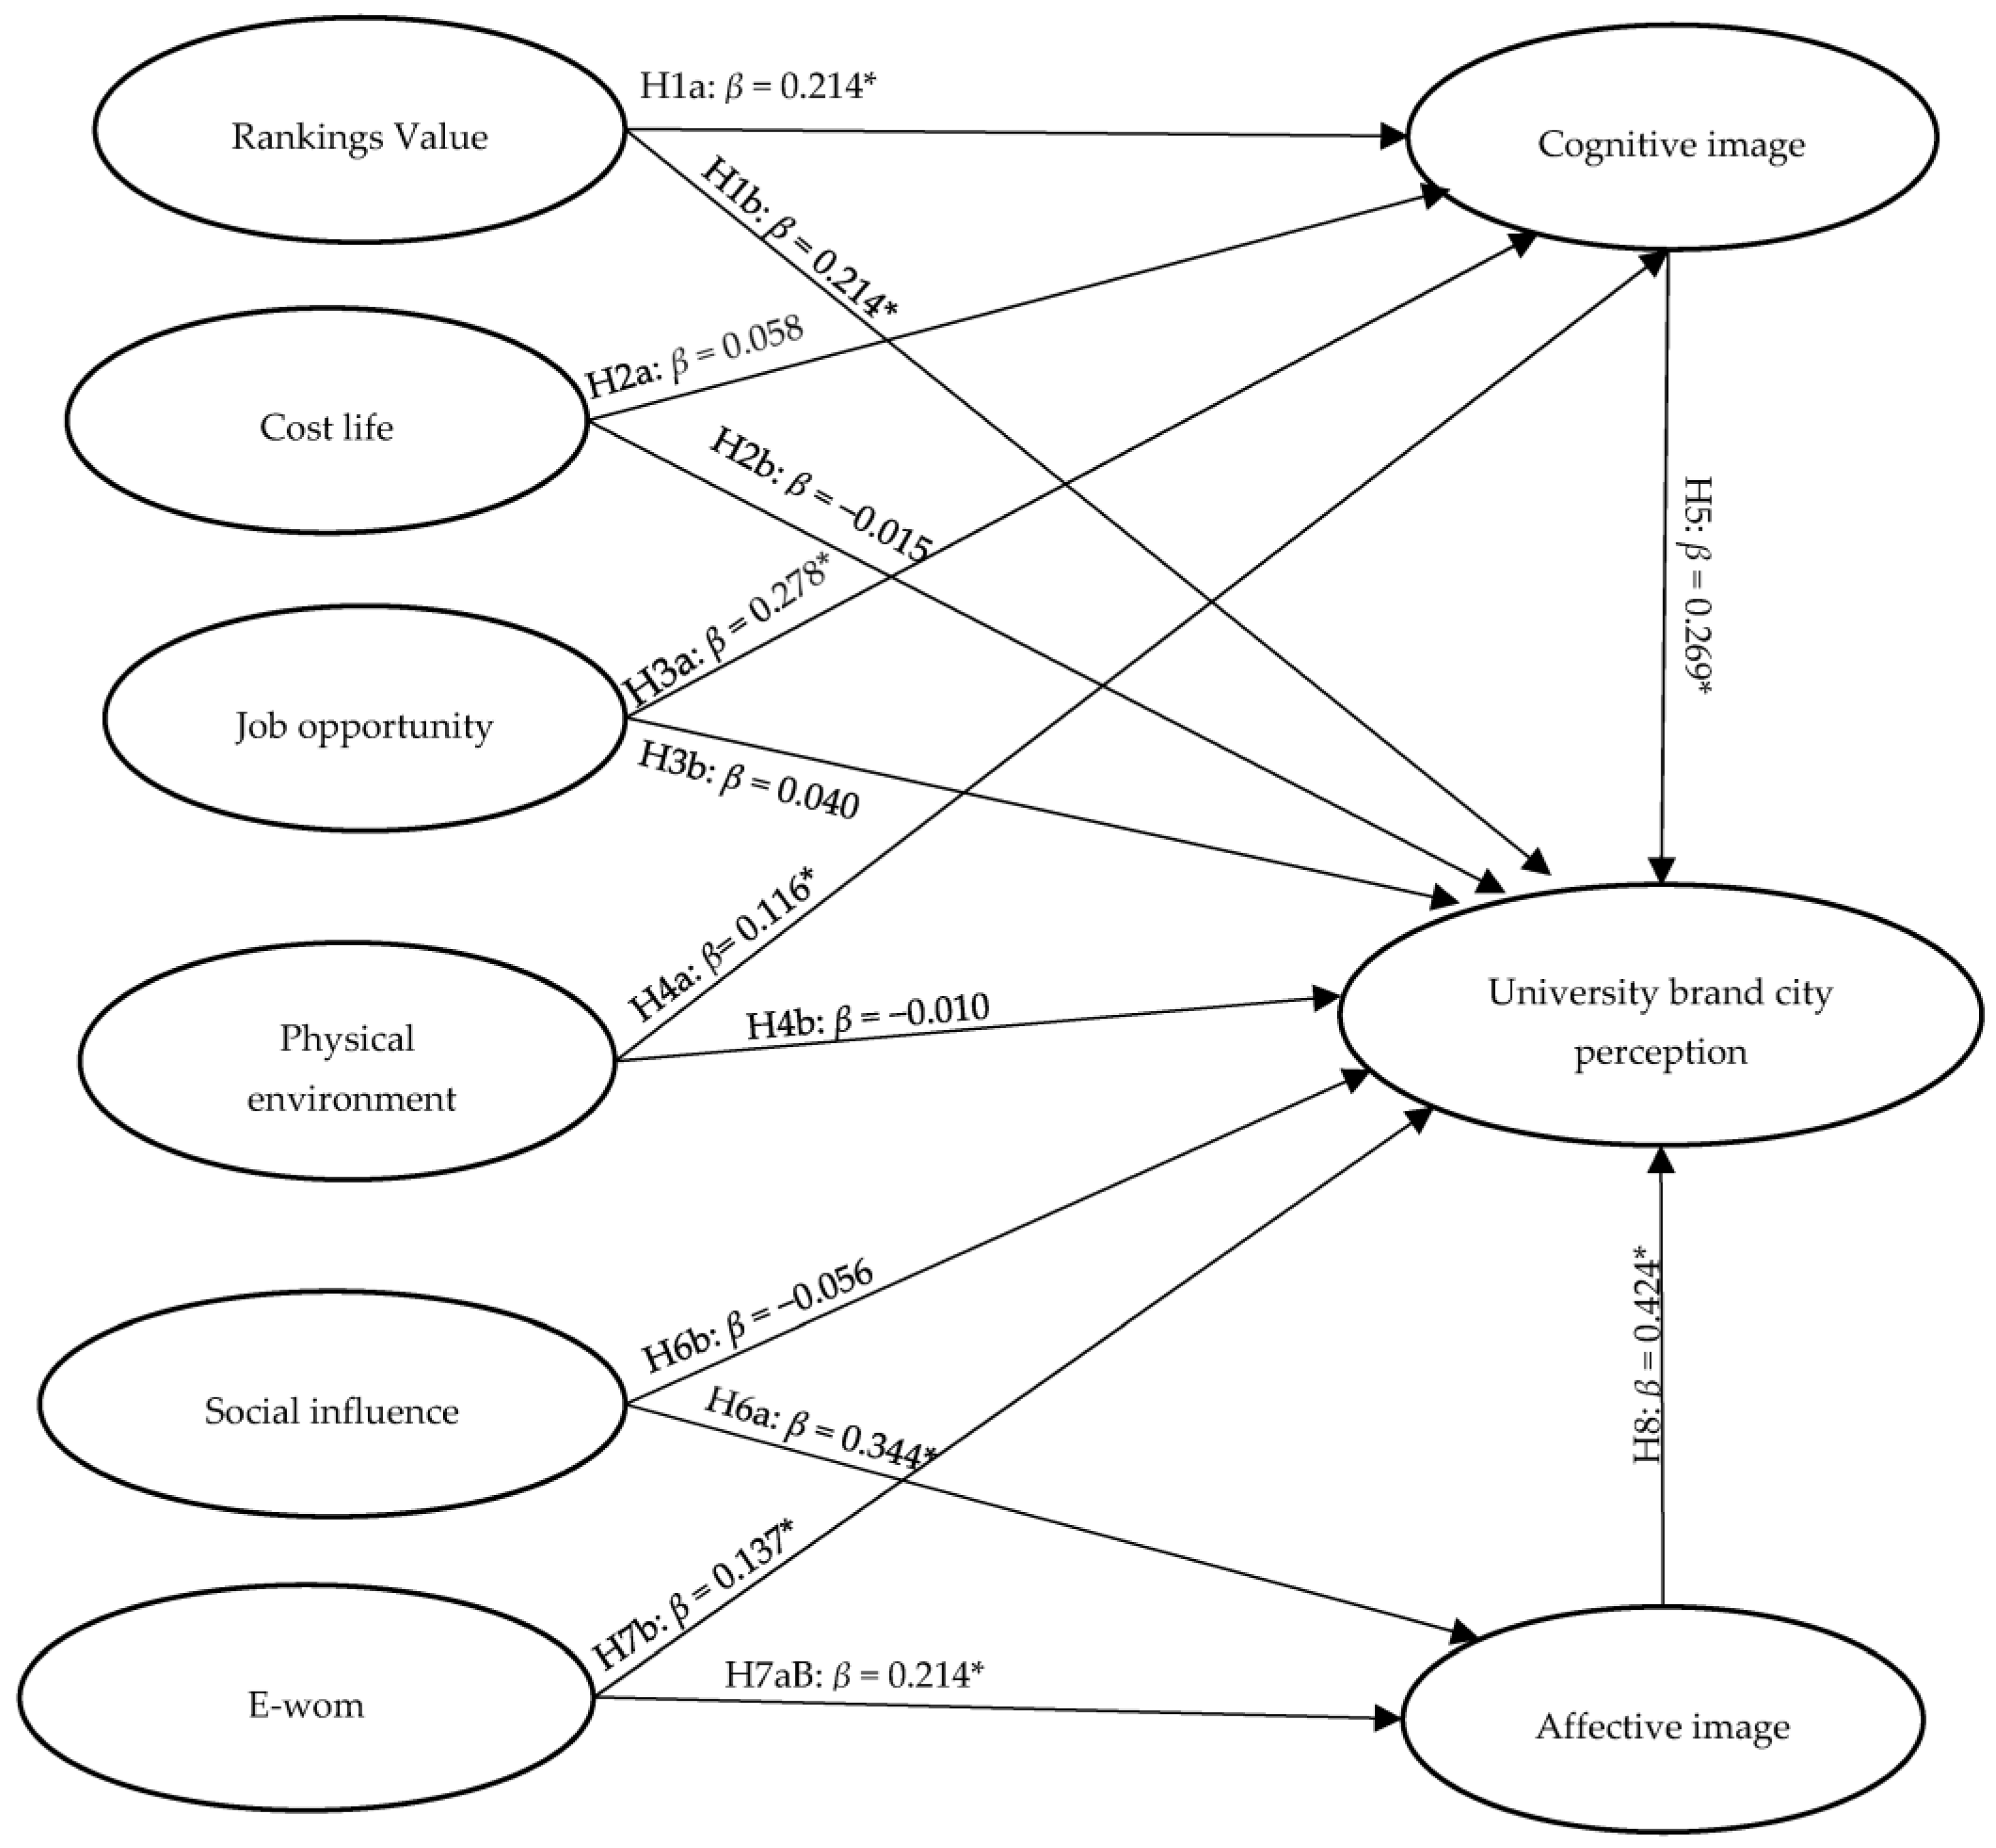
3.3. Prediction and Validity of the Empirical Model
3.4. Unobserved Heterogeneity Test—Measure Invariance of Composite Models
3.5. Differences between Groups–Analysis Based on Permutations–Parametric Test–t-Test Welch–Satterhwaite–PLS-MGA
4. Discussion
5. Conclusions
Author Contributions
Funding
Institutional Review Board Statement
Informed Consent Statement
Data Availability Statement
Conflicts of Interest
Appendix A

| Composite | Correlation | 5% Quartile of the Empirical Distribution of c | p-Value | Is Invariance Proven? |
|---|---|---|---|---|
| Affective image | 1.000 | 1.000 | 0.445 | Yes |
| City brand university | 1.000 | 1.000 | 0.619 | Yes |
| Cognitive image | 1.000 | 0.998 | 0.937 | Yes |
| Cost life | 0.999 | 0.997 | 0.189 | Yes |
| E-wom | 0.997 | 0.988 | 0.394 | Yes |
| Job opportunity | 1.000 | 0.996 | 0.714 | Yes |
| Physical environment | 1.000 | 0.996 | 0.670 | Yes |
| Rankings value | 0.996 | 0.989 | 0.324 | Yes |
| Social influence | 0.991 | 0.973 | 0.343 | Yes |
| Composite | Composite Mean Difference (=0) | 95% confidence interval | p-value | Equality of means? |
| Affective image | −0.033 | (−0.347; 0.282) | 0.667 | Yes |
| City brand university | −0.262 | (−0.327; 0.307) | 0.614 | Yes |
| Cognitive image | −0.458 | (−0.329; 0.289) | 0.889 | Not |
| Cost life | −0.125 | (−0.314; 0.303) | 0.464 | Yes |
| E-wom | −0.311 | (−0.330; 0.310) | 0.805 | Yes |
| Job opportunity | −0.289 | (−0.341; 0.294) | 0.348 | Yes |
| Physical environment | −0.147 | (−0.337; 0.307) | 0.635 | Yes |
| Rankings value | −0.266 | (−0.323; 0.304) | 0.188 | Yes |
| Social influence | −0.304 | (−0.307; 0.295) | 0.508 | Yes |
| Composite | Difference of the logarithm of the variances of the composite (=0) | 95% confidence interval | p-value | Equality of variances? |
| Affective image | 0.161 | (−0.696; 0.756) | 0.667 | Yes |
| City brand university | 0.129 | (−0.508; 0.519) | 0.614 | Yes |
| Cognitive image | 0.036 | (−0.521; 0.544) | 0.889 | Yes |
| Cost life | 0.216 | (−0.584; 0.600) | 0.464 | Yes |
| E-wom | −0.046 | (−0.356; 0.350) | 0.805 | Yes |
| Job opportunity | 0.404 | (−0.434; 0.504) | 0.548 | Yes |
| Physical environment | −0.104 | (−0.448;0.470) | 0.635 | Yes |
| Rankings value | 0.367 | (−0.533; 0.553) | 0.188 | Yes |
| Social influence | 0.153 | (−0.450; 0.437) | 0.508 | Yes |
| Composite | Correlation | 5% Quartile of the Empirical Distribution of c | p-Value | Is Invariance Proven? |
|---|---|---|---|---|
| Affective image | 1.000 | 1.000 | 0.536 | Yes |
| City brand university | 1.000 | 0.999 | 1.000 | Yes |
| Cognitive image | 0.999 | 0.998 | 0.293 | Yes |
| Cost life | 0.999 | 0.976 | 0.900 | Yes |
| E-wom | 0.991 | 0.990 | 0.066 | Yes |
| Job opportunity | 0.999 | 0.986 | 0.668 | Yes |
| Physical environment | 1.000 | 0.997 | 0.913 | Yes |
| Rankings value | 0.995 | 0.988 | 0.371 | Yes |
| Social influence | 1.000 | 0.947 | 0.975 | Yes |
| Composite | Composite Mean Difference (=0) | 95% confidence interval | p-value | Equality of means? |
| Affective image | 0.208 | (−0.315; 0.291) | 0.193 | Yes |
| City brand university | 0.237 | (−0.305; 0.327) | 0.140 | Yes |
| Cognitive image | 0.143 | (−0.291; 0.294) | 0.366 | Yes |
| Cost life | 0.072 | (−0.316; 0.313) | 0.605 | Yes |
| E-wom | 0.138 | (−0.299; 0.298) | 0.382 | Yes |
| Job opportunity | −0.087 | (−0.291; 0.331) | 0.573 | Yes |
| Physical environment | 0.083 | (−0.300; 0.287) | 0.575 | Yes |
| Rankings value | −0.076 | (−0.283; 0.288) | 0.634 | Yes |
| Social influence | −0.017 | (−0.300; 0.280) | 0.907 | Yes |
| Composite | Difference of the logarithm of the variances of the composite (=0) | 95% confidence interval | p-value | Equality of variances? |
| Affective image | 0.172 | (−0.696; 0.756) | 0.562 | Yes |
| City brand university | −0.013 | (−0.508; 0.519) | 0.938 | Yes |
| Cognitive image | −0.148 | (−0.521; 0.544) | 0.502 | Yes |
| Cost life | 0.119 | (−0.584; 0.600) | 0.646 | Yes |
| E-wom | −0.100 | (−0.356; 0.350) | 0.526 | Yes |
| Job opportunity | 0.419 | (−0.434; 0.504) | 0.446 | Yes |
| Physical environment | 0.093 | (−0.448; 0.470) | 0.671 | Yes |
| Rankings value | 0.061 | (−0.533; 0.553) | 0.799 | Yes |
| Social influence | 0.201 | (−0.450; 0.437) | 0.336 | Yes |
| Composite | Correlation | 5% Quartile of the Empirical Distribution of c | p-Value | Is Invariance Proven? |
|---|---|---|---|---|
| Affective image | 1.000 | 0.999 | 0.582 | Yes |
| City brand university | 1.000 | 0.999 | 0.870 | Yes |
| Cognitive image | 1.000 | 0.997 | 0.993 | Yes |
| Cost life | 0.996 | 0.995 | 0.085 | Yes |
| E-wom | 0.996 | 0.990 | 0.058 | Yes |
| Job opportunity | 1.000 | 0.996 | 0.907 | Yes |
| Physical environment | 0.999 | 0.995 | 0.689 | Yes |
| Rankings value | 0.998 | 0.995 | 0.378 | Yes |
| Social influence | 0.998 | 0.954 | 0.860 | Yes |
| Composite | Composite Mean Difference (=0) | 95% confidence interval | p-value | Equality of means? |
| Affective image | 0.101 | (−0.275; 0.276) | 0.193 | Yes |
| City brand university | 0.146 | (−0.284; 0.263) | 0.140 | Yes |
| Cognitive image | 0.090 | (−0.273; 0.280) | 0.366 | Yes |
| Cost life | 0.148 | (−0.285; 0.295) | 0.605 | Yes |
| E-wom | 0.141 | (−0.299; 0.292) | 0.382 | Yes |
| Job opportunity | −0.152 | (−0.277; 0.265) | 0.573 | Yes |
| Physical environment | 0.135 | (−0.288; 0.284) | 0.575 | Yes |
| Rankings value | −0.278 | (−0.280; 0.288) | 0.634 | Yes |
| Social influence | 0.141 | (−0.261; 0.281) | 0.907 | Yes |
| Composite | Difference of the logarithm of the variances of the composite (=0) | 95% confidence interval | p-value | Equality of variances? |
| Affective image | −0.151 | (−0.401; 0.356) | 0.444 | Yes |
| City brand university | 0.079 | (−0.411; 0.395) | 0.707 | Yes |
| Cognitive image | −0.084 | (−0.444; 0.393) | 0.695 | Yes |
| Cost life | −0.092 | (−0446; 0.420) | 0.700 | Yes |
| E-wom | 0.051 | (−0.319; 0.289) | 0.762 | Yes |
| Job opportunity | 0.153 | (−0.410; 0.324) | 0.387 | Yes |
| Physical environment | −0.059 | (−0.341; 0.334) | 0.751 | Yes |
| Rankings value | 0.233 | (−0.498; 0.428) | 0.304 | Yes |
| Social influence | −0.029 | (−0.387; 0.308) | 0.869 | Yes |
| Relation | Path Coefficients Original Manizales City | Path Coefficients Original Medellin city | Path Coefficients Original Difference | Path Coefficients Permutation mean Differences | 2.5% | 97.5% | Permutation p-Values |
|---|---|---|---|---|---|---|---|
| Affective image -> City brand university | 0.542 | 0.524 | 0.018 | 0.010 | −0.347 | 0.383 | 0.917 |
| Cognitive image -> City brand university | 0.215 | 0.250 | −0.034 | −0.014 | −0.385 | 0.335 | 0.833 |
| Cost life -> City brand university | 0.013 | 0.043 | −0.030 | −0.001 | −0.294 | 0.310 | 0.847 |
| Cost life -> Cognitive image | −0.067 | 0.238 | −0.305 | 0.009 | −0.447 | 0.480 | 0.196 |
| E-wom -> Affective image | 0.012 * | 0.474 * | −0.462 * | 0.002 | −0.327 | 0.305 | 0.001 |
| E-wom -> City brand university | 0.234 | 0.154 | 0.079 | 0.006 | −0.383 | 0.369 | 0.694 |
| Job opportunity -> City brand university | −0.075 | 0.112 | −0.187 | −0.002 | −0.312 | 0.291 | 0.227 |
| Job opportunity -> Cognitive image | 0.195 | 0.284 | −0.089 | 0.018 | −0.387 | 0.449 | 0.709 |
| Physical environment -> City brand university | −0.141 | 0.023 | −0.164 | −0.010 | −0.382 | 0.341 | 0.394 |
| Physical environment -> Cognitive image | 0.325 | 0.105 | 0.220 | −0.018 | −0.529 | 0.476 | 0.459 |
| Rankings Value -> City brand university | 0.340* | −0.161 * | 0.501 * | 0.010 | −0.414 | 0.406 | 0.014 |
| Rankings Value -> Cognitive image | 0.159 | 0.324 | −0.165 | −0.003 | −0.365 | 0.371 | 0.400 |
| Social influence -> Affective image | 0.362 | 0.358 | 0.003 | −0.004 | −0.360 | 0.359 | 0.991 |
| Social influence -> City brand university | −0.171 | 0.088 | −0.259 | −0.001 | −0.275 | 0.298 | 0.079 |
| Relation | Path Coefficients Original Manizales City | Path Coefficients Original Medellin city | Path Coefficients Original Difference | Path Coefficients Permutation mean Differences | 2.5% | 97.5% | Permutation p-Values |
|---|---|---|---|---|---|---|---|
| Affective image -> City brand university | 0.542 | 0.263 | 0.280 | 0.003 | −0.302 | 0.312 | 0.074 |
| Cognitive image -> City brand university | 0.215 | 0.429 | −0.214 | −0.004 | −0.327 | 0.344 | 0.223 |
| Cost life -> City brand university | 0.013 | −0.156 | 0.169 | 0.006 | −0.292 | 0.294 | 0.284 |
| Cost life -> Cognitive image | −0.067 | −0.012 | −0.055 | −0.001 | −0.435 | 0.447 | 0.836 |
| E-wom -> Affective image | 0.012 | 0.135 | −0.122 | −0.006 | −0.291 | 0.268 | 0.412 |
| E-wom -> City brand university | 0.234 | 0.185 | 0.049 | 0.006 | −0.296 | 0.285 | 0.747 |
| Job opportunity -> City brand university | −0.075 | 0.023 | −0.097 | −0.007 | −0.304 | 0.288 | 0.510 |
| Job opportunity -> Cognitive image | 0.195 | 0.369 | −0.174 | 0.005 | −0.401 | 0.424 | 0.400 |
| Physical environment -> City brand university | −0.141 | 0.063 | −0.204 | −0.007 | −0.362 | 0.345 | 0.263 |
| Physical environment -> Cognitive image | 0.325 | 0.129 | 0.196 | −0.002 | −0.487 | 0.461 | 0.462 |
| Rankings Value -> City brand university | 0.340 | 0.120 | 0.219 | 0.004 | −0.324 | 0.320 | 0.188 |
| Rankings Value -> Cognitive image | 0.159 | 0.239 | −0.081 | −0.009 | −0.357 | 0.354 | 0.664 |
| Social influence -> Affective image | 0.362 | 0.533 | −0.171 | −0.001 | −0.314 | 0.300 | 0.295 |
| Social influence -> City brand university | −0.171 | 0.000 | −0.172 | 0.002 | −0.282 | 0.285 | 0.243 |
| Relation | Path-Difference Coefficients | Original p-Value (1-Tailed) |
|---|---|---|
| Affective image -> City brand university | 0.280 | 1.000 |
| Cognitive image -> City brand university | −0.214 | 1.000 |
| Cost life -> City brand university | 0.169 | 1.000 |
| Cost life -> Cognitive image | −0.055 | 1.000 |
| E-wom -> Affective image | −0.122 | 1.000 |
| E-wom -> City brand university | 0.049 | 1.000 |
| Job opportunity -> City brand university | −0.097 | 1.000 |
| Job opportunity -> Cognitive image | 0.100 | 1.000 |
| Physical environment -> City brand university | −0.204 | 1.000 |
| Physical environment -> Cognitive image | 0.196 | 1.000 |
| Rankings Value -> City brand university | 0.219 | 1.000 |
| Rankings Value -> Cognitive image | −0.081 | 1.000 |
| Social influence -> Affective image | −0.171 | 1.000 |
| Social influence -> City brand university | −0.172 | 1.000 |
| Path-Difference Coefficients | t-Value | p-Value | |
|---|---|---|---|
| Affective image -> City brand university | 0.280 | n/a | 0.500 |
| Age -> City brand university | −0.066 | n/a | 0.500 |
| Cognitive image -> City brand university | −0.214 | n/a | 0.500 |
| Cost life -> City brand university | 0.169 | n/a | 0.500 |
| Cost life -> Cognitive image | −0.055 | n/a | 0.500 |
| E-wom -> Affective image | −0.122 | n/a | 0.500 |
| E-wom -> City brand university | 0.049 | n/a | 0.500 |
| Job opportunity -> City brand university | −0.097 | n/a | 0.500 |
| Job opportunity -> Cognitive image | −0.174 | n/a | 0.500 |
| Level -> City brand university | 0.100 | n/a | 0.500 |
| Physical environment -> City brand university | −0.204 | n/a | 0.500 |
| Physical environment -> Cognitive image | 0.196 | n/a | 0.500 |
| Rankings Value -> City brand university | 0.219 | n/a | 0.500 |
| Rankings Value -> Cognitive image | −0.081 | n/a | 0.500 |
| Social influence -> Affective image | −0.171 | n/a | 0.500 |
| Social influence -> City brand university | −0.172 | n/a | 0.500 |
| Path-Difference Coefficients | t-Value | p-Value | |
|---|---|---|---|
| Affective image -> City brand university | 0.280 | n/a | 0.500 |
| Age -> City brand university | −0.214 | n/a | 0.500 |
| Cognitive image -> City brand university | 0.169 | n/a | 0.500 |
| Cost life -> City brand university | −0.055 | n/a | 0.500 |
| Cost life -> Cognitive image | −0.122 | n/a | 0.500 |
| E-wom -> Affective image | 0.049 | n/a | 0.500 |
| E-wom -> City brand university | −0.097 | n/a | 0.500 |
| Job opportunity -> City brand university | −0.174 | n/a | 0.500 |
| Job opportunity -> Cognitive image | −0.204 | n/a | 0.500 |
| Level -> City brand university | 0.196 | n/a | 0.500 |
| Physical environment -> City brand university | 0.219 | n/a | 0.500 |
| Physical environment -> Cognitive image | −0.081 | n/a | 0.500 |
| Rankings Value -> City brand university | −0.171 | n/a | 0.500 |
| Rankings Value -> Cognitive image | −0.172 | n/a | 0.500 |
| Social influence -> Affective image | 0.280 | n/a | 0.500 |
| Social influence -> City brand university | −0.214 | n/a | 0.500 |
| Relation | Path Coefficients Original Manizales City | Path Coefficients Original Medellin City | Path Coefficients Original Difference | Path Coefficients Permutation Mean Differences | 2.5% | 97.5% | Permutation p-Values |
|---|---|---|---|---|---|---|---|
| Affective image -> City brand university | 0.542 | 0.291 | 0.251 | −0.014 | −0.346 | 0.319 | 0.137 |
| Cognitive image -> City brand university | 0.215 | 0.193 | 0.022 | 0.012 | −0.338 | 0.346 | 0.891 |
| Cost life -> City brand university | 0.013 | −0.038 | 0.051 | 0.013 | −0.230 | 0.266 | 0.717 |
| Cost life -> Cognitive image | −0.067 | 0.078 | −0.145 | −0.002 | −0.420 | 0.366 | 0.479 |
| E-wom -> Affective image | 0.012 | 0.297 | −0.285 | −0.003 | −0.297 | 0.282 | 0.055 |
| E-wom -> City brand university | 0.234 | 0.139 | 0.095 | 0.002 | −0.264 | 0.280 | 0.535 |
| Job opportunity -> City brand university | −0.075 | 0.119 | −0.194 | 0.002 | −0.266 | 0.286 | 0.164 |
| Job opportunity -> Cognitive image | 0.195 | 0.229 | −0.034 | 0.002 | −0.369 | 0.368 | 0.843 |
| Physical environment -> City brand university | −0.141 | −0.064 | −0.077 | −0.010 | −0.318 | 0.287 | 0.625 |
| Physical environment -> Cognitive image | 0.325 | 0.043 | 0.282 | −0.002 | −0.362 | 0.351 | 0.142 |
| Rankings Value -> City brand university | 0.340 | 0.378 | −0.038 | −0.002 | −0.300 | 0.316 | 0.801 |
| Rankings Value -> Cognitive image | 0.159 | 0.262 | −0.103 | 0.007 | −0.334 | 0.312 | 0.546 |
| Social influence -> Affective image | 0.362 | 0.311 | 0.050 | 0.006 | −0.242 | 0.260 | 0.684 |
| Social influence -> City brand university | −0.171 | 0.003 | −0.174 | 0.004 | −0.241 | 0.271 | 0.169 |
| Relation | Path-Difference Coefficients | Original p-Value (1-Tailed) |
|---|---|---|
| Affective image -> City brand university | 0.251 | 0.061 |
| Cognitive image -> City brand university | 0.022 | 0.443 |
| Cost life -> City brand university | 0.051 | 0.372 |
| Cost life -> Cognitive image | −0.145 | 0.741 |
| E-wom -> Affective image | −0.285 | 0.973 |
| E-wom -> City brand university | 0.095 | 0.253 |
| Job opportunity -> City brand university | −0.194 | 0.921 |
| Job opportunity -> Cognitive image | −0.034 | 0.567 |
| Physical environment -> City brand university | −0.077 | 0.662 |
| Physical environment -> Cognitive image | 0.282 | 0.126 |
| Rankings Value -> City brand university | −0.038 | 0.600 |
| Rankings Value -> Cognitive image | −0.103 | 0.729 |
| Social influence -> Affective image | 0.050 | 0.359 |
| Social influence -> City brand university | −0.174 | 0.894 |
| Path-Difference Coefficients | t-Value | p-Value | |
|---|---|---|---|
| Affective image -> City brand university | 0.251 | 1.421 | 0.157 |
| Age -> City brand university | 0.022 | 0.127 | 0.899 |
| Cognitive image -> City brand university | 0.051 | 0.361 | 0.719 |
| Cost life -> City brand university | −0.145 | 0.709 | 0.479 |
| Cost life -> Cognitive image | −0.285 * | 1.986 | 0.048* |
| E-wom -> Affective image | 0.095 | 0.656 | 0.513 |
| E-wom -> City brand university | −0.194 | 1.407 | 0.161 |
| Job opportunity -> City brand university | −0.034 | 0.179 | 0.858 |
| Job opportunity -> Cognitive image | −0.077 | 0.459 | 0.646 |
| Level -> City brand university | 0.282 | 1.282 | 0.201 |
| Physical environment -> City brand university | −0.038 | 0.247 | 0.805 |
| Physical environment -> Cognitive image | −0.103 | 0.618 | 0.537 |
| Rankings Value -> City brand university | 0.050 | 0.345 | 0.730 |
| Rankings Value -> Cognitive image | −0.174 | 1.291 | 0.198 |
| Social influence -> Affective image | 0.251 | 1.421 | 0.157 |
| Social influence -> City brand university | 0.022 | 0.127 | 0.899 |
| Path-Difference Coefficients | t-Value | p-Value | |
|---|---|---|---|
| Affective image -> City brand university | 0.251 | 1.532 | 0.128 |
| Age -> City brand university | 0.022 | 0.135 | 0.893 |
| Cognitive image -> City brand university | 0.051 | 0.346 | 0.730 |
| Cost life -> City brand university | −0.145 | 0.654 | 0.515 |
| Cost life -> Cognitive image | −0.285 | 1.892 | 0.062 |
| E-wom -> Affective image | 0.095 | 0.665 | 0.507 |
| E-wom -> City brand university | −0.194 | 1.418 | 0.159 |
| Job opportunity -> City brand university | −0.034 | 0.176 | 0.860 |
| Job opportunity -> Cognitive image | −0.077 | 0.440 | 0.661 |
| Level -> City brand university | 0.282 | 1.173 | 0.244 |
| Physical environment -> City brand university | −0.038 | 0.245 | 0.807 |
| Physical environment -> Cognitive image | −0.103 | 0.615 | 0.540 |
| Rankings Value -> City brand university | 0.050 | 0.330 | 0.742 |
| Rankings Value -> Cognitive image | −0.174 | 1.231 | 0.221 |
| Social influence -> Affective image | 0.251 | 1.532 | 0.128 |
| Social influence -> City brand university | 0.022 | 0.135 | 0.893 |
References
- Brandt, C.; De Mortanges, C.P. City Branding: A Brand Concept Map Analysis of a University Town. Place Brand. Public Dipl. 2011. [Google Scholar] [CrossRef]
- Zenker, S.; Braun, E.; Petersen, S. Branding the Destination versus the Place: The Effects of Brand Complexity and Identification for Residents and Visitors. Tour Manag. 2017, 58, 15–27. [Google Scholar] [CrossRef]
- Maitland, R. How Can We Manage the Tourist-Historic City? Tourism Strategy in Cambridge, UK, 1978–2003. Tour Manag. 2006, 27, 1262–1273. [Google Scholar] [CrossRef]
- Braun, E.; Kavaratzis, M.; Zenker, S. My City—My Brand: The Role of Residents in Place Branding. In Proceedings of the 50th European Regional Science Association (ERSA) Congress, Jönköping, Sweden, 19–23 August 2010. [Google Scholar]
- Hospers, G.J. A Short Reflection on City Branding and Its Controversies. Tijdschrift voor Economische en Sociale Geografie 2020, 111, 18–23. [Google Scholar] [CrossRef]
- Goovaerts, P.; Van Biesbroeck, H.; Van Tilt, T. Measuring the Effect and Efficiency of City Marketing. Procedia Econ. Financ. 2014, 12, 191–198. [Google Scholar] [CrossRef]
- Oguztimur, S.; Akturan, U. Synthesis of City Branding Literature (1988–2014) as a Research Domain. Int. J. Tour. Res. 2016, 18, 357–372. [Google Scholar] [CrossRef]
- European University Association. Universities without Walls—A Vision for 2030; European University Association: Brussels, Belgium, 2021. [Google Scholar]
- Glasson, J. The Widening Local and Regional Development Impacts of the Modern Universities—A Tale of Two Cities (and North-South Perspectives). Local Econ. 2003, 18, 21–37. [Google Scholar] [CrossRef]
- Popescu, A. Branding Cities as Educational Centres. The Role of Higher Education Institutions. Manag. Şi Mark. (Bucureşti) 2012, 7, 493. [Google Scholar]
- Hospers, G.-J. Creative cities: Breeding places in the knowledge economy. Knowl. Technal. Policy 2003, 16, 143–162. [Google Scholar] [CrossRef]
- Mogaji, E. Types and Location of Nigerian Universities. Res. Agenda Work. Pap. 2019, 1, 92–103. [Google Scholar] [CrossRef]
- Lazzeroni, M.; Piccaluga, A. Beyond ‘Town and Gown’: The Role of the University in Small and Medium-Sized Cities. Ind. High. Educ. 2015, 29, 11–23. [Google Scholar] [CrossRef]
- Lundholt, M.W.; Jørgensen, O.H.; Blichfeldt, B.S. Intra-Organizational Brand Resistance and Counter-Narratives in City Branding—A Comparative Study of Three Danish Cities. Qual. Mark. Res. 2020, 23, 1001–1018. [Google Scholar] [CrossRef]
- Charles, D. The Role of Universities in Building Knowledge Cities in Australia. Built Environ. 2011, 37, 281–298. [Google Scholar] [CrossRef]
- Hospers, G.-J. Governance in innovative cities and the importance of branding. Innov. Manag. Policy Pract. 2008, 10, 224–234. [Google Scholar] [CrossRef]
- Abbas, S.A. Brand Loyalty of Higher Education Institutions. Mark. Manag. Innov. 2019, 1, 46–56. [Google Scholar] [CrossRef]
- Hemsley-Brown, J.; Melewar, T.; Nguyen, B.; Wilson, E.J. Exploring brand identity, meaning, image, and reputation (BIMIR) in higher education: A special section. J. Bus. Res. 2016, 69, 3019–3022. [Google Scholar] [CrossRef]
- Van Noorden, R. Cities: Building the best cities for science. Nature 2010, 467, 906–908. [Google Scholar] [CrossRef]
- Oliva, E.J.D.; Sánchez-Torres, J.A.; Niño, J.S.S. City brand evolution research and future agenda: Bibliometric and science mapping analysis. Heliyon 2022, 8, e10031. [Google Scholar] [CrossRef] [PubMed]
- James-MacEachern, M.; Yun, D. Exploring factors influencing international students’ decision to choose a higher education institution: A comparison between Chinese and other students. Int. J. Educ. Manag. 2017, 31, 343–363. [Google Scholar] [CrossRef]
- Shamsudin, M.F.; Ali, A.M.; Ali, A.M.; Shabi, K.S. Exploratory study of students’ decision for enrolment at universiti kuala lumpur business school campus. Humanit. Soc. Sci. Rev. 2019, 7, 526–530. [Google Scholar] [CrossRef]
- Ananda, T.N.; Rini, E.S.; Karina, B.; Sembiring, F. Determinants of Students ’ Decision to Choose the Faculty of Economics and Business Harapan University, Medan. Int. J. Res. Rev. 2019, 6, 33–45. [Google Scholar]
- Gai, L.; Xu, C.; Pelton, L.E. A netnographic analysis of prospective international students’ decision-making process: Implications for institutional branding of American universities in the emerging markets. J. Mark. High. Educ. 2016, 26, 181–198. [Google Scholar] [CrossRef]
- Kingeski, L.; Nadal, J.O. Brazilian university students in Spain: Motivations and decision factors. Intang. Cap. 2020, 16, 91–106. [Google Scholar] [CrossRef]
- Popov, K. Factors, Affecting Students’ Decision to Enroll in a University. Pedagog. J. Pendidik. 2019, 8, 201–210. [Google Scholar] [CrossRef]
- Williams-Brown, Z.; Rhoades, G.; Smith, M.; Thompson, D. Aspiring to Higher Education? Choice, Complexity and Confidence in Secondary Students’ Decision-Making. Educ. Futures 2019, 10, 31–58. [Google Scholar]
- Hendriana, E.; Awang, K.W.; Yusof, R.N.R. The roles of the country’s cognitive, affective, and personality aspects in international students’ decision-making. J. Mark. High. Educ. 2021, 30, 1–18. [Google Scholar] [CrossRef]
- Sarstedt, M.; Hair, J.F., Jr.; Ringle, C.M. “PLS-SEM: Indeed a silver bullet”—Retrospective observations and recent advances. J. Mark. Theory Pract. 2022, 30, 1–15. [Google Scholar] [CrossRef]
- Hair, J.F.; Risher, J.J.; Sarstedt, M.; Ringle, C.M. When to use and how to report the results of PLS-SEM. Eur. Bus. Rev. 2019, 31, 2–24. [Google Scholar] [CrossRef]
- Henseler, J.; Ringle, C.M.; Sarstedt, M. A new criterion for assessing discriminant validity in variance-based structural equation modeling. J. Acad. Mark. Sci. 2014, 43, 115–135. [Google Scholar] [CrossRef]
- Chin, W.; Cheah, J.-H.; Liu, Y.; Ting, H.; Lim, X.-J.; Cham, T.H. Demystifying the role of causal-predictive modeling using partial least squares structural equation modeling in information systems research. Ind. Manag. Data Syst. 2020, 120, 2161–2209. [Google Scholar] [CrossRef]
- Sarstedt, M.; Ringle, C.M.; Cheah, J.-H.; Ting, H.; Moisescu, O.I.; Radomir, L. Structural model robustness checks in PLS-SEM. Tour. Econ. 2020, 26, 531–554. [Google Scholar] [CrossRef]
- Henseler, J.; Ringle, C.M.; Sarstedt, M. Testing measurement invariance of composites using partial least squares. Int. Mark. Rev. 2016, 33, 405–431. [Google Scholar] [CrossRef]
- Shamsudin, M.F.; Ali, A.M.; Ab Wahid, R.; Saidun, Z. Factors influence undergraduate students’ decision making to enroll and social media application as an external factor. Humanit. Soc. Sci. Rev. 2019, 7, 126–136. [Google Scholar] [CrossRef]
- Fornell, C.; Larcker, D.F. Structural Equation Models with Unobservable Variables and Measurement Error: Algebra and Statistics. J. Mark. Res. 1981, 18, 382–388. [Google Scholar] [CrossRef]


| Construct | Description | Items | Author |
|---|---|---|---|
| Rankings Value | It assesses the national and international educational quality measurement indexes in choosing a city to conduct university studies (including evaluation of universities, academic programs, and degree prestige). | To choose the destination where to carry out my studies: R1. I have considered the reputation of the universities in that place. R2. I had/I have in mind the place that the universities of that place occupy in the international rankings. R3. I have considered the quality standards in the education of the universities of that place. R4. I have considered the prestige that the graduates of the universities of that place have. | [24,25,27,29] |
| Cost of living | It refers to considering all the costs of living and expenses in general for choosing a place of study (including tuition costs, living expenses, food, transportation, leisure, and health, among others). | To choose the destination where to carry out my studies: CL1. I have considered the costs of accommodation. CL2. I have considered the costs of living. CL3. I looked/I look for it to have reasonable costs of living. | [24,25,26,27,28,29] |
| Job opportunity | It refers to considering the favourable opportunities to build a life project in that place after finishing. The career opportunities when choosing a destination for university studies focus on employment and habitat possibilities. | To choose the destination where to carry out my studies: EO1. I had/I am considering the opportunity to stay living there after finishing my studies. EO2. I had/I have in mind to have the opportunity to remain residing in that place permanently. EO3. I have considered the potential for employment there after finishing my studies. | [24,25] |
| Environment and educational facilities | It refers to considering the offer of support and complementary services and activities offered by the said place when choosing a place to conduct university studies. | To choose the destination where to carry out my studies: EE1. I valued/I value that I can study other complementary courses (languages, complementary, postgraduate, among others). EE2. I valued/I value the facilities in educational services. EE3. I valued/I value safe and adequate spaces to carry out my studies (university campuses, libraries, etc.). | [24] |
| Physical environment and leisure facilities | It refers to considering the choice of a place to carry out university studies and the urban and habitat equipment of the place of educational offer (includes urban housing, accessibility, roads, supply of public services, leisure sites, spaces and sports facilities, among others). | To choose the destination where to carry out my studies: PE1. I valued/I value the wide offer and good housing prices to carry out my studies. PE2. I value/I value facilities in habitat services. PE3. I valued safe and adequate urban spaces to live in. | [24,25,26] |
| E-wom | It refers to the information (comments or opinions) on the internet from different digital sources that the student consults about the places of study to decide their destination. | To choose the destination where to carry out my studies: EW1. I valued/I value the comments on social networks about that destination. EW2. I searched/I am looking for opinions and information on the internet about that place EW3. I/I take into account all kinds of information from the internet about a place. | [25,27,29] |
| Social influence | The people close to the student whose opinions are valued in the decision-making process of the place of study. Mainly it has been found that parents and close family influence the decision of choosing where to study, but also groups of friends, people or leaders of influence and students who have already had previous experiences. | To choose the destination where to carry out my studies: YES1. I value/I value the opinions of someone who studies in a place. YES 2. I/I have taken into account the opinion of my parents to study in that place. YES 3. I valued/I value the opinions of close relatives about studying in that place. SI4. I valued/I value the opinions of my teachers about studying in that place. | [24,25] |
| Cognitive image of the country/city | It refers to the perception of the quality of life, the level of technological advances, and the development of a city or country. | Regarding the city of choice as a destination to carry out my studies: CI1. I consider that this city has high levels of quality of life. CI2. I consider this city to have high levels of economic development. CI3. I consider that this city has high levels of technological and industrial development. | [31] |
| Affective image of the country/city | It refers to the feeling measured by love or hate, admiration or rejection, or a positive/negative image of a city or country. | Regarding the city of choice as a destination to carry out my studies: AI1. This city generates a good image for me, and I have good impressions. AI2. This city has a good image, and I have good comments about it. AI3. This city generates an image of a welcoming city for me to carry out my studies. | [31] |
| University City Brand Personality | It refers to the characteristics associated with a university city that represents the name of a city-region-country based on the perceptions and experiences of the institutions and inhabitants of that place. | Regarding the city of choice as a destination to carry out my studies: PC1. I identify this city as ideal for studying because of the name it represents worldwide. PC2. I identify this city as ideal for studying because of the reputation of its most representative institutions. PC3. I identify this city as ideal for studying because of the characteristics of the people who originate from there. PC4. I identify this city as ideal to study because its characteristics are aligned with knowledge. | [31] |
| Construct | Item (Measured with Aggregate Data and Student Interviews) |
|---|---|
| Quality university education | Availability of highly trained teachers |
| Academic achievement of city students | |
| High-quality accreditation coverage | |
| Presence of world-class universities in the city | |
| University environment | Presence of university students in the city |
| Variety of local university offer | |
| tolerance and inclusion | |
| Cultural and recreational offers of the city | |
| Living cost | feed cost |
| housing cost | |
| Transport cost | |
| Price level change | |
| Quality of life | Satisfaction with the city |
| Environment in the city | |
| Mobility in the city | |
| Perception of city safety | |
| Graduate employability | Probability of job attachment |
| Down payment salary | |
| Youth unemployment rate |
| City | Total Value | Quality University Education | University Environment | Living Cost | Quality of Life | Graduate Employability |
|---|---|---|---|---|---|---|
| Manizales | 70.88 | 81.54 | 88.68 | 54.70 | 96.00 | 48.90 |
| Medellín | 66.58 | 85.07 | 78.40 | 23.70 | 66.70 | 72.90 |
| Pereira | 64.54 | 54.63 | 73.30 | 60.40 | 73.10 | 67.30 |
| Barranquilla | 61.55 | 58.48 | 76.48 | 45.5 | 69.30 | 32.40 |
| Bucaramanga | 61.47 | 73.17 | 65.36 | 47.60 | 56.30 | 59.80 |
| Cali | 61.15 | 76.53 | 54.18 | 54.50 | 48.30 | 61.80 |
| Bogotá | 59.18 | 85.66 | 58.39 | 25.20 | 34.20 | 70.50 |
| Ibagué | 52.22 | 51.92 | 56.86 | 70.70 | 71.00 | 26.50 |
| Cartagena | 46.30 | 36.49 | 55.58 | 23.20 | 48.40 | 66.30 |
| Santa Marta | 45.47 | 20.99 | 56.98 | 70.70 | 52.30 | 37.80 |
| Montería | 45.39 | 27.83 | 67.83 | 42.70 | 84.00 | 31.70 |
| Cúcuta | 42.06 | 14.43 | 59.84 | 79.50 | 51.00 | 22.00 |
| Armenia | 37.67 | 29.41 | 47.12 | 41.00 | 56.00 | 28.4 |
| Quibdó | 35.51 | 18.34 | 33.19 | 94.10 | 38.20 | 6.60 |
| City | Sub-Sample | % |
|---|---|---|
| Manizales | 86 | 15% |
| Medellín | 74 | 12% |
| Pereira | 79 | 13% |
| Barranquilla | 70 | 12% |
| Bucaramanga | 72 | 13% |
| Cali | 79 | 14% |
| Bogotá | 125 | 21% |
| Total sample | 585 | 100% |
| Item | Loads * | t-Statistic | p Values | VIF Values | Construct | Cronbach’s Alpha | rho_A | Composite Reliability (IFC) | Average Variance Extracted (AVE) |
|---|---|---|---|---|---|---|---|---|---|
| AI1 | 0.937 | 106.795 | 0.000 | 3.001 | Affective image | 0.928 | 0.928 | 0.955 | 0.875 |
| AI2 | 0.947 | 137.003 | 0.000 | 2.512 | |||||
| AI3 | 0.921 | 97.036 | 0.000 | 2.904 | |||||
| CI1 | 0.859 | 56.341 | 0.000 | 1.963 | Cognitive image | 0.880 | 0.880 | 0.926 | 0.807 |
| CI2 | 0.932 | 108.396 | 0.000 | 3.001 | |||||
| CI3 | 0.902 | 76.364 | 0.000 | 3.030 | |||||
| CL1 | 0.904 | 57.861 | 0.000 | 2.805 | Cost life | 0.903 | 0.906 | 0.939 | 0.838 |
| CL2 | 0.936 | 84.423 | 0.000 | 2.515 | |||||
| CL3 | 0.904 | 52.538 | 0.000 | 2.672 | |||||
| CP1 | 0.895 | 81.457 | 0.000 | 2.373 | City brand university | 0.897 | 0.897 | 0.936 | 0.829 |
| CP2 | 0.917 | 90.514 | 0.000 | 3.005 | |||||
| CP3 | 0.918 | 98.705 | 0.000 | 3.002 | |||||
| JO1 | 0.896 | 60.673 | 0.000 | 2.991 | Job opportunity | 0.859 | 0.860 | 0.914 | 0.781 |
| JO2 | 0.907 | 69.509 | 0.000 | 2.808 | |||||
| JO3 | 0.845 | 45.607 | 0.000 | 1.676 | |||||
| EW1 | 0.869 | 55.754 | 0.000 | 1.876 | E-wom | 0.862 | 0.865 | 0.916 | 0.784 |
| EW2 | 0.891 | 54.234 | 0.000 | 2.562 | |||||
| EW3 | 0.895 | 63.892 | 0.000 | 2.508 | |||||
| PE1 | 0.880 | 49.032 | 0.000 | 2.541 | Physical environment | 0.900 | 0.913 | 0.937 | 0.832 |
| PE2 | 0.936 | 107.279 | 0.000 | 3.003 | |||||
| PE3 | 0.919 | 103.068 | 0.000 | 2.816 | |||||
| RV1 | 0.841 | 40.837 | 0.000 | 1.980 | Rankings Value | 0.846 | 0.866 | 0.896 | 0.783 |
| RV2 | 0.738 | 22.579 | 0.000 | 1.598 | |||||
| RV3 | 0.889 | 68.361 | 0.000 | 2.397 | |||||
| RV4 | 0.828 | 35.368 | 0.000 | 1.891 | |||||
| SI1 | 0.822 | 27.781 | 0.000 | 1.287 | Social influence | 0.730 | 0.764 | 0.842 | 0.740 |
| SI2 | 0.727 | 15.591 | 0.000 | 1.590 | |||||
| SI3 | 0.842 | 34.976 | 0.000 | 1.769 |
| Affective image | 0.935 | ||||||||
| City brand university | 0.714 | 0.910 | |||||||
| Cognitive image | 0.744 | 0.701 | 0.898 | ||||||
| Cost life | 0.291 | 0.303 | 0.322 | 0.915 | |||||
| E-wom | 0.346 | 0.453 | 0.394 | 0.326 | 0.885 | ||||
| Job opportunity | 0.389 | 0.423 | 0.477 | 0.380 | 0.345 | 0.884 | |||
| Physical environment | 0.398 | 0.421 | 0.433 | 0.499 | 0.575 | 0.565 | 0.912 | ||
| Rankings Value | 0.314 | 0.478 | 0.406 | 0.352 | 0.412 | 0.389 | 0.380 | 0.827 | |
| Social influence | 0.428 | 0.385 | 0.425 | 0.349 | 0.383 | 0.348 | 0.402 | 0.435 | 0.800 |
| Affective image | - | |||||||
| City brand university | 0.781 | |||||||
| Cognitive image | 0.723 | 0.788 | ||||||
| Cost life | 0.318 | 0.336 | 0.361 | |||||
| E-wom | 0.384 | 0.514 | 0.451 | 0.366 | ||||
| Job opportunity | 0.437 | 0.480 | 0.546 | 0.429 | 0.395 | |||
| Physical environment | 0.431 | 0.464 | 0.482 | 0.552 | 0.646 | 0.640 | ||
| Rankings Value | 0.346 | 0.541 | 0.460 | 0.391 | 0.484 | 0.444 | 0.426 | |
| Social influence | 0.496 | 0.450 | 0.510 | 0.428 | 0.470 | 0.421 | 0.479 | 0.518 |
| Construct | ||
|---|---|---|
| Affective image | 0.222 | 0.219 |
| City brand university | 0.632 | 0.625 |
| Cognitive image | 0.310 | 0.304 |
| Hypothesis | Validity | Original Sample (β) | t-Statistic | p Values |
|---|---|---|---|---|
| H1a: Rankings Value -> Cognitive image | Supported | 0.214 * | 4.258 | 0.000 |
| H1b: Rankings Value -> City brand university | Supported | 0.200 * | 3.984 | 0.000 |
| H2a: Cost life -> Cognitive image | Not supported | 0.058 | 0.976 | 0.329 |
| H2b: Cost life -> City brand university | Not supported | −0.015 | 0.347 | 0.729 |
| H3a: Job opportunity -> Cognitive image | Supported | 0.278 * | 5.020 | 0.000 |
| H3b: Job opportunity -> City brand university | Not supported | 0.040 | 0.952 | 0.341 |
| H4a: Physical environment -> Cognitive image | Supported | 0.166 * | 2.781 | 0.005 |
| H4b: Physical environment -> City brand university | Not supported | −0.010 | 0.190 | 0.850 |
| H5: Cognitive image -> City brand university | Supported | 0.269 * | 4.199 | 0.000 |
| H6a: Social influence -> Affective image | Supported | 0.346 * | 7.437 | 0.000 |
| H6b: Social influence -> City brand university | Not supported | −0.056 | 1.390 | 0.165 |
| H7a: E-wom -> Affective image | Supported | 0.214 * | 4.654 | 0.000 |
| H7b: E-wom -> City brand university | Supported | 0.137 * | 3.122 | 0.002 |
| H8: Affective image -> City brand university | Supported | 0.424 * | 6.508 | 0.000 |
| Construct | Affective Image | City Brand University | Cognitive Image |
|---|---|---|---|
| Affective image | 2.368 | ||
| Cognitive image | 2.635 | ||
| Cost life | 1.444 | 1.402 | |
| E-wom | 1.171 | 1.658 | |
| Job opportunity | 1.700 | 1.564 | |
| Physical environment | 2.207 | 1.737 | |
| Rankings value | 1.501 | 1.273 | |
| Social influence | 1.171 | 1.511 |
| Specific Indirect Effects | Value |
|---|---|
| E-wom -> Affective image -> City brand university | 0.091 |
| Social influence -> Affective image -> City brand university | 0.147 |
| Cost life -> Cognitive image -> City brand university | 0.016 |
| Job opportunity -> Cognitive image -> City brand university | 0.075 |
| Physical environment -> Cognitive image -> City brand university | 0.044 |
| Rankings Value -> Cognitive image -> City brand university | 0.057 |
| Construct | Affective Image | City Brand University | Cognitive Image |
|---|---|---|---|
| Affective image | 0.424 | ||
| Cognitive image | 0.269 | ||
| Cost life | 0.001 | 0.058 | |
| E-wom | 0.214 | 0.228 | |
| Job opportunity | 0.114 | 0.278 | |
| Physical environment | 0.035 | 0.166 | |
| Rankings value | 0.258 | 0.214 | |
| Social influence | 0.346 | 0.090 |
Disclaimer/Publisher’s Note: The statements, opinions and data contained in all publications are solely those of the individual author(s) and contributor(s) and not of MDPI and/or the editor(s). MDPI and/or the editor(s) disclaim responsibility for any injury to people or property resulting from any ideas, methods, instructions or products referred to in the content. |
© 2023 by the authors. Licensee MDPI, Basel, Switzerland. This article is an open access article distributed under the terms and conditions of the Creative Commons Attribution (CC BY) license (https://creativecommons.org/licenses/by/4.0/).
Share and Cite
Duque Oliva, E.J.; Sánchez-Torres, J.A. Building a University City Brand: Colombian University Students’ Perceptions. Sustainability 2023, 15, 6463. https://doi.org/10.3390/su15086463
Duque Oliva EJ, Sánchez-Torres JA. Building a University City Brand: Colombian University Students’ Perceptions. Sustainability. 2023; 15(8):6463. https://doi.org/10.3390/su15086463
Chicago/Turabian StyleDuque Oliva, Edison Jair, and Javier A. Sánchez-Torres. 2023. "Building a University City Brand: Colombian University Students’ Perceptions" Sustainability 15, no. 8: 6463. https://doi.org/10.3390/su15086463
APA StyleDuque Oliva, E. J., & Sánchez-Torres, J. A. (2023). Building a University City Brand: Colombian University Students’ Perceptions. Sustainability, 15(8), 6463. https://doi.org/10.3390/su15086463